operating budget data -...
TRANSCRIPT

J00I00
Maryland Aviation Administration Maryland Department of Transportation
Note: Numbers may not sum to total due to rounding. For further information contact: Matthew J. Mickler Phone: (410) 946-5530
Analysis of the FY 2019 Maryland Executive Budget, 2018 1
Operating Budget Data
($ in Thousands)
Fiscal 2017 Fiscal 2018 Fiscal 2019
Fiscal
2018-2019 % Change
Actual Working Allowance Change Prior Year
Special Fund $187,320 $193,693 $200,678 $6,984 3.6%
Adjustments 0 -596 225 821
Adjusted Special Fund $187,320 $193,098 $200,903 $7,805 4.0%
Federal Fund 646 646 646 0
Adjustments 0 0 0 0
Adjusted Federal Fund $646 $646 $646 $0 0.0%
Adjusted Grand Total $187,965 $193,743 $201,549 $7,805 4.0%
Note: Fiscal 2018 Working includes targeted reversions, deficiencies, and across-the-board reductions. Fiscal 2019 Allowance
includes contingent reductions and cost-of-living adjustments.
The fiscal 2019 allowance increases by approximately $7.8 million in special funds, primarily due
to increased costs associated with the rebid and award of several service contracts.
Personnel costs increase by approximately $1.6 million in special funds, primarily due to overtime
payments and the effect of an across-the-board reduction to health insurance funds in fiscal 2018.
Without factoring in the effects of adding a new position to the operating program (net-zero
increase to the Maryland Aviation Administration (MAA) personnel), personnel costs increase by
approximately $1.5 million.

J00I00 – MDOT – Maryland Aviation Administration
Analysis of the FY 2019 Maryland Executive Budget, 2018 2
PAYGO Capital Budget Data
($ in Thousands)
Fiscal 2017 Fiscal 2018 Fiscal 2019
Actual Legislative Working Allowance
Special $122,284 $101,066 $112,165 $50,605
Federal $5,221 $5,517 $11,497 $10,228
Subtotal $127,505 $106,583 $123,662 $60,833
Other funds $41,838 $17,800 $34,300 $56,300
Total $169,343 $124,338 $157,962 $117,133
Note: Fiscal 2018 legislative appropriation “Other funds” taken from the Consolidated Transportation Program (CTP) for
fiscal 2017-2022. This figure best approximates projected values for fiscal 2018 known at the time of the fiscal 2018 allowance.
Working appropriation and allowance figures for fiscal 2018 and 2019, respectively, taken from the fiscal 2018-2023 CTP.
The fiscal 2018 pay-as-you-go (PAYGO) working appropriation (excluding nonbudgeted funds)
increases by approximately $17.1 million, primarily due to the introduction of several new projects
during the fiscal year. This increase was offset by redirecting funding from other projects.
The fiscal 2019 PAYGO allowance (excluding nonbudgeted funds) is approximately $62.8 million
less than the working appropriation, primarily due to completion of several projects in fiscal 2018.

J00I00 – MDOT – Maryland Aviation Administration
Analysis of the FY 2019 Maryland Executive Budget, 2018 3
Operating and PAYGO Personnel Data
Fiscal 17 Fiscal 18 Fiscal 19 Fiscal 18-19
Actual Working Allowance Change
Regular Operating Budget Positions
447.50
447.50
448.50
1.00
Regular PAYGO Budget Positions
49.00 47.00 46.00 -1.00
Total Regular Positions 496.50 494.50 494.50 0.00
Operating Budget FTEs 0.50 0.50 0.50 0.00
PAYGO Budget FTEs 0.00 0.00 0.00 0.00
Total FTEs 0.50 0.50 0.50 0.00
Total Personnel 497.00 495.00 495.00 0.00
Vacancy Data: Regular Positions
Turnover and Necessary Vacancies, Excluding New
Positions 29.61 6.00%
Positions and Percentage Vacant as of 1/1/2018 35.50 7.18%
MAA staffing remains level with the fiscal 2018 working appropriation. An internal transfer
resulted in an increase in regular operating budget positions by 1.0 position and an equivalent
decrease in regular PAYGO budget positions. The vacant PAYGO budget position was used to
staff the Office of Organizational Development within the operating program.
The budgeted turnover rate in fiscal 2018 is 6.0%, requiring 29.61 vacancies. As of
January 1, 2018, the department had 35.5 vacant positions, for a turnover rate of 7.18%.

J00I00 – MDOT – Maryland Aviation Administration
Analysis of the FY 2019 Maryland Executive Budget, 2018 4
Analysis in Brief
Major Trends
Total Passengers Increase: Passenger traffic at the Baltimore-Washington International Thurgood
Marshall Airport (BWI Marshall Airport) was approximately 25.9 million passengers in calendar 2017,
a 3.3% increase over calendar 2016. Since calendar 2005, BWI Marshall Airport has seen a general
trend toward passenger growth. Southwest Airlines remains the dominant airline at BWI Marshall
Airport, with both Delta and Spirit representing approximately 7.0% each of the remaining market.
Passenger Market Share Grows: BWI Marshall Airport increased its annual passenger market share
in calendar 2017, relative to the Ronald Reagan Washington National Airport and the Washington
Dulles International Airport. At 36.1%, BWI Marshall Airport’s market share is at its highest since at
least calendar 2005. In November 2017, the BWI Marshall Airport share of mail and freight air
transport grew by 5.0% and 10.0%, respectively, relative to November 2016.
Cost and Nonairline Revenue Per Enplaned Passenger Decline: BWI Marshall Airport’s cost per
enplaned passenger (CPE) decreased to $9.34 per passenger. The CPE at BWI Marshall Airport
remains well below the average of other regional airports.
Financial Results: In fiscal 2019, MAA revenues are expected to increase from fiscal 2018 levels by
0.7%. Operating expenditures increase by 4.0%, leading to a decline in net operating income of 12.2%
in fiscal 2019.
Issues
Aircraft Noise Continues to Plague Residents: Following the implementation of the Federal Aviation
Administration’s (FAA) Next Generation Air Transportation System (NextGen) changes to flight paths
in the DC Metroplex, residents in Maryland counties surrounding BWI Marshall Airport have
complained of increased aircraft noise and low-flying aircraft. Efforts to return to the pre-NextGen
flightpaths have not been successful, and some groups have decided to take legal action against FAA,
with one known successful case to date. In its own capacity, MAA continues to monitor aircraft noise
in the area surrounding BWI Marshall Airport and is in the process of replacing noise monitoring
equipment. The Department of Legislative Services (DLS) recommends that MAA should
comment on the replacement project, with emphasis on how the new systems may increase the
fidelity of sound mapping and reporting. Further, MAA should comment generally on the
difficulties of sound mapping and reporting at BWI Marshall Airport. In addition, MAA has
recently taken steps to reinstate the Residential Sound Insulation Program (RSIP) for eligible residents
surrounding BWI Marshall Airport. DLS recommends that MAA should comment on the eligibility
requirements to participate in the RSIP and the potential fiscal impact on the Transportation
Trust Fund. Further, MAA should comment on the number of pre-NextGen implementation
requests to participate versus the number of requests for relief following the implementation of
NextGen. Finally, MAA should comment on the location of the highest density clusters of

J00I00 – MDOT – Maryland Aviation Administration
Analysis of the FY 2019 Maryland Executive Budget, 2018 5
complaints following the implementation of NextGen and the location of these clusters relative to
the Noise Exposure Map.
On-site Hotel Replacement Plan Still Up in the Air: BWI Marshall Airport has been without an
on-site hotel since the closure of the Four Points by Sheraton BWI Marshall Airport in November 2013.
Since that time, the original hotel was demolished to make space for parking, and a Request for
Proposals did not receive any bids. MAA is now investigating the possibility of an in-terminal hotel to
better serve customers at BWI Marshall Airport. DLS recommends that MAA should comment on
the status of the hotel project and the proposed project revisions. Further, MAA should comment
on the need for an in-terminal hotel considering that many hotel facilities are within a short
distance of BWI Marshall Airport.
Operating Budget Recommended Actions
1. Concur with Governor’s allowance.
PAYGO Budget Recommended Actions
1. Concur with Governor’s allowance.

J00I00 – MDOT – Maryland Aviation Administration
Analysis of the FY 2019 Maryland Executive Budget, 2018 6

J00I00
Maryland Aviation Administration Maryland Department of Transportation
Analysis of the FY 2019 Maryland Executive Budget, 2018 7
Budget Analysis
Program Description
The Maryland Aviation Administration (MAA) has responsibility for fostering, developing, and
regulating aviation activity throughout the State. MAA is responsible for the operation, maintenance,
protection, and development of both the State-owned Baltimore-Washington International Thurgood
Marshall Airport (BWI Marshall Airport) – a major center of commercial air carrier service in the State
– and the Martin State Airport (MTN) – a general aviation reliever facility, as well as a support facility
for the Maryland Air National Guard and the Maryland State Police. MAA has identified the following
key goals:
keeping BWI Marshall Airport passengers, tenants, and facilities safe;
operating BWI Marshall Airport efficiently and effectively;
attracting, maintaining, and expanding air service; and
providing exceptional service.
Performance Analysis: Managing for Results
1. Total Passengers Increase
Passenger traffic at BWI Marshall Airport was approximately 25.9 million passengers in
calendar 2017, an increase of 3.3% from calendar 2016. As shown in Exhibit 1, over the last 12 years,
annual passenger traffic has increased from 19.7 million passengers in calendar 2005 to an anticipated
26.5 million in calendar 2018. Since calendar 2005, BWI Marshall Airport has seen a general trend
toward passenger growth, despite total passenger decreases relative to the previous year in
calendar 2008, 2013, and 2014. The United States faced a housing market crash in 2008, and the 2013
and 2014 declines are largely attributable to the impact of the federal budget shutdown, sequestration,
and the weak economy. It appears that the decline has halted, with strong passenger growth expected
through calendar 2019. In fact, until disrupted by two hurricanes that impacted travel in
September 2017, BWI Marshall Airport recorded 26 consecutive months of record passenger growth,
when compared to passenger totals for the same month in prior years. BWI Marshall Airport
experienced record-setting passenger growth in October and November 2017, with 6.5% and 7.1%
growth over October and November of previous years, suggesting that the September disruption was,
in fact, due to the hurricanes.

J00I00 – MDOT – Maryland Aviation Administration
Analysis of the FY 2019 Maryland Executive Budget, 2018 8
Exhibit 1
Total Passengers at the Baltimore-Washington International Thurgood Marshall
Airport Calendar 2005-2019 (Est.)
Source: Maryland Aviation Administration
Southwest Airlines remains the dominant airline at BWI Marshall Airport. For the 12-month
period ending in November 2017, Southwest Airlines’ share of passengers at BWI Marshall Airport
was roughly 69%. The next largest carrier is Delta with approximately 8% of passengers at the airport.
Spirit also commands a significant portion of the market share at BWI Marshall Airport –
approximately 7% – and has surpassed Delta as the second largest carrier at the airport at times during
2017. Spirit also began service to Cancun, adding to the international travel options out of
BWI Marshall Airport and in part leading to a 2% increase in international travelers over
November 2016.
2. Passenger Market Share Grows
In order for BWI Marshall Airport to experience growth in business and continue to be an
economic engine for the State, it must remain competitive with other airports both nationally and
internationally. The Baltimore-Washington region features three proximate airports that compete for
local market share for commercial passengers, commercial air operations, freight, and mail transport –
BWI Marshall Airport, Washington Dulles International Airport (Dulles International Airport) and
Ronald Reagan Washington National Airport (Reagan National Airport).
0
5,000,000
10,000,000
15,000,000
20,000,000
25,000,000
30,000,000
2005 2006 2007 2008 2009 2010 2011 2012 2013 2014 2015 2016 2017 2018
Est.
2019
Est.

J00I00 – MDOT – Maryland Aviation Administration
Analysis of the FY 2019 Maryland Executive Budget, 2018 9
As shown in Exhibit 2, BWI Marshall Airport increased its passenger market share in
calendar 2017 relative to Reagan National Airport and Dulles International Airport. At 36.1%,
BWI Marshall Airport’s market share is at its highest since at least calendar 2005.
Exhibit 2
Passenger Market Share Calendar 2006-2017
BWI Marshall Airport: Baltimore-Washington International Thurgood Marshall Airport
Dulles International Airport: Washington Dulles International Airport
Reagan National Airport: Ronald Reagan Washington National Airport
Source: Maryland Aviation Administration
Commercial Passenger Air Operations at BWI Marshall Airport outpaced operations at
Dulles International Airport and Reagan National Airport in November 2017; BWI Marshall Airport
captured 37.6% of this market, up approximately 1.0% over November 2016, while the market shares
attributable to Dulles International Airport and Reagan National Airport fell relative to the prior year.
BWI Marshall Airport lags behind Dulles International Airport in terms of the market shares for mail
and freight transport that BWI Marshall Airport captured in November 2017. BWI Marshall Airport
captured 26.5% of the mail transport market and 39.7% of the freight transport market in 2017,
compared to 70.3% and 59.9% for Dulles International Airport, respectively. However, while the mail
and freight transport market share at Dulles International Airport fell in November 2017 relative to
0%
10%
20%
30%
40%
50%
60%
70%
80%
90%
100%
2006 2007 2008 2009 2010 2011 2012 2013 2014 2015 2016 2017
BWI Marshall Airport Reagan National Airport Dulles International Airport

J00I00 – MDOT – Maryland Aviation Administration
Analysis of the FY 2019 Maryland Executive Budget, 2018 10
November 2016 levels, BWI Marshall Airport’s mail and freight market share grew relative to
November 2016 by roughly 5.0% for mail and 10.0% for freight. A similar trend was seen in
October 2017 when compared to October 2016. The increase in freight transport is attributable to the
High Flyer freight agreement at BWI Marshall Airport. Reagan National Airport commands a
negligible percentage of the local market for the mail and freight components of Commercial Air
Operations.
3. Cost and Nonairline Revenue Per Enplaned Passenger Decline
Two important financial calculations considered in regard to airports are the cost per enplaned
passenger (CPE) and the nonairline revenue per enplaned passenger. Nonairline revenue includes
parking, concessions, rental cars, and other revenue sources. In regard to the CPE, part of
BWI Marshall Airport’s success has been its ability to maintain low CPE rates, which attracts and
retains low-cost carriers such as Southwest Airlines. At BWI Marshall Airport, like all airports,
operating costs are passed on to airlines through building rent, landing fees, and other user charges.
Therefore, both MAA and the airlines have an interest in keeping operating costs as low as possible.
As shown in Exhibit 3, BWI Marshall Airport’s CPE decreased to $9.34 per passenger, while
nonairline revenue decreased to $9.71 per passenger. Costs at BWI Marshall Airport remain well below
the averages for other regional airports – Reagan National Airport, Dulles International Airport, and
Philadelphia International Airport. These lower costs per passenger make BWI Marshall Airport an
attractive airport for airlines.
Exhibit 3
Cost and Nonairline Revenue Per Enplaned Passenger Fiscal 2012-2019 (Est.)
2012 2013 2014 2015 2016 2017
Est.
2018
Est.
2019
Cost Per Enplaned Passenger
BWI Marshall Airport $9.29 $9.50 $9.82 $9.86 $9.51 $9.34 $9.27 $9.09
Regional Airports Average 15.91 17.38 16.86 16.93 16.10 18.04 18.02 18.03
BWI Marshall Airport: Baltimore-Washington International Thurgood Marshall Airport
Source: Maryland Aviation Administration

J00I00 – MDOT – Maryland Aviation Administration
Analysis of the FY 2019 Maryland Executive Budget, 2018 11
4. Financial Results
Unlike most other State agencies that rely solely on the State for financial support, MAA
receives operating revenues that help offset its expenditures. Its profitability determines how much the
Transportation Trust Fund (TTF) must provide as a subsidy. Although MAA revenues have typically
covered its operating expenses, MAA relies on the TTF or other non-MAA financing mechanisms to
fund its capital program.
Exhibit 4 shows MAA special fund revenues and expenditures. Projections suggest that
fiscal 2019 revenues will increase by 0.7% over fiscal 2018 levels. Operating expenditures increase by
4.0% relative to fiscal 2018, leading to a projected decline in net operating income of 12.2% in
fiscal 2019.
Exhibit 4
Special Fund Revenues and Expenditures Fiscal 2017-2019 (Est.)
($ in Thousands)
2017
Working
Appropriation Allowance $ Change % Change
2018 2019 2018-2019 2018-2019
Operating Revenues Flight Activities $66,054 $69,779 $69,162 -$617 -0.9%
Rent and User Fees 68,787 70,646 71,456 810 1.1%
Concessions 86,825 88,502 91,797 3,295 3.7%
Other Revenues 12,244 5,669 3,801 -1,868 -33.0%
Martin State Airport 9,222 8,571 8,651 $80 0.9%
Revenues Subtotal $243,132 $243,167 $244,867 $1,700 0.7%
Operating Expenditures(1) $187,320 $193,098 $200,903 $7,805 4.0%
Net Operating Income $55,812 $50,069 $43,964 -$6,105 -12.2%
Capital Expenditures(1) $122,284 $112,165 $50,605 -$61,560 -54.9%
Net Income/Loss -$66,472 -$62,096 -$6,641 $55,455 -89.3%
(1) Includes special funds only.
Source: Maryland Aviation Administration
MAA capital expenditures are projected to decrease by approximately 55% in fiscal 2019. As
such, the fiscal 2019 net operating income contribution to the TTF is projected to offset a significant
portion of the TTF subsidy for capital expenditures in fiscal 2019 – approximately 87%. It is important

J00I00 – MDOT – Maryland Aviation Administration
Analysis of the FY 2019 Maryland Executive Budget, 2018 12
to note that in looking at MAA capital expenditures in a business manner, consideration should be
given to the fact that capital expenditures are often paid for in a single year, or over multiple years,
which decreases TTF expenditures for other purposes. Reimbursement from the airlines (through the
Use and Lease Agreement) actually takes place between 5 to 20 years, meaning that revenues and
capital expenditures may not match in a year-to-year comparison.
Fiscal 2018 Actions
Across-the-board Employee and Retiree Health Insurance Reduction
The budget bill includes an across-the-board reduction for employee and retiree health
insurance in fiscal 2018 to reflect a surplus balance in the fund. This agency’s share of this reduction
is $595,791 in special funds.
Proposed Budget
As shown in Exhibit 5, the fiscal 2019 allowance increases by approximately $7.8 million in
special funds. Federal funds remain unchanged since fiscal 2017.
Exhibit 5
Proposed Budget MDOT – Maryland Aviation Administration
($ in Thousands)
How Much It Grows:
Special
Fund
Federal
Fund
Total
Fiscal 2017 Actual $187,320 $646 $187,965
Fiscal 2018 Working Appropriation 193,098 646 193,743
Fiscal 2019 Allowance 200,903 646 201,549
Fiscal 2018-2019 Amount Change $7,805 $0 $7,805
Fiscal 2018-2019 Percent Change 4.0% 4.0%
Where It Goes:
Personnel Expenses
New positions ....................................................................................................................... $71
Employee and retiree health insurance ................................................................................. 596
Employee retirement system and pensions ........................................................................... 62
BWI Marshall Airport Fire and Rescue Division overtime .................................................. 711
2% cost-of-living adjustment to State employees – MAA share .......................................... 225
Other fringe benefit adjustments ........................................................................................... -46
J00I00 – MDOT – Maryland Aviation Administration
Analysis of the FY 2019 Maryland Executive Budget, 2018 13
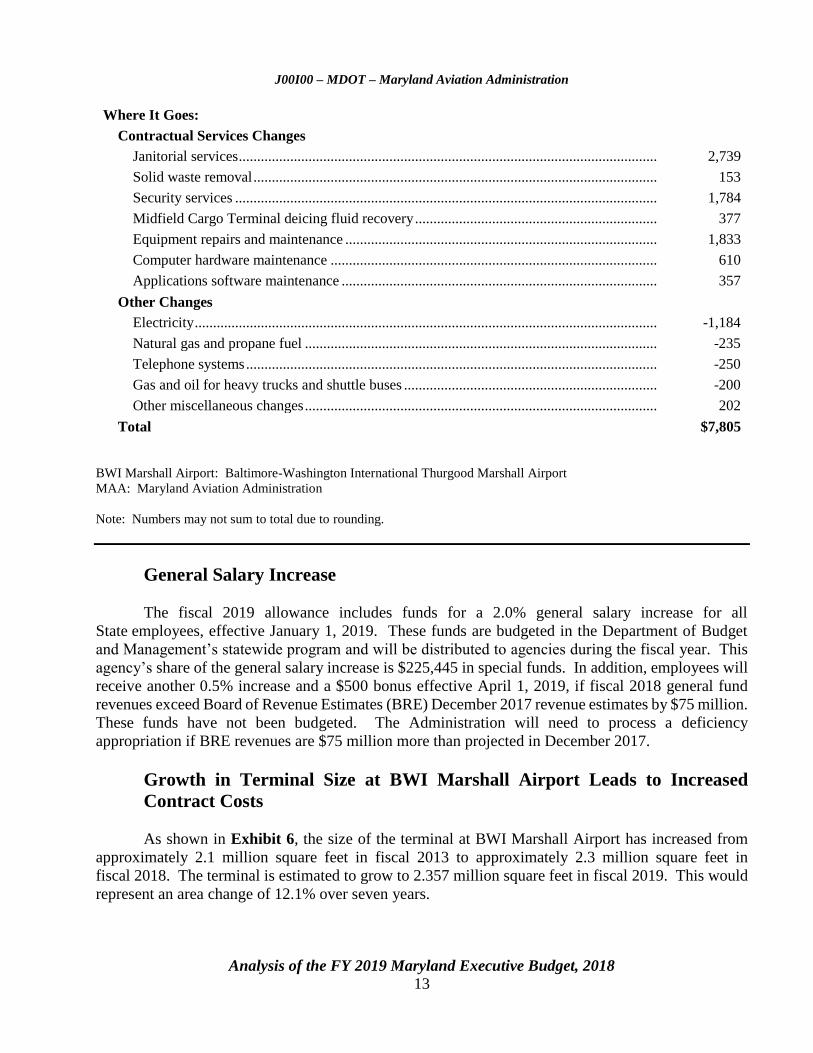
Where It Goes:
Contractual Services Changes
Janitorial services .................................................................................................................. 2,739
Solid waste removal .............................................................................................................. 153
Security services ................................................................................................................... 1,784
Midfield Cargo Terminal deicing fluid recovery .................................................................. 377
Equipment repairs and maintenance ..................................................................................... 1,833
Computer hardware maintenance ......................................................................................... 610
Applications software maintenance ...................................................................................... 357
Other Changes
Electricity .............................................................................................................................. -1,184
Natural gas and propane fuel ................................................................................................ -235
Telephone systems ................................................................................................................ -250
Gas and oil for heavy trucks and shuttle buses ..................................................................... -200
Other miscellaneous changes ................................................................................................ 202
Total $7,805
BWI Marshall Airport: Baltimore-Washington International Thurgood Marshall Airport
MAA: Maryland Aviation Administration
Note: Numbers may not sum to total due to rounding.
General Salary Increase
The fiscal 2019 allowance includes funds for a 2.0% general salary increase for all
State employees, effective January 1, 2019. These funds are budgeted in the Department of Budget
and Management’s statewide program and will be distributed to agencies during the fiscal year. This
agency’s share of the general salary increase is $225,445 in special funds. In addition, employees will
receive another 0.5% increase and a $500 bonus effective April 1, 2019, if fiscal 2018 general fund
revenues exceed Board of Revenue Estimates (BRE) December 2017 revenue estimates by $75 million.
These funds have not been budgeted. The Administration will need to process a deficiency
appropriation if BRE revenues are $75 million more than projected in December 2017.
Growth in Terminal Size at BWI Marshall Airport Leads to Increased
Contract Costs
As shown in Exhibit 6, the size of the terminal at BWI Marshall Airport has increased from
approximately 2.1 million square feet in fiscal 2013 to approximately 2.3 million square feet in
fiscal 2018. The terminal is estimated to grow to 2.357 million square feet in fiscal 2019. This would
represent an area change of 12.1% over seven years.

J00I00 – MDOT – Maryland Aviation Administration
Analysis of the FY 2019 Maryland Executive Budget, 2018 14
Exhibit 6
BWI Marshall Airport Terminal Square Footage Fiscal 2013-2019 (Est.)
(Square Feet in Thousands)
BWI Marshall Airport: Baltimore-Washington International Thurgood Marshall Airport
Source: Maryland Aviation Administration
With the increase in square footage, costs for several services at BWI Marshall Airport have
significantly increased, including janitorial services (approximately $2.7 million); the solid waste
removal and recycling and septic services contracts (approximately $0.2 million); the heating,
ventilation, and air conditioning and building systems maintenance contract ($0.5 million); and the new
combined elevator, escalator, and moving walkway maintenance and repair contract (approximately
$1.0 million). With expansions to the terminal and the addition of new capital assets needed to manage
expected passenger growth, greater resources will be needed to manage the terminal building.
Additionally, a portion of this increase reflects changes in various service industries since the outgoing
contract was awarded. For example, changes to the minimum wage account for a portion of the
increased costs of the new janitorial services contract. The Department of Legislative Services (DLS)
recommends that MAA should comment on its ability to manage costs associated with passenger
and terminal growth in fiscal 2019 and the out-years.
2,103
2,144 2,144
2,299 2,299 2,299
2,357
1,950
2,000
2,050
2,100
2,150
2,200
2,250
2,300
2,350
2,400
2013 2014 2015 2016 2017 2018 2019 (Est.)

J00I00 – MDOT – Maryland Aviation Administration
Analysis of the FY 2019 Maryland Executive Budget, 2018 15
Overtime Costs at the Baltimore-Washington International Thurgood
Marshall Airport Fire & Rescue Department Remain High
Approximately $0.7 million in personnel changes are required to cover the difference between
estimated and historic annual overtime expenditures paid to the members of the Baltimore-Washington
International Thurgood Marshall Airport Fire & Rescue Department (BWI FRD). Appropriated funds
for this purpose have remained level, while average overtime expenditures paid to BWI FRD have
increased to approximately $1.2 million annually. The total increase in the allowance for fiscal 2019
reflects the required funds to bring the BWI FRD overtime appropriation in line with this average.
Historically, BWI FRD has incurred overtime costs due to turnover coupled with delays in
filling positions. After interviews and preliminary physical testing, candidates must attend a regional
Fire Academy, which takes in excess of four months to complete. Attendance must be coordinated
with the start of new classes at Fire Academies in surrounding counties. Additionally, due to the cost
and time to bring onboard new firefighters, BWI FRD recruits in groups, further delaying placement.
Security Services Costs Increase
The cost of security services at BWI Marshall Airport increase by approximately $1.8 million
when compared to the fiscal 2018 working appropriation due to a restructuring of security practices at
BWI Marshall Airport, requiring the need for additional private security officers.
PAYGO Capital Program
Program Description
The MAA capital program provides for the development and maintenance of facilities at BWI
Marshall Airport and MTN. MAA undertakes projects that meet the demands of commercial and
general aviation for both passenger and cargo activities at BWI Marshall Airport. At MTN, capital
investments consist of facilities improvements and rehabilitation activities, such as runway and taxiway
improvements, building and system renovations, and various maintenance projects.
Fiscal 2018 to 2023 Consolidated Transportation Program
The MAA capital program – from fiscal 2018 to 2023 – totals $572.1 million, an increase of
$134.2 million compared to the fiscal 2017 to 2022 Consolidated Transportation Program (CTP).
Funding for projects in the fiscal 2018 to 2023 CTP is largely devoted to terminal and runway
improvements and minor system preservation projects.
Fiscal 2019 Capital Expenditures
Exhibit 7 shows the fiscal 2019 capital expenditures for MAA by project and program along
with estimated total project costs and six-year funding included in the CTP. Three major projects – the

J00I00 – MDOT – Maryland Aviation Administration
Analysis of the FY 2019 Maryland Executive Budget, 2018 16
International Concourse Extension, the Shuttle Bus Service fleet replacement, and the Midfield Cargo
Area improvements project – account for 39.6% of the total fiscal 2019 expenditures, while the
collective system preservation minor projects account for 34.9% of expenditures.
Exhibit 7
Maryland Aviation Administration PAYGO Capital Allowance Fiscal 2019
($ in Thousands)
Jurisdiction Project Description 2019
Total
Cost
Six-year
Total
Projects
Anne Arundel Residential Sound Insulation Program(4) $2,800 $45,000 $45,000
Anne Arundel Runway Safety Area, Standards and Pavement
Improvements (Phase 2) at BWI Marshall
Airport(2), (3)
0 70,509 1,181
Anne Arundel Runway Safety Area, Standards and Pavement
Improvements (Phase 4) at BWI Marshall
Airport(2), (3)
0 122,364 2,294
Anne Arundel D/E Connector at BWI Marshall Airport(2), (3) 0 141,087 6,821
Anne Arundel Loading Bridge Replacement Program at
BWI Marshall Airport(2), (3)
0 12,708 282
Anne Arundel International Checked Baggage Inspection
System at BWI Marshall Airport(2), (3)
0 22,597 981
Anne Arundel International Concourse Extension at
BWI Marshall Airport
20,442 113,386 62,469
Anne Arundel Consolidated Rental Car Facility Shuttle Bus
Fleet Replacement(3)
0 16,000 16,000
Anne Arundel Shuttle Bus Service Fleet Replacement at
BWI Marshall Airport(1)
16,000 35,850 35,850
Anne Arundel Midfield Cargo Area Improvements at
BWI Marshall Airport(1)
10,000 25,850 24,473
Anne Arundel Concourse B Apron Pavement Reconstruction
at BWI Marshall Airport(1)
3,838 10,434 10,302
Anne Arundel Airfield Lighting Vault Relocation at
BWI Marshall Airport(1)
5,348 35,734 35,734

J00I00 – MDOT – Maryland Aviation Administration
Analysis of the FY 2019 Maryland Executive Budget, 2018 17
Jurisdiction Project Description 2019
Total
Cost
Six-year
Total
Anne Arundel Concourse D HVAC Replacement at
BWI Marshall Airport(1)
4,251 16,998 16,998
Anne Arundel FIS Hall Reconfiguration at BWI Marshall
Airport(1)
2,673 10,000 10,000
Anne Arundel Restroom Improvement Program at
BWI Marshall Airport(1)
4,438 53,951 53,944
Baltimore County Environmental Assessment at Martin State
Airport(3)
0 2,841 1,046
Anne Arundel Environmental Assessment at BWI Marshall
Airport(3)
0 3,648 1,912
Anne Arundel Aircraft Maintenance Facility Infrastructure at
BWI Marshall Airport(3)
0 5,000 4,881
Subtotal – Projects $69,790 $743,957 $330,168
Programs
Statewide System Preservation and Minor Projects $40,900 n/a $201,400
Statewide Capital Salaries 6,500 n/a 39,000
Subtotal – Programs $47,400
$240,400
Total – Projects and Programs(5) $117,190 $743,957 $570,568
BWI Marshall Airport: Baltimore-Washington International Thurgood Marshall Airport
FIS: Federal Inspection Service
HVAC: heating, ventilation, and air conditioning
(1) Projects added to the construction program. (2) Projects identified as “completed” in fiscal 2017. (3) No projected out-year costs; six-year total reflects costs in fiscal 2018. (4) This project was previously called the Homeowner Assistance Program. (5) Reported Consolidated Transportation Program value for six-year total, projects and programs: $572.1 million. May
not sum to total due to rounding.
Source: Maryland Department of Transportation, 2018-2023 Consolidated Transportation Program

J00I00 – MDOT – Maryland Aviation Administration
Analysis of the FY 2019 Maryland Executive Budget, 2018 18
Fiscal 2018 and 2019 Cash Flow Analysis
Exhibit 8 shows that the fiscal 2018 working appropriation increased by approximately
$17.1 million (not including nonbudgeted funds) compared to the legislative appropriation. The
increase is primarily due to the introduction of the Midfield Cargo Facility improvements project and
the start of the Concourse B apron reconstruction, as well as funding additions for several minor and
system preservation projects. These increases were offset by decreases in funding for the International
Concourse Extension project and the Residential Sound Insulation Program due to schedule revisions
and a restructuring of the program, respectively. Including nonbudgeted funds, the working
appropriation increased by approximately $33.6 million.
The fiscal 2019 allowance (excluding nonbudgeted funds) is approximately $62.8 million less
than the fiscal 2018 working appropriation, primarily due to the completion of several projects in
fiscal 2018, reduced allowances for certain system preservation and minor projects, and deferral of
certain expenditures to later fiscal years. Including nonbudgeted “other” funds, the fiscal 2019
allowance is approximately $40.8 million less than the fiscal 2018 appropriation. The “other” funding
category is primarily made up of passenger facility charges, although, historically, this funding group
also consists of rental car customer facility charges and certificates of participation.
Exhibit 8
Cash Flow Changes Fiscal 2017-2019
($ in Thousands)
Source: Maryland Department of Transportation, 2018-2023 Consolidated Transportation Program
$0
$20,000
$40,000
$60,000
$80,000
$100,000
$120,000
$140,000
$160,000
$180,000
2017 2018 Legislative
Appropriation
2018 Working 2019 Allowance
Other Federal Special

J00I00 – MDOT – Maryland Aviation Administration
Analysis of the FY 2019 Maryland Executive Budget, 2018 19
Issues
1. Aircraft Noise Continues to Plague Residents
The Federal Aviation Administration (FAA) continues to implement the Next Generation Air
Transportation System (NextGen) across U.S. National Air Space. FAA seeks to improve the safety,
efficiency, capacity, predictability, and resiliency of American aviation by implementing major changes
to advance current processes. These include the use of satellites to track planes and transmission of
text-based flight clearance instructions to pilots.
As a result of NextGen processes, FAA altered flight paths into and out of many airports across
the United States, including at BWI Marshall Airport. Following this change, local residents complained
about increased noise and low-flying aircraft. While the number of flights has not dramatically increased,
a larger number of people have felt the impact of take offs and landings at BWI Marshall Airport.
Exhibit 9 shows the number of annual complaints attributed to noise at BWI Marshall Airport.
Citizen complaints related to FAA’s implementation of NextGen processes continue to rise in
calendar 2017 relative to calendar 2016. The smaller spikes in calendar 2012 and 2014 are related to
runway closures. The increase in calendar 2015 to 1,850 complaints is partially due to a runway closure
and partially due to NextGen changes, while the increases in calendar 2016 and 2017 are primarily
attributable to the frequency of operations at the airport. It should be noted that many of the current
complaints are from individuals living at greater distances from the airport when compared to prior years,
and there have been no notable runway closures in 2017.
Exhibit 9
Complaints Attributed to Noise at BWI Marshall Airport Calendar 2005-2017
Complaints
(Total/Unique)(1) Complaints
(Total/Unique)(1)
2005 207 88 2012 664 398
2006 248 82 2013 283 156
2007 284 94 2014(2) 852 225
2008 280 112 2015 1,850 559
2009 341 123 2016 2,694 618
2010 176 95 2017 16,120 1,103
2011 389 268
BWI Marshall Airport: Baltimore-Washington International Thurgood Marshall Airport (1) “Total” means total number of complaints in a given year, while “Unique” means number of complaints by unique
individuals. (2) DC Metroplex Next Generation Air Transportation System changes implemented November 13, 2014.
Source: Maryland Aviation Administration

J00I00 – MDOT – Maryland Aviation Administration
Analysis of the FY 2019 Maryland Executive Budget, 2018 20
BWI Community Roundtable Established
Since the NextGen rules were implemented and noise complaints increased, FAA advised MAA
to create a group of community and industry representatives to develop recommendations for changes.
In response, the DC Metroplex BWI Community Roundtable (Roundtable) was chartered on
March 21, 2017, including 21 voting members and several nonvoting advisors from the aviation
industry, FAA, and other government organizations. In one of its first actions, the Roundtable
unanimously adopted a resolution requesting FAA to immediately revert the flight paths and procedures
to those in place prior to the implementation of NextGen and the DC Metroplex plan. This resolution
received the support of Governor Lawrence J. Hogan, Jr., the Maryland Congressional Delegation, and
others. FAA addressed the resolution directly in November 2017, stating that it is not possible to
completely return to the status quo ante, and that further changes will require new administrative action
and review.
Communities Take Action against FAA
Concern over noise and other impacts of the redirected flight paths has led to calls for legal
action against FAA. In March 2017, the U.S. Court of Appeals for the District of Columbia heard
arguments in City of Phoenix, Arizona v. Michael P. Huerta and Federal Aviation Administration. The
City of Phoenix sued FAA over changes to the flight paths at Phoenix Sky Harbor International Airport
that affected residents in historic communities in the proximity of the airport. The court found in favor
of the city. In a 2-1 decision, the court found that FAA acted arbitrarily and capriciously and violated
the National Historic Preservation Act, the National Environmental Policy Act, the Department of
Transportation Act, and FAA’s Order 1050.1E. The court vacated the September 18, 2014 order that
implemented the new flight routes and procedures at Sky Harbor International Airport and remanded
the matter to FAA for further proceedings consistent with the opinion. Following this holding,
Governor Hogan directed Attorney General Brian E. Frosh to file suit against Michael P. Huerta and
FAA, “on behalf of all Marylanders suffering from the adverse effects of the implementation of
[NextGen]” in a letter dated September 12, 2017. As of October 31, 2017, the Office of the Attorney
General (OAG) released a press statement that Attorney General Frosh has retained Kaplan, Kirsch, &
Rockwell, the law firm that represented the City of Phoenix in the aforementioned case, as outside
counsel to assist OAG in taking action against FAA over its NextGen flight paths and procedures for
the DC Metroplex. No legal action has been filed at this time.
MAA Efforts to Monitor and Mitigate the Effects of Aircraft Noise
MAA engages in several projects to monitor and mitigate noise due to air traffic. A contract is
underway to replace the permanent noise monitoring system at BWI Marshall Airport. DLS
recommends that MAA should comment on the replacement project, with emphasis on how the
new systems may increase the fidelity of sound mapping and reporting. Further, MAA should
comment generally on the difficulties of sound mapping and reporting at BWI Marshall Airport. Additionally, the Residential Sound Insulation Program (RSIP) is a voluntary program that provides
for the mitigation of aircraft noise at residential properties that fall within the current Noise Exposure
Map (NEM) approved by FAA. Though inactive for a number of years due to budget constraints, MAA
has recently taken steps to reinstate the program. In June 2017, MAA sent letters to potentially eligible

J00I00 – MDOT – Maryland Aviation Administration
Analysis of the FY 2019 Maryland Executive Budget, 2018 21
homeowners and continues to receive inquiries about the status of the program. At this time, inquiries
are primarily from residents who have been made aware of the program and who have been identified
as potentially eligible for participation. DLS recommends that MAA should comment on the
eligibility requirements to participate in the RSIP and the potential fiscal impact on the TTF.
Further, MAA should comment on the number of pre-NextGen implementation requests to
participate versus the number of requests for relief following the implementation of NextGen.
Finally, MAA should comment on the location of the highest density clusters of complaints
following the implementation of NextGen and the location of these clusters relative to the NEM.
2. On-site Hotel Replacement Plan Still Up in the Air
BWI Marshall Airport has been without an on-site hotel since the closure of the Four Points by
Sheraton BWI Marshall Airport in November 2013. Since that time, the hotel building was demolished,
and a Request for Proposals (RFP) did not receive bids. Respondents cited several factors as
contributing to the failure of the RFP, including (1) lack of financial incentives; (2) associated
development costs; (3) stringent lease language; (4) inability to secure bank financing; (5) the plethora
of hotel brands proximate to the airport; and (6) a nonideal prospective location near, but not on-site of
the terminal.
MAA is exploring what may be done to address some of these concerns if a subsequent RFP is
to be issued and has since shifted its focus to an in-terminal hotel. MAA notes that the in-terminal
location has become common in the industry, with recent successful developments at the Dallas/Fort
Worth, Detroit, Orlando, and Denver airports. The in-terminal location is seen as providing a higher
level of customer service and convenience to travelers, especially in terms of saving travelers time
going between lodging and the airport. MAA is still in the early planning stages of development for
this project. DLS recommends that MAA should comment on the status of the hotel project and
the proposed project revisions. Further, MAA should comment on the need for an in-terminal
hotel considering that many hotel facilities are within a short distance of BWI Marshall Airport.

J00I00 – MDOT – Maryland Aviation Administration
Analysis of the FY 2019 Maryland Executive Budget, 2018 22
Operating Budget Recommended Actions
1. Concur with Governor’s allowance.

J00I00 – MDOT – Maryland Aviation Administration
Analysis of the FY 2019 Maryland Executive Budget, 2018 23
PAYGO Budget Recommended Actions
1. Concur with Governor’s allowance.
J00I00 – MDOT – Maryland Aviation Administration
Analysis of the FY 2019 Maryland Executive Budget, 2018 24
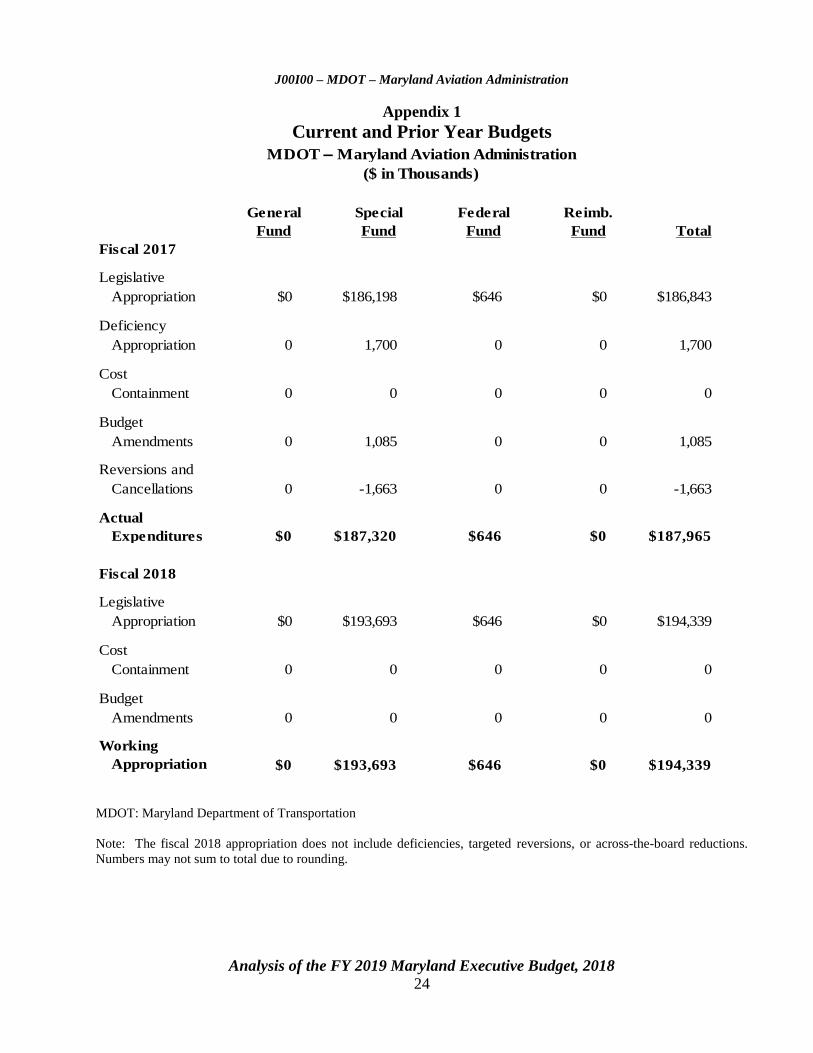
Appendix 1
Current and Prior Year Budgets
Fiscal 2017
Legislative
Appropriation $0 $186,198 $646 $0 $186,843
Deficiency
Appropriation 0 1,700 0 0 1,700
Cost
Containment 0 0 0 0 0
Budget
Amendments 0 1,085 0 0 1,085
Reversions and
Cancellations 0 -1,663 0 0 -1,663
Actual
Expenditures $0 $187,320 $646 $0 $187,965
Fiscal 2018
Legislative
Appropriation $0 $193,693 $646 $0 $194,339
Cost
Containment 0 0 0 0 0
Budget
Amendments 0 0 0 0 0
Working
Appropriation $0 $193,693 $646 $0 $194,339
($ in Thousands)
MDOT – Maryland Aviation Administration
General Special Federal
TotalFund FundFund
Reimb.
Fund
MDOT: Maryland Department of Transportation
Note: The fiscal 2018 appropriation does not include deficiencies, targeted reversions, or across-the-board reductions.
Numbers may not sum to total due to rounding.
J0
0I0
0 –
MD
OT
Ma
rylan
d A
viatio
n A
dm
inistra
tion
Appen
dix
1

J00I00 – MDOT – Maryland Aviation Administration
Analysis of the FY 2019 Maryland Executive Budget, 2018 25
Fiscal 2017
The Maryland Aviation Administration (MAA) finished fiscal 2017 approximately $1.1 million
above its legislative appropriation.
Special funds increased by approximately $1.1 million compared to the legislative
appropriation. Amendments increased the special fund appropriation by approximately $0.5 million
for a fiscal 2017 salary increment and by $0.6 million for salary increases that were part of a law
enforcement collective bargaining agreement. Additionally, the MAA special fund appropriation
increased by $1.7 million due to a deficiency appropriation for increased security services at the
Baltimore-Washington International Thurgood Marshall Airport.
MAA canceled more than $1.6 million in special funds for the following reasons:
approximately $0.6 million in health insurance for employees and retirees;
approximately $0.6 million associated with the Maryland Transportation Authority police
services contract, as expected costs exceeded actual expenditures for the fiscal year; and
approximately $0.4 million in shuttle bus operation costs due to more efficient operation.
Fiscal 2018
There are no changes to the fiscal 2018 appropriation.

An
alysis o
f the F
Y 2
019 M
aryla
nd E
xecu
tive Bu
dget, 2
018
26
Appendix 2
Object/Fund Difference Report
Maryland Department of Transportation – Maryland Aviation Administration
FY 18
FY 17 Working FY 19 FY 18 - FY 19 Percent
Object/Fund Actual Appropriation Allowance Amount Change Change
Positions
01 Regular 447.50 447.50 448.50 1.00 0.2%
02 Contractual 0.50 0.50 0.50 0.00 0%
Total Positions 448.00 448.00 449.00 1.00 0.2%
Objects
01 Salaries and Wages $ 45,072,480 $ 42,951,108 $ 43,749,675 $ 798,567 1.9%
02 Technical and Spec. Fees 2,018,042 2,097,050 2,225,573 128,523 6.1%
03 Communication 1,181,066 1,453,496 1,236,851 -216,645 -14.9%
04 Travel 271,045 242,969 242,969 0 0%
06 Fuel and Utilities 13,257,564 15,045,237 13,521,037 -1,524,200 -10.1%
07 Motor Vehicles 2,404,384 2,917,361 2,670,452 -246,909 -8.5%
08 Contractual Services 85,978,321 92,307,025 100,250,446 7,943,421 8.6%
09 Supplies and Materials 7,144,993 7,114,925 7,074,925 -40,000 -0.6%
10 Equipment – Replacement 203,798 0 0 0 0.0%
11 Equipment – Additional 194,989 0 0 0 0.0%
12 Grants, Subsidies, and Contributions 1,064,697 984,081 1,027,966 43,885 4.5%
13 Fixed Charges 19,325,967 18,063,883 18,083,919 20,036 0.1%
14 Land and Structures 9,848,013 11,161,864 11,239,422 77,558 0.7%
Total Objects $ 187,965,359 $ 194,338,999 $ 201,323,235 $ 6,984,236 3.6%
Funds
03 Special Fund $ 187,319,859 $ 193,693,499 $ 200,677,735 $ 6,984,236 3.6%
05 Federal Fund 645,500 645,500 645,500 0 0%
Total Funds $ 187,965,359 $ 194,338,999 $ 201,323,235 $ 6,984,236 3.6%
Note: The fiscal 2018 appropriation does not include deficiencies, targeted reversions, or across-the-board reductions. The fiscal 2019 allowance
does not include contingent reductions or cost-of-living adjustments. Numbers may not sum to total due to rounding.
J0
0I0
0 –
MD
OT
– M
aryla
nd
Avia
tion
Ad
min
istratio
n

An
alysis o
f the F
Y 2
019 M
aryla
nd E
xecu
tive Bu
dget, 2
018
27
Appendix 3
Fiscal Summary
Maryland Department of Transportation – Maryland Aviation Administration
FY 17 FY 18 FY 19 FY 18 - FY 19
Program/Unit Actual Wrk Approp Allowance Change % Change
2021 Baltimore-Washington International Thurgood
Marshall Airport
$ 179,502,066 $ 186,475,388 $ 193,546,585 $ 7,071,197 3.8%
2022 Martin State Airport 7,982,295 7,406,508 7,319,579 -86,929 -1.2%
2023 Regional Air Development 480,998 457,103 457,071 -32 0%
2030 Facilities and Capital Equipment 127,446,809 123,662,000 60,833,340 -62,828,660 -50.8%
1270 Parking Revenue Control System 58,459 0 0 0 0%
Total Expenditures $ 315,470,627 $ 318,000,999 $ 262,156,575 -$ 55,844,424 -17.6%
Special Fund $ 309,603,987 $ 305,858,499 $ 251,283,075 -$ 54,575,424 -17.8%
Federal Fund 5,866,640 12,142,500 10,873,500 -1,269,000 -10.5%
Total Appropriations $ 315,470,627 $ 318,000,999 $ 262,156,575 -$ 55,844,424 -17.6%
Note: The fiscal 2018 appropriation does not include deficiencies, targeted reversions, or across-the-board reductions. The fiscal 2019 allowance does
not include contingent reductions or cost-of-living adjustments. Numbers may not sum to total due to rounding.
J0
0I0
0 –
MD
OT
– M
aryla
nd
Avia
tion
Ad
min
istratio
n

J00I00 – MDOT – Maryland Aviation Administration
Analysis of the FY 2019 Maryland Executive Budget, 2018 28
Appendix 4
Budget Amendments for Fiscal 2018
Maryland Department of Transportation
Maryland Aviation Administration – Capital
Status Amendment Fund Justification
Pending
$11,098,671
5,980,000
$17,078,671
Special
Federal
Subtotal
Amend the working appropriation to reflect the
fiscal 2018 to 2023 Consolidated Transportation
Program.
$17,078,671 Total
Source: Maryland Department of Transportation