operating system collector saposcol
DESCRIPTION
os collectorTRANSCRIPT

Operating System Collector SAPOSCOL
Version 1.5 September 27, 2004
Operating System Collector SAPOSCOL: Properties, Installation, and Operation
SAP AG Neurottstr. 16
D-69190 Walldorf
SAP AG Operating System Collector SAPOSCOL September 27, 2004
Page 1 of 47

Operating System Collector SAPOSCOL
Copyright
© Copyright 2002 SAP AG. All rights reserved.
No part of this publication may be reproduced or transmitted in any form or for any purpose without the express permission of SAP AG. The information contained herein may be changed without prior notice.
Some software products marketed by SAP AG and its distributors contain proprietary software components of other software vendors.
Microsoft®, WINDOWS®, NT®, EXCEL®, Word®, PowerPoint® and SQL Server® are registered trademarks of Microsoft Corporation.
IBM®, DB2®, DB2 Universal Database, OS/2®, Parallel Sysplex®, MVS/ESA, AIX®, S/390®, AS/400®, OS/390®, OS/400®, iSeries, pSeries, xSeries, zSeries, z/OS, AFP, Intelligent Miner, WebSphere®, Netfinity®, Tivoli®, Informix and Informix® Dynamic ServerTM are trademarks of IBM Corporation in USA and/or other countries.
ORACLE® is a registered trademark of ORACLE Corporation.
UNIX®, X/Open®, OSF/1®, and Motif® are registered trademarks of the Open Group.
Citrix®, the Citrix logo, ICA®, Program Neighborhood®, MetaFrame®, WinFrame®, VideoFrame®, MultiWin® and other Citrix product names referenced herein are trademarks of Citrix Systems, Inc.
HTML, DHTML, XML, XHTML are trademarks or registered trademarks of W3C®, World Wide Web Consortium, Massachusetts Institute of Technology.
JAVA® is a registered trademark of Sun Microsystems, Inc.
JAVASCRIPT® is a registered trademark of Sun Microsystems, Inc., used under license for tech-nology invented and implemented by Netscape.MarketSet and Enterprise Buyer are jointly owned trademarks of SAP Markets and Commerce One.
MarketSet and Enterprise Buyer are jointly owned trademarks of SAP AG and Commerce One.
SAP, SAP Logo, R/2, R/3, mySAP, mySAP.com, and other SAP products and services mentioned herein as well as their respective logos are trademarks or registered trademarks of SAP AG in Ger-many and in several other countries all over the world. All other product and service names men-tioned are the trademarks of their respective companies.
SAP AG Operating System Collector SAPOSCOL September 27, 2004
Page 2 of 47

Operating System Collector SAPOSCOL
Symbols
Symbol Meaning
Caution
Example
Note
SAP AG Operating System Collector SAPOSCOL September 27, 2004
Page 3 of 47

Operating System Collector SAPOSCOL
Contents 1 Introduction ............................................................................................................. 6 1.1 Background to Origin ...........................................................................................................6
2 Features ................................................................................................................... 7 2.1 Monitoring Operating System Data......................................................................................7
2.1.1 CPU................................................................................................................................. 7 2.1.2 Memory Management..................................................................................................... 9 2.1.3 File Systems and LAN.................................................................................................. 10
2.2 Monitoring Selected Processes...........................................................................................11
2.3 Supported Operating Systems ............................................................................................11
3 Installation and Configuration of SAPOSCOL .................................................... 12
3.1 Downloading SAPOSCOL.................................................................................................12
3.2 Process of the Installation...................................................................................................14 3.2.1 Installation Under UNIX .............................................................................................. 14 3.2.2 Installation Under Microsoft Windows ........................................................................ 15
3.3 Working Directory and Profile Parameters for SAPOSCOL.............................................16 3.3.1 Working Directory........................................................................................................ 16 3.3.2 The Profile Parameter exe/saposcol.............................................................................. 17
3.4 Setting Up Process Monitoring ..........................................................................................17
3.5 Deactivating Object Monitoring by SAPOSCOL ..............................................................20
4 Controlling SAPOSCOL ........................................................................................ 22 4.1 Starting and Stopping SAPOSCOL....................................................................................22
4.1.1 Starting SAPOSCOL .................................................................................................... 22 4.1.2 Stopping SAPOSCOL .................................................................................................. 23
4.2 Controlling SAPOSCOL from the Operating System Monitor..........................................24
4.3 Controlling SAPOSCOL from the Operating System........................................................24
4.4 Dialog Mode of SAPOSCOL .............................................................................................25 4.4.1 Displaying the Data Collected by SAPOSCOL............................................................ 25 4.4.2 Controlling SAPOSCOL in Dialog Mode .................................................................... 27
4.5 Minimizing the CPU Workload Caused by SAPOSCOL ..................................................28
5 Displaying Operating System Data...................................................................... 29 5.1 Operating System Monitor .................................................................................................29
SAP AG Operating System Collector SAPOSCOL September 27, 2004
Page 4 of 47
Operating System Collector SAPOSCOL
5.1.1 Displaying Data for the Last 30 Days in the Operating System Monitor..................... 31
5.2 Alert Monitor......................................................................................................................32 5.2.1 CCMS Monitor Operating System................................................................................ 33 5.2.2 CCMS Monitor Operating System – Monitored Processes.......................................... 35 5.2.3 CCMS Monitor Filesystems ......................................................................................... 37
6 SAPOSCOL and CCMS Agents ............................................................................ 39 6.1 Avoiding Objects Being Copied to the Monitoring Segment ............................................39
6.2 Setting the SAPOSCOL Destination in the Central System ..............................................40
6.3 Controlling SAPOSCOL on Remote Hosts.........................................................................41
7 Error Analysis........................................................................................................ 42
7.1 SAPOSCOL Log Files .......................................................................................................43
7.2 Notes for Incorrect Data Display........................................................................................45
8 Additional Information .......................................................................................... 47
SAP AG Operating System Collector SAPOSCOL September 27, 2004
Page 5 of 47
Operating System Collector SAPOSCOL
1 Introduction The operating system collector SAPOSCOL is a stand-alone program that runs in the operating system background. It runs independently of SAP instances exactly once per monitored host. SAPOSCOL collects data about operating system resources, including:
• Usage of virtual and physical memory
• CPU utilization
• Utilization of physical disks and file systems
• Resource usage of running processes
SAPOSCOL makes the data available to various applications and all SAP instances on a host using a segment of the shared memory. A CCMS agent or a dialog work process reads the data from the shared memory. You can display the data in various monitoring architecture monitors or in the operating system monitor (transactions OS07 and ST06). If the operating system data is read and sent by CCMS agents, you can display operating system data for any hosts in a central system.
1.1 Background to Origin
When the development of SAP R/3 was begun, the hardware resources on UNIX servers were so scarce that it was necessary to customize the applications to these resources.
In many areas, SAP R/3 is based on a logical, operating system-like level (such as memory man-agement or managing the work processes). SAP R/3 could only manage these tasks if it had ac-cess to reliable performance values for the operating system, irrespective of the specific operating system. SAPOSCOL performs this task with a small usage of resources, such as CPU or memory.
SAP AG Operating System Collector SAPOSCOL September 27, 2004
Page 6 of 47
Operating System Collector SAPOSCOL
2 Features This section lists the data collected by SAPOSCOL and the platforms supported.
SAPOSCOL collects the value that the operating system provides. The operating sys-tem is responsible for the values being available and correct. Not every value is avail-able in every operating system.
By default, SAPOSCOL collect the current data on its monitored host every ten seconds. In addi-tion to these current values (Snapshots), SAPOSCOL stores average hourly values for the previ-ous 24 hours in its shared memory segment for most monitored objects.
There are two database tables (MONI and OSMON) that are used for longer-term storage of the collected data. The data is written to these tables from the shared memory segment by the job COLLECTOR_FOR_PERFMONITOR to ensure that you can also access the data in the long-term at various aggregation levels. (See Displaying Data for the Last 30 Days in the Operating System Monitor [page 31]).
2.1 Monitoring Operating System Data
2.1.1 CPU For every CPU, SAPOSCOL measure CPU usage, broken down as percentages by:
• Users
• System
• Times in which the CPU had not task to perform or was waiting for an input/output (idle)
Many factors could lead to an excessively high CPU utilization, and you should therefore per-form a detailed analysis. If the problem was caused by too many active processes in the host sys-tem, you could, for example, transfer CPU- intensive programs to times when there is a lower system workload, or to other host systems. You could also increase the number of CPUs or up-grade the CPU(s)..
When calculating the hourly values for the last 24 hours, these values are averaged over all CPUs of a host.
SAP AG Operating System Collector SAPOSCOL September 27, 2004
Page 7 of 47
Operating System Collector SAPOSCOL
Other Values Collected
• Number of CPUs
• Interrupts per second/hour
• System calls per second/hour
• Context switches per second/hour
• Average number of waiting processes for the last minute, the last five minutes, and the last fifteen minutes
This is the number of processes for each CPU that are in a wait queue before they are as-signed to a free CPU. As long as the average remains at one process for each available CPU, the CPU resources are sufficient. As of an average of around three processes for each avail-able CPU, there is a bottleneck at the CPU resources.
o In connection with a high CPU usage, a high value here can indicate that too many proc-esses are active on the server.
o In connection with a low CPU usage, a high value here can indicate that the main memory is too small. The processes are then waiting due to excessive paging.
• Detail data for the processes that cause the largest CPU load:
o Process ID
o Owner of the process
o Command that started the process
o Absolute and percentage CPU utilization by the process
o Resident process size in kilobytes
o Priority of the process
The detail data for the processes with the largest CPU workload and the number of waiting processes are only available in the shared memory segment as snapshot val-ues.
SAP AG Operating System Collector SAPOSCOL September 27, 2004
Page 8 of 47
Operating System Collector SAPOSCOL
2.1.2 Memory Management
SAPOSCOL measures the following values:
• Physically available and free main memory in kilobytes; he minimum and maximum free main memory are also measured hourly.
As a rule of thumb, CPU bottlenecks occur for a small hardware configuration if there is less than 10MB of free physical memory. This value can vary depending on operat-ing system and system size.
• Paging is the exchange of data pages between the main memory of a host and the overflow store in a paging file on the hard disk; paging occurs if the main memory is not large enough for the contexts of all running processes. SAPOSCOL measures the number of pages paged in and paged out per second with the quantities of memory paged in and paged out in kilobytes.
High paging rates indicate that the main memory is too small for the running processes. Measures that you can take are to extend the main memory, to move processes to other host systems, and to delay memory-intensive programs to times of lower system workload.
On Microsoft Windows platforms (unlike UNIX platforms), the system performs pag-ing out as a precautionary measure even when space is not required in the working memory, meaning that this value is irrelevant and you should only consider the paging in rate. Under UNIX, on the other hand, the paging out rate is the critical value for evaluating the paging.
• Swap Space is storage space on the hard disk to which data that is not required is written from the main memory, so that there is space in the main memory for the program currently being executed. SAPOSCOL measures the configured and free swap space in kilobytes and the actual and maximum size of the swap space in kilobytes.
In addition, the maximum and minimum sizes of the free swap space is measured hourly. The most important values are the free and the actual swap space.
Not all types of swap space are available on all operating systems.. For this reason, in some cases, the actual swap space corresponds to the configured and maximum swap space.
SAP AG Operating System Collector SAPOSCOL September 27, 2004
Page 9 of 47

Operating System Collector SAPOSCOL
2.1.3 File Systems and LAN
SAPOSCOL measures the following values:
• For all physical hard disks on a host:
o Device name of the hard disk
o Hard disk usage - percentage of the time in which the hard disk is being used
o Average wait queue length of an input/output request
o Wait time in milliseconds during which a request waits in the wait queue
o Service time in milliseconds for an input/output
o Transferred kilobytes per second
o Number of hard disk operations per second
• For all file systems on a host:
o Name of the file system
o Capacity of the file system in megabytes
o Free storage space in the file system in megabytes
• For all LAN interfaces on a host:
o Name of the LAN interface
o Data packets received per second
o Data packets sent per second
o Errors for received data packets per second
o Errors for sent data packets per second
o Collisions per second, in which two stations transport a packet at the same time on the same channel; this leads to the destruction of both packets and means they must be sent again
Some values are not specified in some network interfaces; for example, there may not be a value for collisions per second in a token ring architecture. The values specified here do not describe the actual network traffic. They describe the transfers performed with this interface. This means that the errors displayed here refer to the interface and not to the actual network segment.
SAP AG Operating System Collector SAPOSCOL September 27, 2004
Page 10 of 47
Operating System Collector SAPOSCOL
2.2 Monitoring Selected Processes
In addition to monitoring the processes with the highest CPU usage (see CPU [page 7]), SAPOSCOL can also monitor any selected processes. You specify these processes using the name or the owner of the process in the configuration file dev_proc (see Setting Up Process Monitoring [page 17]). The following values are measured for each selected process name:
• Number of running processes that fulfill the conditions for process name and owner
• Total CPU usage of the above processes
• Total physical memory that is assigned to the above processes
• Total memory (physical and virtual) that is assigned to the above processes (only for Micro-soft Windows platforms)
There are no hourly average values in the shared memory segment for the monitoring of selected processes. You can, however, monitor these values in the CCMS monitor Operating System (see CCMS Monitor Operating System [page 33]), as the Alert Monitor stores reported values for 24 hours.
2.3 Supported Operating Systems
SAPOSCOL is delivered for the following operating system platforms:
• Windows NT, Windows 2000
• AIX
• SUN/SOLARIS
• HP-UX
• LINUX
• OS/390
• OS/400
• SNI
• ALPHAOSF
SAP AG Operating System Collector SAPOSCOL September 27, 2004
Page 11 of 47

Operating System Collector SAPOSCOL
3 Installation and Configuration of SAPOSCOL The program SAPOSCOL is part of the standard delivery for all SAP systems and is therefore always installed with the system. It is possible, however, that you will have to install SAPOSCOL yourself. Possible reasons are:
• You want to monitor operating system data for hosts on which on SAP instance is running or that are not part of an SAP system, but which are important for the environment of your SAP system. In this case, ensure that a CCMS agent is running on the host.
• You want to correct an incorrect installation.
• You want to install a newer version of SAPOSCOL.
Always use the current version of SAPOSCOL.
Process Flow
SAPOSCOL is dependent on the operating system - the installation therefore varies depending on the operating system of the host to be monitored. Follow the appropriate procedure:
• Installation Under UNIX [page 14]
• Installation Under Microsoft Windows [page 15]
For more information about the installation of SAPOSCOL, see SAP Note 19227.
• By default, SAPOSCOL automatically has a valid working directory after installation. If you want to change this directory, see Working Directory and Profile Parameters for SAPOSCOL [page 16].
• If you want to monitor particular processes with SAPOSCOL, see Setting Up Process Moni-toring [page 17].
3.1 Downloading SAPOSCOL
1. You can find the current version of SAPOSCOL in the SAP Software Distribution Center under http://service.sap.com/swdc. Log on using your SAP Service Marketplace ID.
2. SAPOSCOL is backward-compatible in relation to the SAP release. This means that the SAPOSCOL release can be higher than the SAP Basis or SAP Web AS release.
SAPOSCOL is, however, dependent on the operating system release. You should therefore select the correct SAPOSCOL version as follows:
SAP AG Operating System Collector SAPOSCOL September 27, 2004
Page 12 of 47

Operating System Collector SAPOSCOL
• Provided that your operating system release is sufficiently current (see, among other
things, SAP Notes about the Kernel-operating system combinations released by SAP), use the current SAPOSCOL from the following directory:
Download → SAP Support Packages and Patches → Entry by Application Group → Additional Components → SAP Kernel → SAP KERNEL 32-BIT | 64-BIT → SAP KERNEL 6.40 32-BIT | 64-BIT → SAP KERNEL 6.40 32-BIT| 64-BIT → <Operating System> → Database Independent
• If your operating system release is not sufficiently current, use the current 6.20 ver-sion. If your operating system release is also insufficiently current for the 6.20 ver-sion, use the current 4.6D_EXT version:
Download → SAP Support Packages and Patches → Entry by Application Group → Additional Components → SAP Kernel → SAP KERNEL 32-BIT| 64-BIT → SAP KERNEL 4.6D_EXT 6.20 32-BIT | 64-BIT → SAP KERNEL 4.6D_EXT 6.20 32-BIT | 64-BIT → <Operating System> → Database Independent
• If you want to install or replace SAPOSCOL on a host with no SAP system, use the 6.40 version of SAPOSCOL if possible. Depending on your operating system, you may have to install lower versions of SAPOSCOL.
For Tru64, the following special rules apply:
For TRU64 4.0x, install SAPOSCOL 4.6D. For TRU64 5.1, install SAPOSCOL 6.40.
You should also take account of the following SAP Notes:
SAP Note Short Text
407314 Released operating systems SAP R/3 Kernel 6.x ORACLE
407317 Released operating systems SAP R/3 Kernel 6.x INFORMIX
407320 Released operating systems SAP R/3 Kernel 6.x SAP DB
407322 Released operating systems SAP R/3 Kernel 6.x DB2/UDB
407325 Released operating systems SAP R/3 Kernel 6.x DB2/390
407328 Released operating systems SAP R/3 Kernel 6.x MS SQL
410783 Released operating systems SAP R/3 Kernel 6.x iSeries
For information about the current status of releases, see http://service.sap.com/platforms.
SAP AG Operating System Collector SAPOSCOL September 27, 2004
Page 13 of 47

Operating System Collector SAPOSCOL
3. Copy SAPOSCOL from the above directory to your TEMP directory. Depending on the file-
name extension, decompress the archive either with the CAR tool or with SAPCAR (exten-sion SAR). You should also take account of the following SAP Notes:
• Unpacking .car Archives (29372)
• The new archiving tool SAPCAR (212876)
3.2 Process of the Installation
3.2.1 Installation Under UNIX 1. SAPOSCOL reads areas of the operating system that are normally reserved for kernel proc-
esses; SAPOSCOL must therefore run under the root user. You should therefore change the user with the command su root.
2. If an SAP R/3 System is running on the host, change to the directory /usr/sap/<SID>/SYS/exe/run. On hosts with no SAP R/3 System, you can install SAPOSCOL in any directory.
3. If an older version of SAPOSCOL is already active on your host, stop it using the command saposcol -k and back up the old version with the command cp saposcol saposcol.old.
4. Copy the new version of SAPOSCOL: cp <temp_dir>/saposcol saposcol
5. Assign the required authorizations to SAPOSCOL with the commands: chgrp sapsys saposcol chmod 4710 saposcol
As SAPOSCOL is running with root authorization, only users from the group sapsys (such as <sid>adm ) should have access to it. If you are installing SAPOSCOL on hosts with no SAP system, assign the access rights in the same way using a user group (analogous to sapsys).
6. Change back to your original user with the command exit exit.
7. Start the new SAPOSCOL with the command saposcol.
To ensure that SAPOSCOL was correctly installed, enter the command ls -l saposcol at the UNIX input prompt in the directory /usr/sap/<SID>/SYS/exe/run.
The system displays the following line:
SAP AG Operating System Collector SAPOSCOL September 27, 2004
Page 14 of 47

Operating System Collector SAPOSCOL
-rwx--x--- 1 root sapsys 779332 Aug 1 10:14 saposcol
This is the correct user assignment.You set it with the command:
chmod 4710 saposcol
This is the correct user assignment.You set it with the command:
chown root saposcol
8. If no SAP instance is running on the host, you must ensure yourself that SAPOSCOL is
automatically started after a restart of the host (for example, by entering the start command in the INITTAB). If a SAP instance is running on the host, SAPOSCOL is contained in the start script.
3.2.2 Installation Under Microsoft Windows 1. Make sure that you have the current version of the file pdh.dll in the System32 folder of
your Microsoft Windows system directory (such as c:\winnt\system32). You can get the file from the FTP server sapserv3 in the directory /general/misc/saposcol/NT.
2. If an older version of SAPOSCOL is already active on your host, stop this service in the sys-tem control and back up the old version of SAPOSCOL. On hosts with SAP R/3 Systems, SAPOSCOL is in the directory \usr\sap\<SID>\SYS\exe\run or \usr\sap\d<inst.no>\exe.
3. Replace this with the new version.
4. Restart the SAPOSCOL service in the system control. If you are installing SAPOSCOL on the host for the first time, set up a service for SAPOSCOL with the following command: ntscmgr.exe install SAPOsCol -b <path>\saposcol.exe –p service
• Choose a user for the service that is a local administrator on the relevant server. Only then can SAPOSCOL collect all relevant data. If there is a sapservice<SID> user, use this user.
• As ntscmgr creates services under the system user by default, change the con-figuration appropriately in the system control after the installation.
• For more information, see SAP Note 0436186.
SAP AG Operating System Collector SAPOSCOL September 27, 2004
Page 15 of 47
Operating System Collector SAPOSCOL
3.3 Working Directory and Profile Parameters for SAPOSCOL
3.3.1 Working Directory The SAPOSCOL working directory is the directory to which the collector writes its data and in which it searches for the log file dev_coll and the shared memory backup file coll.put. It is not the directory in which SAPOSCOL itself is stored.
Default SAPOSCOL Working Directory
Operating System Path of the Working Directory
Microsoft Windows NT \\host\saploc\prfclog or (if this does not exist) c:\temp
saploc must be released as a share.
UNIX /usr/sap/tmp or (if this does not exist) /tmp
Set a profile parameter if you want to use a different directory. In this case, start SAPOSCOL with a profile (saposcol -l pf=<file path/filename>), where the specified file contains only the following line:
DIR_PERF = <Path of the desired working directory>
• If a CCMS agent is also working on the host on which the operating system col-lector is running, note that the profile parameter DIR_PERF also determines the working directory of the agent. The working directory of the agent should be a folder in the working directory of the operating system collector. For more infor-mation, see [Agents].
• As you can also access the dev_coll file from the SAP system, you should also maintain the profile parameter DIR_PERF at the same time for all SAP instances of the affected host.
Start SAPOSCOL with the command: saposcol -l pf=/usr/sap/C11/SYS/profile/saposcol.pfl
The file /usr/sap/C11/SYS/profile/saposcol.pfl contains the line: DIR_PERF = /usr/sap/my_saposcol_dir
Result: The directory /usr/sap/my_saposcol_dir is the SAPOSCOL working di-rectory.
SAP AG Operating System Collector SAPOSCOL September 27, 2004
Page 16 of 47
Operating System Collector SAPOSCOL
3.3.2 The Profile Parameter exe/saposcol The SAP profile parameter exe/saposcol (which is not a SAPOSCOL profile parameter) contains the complete name of the program SAPOSCOL (which should not be confused with the SAPOSCOL working directory). To start, stop, or display the status of SAPOSCOL from the SAP system or using a CCMS agent, the parameter must point to a correctly installed SAPOSCOL.
If multiple SAP instances are running on a host, for example, each with a different SAP Basis release, ensure that each instance use the same (newest) version of SAPOSCOL.
The system XYZ and the system C11 have different SAP Basis releases, and both sys-tems are on the same host. The profile parameter exe/saposcol should point to the same, current SAPOSCOL in both systems. Ensure that you set the authorizations so that the SAPOSCOL directory can be accessed by both systems, so that SAPOSCOL can be started from both systems. However, only one SAPOSCOL runs for each host at any one time.
3.4 Setting Up Process Monitoring
You can monitor the availability of selected processes with SAPOSCOL. These are displayed in the Monitored Processes subtree of the Operating System monitor and in the detailed analysis of the Operating System Monitor. The monitor displays the number of running processes and the CPU and memory usage for each name template, broken down by different users.
You can optionally set the configuration for process monitoring in the following configuration files (these files are specified in the following templates):
• File dev_proc in the SAPOSCOL working directory [page 16]
• Files of the procmon directory in the SAPOSCOL Working Directory. The naming conven-tion for these templates depends on the CCMS agent with which the monitoredhost is con-nected to the central monitoring system.
CCMS Agent Naming Convention
SAPCCMSR SAPCM3X
*procmon.ini
SAPCCMSR –j2ee SAPCCM4X
*<SysID>_<InstNo>_procmon.ini
<SysID> and <InstNo> are the system ID and the instance number of the monitored ABAP or Java instance. The J2EE Engine automatically generates suitable templates and stores these in the specified (cross-instance) directory. Since the shared memory
SAP AG Operating System Collector SAPOSCOL September 27, 2004
Page 17 of 47

Operating System Collector SAPOSCOL
of the CCMS agents SAPCCMSR –j2ee and SAPCCM4X are only to contain the process monitoring tree for the monitored Engine (ABAP or Java), system ID and in-stance number are part of the naming convention for the templates.
The process monitoring is performed at collection intervals of one minute, by default. CCMS agents can read this data from the shared memory and display it in the SAP system.
Prerequisites
The data transfer to the central monitoring system is performed using a CCMS agent, which must also be installed on the monitored host [Agents].
Process Flow
To start monitoring selected processes, follow the procedure below:
Creating the Configuration Files
Create a template for the process monitoring (dev_proc or *procmon.ini); the template must have the following structure:
• The list of monitored processes begins with $PROC and ends with $.
• Comment lines begin with the number sign (#).
• The lines with which you specify the processes to be monitored have the following structure: <Name template> [[USER=]<user>] [MTE_CLASS=<MTE class>] [MTE_NAME=<MTE name>] [CUSTOMGROUP=<attribute group>]
The individual parts of the line have the following meaning:
Parameter Description Notes Name template Monitored process; you can use the wildcard character
asterisk (*) (see the example below); it is not possible to monitor all processes by entering only the wildcard character asterisk
mandatory max. 40 characters
User User under whose name the process is running; you can use the wildcard character asterisk (*)
optional, max. 20 characters
SAP AG Operating System Collector SAPOSCOL September 27, 2004
Page 18 of 47
Operating System Collector SAPOSCOL
Parameter Description Notes MTE class MTE class to which the nodes are to belong; you can
create your own monitors in which precisely the desired processes are displayed by assigning the process names to an MTE class
To do this, use the rule CCMS_GET_MTE_BY_CLASS in a rule-based monitor, and specify the above MTE class there (see Rule Node: Rule Description and Use [external]).
optional, max. 30 characters
MTE Name MTE name under which the monitoring object for the monitored process name is displayed in the alert moni-tor; if you do not set this parameter, Name Template is used as the MTE name
optional, max. 40 characters
Attribute group
Attribute group to which the attributes of a monitored process name are to belong; you can simplify the main-tenance of the threshold values using an assignment to an attribute group
optional, max. 30 characters
Enter the above parameters without quotation marks; the parameter values must not contain any spaces or special characters.
SAPOSCOL reads the contents of the configuration files every five minutes. After changing these files, you do not need to change SAPOSCOL or the responsible CCMS agent.
Setting the Threshold Values
As the expected CPU and memory usage is different for each process, ensure that you adjust the threshold values of the corresponding performance attributes. The simplest way to do this is di-rectly in the Alert Monitor itself, by selecting the relevant performance attribute and choosing Properties.
There are two options available to avoid accidentally changing the threshold values for other monitored processes:
• Set the threshold values individually for the MTE (to do this, choose Edit → Properties → User for Individual MTE)
• Use a specific attribute group in the configuration file for the desired monitored process. Your changes then affect only the processes that you have assigned to this group.
SAP AG Operating System Collector SAPOSCOL September 27, 2004
Page 19 of 47

Operating System Collector SAPOSCOL
Example
Configuration File dev_proc for a UNIX Host
# This is a test file for# monitoring processes
$PROC
# Is saposcol running?
*saposcol* CUSTOMGROUP=SAPOSCOL
# Is saposcol running# under the root user?
*saposcol* USER=root CUSTOMGROUP=SAPOSCOL
# How many work processes are# running on this host?
*disp+work* MTE_CLASS=R3WP MTE_NAME=Workprocesses
$
Start of the monitored process
Since no user is specified, the processes for all users are displayed
Use * to find saposcol irrespective of its path (for example, to find the process with the path /usr/sap/tmp/saposcol)
By specifying an MTE class, you can create a rule-based monitor that contains this process; to improve the clarity of the display, the monitoring object has the name “Workprocesses” End of the monitored processes
By specifying the same attribute group, you can easily adjust the threshold values for these monitored processes
Result
The data for the monitored processes is displayed both in the Detail analysis menu of the operat-ing system monitor and in the Operating System monitor in the Monitored Processes subtree (see CCMS Monitor Operating System – Monitored Processes [page 35]).
3.5 Deactivating Object Monitoring by SAPOSCOL
You can remove selected hard disks or file systems from the monitoring by SAPOSCOL. SAPOSCOL then collects no data for these objects.
So that disks and file systems are monitored under Microsoft Windows NT/2000, en-sure that the performance counter diskperf is activated with the command diskperf –Y.
Procedure
1. Create a file with the name dev_filter that contains the names of the disks and file sys-tems that are not be monitored. The file has the following format:
SAP AG Operating System Collector SAPOSCOL September 27, 2004
Page 20 of 47
Operating System Collector SAPOSCOL
$<Device_ID> <Device_name 1> ... <Device_name n>
The device ID can be either DISK for disks or FSYS for file systems. The entries are disks or file systems that are not to be displayed.
• Exactly one entry is allowed per line; whether the entries are case-sensitive de-pends on the general specifications of the operating system.
• The asterisk wildcard character (*) is allowed; the character is permitted once for each name.
• The list can contain up to 2000 entries for each type.
The following file dev_filter filters out disk names that end with Total; it also filters out the file system C: and systems that begin with D: $DISK *Total $FSYS C: D*
2. Save the file dev_filter in the working directory of SAPOSCOL (see Working Directory [page 16]).
3. If SAPOSCOL is already running, you should Stopping SAPOSCOL [page 23].
4. Delete the coll.put file in the working directory of SAPOSCOL.
5. Start SAPOSCOL.
The platforms OS/390 and Sun OS do not support the filtering of disks/file systems.
SAP AG Operating System Collector SAPOSCOL September 27, 2004
Page 21 of 47
Operating System Collector SAPOSCOL
4 Controlling SAPOSCOL After installing and starting SAPOSCOL, it automatically starts to collect operating system data for its local host and to store this data in the shared memory.
4.1 Starting and Stopping SAPOSCOL
You only need to start SAPOSCOL yourself the first time that it is started on a host (see Installation and Configuration of SAPOSCOL [page 12]). Thereafter, SAPOSCOL is automati-cally stopped and started when the host is shut down and started; this applies irrespective of whether SAP components are running on the corresponding host. A manual stop and restart is only necessary in the following conditions:
• You want to install a newer version of SAPOSCOL.
• SAPOSCOL is collecting incorrect data or the installation of SAPOSCOL is incorrect.
4.1.1 Starting SAPOSCOL The command to start SAPOSCOL varies depending on the operating system:
o Under UNIX, you start SAPOSCOL with the command saposcol (or saposcol -l).
o Under Microsoft Windows NT, you start SAPOSCOL by starting the corresponding ser-vice by choosing Start → Settings → Control Panel → Services (see SAP Note 0436186).
o You can also start SAPOSCOL in the Operating System Monitor [page 29].
Normally, SAPOSCOL is called without additional parameters or profiles. saposcol –l corresponds to this call, where -l stands for start (see Controlling SAPOSCOL from the Operating System [page 24]).
The following occurs when the start command is executed:
1. If the call finds a SAPOSCOL segment in the shared memory, it takes over its process ID (PID) and the stored data of a SAPOSCOL that may already be running.
2. If no other SAPOSCOL is collecting data, the PID is 0, and SAPOSCOL uses the existing shared memory segment when starting. SAPOSCOL starts even if no shared memory is avail-able.
3. The new SAPOSCOL does not start if it detects that another SAPOSCOL is collecting data.
4. After it has been started, SAPOSCOL performs an initialization during which it reserves its required space in shared memory. The program calculates the size of this space from the number of available hard disks, CPUs, file systems, and so on. SAPOSCOL writes the con-tents of the file coll.put (if it exists) to its shared memory segment.
5. The process continues running in the background, and the original program ends. SAP AG Operating System Collector SAPOSCOL September 27, 2004
Page 22 of 47

Operating System Collector SAPOSCOL
4.1.2 Stopping SAPOSCOL The command to stop SAPOSCOL varies depending on the operating system:
o Under UNIX, you stop SAPOSCOL with the command saposcol -k.
o Under Microsoft Windows NT, you stop SAPOSCOL by stopping the corresponding ser-vice (by choosing Start → Settings → Control Panel → Services).
o You can also stop SAPOSCOL from the Operating System Monitor [page 29].
Do not stop SAPOSCOL with other operating system commands, as the data in the shared memory could become corrupted. Also, in this case you cannot start a new SAPOSCOL, but receive an error message that a SAPOSCOL is already running.
The command to stop SAPOSCOL first starts a new SAPOSCOL that stop the active SAPOSCOL after a second. The following occurs:
1. The new SAPOSCOL connects to the shared memory.
2. Using the shared memory, it determines the process ID (PID) of the SAPOSCOL that is col-lecting data.
3. If the new SAPOSCOL finds a valid PID, it sets a flag in shared memory. When the old SAPOSCOL finds this flag, it resets the flag and deletes the PID from shared memory. If this is not complete within 20 seconds, the new SAPOSCOL stop the old SAPOSCOL.
How long a shared memory segment exists depends on the operating system. On a UNIX operating system, it is stored until SAPOSCOL deletes it. On a Microsoft Win-dows NT system, the shared memory is deleted by the operating system if no process is connected with it.
4. The old SAPOSCOL writes the data in the shared memory to the coll.put file in the work-ing directory of SAPOSCOL. The program then ends.
When the host is restarted, the coll.put file is imported so that the combined data in the shared memory is available. If, for example, SAPOSCOL is stopped at 12:03 and is restarted at 14:49, the data until 12:00 is still available for the SAP system. To avoid confusion, invalid data for the time from 12:00 until 14:00 is not displayed in the overview of the last few hours in the operating system monitor.
Delete the file coll.put, if you stop SAPOSCOL in the context of error analysis, as the program imports the (possibly erroneous) measured values from the file to the shared memory segment if it is restarted.
SAP AG Operating System Collector SAPOSCOL September 27, 2004
Page 23 of 47
Operating System Collector SAPOSCOL
4.2 Controlling SAPOSCOL from the Operating System Monitor
You can control and monitor SAPOSCOL within an SAP system using the operating system monitor (transactions ST06 and OS07). You can use the following commands to do this:
• Start and stop SAPOSCOL (to start and stop SAPOSCOL on a remote host, see Controlling SAPOSCOL on Remote Hosts [page 41]).
• Display dev_coll, the SAPOSCOL log file
• Display the current status of SAPOSCOL
• Set and delete the detailed selection (see Minimizing the CPU Workload Caused by SAPOSCOL [page 28]).
Ensure that the SAPOSCOL profile parameters are correctly set (see Working Direc-tory and Profile Parameters for SAPOSCOL [page 16]).
Procedure
1. To call the individual functions in the table, choose Tools → CCMS → Control/Monitoring → Performance Menu → Operating System from the SAP Easy Access Menu.
Function Menu Path
Control SAPOSCOL for the local host → Local → Activity → OS Collector
Control SAPOSCOL for a remote host → Remote → Activity, then choose the desired server on the SAPOSCOL Destination screen, and choose OS Collector
2. Choose the desired command from using the pushbuttons at the top of the screen.
4.3 Controlling SAPOSCOL from the Operating System
You can also control SAPOSCOL directly from the operating system input prompt.
SAPOSCOL must be running for you to be able to use the following commands. Start the operating system collector with the command saposcol –l.
Features
Control SAPOSCOL from the operating system input prompt using the command saposcol <Option>. The following options are possible:
SAP AG Operating System Collector SAPOSCOL September 27, 2004
Page 24 of 47
Operating System Collector SAPOSCOL
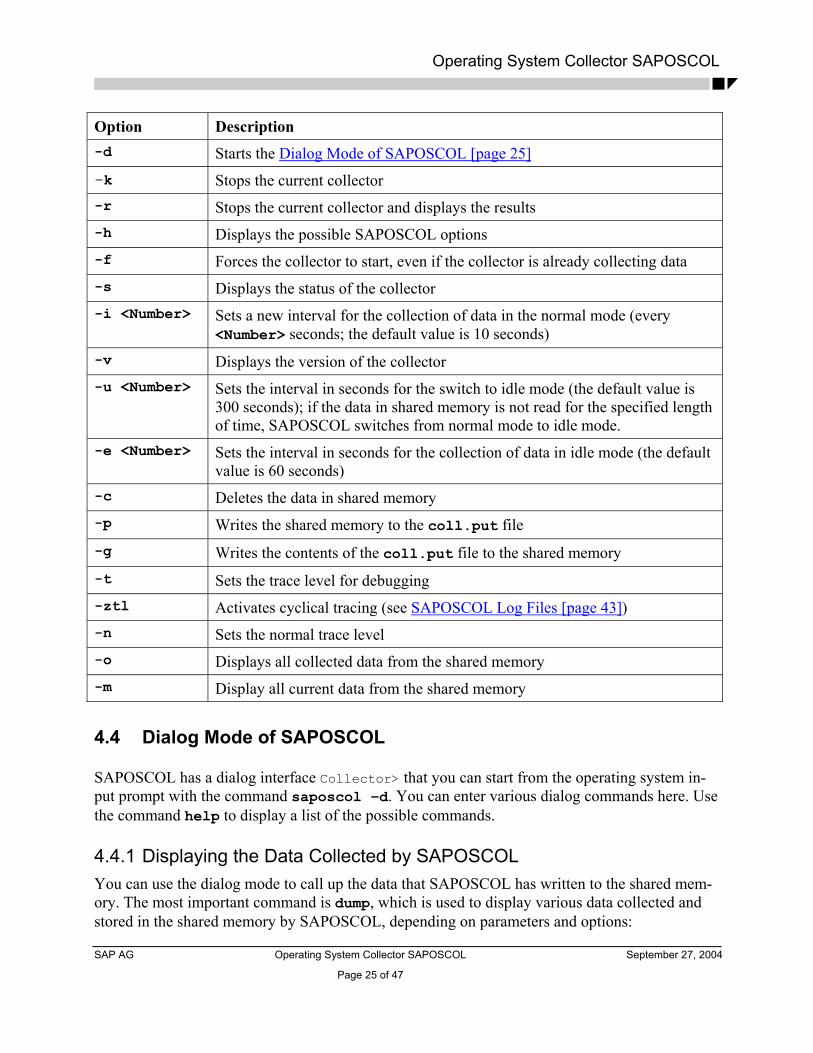
Option Description -d Starts the Dialog Mode of SAPOSCOL [page 25] -k Stops the current collector -r Stops the current collector and displays the results -h Displays the possible SAPOSCOL options -f Forces the collector to start, even if the collector is already collecting data -s Displays the status of the collector -i <Number> Sets a new interval for the collection of data in the normal mode (every
<Number> seconds; the default value is 10 seconds) -v Displays the version of the collector -u <Number> Sets the interval in seconds for the switch to idle mode (the default value is
300 seconds); if the data in shared memory is not read for the specified length of time, SAPOSCOL switches from normal mode to idle mode.
-e <Number> Sets the interval in seconds for the collection of data in idle mode (the default value is 60 seconds)
-c Deletes the data in shared memory -p Writes the shared memory to the coll.put file -g Writes the contents of the coll.put file to the shared memory -t Sets the trace level for debugging -ztl Activates cyclical tracing (see SAPOSCOL Log Files [page 43]) -n Sets the normal trace level -o Displays all collected data from the shared memory -m Display all current data from the shared memory
4.4 Dialog Mode of SAPOSCOL
SAPOSCOL has a dialog interface Collector> that you can start from the operating system in-put prompt with the command saposcol –d. You can enter various dialog commands here. Use the command help to display a list of the possible commands.
4.4.1 Displaying the Data Collected by SAPOSCOL You can use the dialog mode to call up the data that SAPOSCOL has written to the shared mem-ory. The most important command is dump, which is used to display various data collected and stored in the shared memory by SAPOSCOL, depending on parameters and options:
SAP AG Operating System Collector SAPOSCOL September 27, 2004
Page 25 of 47

Operating System Collector SAPOSCOL
dump <parameters> <option>
The following parameters are possible:
Parameter Description CPU CPU Memory Memory Top Largest CPU user Disk Hard disk Filesystem File system Lan LAN Proc Monitoring of selected processes
The following options are possible:
Option Description Single Current value of a single selected parameter All Current values of all parameters accessible in this shared mem-
ory Sum Hourly average values for the last 24 hours of all parameters
accessible in this shared memory
Note that not all of the parameters can be combined with all of the options.
There are also the following uses of the dump command:
Command Description dump config defined
Configured operating system parameters
dump config used
Currently used operating system parameters
dump hour List of the last 24 hours; each of the 24 entries has the format hour: <0-23> of day <number>, where <number> speci-fies whether SAPOSCOL has consistent data for that hour:
0: No data available 1: Current hour 2: Inconsistent data <Datum (JJJJMMTT)>: Data available
SAP AG Operating System Collector SAPOSCOL September 27, 2004
Page 26 of 47

Operating System Collector SAPOSCOL
To display the memory-related operating system data in the shared memory, enter the following command at the Collector> input prompt: dump memory all
The following information is displayed:
Collector> dump memory all Pages paged in / sec 1 Pages paged out / sec 0 KB paged in / sec 4 KB paged out / sec 0 freemem [KB] 13312 physmem [KB] 65536 swap configured [KB] 76348 swap total size [KB] 76348 swap free inside [KB] 72556
4.4.2 Controlling SAPOSCOL in Dialog Mode You can control SAPOSCOL in dialog mode using the following commands at the Collector> input prompt:
Command Description detailson Sets the details flag detailsoff Cancels the details flag Interval <n> Changes the collection interval to <n> seconds (Default = 10) Leave Deletes the shared memory Kill Stops the background process Launch Starts a new collector Force Forces a new collector to start (only in emergencies) status stat
Displays the status of the SAPOSCOL process that is collecting data in the background
The changed values are written to the shared memory. SAPOSCOL reads these values directly before collecting additional data. Only then do the changes take effect.
If you change the collection interval, the collector switches to the new interval only after the expiration of the old interval.
SAP AG Operating System Collector SAPOSCOL September 27, 2004
Page 27 of 47
Operating System Collector SAPOSCOL
Ending Dialog Mode
To leave the dialog mode of SAPOSCOL, use the command quit or the command exit.
4.5 Minimizing the CPU Workload Caused by SAPOSCOL
SAPOSCOL can use a high proportion of operating system resources, as it periodically collects data from the operating system. Which data requires the most resources during collection de-pends on the operating system. You have the following options to minimize the CPU usage of SAPOSCOL:
• Delete the Details Flag
You can control the collection of data by SAPOSCOL by having it collect certain data, the collection of which has a particularly high influence on performance, collected less fre-quently. Which data belongs to this group, depends on the operating system of the monitored host.
By default, the detail flag is set (Details required pushbutton in the operating system monitor; command detailson in dialog mode). To delete the detail flag, choose Details Off in the operating system monitor, or enter the command detailsoff in dialog mode. This setting applies universally.
• Use the SAPOSCOL Idle Mode
If the data is not read from the shared memory during a period of five minutes, SAPOSCOL switches from normal mode to idle mode. In this mode, the collector collects data every min-ute instead of every ten seconds. This is sufficient for a well-founded hourly average value. If a process reads data from the shared memory during idle mode, SAPOSCOL switches back to normal mode.
SAP AG Operating System Collector SAPOSCOL September 27, 2004
Page 28 of 47
Operating System Collector SAPOSCOL
5 Displaying Operating System Data There are three possibilities that you can use to display the data that SAPOSCOL has collected:
• The Operating System Monitor [page 29] displays all data that SAPOSCOL collects.
• The Alert Monitor of the CCMS monitoring architecture contains two monitors that display the data from SAPOSCOL:
o CCMS Monitor Operating System [page 33]
o CCMS Monitor Filesystems [page 37]
• You can use the Dialog Mode of SAPOSCOL [page 25] to display the contents of the local shared memory segment at operating system level.
5.1 Operating System Monitor
You can use the operating system monitor to monitor the data that SAPOSCOL collects. Use the monitor for the local host (transaction ST06) or for another host (transaction OS07). For more detailed information about the operating system monitor, see the online documentation [OS-Mon].
You can also monitor operating system data using the CCMS monitor Operating Sys-tem in transaction RZ20. However, the data displayed there is not as complete as the data displayed in the operating system monitor.
Process Flow
To call the individual functions shown in the table, choose CCMS → Control/ Monitoring → Performance Menu → Operating System.
Function Menu Path Transaction
Call operating system monitor the local server
→ Local → Activity ST06
Call operating system monitor for another host
→ Remote → Activity; then select the desired host on the SAPOSCOL Destination screen
OS07; then select the desired host on the SAPOSCOL Desti-nation screen
In both cases, the system displays performance indicators for the operating system of the desired host. The system displays the description Local or Remote, the host name, and the operating sys-tem platform in the title bar of the screen. The monitor displays the results of the current meas-urement for the following areas:
SAP AG Operating System Collector SAPOSCOL September 27, 2004
Page 29 of 47
Operating System Collector SAPOSCOL
• CPU
• Memory management
• Swap
• Hard disk (the monitor displays the hard disk with the longest response time)
• LAN (Total of all LAN interfaces of the desired host)
To display the measured values of the last 24 hours for an individual area, choose the correspond-ing row. For more information about the specified values, see the section Monitoring Operating System Data [page 7].
The following commands are also available to you in the operating system monitor:
Command Description
Refresh display pushbutton Updates the data on the screen; as SAPOSCOL collects data by default at 10 second intervals, you do not always obtain new data
Detail Analysis Menu pushbutton Displays a screen on which you have the possibility to call detail data for various topics; for information about this data, see:
• CPU [page 7]
• Memory Management [page 9]
• File Systems and LAN [page 10]
• Monitoring Selected Processes [page 11]
OS Collector pushbutton Displays a screen with SAPOSCOL log data; you can also control SAPOSOL here (see Controlling SAPOSCOL from the Operating System Monitor [page 24])
→ Goto → Performance Data-base → Compare all servers
→ Goto → Performance Data-base → Compare recent days
See Displaying Data for the Last 30 Days in the Operating System Monitor [page 31]
→ Goto → Current data → Alert monitor
See CCMS Monitor Operating System [page 33]
→ Goto → Current data → Filesystem monitor
See CCMS Monitor Filesystems [page 37]
For information about the possible operating system monitor errors, see Error Analysis [page 42].
SAP AG Operating System Collector SAPOSCOL September 27, 2004
Page 30 of 47
Operating System Collector SAPOSCOL
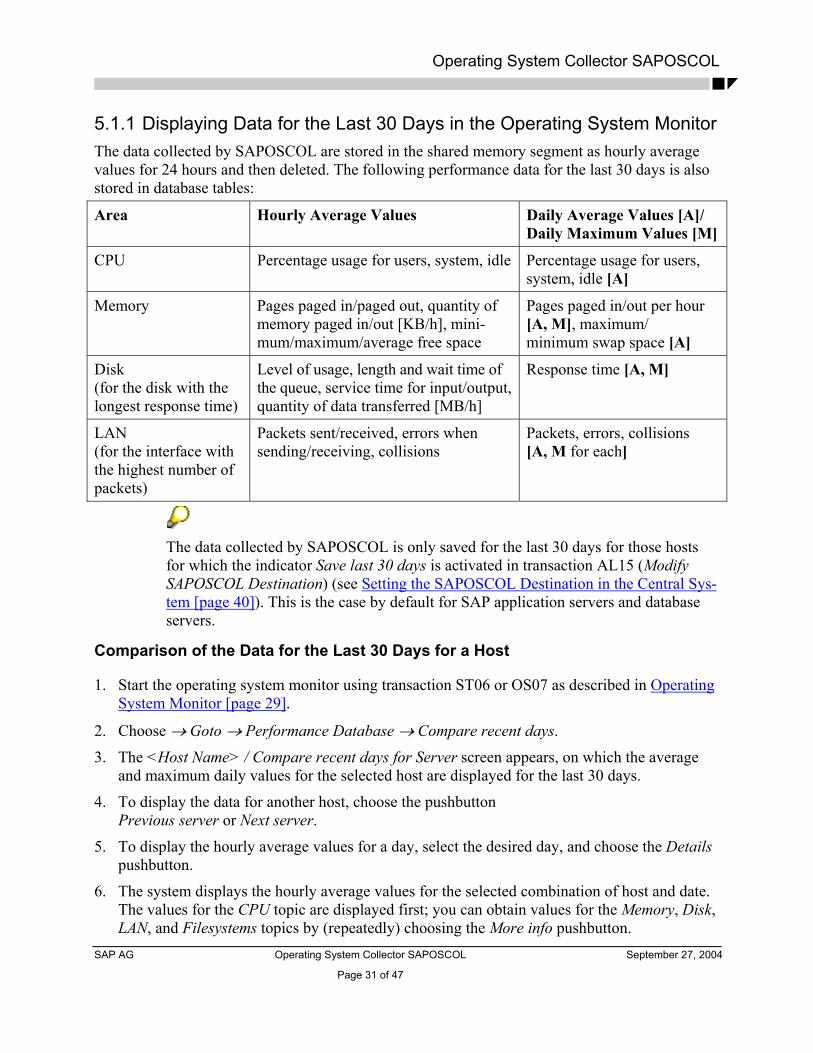
5.1.1 Displaying Data for the Last 30 Days in the Operating System Monitor The data collected by SAPOSCOL are stored in the shared memory segment as hourly average values for 24 hours and then deleted. The following performance data for the last 30 days is also stored in database tables:
Area Hourly Average Values Daily Average Values [A]/ Daily Maximum Values [M]
CPU Percentage usage for users, system, idle Percentage usage for users, system, idle [A]
Memory Pages paged in/paged out, quantity of memory paged in/out [KB/h], mini-mum/maximum/average free space
Pages paged in/out per hour [A, M], maximum/ minimum swap space [A]
Disk (for the disk with the longest response time)
Level of usage, length and wait time of the queue, service time for input/output, quantity of data transferred [MB/h]
Response time [A, M]
LAN (for the interface with the highest number of packets)
Packets sent/received, errors when sending/receiving, collisions
Packets, errors, collisions [A, M for each]
The data collected by SAPOSCOL is only saved for the last 30 days for those hosts for which the indicator Save last 30 days is activated in transaction AL15 (Modify SAPOSCOL Destination) (see Setting the SAPOSCOL Destination in the Central Sys-tem [page 40]). This is the case by default for SAP application servers and database servers.
Comparison of the Data for the Last 30 Days for a Host
1. Start the operating system monitor using transaction ST06 or OS07 as described in Operating System Monitor [page 29].
2. Choose → Goto → Performance Database → Compare recent days.
3. The <Host Name> / Compare recent days for Server screen appears, on which the average and maximum daily values for the selected host are displayed for the last 30 days.
4. To display the data for another host, choose the pushbutton Previous server or Next server.
5. To display the hourly average values for a day, select the desired day, and choose the Details pushbutton.
6. The system displays the hourly average values for the selected combination of host and date. The values for the CPU topic are displayed first; you can obtain values for the Memory, Disk, LAN, and Filesystems topics by (repeatedly) choosing the More info pushbutton.
SAP AG Operating System Collector SAPOSCOL September 27, 2004
Page 31 of 47

Operating System Collector SAPOSCOL
Comparison of Data for Different Hosts
1. Start the operating system using transaction ST06 or OS07, as described in Operating System Monitor [page 29].
2. Choose → Goto → Performance Database → Compare all servers.
3. The <Date> / Compare all servers for date screen appears, on which the saved daily average and maximum values for the selected day are displayed for all hosts.
4. To view the data for a different date, choose the Previous day or Next day pushbuttons.
5. To display the hourly average values for any host, select the desired host and choose the De-tails pushbutton.
6. As with the previous procedure, the system displays the hourly average values for the selected combination of host and date.
5.2 Alert Monitor
The Alert Monitor is the display tool of the monitoring architecture, with which you can centrally monitor any IT landscapes. For more detailed information about the Alert Monitor, see the online documentation [AlMon]. There is also a document introducing the predefined monitors of the Alert Monitor [StdMon].
The following are the main differences to the way in which data is displayed in the operating system monitor:
• In the Alert Monitor, you can use alerts, which report errors quickly and reliably - such as when a reported value exceeds or falls below a particular threshold value, or a component is inactive for a defined period of time. These alerts are displayed in the Alert Monitor; this re-duces the workload of the system administration, as they must only watch the problem mes-sages instead of monitoring large amounts of system data. You can also set automatic system reactions (auto-reaction methods) in the case of an alert, such as informing the administrator by e-mail, pager, or SMS.
• The data is displayed in a hierarchically organized tree, grouped by the monitored hosts. In this way, you can display the data for the various hosts without restarting the monitor.
• The display in the Alert Monitor includes a section of the data that is displayed in the operat-ing system monitor.
• You can create your own CCMS monitors that display exactly the data that is important for your work.
SAP AG Operating System Collector SAPOSCOL September 27, 2004
Page 32 of 47

Operating System Collector SAPOSCOL
5.2.1 CCMS Monitor Operating System This monitor displays the data collected by SAPOSCOL in a tree structure, grouped by the dif-ferent hosts and application servers on which SAPOSCOL is running. The CCMS monitor oper-ating system is assigned as the analysis method to most nodes of this monitor.
To start the monitor, follow the procedure below:
1. Start the Alert Monitor by calling transaction RZ20, or choose CCMS → Control/Monitoring → Alert Monitor.
2. On the CCMS Monitor Sets screen, expand the SAP CCMS Monitor Templates monitor set.
3. From the monitor list, start the Operating System monitor by double clicking it.
C u r r e n t S t a t u s ( 20.08.2001 , 17:13:45 )
Operating System
Host1_CEN_01
Filesystems
The monitor creates a subtree for every host on whichthe operaring system collector SAPOSCOL is running
-Node Display Off
CPU
CPU_Utilization 12 %5minLoadAverage 0.1 QL
, green 20.08.2001, 17:08:05
Paging
Page_In 0 Pg/SPage_Out 170 Pg/S
, green 20.08.2001, 17:08:04
Commit_Charge
CommitChargeFree 3439 MBCommit_Percent 65 %
, green 20.08.2001, 17:08:05
OS_Collector
State OS collector (SAPOSCOL) is running, green 20.08.2001, 17:12:30
LAN
PacketsIn 51 /SPacketsOut 30 /S
, green 20.08.2001, 17:12:31
Collisions 0
MS TCP L
, green 20.08.2001, 17:12:31
, green 20.08.2001, 17:08:04
, green 20.08.2001, 17:08:05
, green 20.08.2001, 17:12:31, green 20.08.2001, 17:12:31
CPUCPU utilization andaverage number ofwaiting processes
PagingPage-ins and page-outs per second
Commit ChargeUtilization of the entirememory (physical andvirutal)
Monitored file systems on the host (seeFilesystems monitor)
Status of SAPOSCOL
Local Area NetworkUtilization broken downby interfaces on thishost
Monitored Processes Monitored processes
SAP AG Operating System Collector SAPOSCOL September 27, 2004
Page 33 of 47
Operating System Collector SAPOSCOL
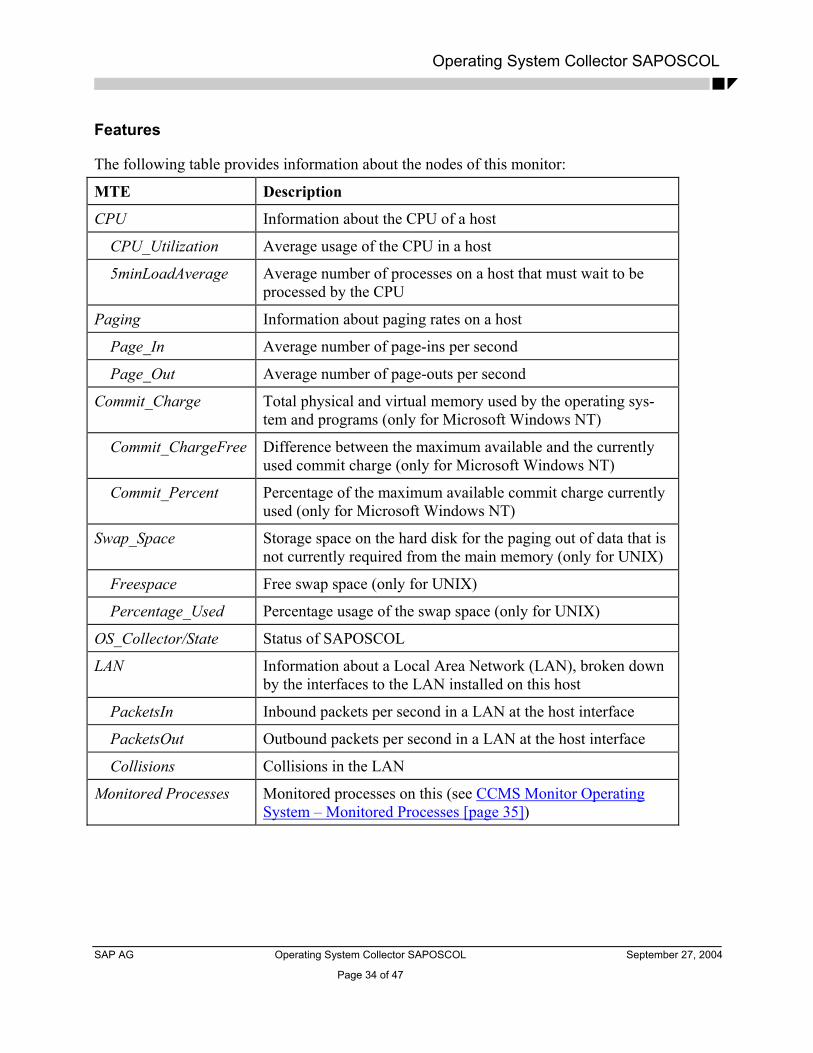
Features
The following table provides information about the nodes of this monitor:
MTE Description
CPU Information about the CPU of a host
CPU_Utilization Average usage of the CPU in a host
5minLoadAverage Average number of processes on a host that must wait to be processed by the CPU
Paging Information about paging rates on a host
Page_In Average number of page-ins per second
Page_Out Average number of page-outs per second
Commit_Charge Total physical and virtual memory used by the operating sys-tem and programs (only for Microsoft Windows NT)
Commit_ChargeFree Difference between the maximum available and the currently used commit charge (only for Microsoft Windows NT)
Commit_Percent Percentage of the maximum available commit charge currently used (only for Microsoft Windows NT)
Swap_Space Storage space on the hard disk for the paging out of data that is not currently required from the main memory (only for UNIX)
Freespace Free swap space (only for UNIX)
Percentage_Used Percentage usage of the swap space (only for UNIX)
OS_Collector/State Status of SAPOSCOL
LAN Information about a Local Area Network (LAN), broken down by the interfaces to the LAN installed on this host
PacketsIn Inbound packets per second in a LAN at the host interface
PacketsOut Outbound packets per second in a LAN at the host interface
Collisions Collisions in the LAN
Monitored Processes Monitored processes on this (see CCMS Monitor Operating System – Monitored Processes [page 35])
SAP AG Operating System Collector SAPOSCOL September 27, 2004
Page 34 of 47

Operating System Collector SAPOSCOL
Procedure if an Alert Is Triggered
The following table provides information about what to do if an alert is triggered in this monitor:
MTE Procedure
Commit_Charge
Commit_ChargeFree
Commit_Percent
If the available commit charge falls below the threshold value for a long period of time, you should increase the value of the entire commit charge in the operating system. Note, however, that a large virtual memory causes more paging if there is not enough main memory available.
Swap_Space
Freespace
Percentage_Used
If an alert is repeatedly generated in this subtree, you should increase the available swap space (for guidelines about the size of the swap space, see SAP Notes 0146289 and 0146528).
OS_Collector/State If the operating system collector is not running on a system, you should restart SAPOSCOL.
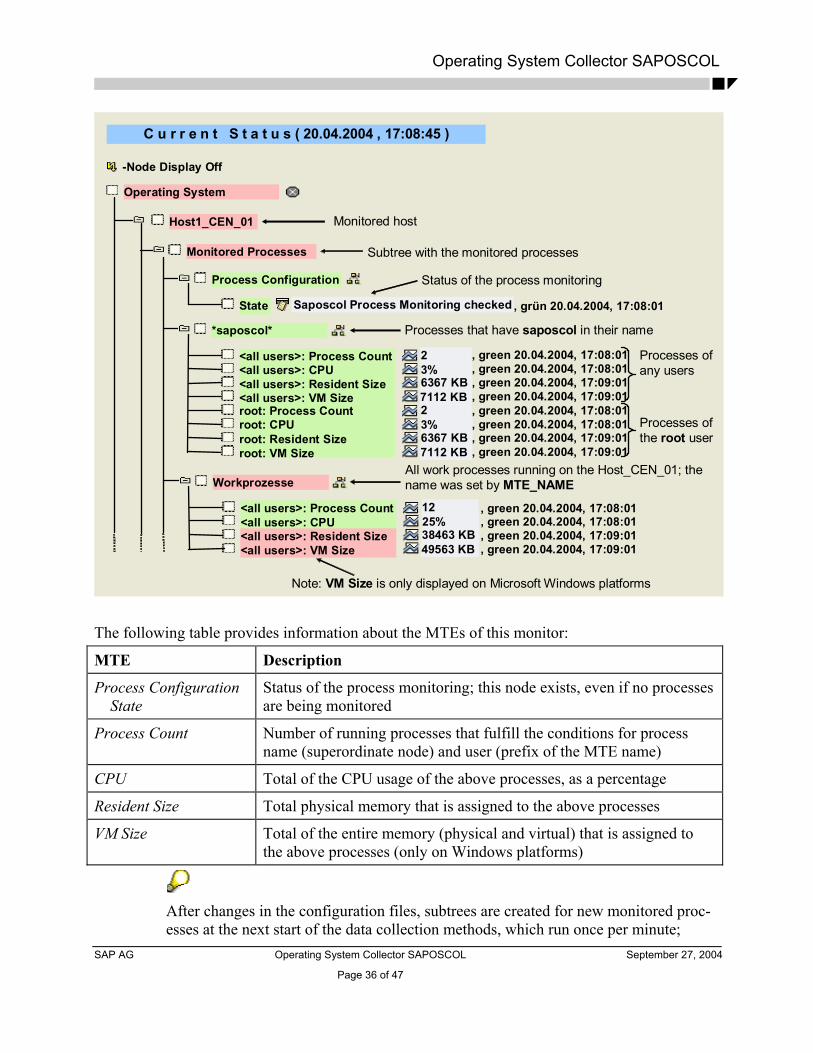
5.2.2 CCMS Monitor Operating System – Monitored Processes The data about the monitored processes is displayed in the CCMS monitor Operating System in the Monitored Processes subtree (see Setting Up Process Monitoring [page 17]):
SAP AG Operating System Collector SAPOSCOL September 27, 2004
Page 35 of 47
Operating System Collector SAPOSCOL
C u r r e n t S t a t u s ( 20.04.2004 , 17:08:45 )
Monitored host
Operating System
Host1_CEN_01
Processes that have saposcol in their name*saposcol*
Monitored Processes Subtree with the monitored processes
xxx
Processes of any users
-Node Display Off
<all users>: Process Count 2<all users>: CPU 3%<all users>: Resident Size
7112 KB, green 20.04.2004, 17:09:01
<all users>: VM Size6367 KB
, green 20.04.2004, 17:08:01
Workprozesse
xxx
<all users>: Process Count 12<all users>: CPU 25%<all users>: Resident Size
49563 KB<all users>: VM Size38463 KB
xxx
root: Process Count 2root: CPU 3%root: Resident Size
7112 KB
, green 20.04.2004, 17:09:01
root: VM Size6367 KB
, green 20.04.2004, 17:08:01
, green 20.04.2004, 17:09:01
, green 20.04.2004, 17:08:01
, green 20.04.2004, 17:09:01
, green 20.04.2004, 17:08:01
, green 20.04.2004, 17:09:01
, green 20.04.2004, 17:08:01
, green 20.04.2004, 17:09:01
, green 20.04.2004, 17:08:01
Processes of the root user
All work processes running on the Host_CEN_01; the name was set by MTE_NAME
Status of the process monitoringProcess Configuration
State Saposcol Process Monitoring checked , grün 20.04.2004, 17:08:01
Note: VM Size is only displayed on Microsoft Windows platforms
The following table provides information about the MTEs of this monitor:
MTE Description
Process Configuration State
Status of the process monitoring; this node exists, even if no processes are being monitored
Process Count Number of running processes that fulfill the conditions for process name (superordinate node) and user (prefix of the MTE name)
CPU Total of the CPU usage of the above processes, as a percentage
Resident Size Total physical memory that is assigned to the above processes
VM Size Total of the entire memory (physical and virtual) that is assigned to the above processes (only on Windows platforms)
After changes in the configuration files, subtrees are created for new monitored proc-esses at the next start of the data collection methods, which run once per minute;
SAP AG Operating System Collector SAPOSCOL September 27, 2004
Page 36 of 47

Operating System Collector SAPOSCOL
processes that are no longer monitored are first set to inactive after around five min-utes (you can identify this due to the gray color) and then deleted after another five minutes.
5.2.3 CCMS Monitor Filesystems This monitor displays a section of the CCMS monitor Operating System. You can use this moni-tor to monitor the filesystems of any application systems and host systems and to check whether there is still enough free hard disk space available.
To start the monitor, follow the procedure below:
1. Start the Alert Monitor using transaction RZ20, or choose CCMS → Control/Monitoring → Alert Monitor.
2. On the CCMS Monitor Sets screen, expand the SAP CCMS Monitor Templates monitor set.
3. Start the Filesystems monitor from the list by double clicking it.
C u r r e n t S t a t u s ( 20.08.2001 , 17:08:45 )
Filesystems
CEN\Host1_CEN_01\...\C:
Monitored file systems on a system(here: CEN)
-Node Display Off
C11\Host2_C11_01\...\D:
NameFreespacePercentage_Used 100 %
D:0 MB , red 20.08.2001 , 17:08:31
, yellow 20.08.2001 , 17:08:31
CEN\Host1_CEN_01\...\D:CEN\Host1_CEN_01\...\E:CEN\Host1_CEN_01\...\_Total:
C11\Host2_C11_01\...\C:
C11\Host2_C11_01\...\E:C11\Host2_C11_01\...\_Total:
CEN\Host2_CEN_01\...\C:CEN\Host2_CEN_01\...\D:CEN\Host2_CEN_01\...\E:CEN\Host2_CEN_01\...\_Total:C11\Host1_C11_01\...\C:C11\Host1_C11_01\...\D:C11\Host1_C11_01\...\E:C11\Host1_C11_01\...\_Total:
Monitored file systems on a hostsystem (here: Host1_C11_01)
Free storage space and percentage usage ofall file systems on a host system
Name of the file system
Percentage usage
Free storage space
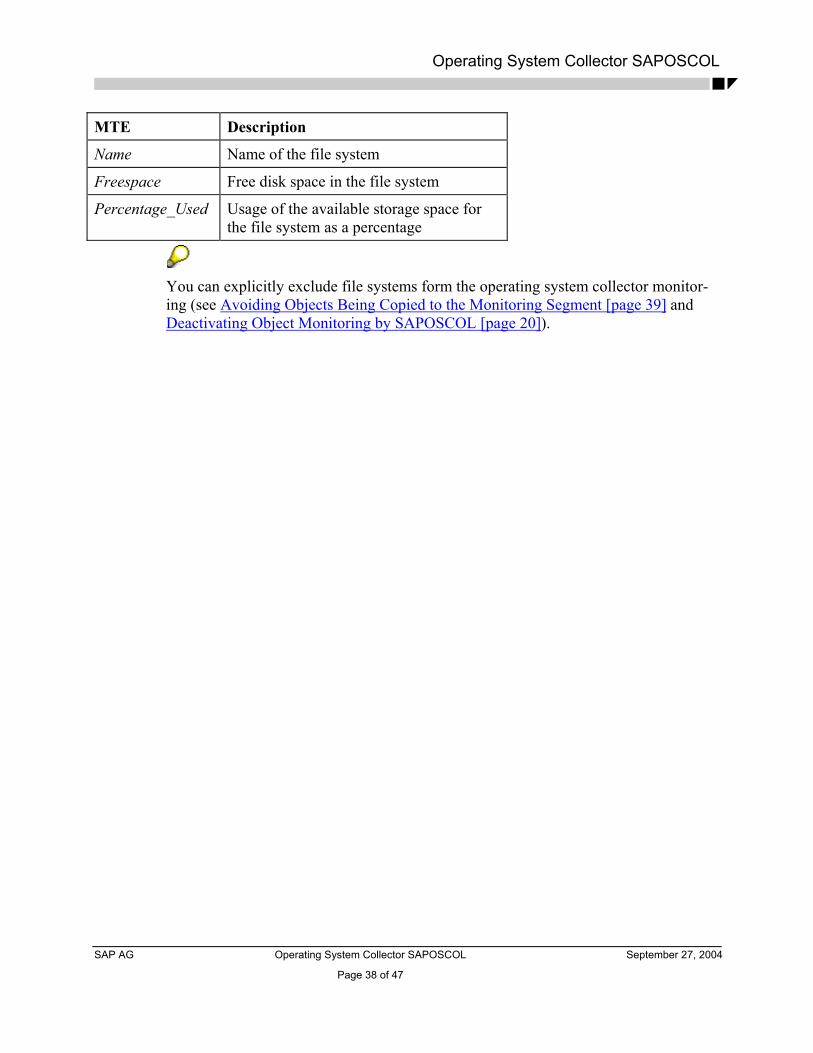
Features
The following table provides information about the nodes of this monitor:
SAP AG Operating System Collector SAPOSCOL September 27, 2004
Page 37 of 47
Operating System Collector SAPOSCOL
MTE Description
Name Name of the file system
Freespace Free disk space in the file system
Percentage_Used Usage of the available storage space for the file system as a percentage
You can explicitly exclude file systems form the operating system collector monitor-ing (see Avoiding Objects Being Copied to the Monitoring Segment [page 39] and Deactivating Object Monitoring by SAPOSCOL [page 20]).
SAP AG Operating System Collector SAPOSCOL September 27, 2004
Page 38 of 47

Operating System Collector SAPOSCOL
6 SAPOSCOL and CCMS Agents All CCMS agents can copy data from the SAPOSCOL shared memory segment to the CCMS monitoring segment and transfer it to a central monitoring system. This means that the data is visible in the CCMS monitoring architecture and is displayed both in the familiar transactions ST06 and OS07 and in the Alert Monitor (transaction RZ20). For more information about this, see the CCMS agents manual [Agents]. In this way, you can monitor operating system data for hosts without a running SAP Basis System. An expensive installation and configuration of RFCOSCOL is no longer required.
The central monitoring system must have a release status of at least SAP Basis 4.6B. Take account of SAP Note 371023, as Support Packages may be required.
6.1 Avoiding Objects Being Copied to the Monitoring Segment
If you are using an agent to transfer the SAPOSCOL data to a central monitoring system, you can use the transfer of the data from the SAPOSCOL shared memory segment to the CCMS monitor-ing segment to remove certain data that is not to be displayed. You can do this by specifying a configuration file that specifies which SAPOSCOL data is not to be copied to the monitoring architecture segment. In this way, you can remove file systems and components from the moni-toring segment.
This is, for example, useful, if you monitor file systems with a rule-based monitor, but want to exclude certain file systems that are always 100% full from this monitoring.
The hidden data is still collected by SAPOSCOL; it is simply no longer copied to the CCMS monitoring segment and is not displayed in the Alert Monitor [page 32] .
Every agent has the configuration file SAPCCMSR.INI in its working directory (for more infor-mation, see the CCMS agents manual [Agents]). In this file, enter the line OSColFile <File path of the filter file>.
The filter file contains information about the components and file systems that are not to be monitored. You can remove the file systems from the CCMS monitoring segment using the pa-rameter FilterOutFilesystem ; you can use the parameter FilterOutComponent to re-move entire components from the CCMS monitoring segment.
SAP AG Operating System Collector SAPOSCOL September 27, 2004
Page 39 of 47
Operating System Collector SAPOSCOL
The following lines are contained in the configuration file SAPCCMSR.INI : ### Format of entries for mechanism to filter out ### SAPOSCOL values: OsColFile d:\usr\sap\TVB\D26\log\sapccm4x\oscol.ini
The specified file oscol.ini contains the following lines: FilterOutComponent LAN FilterOutFilesystem d:\test
No more values are displayed in the monitoring architecture for the file system d:\test or for values for the LAN.
6.2 Setting the SAPOSCOL Destination in the Central System
If you are using CCMS agents, you can display the data collected by SAPOSCOL not only for the local system, but also for remote systems. This means that all possible data for remote SAP application servers and their database servers (specified using the parameter SAPDBHOST) is available to you in the operating system monitor.
For any hosts or dedicated database servers, this applies only for the data for the last 24 hours. The data for the last 30 days is only stored if you maintain the SAPOSCOL destination:
1. Install SAPOSCOL and the appropriate CCMS agent [Agents] on the host.
2. Start transaction AL15 (SAPOSCOL Destination) in the central system.
3. Enter the SAPOSCOL destination of the remote host. If the connection uses a CCMS agent, this is the RFC destination of the CCMS agent on this host. For agent SAPCCMSR (which monitors any hosts with no SAP system), the destination has the name structure SAPCCMSR.<Hostname>.99.
4. To edit the destination, choose Modify. The Modify SAPOSCOL Destination screen appears. The individual fields have the following meanings:
Field Description
Text Description of the destination
DB Server This indicator is activated for a database server; its values for the last 30 days are then automatically available.
Save last 30 days Select this indicator if you want to save the values collected by SAPOSCOL in the operating system monitor for 30 days (see Displaying Data for the Last 30 Days in the Operating System Moni-tor [page 31]).
5. Save your entries.
SAP AG Operating System Collector SAPOSCOL September 27, 2004
Page 40 of 47
Operating System Collector SAPOSCOL
6.3 Controlling SAPOSCOL on Remote Hosts
If a CCMS agent is running on a remote host that is registered with a central system, you can start and stop SAPOSCOL and display its dev_coll log file in the operating system monitor (trans-action OS07) of this system.
Prerequisites
The agent of the remote host must have the following information in its profile:
• To start and stop SAPOSCOL, the agent requires the complete path of SAPOSCOL in the profile parameter exe/saposcol.
• To display dev_coll, the agent requires the working directory of SAPOSCOL in the profile parameter DIR_PERF
If you start or stop SAPOSCOL using a CCMS agent, the agent uses its profile to start and stop SAPOSCOL. The newly started SAPOSCOL therefore has DIR_PERF of the agent as its work-ing directory. This means that the agent has a connection to exactly one version of the SAPOSCOL program, so that there is no confusion if there are multiple installed versions of SAPOSCOL.
If you first stop and then restart SAPOSCOL using an agent, the working directory of SAPOSCOL can adjust to the working directory of the agent. This means that data is not lost.
Two examples:
• The SAPCCMSR agent with the working directory /usr/sap/agents is to be able to start and stop /usr/sap/tmp/saposcol. The agent must therefore be started with a profile: sapccmsr -<parameters> pf=AgentProfile.pfl
with AgentProfile.pfl: DIR_PERF=/usr/sap/agents exe/saposcol=/usr/sap/tmp/saposcol
SAPOSCOL therefore automatically uses DIR_PERF of the agent.
• The SAPCCM4X agent is to be able to start and stop C:\usr\sap\CEN\SYS\exe\run\saposcol.exe. SAPOSCOL has the work-ing directory C:\saploc\PRFCLOG. The agent was started with: sapccm4x -<parameters> pf=<SAPInstanceProfile>
with <SAPInstanceProfile>: DIR_PERF=C:\saploc\PRFCLOG exe/saposcol=C:\usr\sap\BCE\SYS\exe\ run\saposcol.exe
SAPOSCOL uses DIR_PERF as its working directory.
SAP AG Operating System Collector SAPOSCOL September 27, 2004
Page 41 of 47
Operating System Collector SAPOSCOL
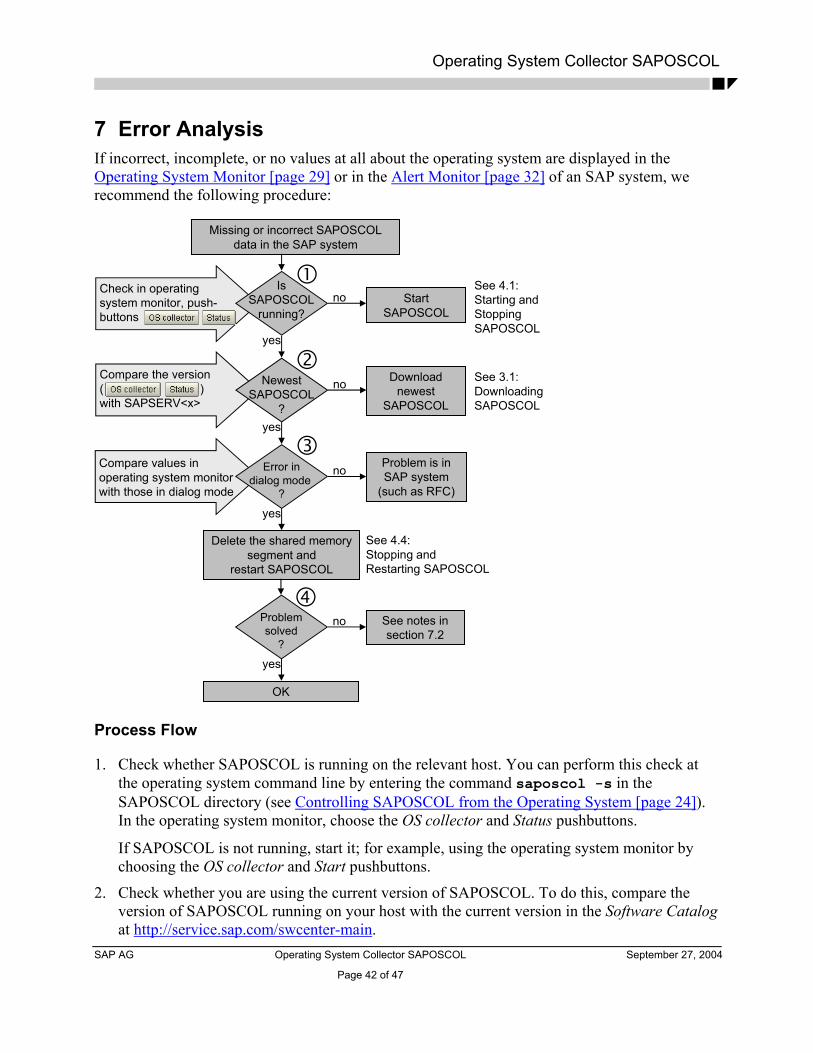
7 Error Analysis If incorrect, incomplete, or no values at all about the operating system are displayed in the Operating System Monitor [page 29] or in the Alert Monitor [page 32] of an SAP system, we recommend the following procedure:
Missing or incorrect SAPOSCOLdata in the SAP system
StartSAPOSCOL
IsSAPOSCOL
running?no
yes
Downloadnewest
SAPOSCOL
Problem is inSAP system
(such as RFC)
NewestSAPOSCOL
?
no
yes
Error indialog mode
?
no
yes
Delete the shared memorysegment and
restart SAPOSCOL
Problemsolved
?
no
yes
OK
See notes insection 7.2
Check in operatingsystem monitor, push-buttons
Compare the version( )with SAPSERV<x>
Compare values inoperating system monitorwith those in dialog mode
See 4.1:Starting andStoppingSAPOSCOL
See 3.1:DownloadingSAPOSCOL
See 4.4:Stopping andRestarting SAPOSCOL
Process Flow
1. Check whether SAPOSCOL is running on the relevant host. You can perform this check at the operating system command line by entering the command saposcol -s in the SAPOSCOL directory (see Controlling SAPOSCOL from the Operating System [page 24]). In the operating system monitor, choose the OS collector and Status pushbuttons.
If SAPOSCOL is not running, start it; for example, using the operating system monitor by choosing the OS collector and Start pushbuttons.
2. Check whether you are using the current version of SAPOSCOL. To do this, compare the version of SAPOSCOL running on your host with the current version in the Software Catalog at http://service.sap.com/swcenter-main.
SAP AG Operating System Collector SAPOSCOL September 27, 2004
Page 42 of 47

Operating System Collector SAPOSCOL
If the version numbers are not identical, download the newest version (see Downloading SAPOSCOL [page 12]), stop the running version and start the new SAPOSCOL (see Starting and Stopping SAPOSCOL [page 22]).
3. Compare the values displayed values in the Operating System Monitor [page 29] and in the Dialog Mode of SAPOSCOL [page 25].
If the values are identical and the incorrect values are therefore already present in the SAPOSCOL shared memory segment, the SAP system is not the cause of the problem. In this case, restart SAPOSCOL (see Starting and Stopping SAPOSCOL [page 22]) and delete the shared memory segment.
4. If the problems persist after a restart, you can find notes for correcting the errors, some of which are platform-dependent under Notes for Incorrect Data Display [page 45].
7.1 SAPOSCOL Log Files
The following files for the function of SAPOSCOL are stored in the Working Directory [page 16]:
• The file coll.put, in which SAPOSCOL writes the contents of its shared memory segment; this is performed only when SAPOSCOL is stopped and on user command.
• The configuration file for monitoring selected processes, dev_proc (see Setting Up Process Monitoring [page 17]).
• The file dev_filter that contains the file systems and disks that are not to be monitored by SAPOSCOL (see Deactivating Object Monitoring by SAPOSCOL [page 20]).
• The log file dev_coll that contains SAPOSCOL messages and the status of SAPOSCOL.
During error analysis of SAPOSCOL, you should also check the file dev_coll.
SAP AG Operating System Collector SAPOSCOL September 27, 2004
Page 43 of 47
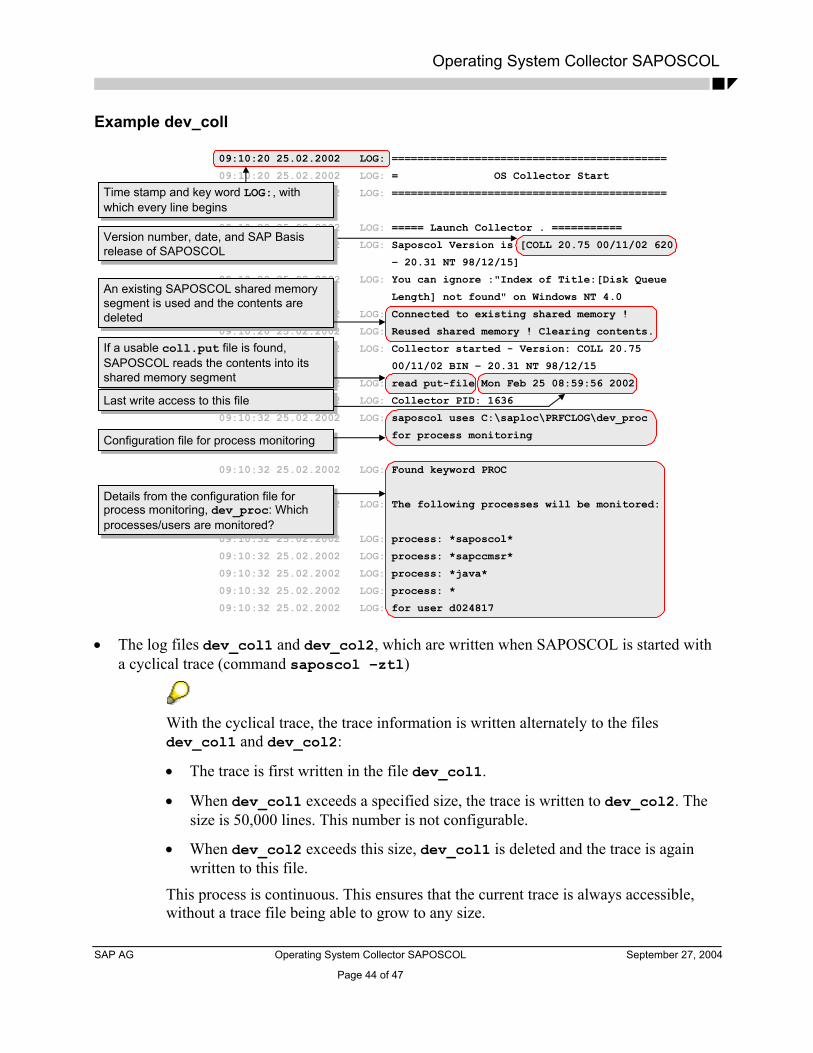
Operating System Collector SAPOSCOL
Example dev_coll
09:10:20 25.02.2002 LOG: ===========================================
09:10:20 25.02.2002 LOG: = OS Collector Start
09:10:20 25.02.2002 LOG: ===========================================
09:10:20 25.02.2002 LOG: ===== Launch Collector . ===========
09:10:20 25.02.2002 LOG: Saposcol Version is [COLL 20.75 00/11/02 620
– 20.31 NT 98/12/15]
09:10:20 25.02.2002 LOG: You can ignore :"Index of Title:[Disk Queue
Length] not found" on Windows NT 4.0
09:10:20 25.02.2002 LOG: Connected to existing shared memory !
09:10:20 25.02.2002 LOG: Reused shared memory ! Clearing contents.
09:10:21 25.02.2002 LOG: Collector started - Version: COLL 20.75
00/11/02 BIN – 20.31 NT 98/12/15
09:10:22 25.02.2002 LOG: read put-file Mon Feb 25 08:59:56 2002
09:10:22 25.02.2002 LOG: Collector PID: 1636
09:10:32 25.02.2002 LOG: saposcol uses C:\saploc\PRFCLOG\dev_proc
for process monitoring
09:10:32 25.02.2002 LOG: Found keyword PROC
09:10:32 25.02.2002 LOG: The following processes will be monitored:
09:10:32 25.02.2002 LOG: process: *saposcol*
09:10:32 25.02.2002 LOG: process: *sapccmsr*
09:10:32 25.02.2002 LOG: process: *java*
09:10:32 25.02.2002 LOG: process: *
09:10:32 25.02.2002 LOG: for user d024817
Time stamp and key word LOG:, withwhich every line beginsTime stamp and key word LOG:, withwhich every line begins
Version number, date, and SAP Basisrelease of SAPOSCOLVersion number, date, and SAP Basisrelease of SAPOSCOL
An existing SAPOSCOL shared memorysegment is used and the contents aredeleted
An existing SAPOSCOL shared memorysegment is used and the contents aredeleted
If a usable coll.put file is found,SAPOSCOL reads the contents into itsshared memory segment
If a usable coll.put file is found,SAPOSCOL reads the contents into itsshared memory segment
Last write access to this fileLast write access to this file
Configuration file for process monitoringConfiguration file for process monitoring
Details from the configuration file forprocess monitoring, dev_proc: Whichprocesses/users are monitored?
Details from the configuration file forprocess monitoring, dev_proc: Whichprocesses/users are monitored?
• The log files dev_col1 and dev_col2, which are written when SAPOSCOL is started with
a cyclical trace (command saposcol –ztl)
With the cyclical trace, the trace information is written alternately to the files dev_col1 and dev_col2:
• The trace is first written in the file dev_col1.
• When dev_col1 exceeds a specified size, the trace is written to dev_col2. The size is 50,000 lines. This number is not configurable.
• When dev_col2 exceeds this size, dev_col1 is deleted and the trace is again written to this file.
This process is continuous. This ensures that the current trace is always accessible, without a trace file being able to grow to any size.
SAP AG Operating System Collector SAPOSCOL September 27, 2004
Page 44 of 47

Operating System Collector SAPOSCOL
7.2 Notes for Incorrect Data Display
Symptom Cause Solution
The saving of this data is not explicitly activated in transac-tion AL15.
See Displaying Data for the Last 30 Days in the Operating System Monitor [page 31]
The database tables are not filled regularly.
Check the reports RSHOSTDB and RSHOSTDC in accordance with SAP Note 12103.
No data is displayed for the following functions of the op-erating system monitor:
• Compare recent days
• Compare all servers
The database table entries are deleted too early during the reorganization (up to SAP Basis 4.6A).
See SAP Note 336120
SAPOSCOL does not have the correct authorizations (UNIX).
Set the authorizations (see Installation Under UNIX [page 14]).
No values are displayed in the operating system monitor, or problems with the shared memory are reported. The shared memory segment
with key 1002 was changed. Check in the profiles of all instances whether the parame-ter ipc/shm_psize_1002 is set and delete it.
No values are displayed for the hard disks under Microsoft Windows NT/2000.
The performance counter diskperf is not activated.
Activate it with the command diskperf –Y.
Incorrect data is displayed in the operating system monitor under Microsoft Windows NT.
The file PDH.DLL does not exist in the Microsoft Win-dows NT system directory.
Install the file (see Installation Under Microsoft Windows [page 15]).
The log files for the operating system (OS Log) and for SAPOSCOL (OS Collector → Log File) are not displayed.
See SAP Notes 189072 and 178719
Hardware Info is not dis-played in the operating system monitor.
Not every operating system provides this function; cur-rently, HP-UX, NT, AS400, DEC, and SUN provide the relevant data about the hard-ware configuration.
SAP AG Operating System Collector SAPOSCOL September 27, 2004
Page 45 of 47
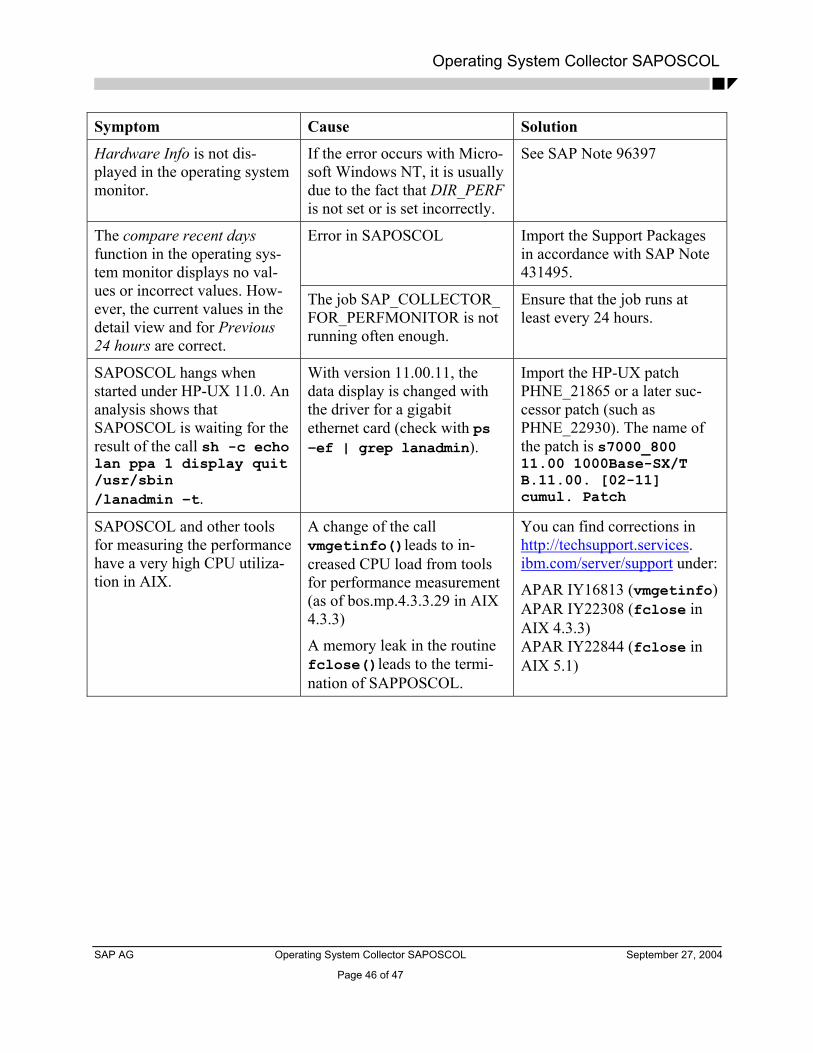
Operating System Collector SAPOSCOL
Symptom Cause Solution
Hardware Info is not dis-played in the operating system monitor.
If the error occurs with Micro-soft Windows NT, it is usually due to the fact that DIR_PERF is not set or is set incorrectly.
See SAP Note 96397
Error in SAPOSCOL Import the Support Packages in accordance with SAP Note 431495.
The compare recent days function in the operating sys-tem monitor displays no val-ues or incorrect values. How-ever, the current values in the detail view and for Previous 24 hours are correct.
The job SAP_COLLECTOR_ FOR_PERFMONITOR is not running often enough.
Ensure that the job runs at least every 24 hours.
SAPOSCOL hangs when started under HP-UX 11.0. An analysis shows that SAPOSCOL is waiting for the result of the call sh -c echo lan ppa 1 display quit /usr/sbin /lanadmin –t.
With version 11.00.11, the data display is changed with the driver for a gigabit ethernet card (check with ps –ef | grep lanadmin).
Import the HP-UX patch PHNE_21865 or a later suc-cessor patch (such as PHNE_22930). The name of the patch is s7000_800 11.00 1000Base-SX/T B.11.00. [02-11] cumul. Patch
SAPOSCOL and other tools for measuring the performance have a very high CPU utiliza-tion in AIX.
A change of the call vmgetinfo()leads to in-creased CPU load from tools for performance measurement (as of bos.mp.4.3.3.29 in AIX 4.3.3)
A memory leak in the routine fclose()leads to the termi-nation of SAPPOSCOL.
You can find corrections in http://techsupport.services. ibm.com/server/support under:
APAR IY16813 (vmgetinfo)APAR IY22308 (fclose in AIX 4.3.3) APAR IY22844 (fclose in AIX 5.1)
SAP AG Operating System Collector SAPOSCOL September 27, 2004
Page 46 of 47
Operating System Collector SAPOSCOL
SAP AG Operating System Collector SAPOSCOL September 27, 2004
Page 47 of 47
8 Additional Information
[OSMon] Online documentation for the Operating System Monitor
Start the SAP Help Portal (http://help.sap.com), and choose Documentation → SAP NetWeaver → English, and from there SAP Library → SAP NetWeaver → Solution Life Cycle Management → Solution Monitoring → Monitoring in the CCMS → Operating System Monitor (direct link).
[AlMon] Online documentation for the Alert Monitor
Start the SAP Help Portal (http://help.sap.com), and choose Documentation → SAP NetWeaver → English, and from there SAP Library → SAP NetWeaver → Solution Life Cycle Management → Solution Monitoring → Monitoring in the CCMS → The Alert Monitor (direct link).
[StdMon] Predefined Monitors for the Alert Monitor
Start the SAP Service Marketplace, and go to the System Monitoring and Alert Management area (http://service.sap.com/monitoring). Choose Media Library → Documentation, and choose Predefined Monitors from the list of documents (direct link).
[Agents] Documentation for the CCMS Agents
Start the SAP Service Marketplace, and go to the area System Monitoring and Alert Management (http://service.sap.com/monitoring). Choose Media Library → Documentation, and then choose the document CCMS Agents: Properties, Installation, and Operation from the list (direct link).