optical tweezers: principles and selected applications tweezers.pdf · optical tweezers: principles...
TRANSCRIPT

OPTICAL TWEEZERS: PRINCIPLES AND SELECTED
APPLICATIONS
Matti Kinnunen, Adjunct Professor
University of Oulu

University of Oulu University of Oulu
Content ‒ Basics of optical trapping
‒ Optical tweezers setup
‒ Calibration of tweezers
‒ Light matter interaction/elastic light
scattering
‒ Force measurements
‒ Conclusions
‒ Acknowledgments

University of Oulu University of Oulu
Principles of optical trapping
Scattering force:
- In the direction of light
propagation
Gradient force:
- In the direction of the spatial light
gradient
Microscope
objective
Matti Kinnunen
Optical trap can be estimated
as a spring with stiffness k

University of Oulu University of Oulu
Example setup
REQUIREMENTS:
• Laser
• Beam expander
• Dichroic mirror
• Microscope objective
(high NA)
• Sample illumination
• Camera

University of Oulu University of Oulu

University of Oulu University of Oulu
Calibration methods
- Viscous drag force method
- High-speed camera imaging
- Quadrant Photo Diode

University of Oulu
Evaluation of trapping efficiency
‒ Viscous drag method
‒ Viscous drag force and transverse trapping force of optical tweezers are in balance just before the particle escapes from the trap
‒ Viscous drag method is applicable for rigid particles
‒ Forces induce stretching and deformation of red blood cell which induces variation in trapping efficiency
rvF 6
Qc
PnF
Motorized xy-stage Stage movement
Transverse trapping
force
Matti Kinnunen
Stock`s
force
Trapping
force
Direction of flow

University of Oulu
Evaluation of trapping efficiency
‒ Viscous drag method
‒ Viscous drag force and transverse trapping force of optical tweezers are in balance just before the particle escapes from the trap
‒ Viscous drag method is applicable for rigid particles
‒ Forces induce stretching and deformation of red blood cell.
rvF 6
Motorized xy-stage
M. Collins, M. Kinnunen, R. Myllylä, A. Karmenyan, A. Priezzhev, “Measurement of forces
affecting red blood cells in optical tweezers”. International Conference on Laser Application
in Life Sciences “LALS-2008”, December 4-6, 2008, Taipei, Taiwan, Poster.
Qc
PnF
?
Trapping Force
0
5
10
15
20
25
30
35
40
5 10 15 20 25 30 35 40 45
P [mW]
F [p
N]
P.S.
RBC (s.i. modified Stokes')
RBC (surface area modified Stokes')
Stage movement
Transverse trapping
force
Matti Kinnunen

University of Oulu University of Oulu
‒ We used a model for calculating viscous drag force for non-
spherical objects
sndrag rvrvF3
26
3
16
rn is the radius for a sphere with equivalent cross sectional
area than that of the object, and rs is the radius for a
sphere with the same surface area than the effective
surface area of the object (effective
area is the area affected by flow).
P.Puhakka, ” Punasolun venyminen optisessa pinsetissä ja pinsetin
loukkuvoiman määritys,” B. Sc. Thesis, Department of Physics, Biophysics
division, University of Oulu, 2009.
P. Puhakka, M. Kinnunen, M. Collins, and R. Myllylä, ”Stretching of red blood cells with a viscous drag
method,” Photonics and Laser Symphosium, Tampere, 2009.
Matti Kinnunen

University of Oulu University of Oulu
Behaviour of an RBC in optical trap
‒ RBCs orient themselves in a similar
manner in single-beam optical traps, with
their maximum diameter in the direction
of the optical axis [Sato et al,Electron.
Lett. 1991]. RBCs orient themselves in
different optical tweezers in a way that
they enclose maximum intensity.
Matti Kinnunen

University of Oulu University of Oulu
Red blood cell in optical tweezers. Stretching and rotation.

University of Oulu University of Oulu
Optical tweezers calibration
‒ Optical tweezers (OT) can be calibrated
by recording high speed video of the
trapped particle
‒ The illumination is set for high speed
video recording and calibration video of
bead’s Brownian motion at various frame
rates and trapping powers are recorded
‒ The results were analyzed using CPC
program for OT calibration and compared
with hydrodynamic drag calibration
‒ The CPC program for OT calibration were
optimized for use with high speed video
camera
Matti Kinnunen

University of Oulu University of Oulu
Calibration
‒ Trap can also be calibrated
by analyzing power spectrum
‒ Brownian motion can be
detected with high-speed
video
‒ Stiffness of trap can be found
from equation:
𝑓𝑐 =𝑘𝑡𝑟𝑎𝑝
2𝜋𝛾
𝑓𝑐 = 44 ± 2.5 𝐻𝑧
PM Hansen, IM Tolic-Nørrelykkeb, H Flyvbjergc, K Berg-Sørensen (2006)
tweezercalib 2.1: Faster version of MATLAB package for precise calibration of optical tweezers
Computer Physics Communications 175(8), pp. 572-573

University of Oulu University of Oulu
OT calibration with high speed camera
Typical video (2.54um silica Bead 0.25 mW 1000fps)
University of Oulu University of Oulu
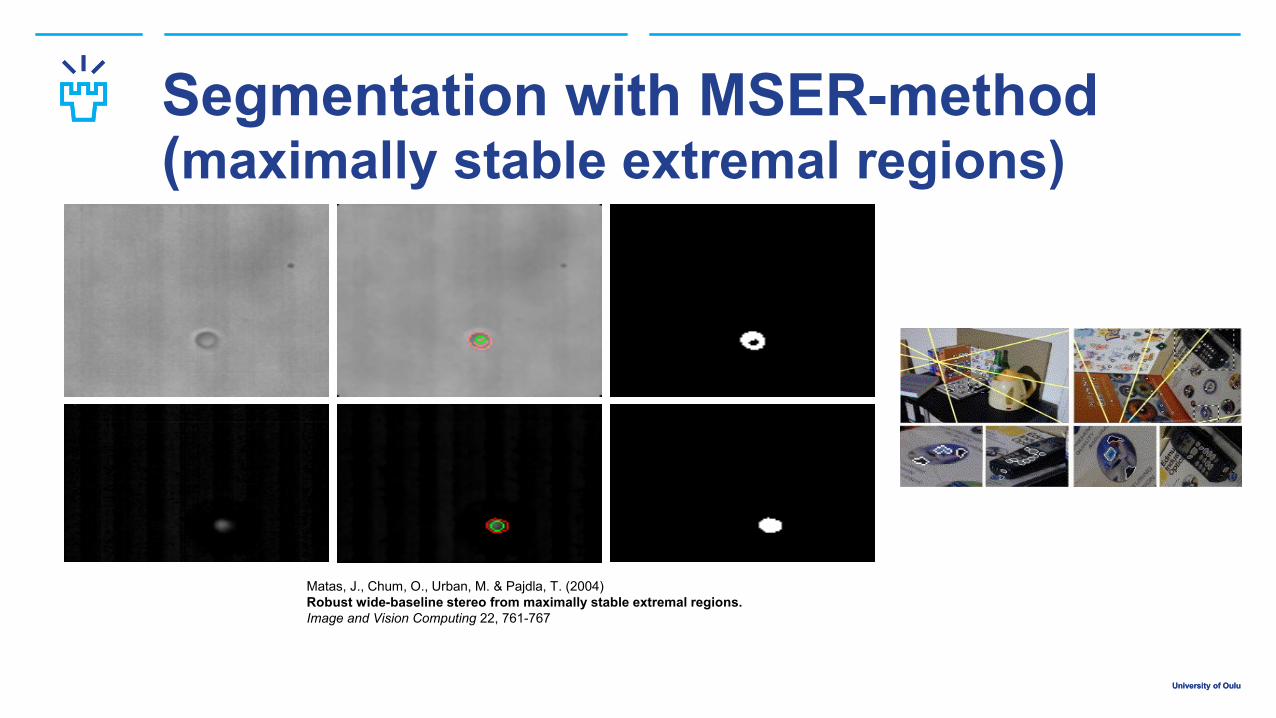
Segmentation with MSER-method (maximally stable extremal regions)
Matas, J., Chum, O., Urban, M. & Pajdla, T. (2004)
Robust wide-baseline stereo from maximally stable extremal regions.
Image and Vision Computing 22, 761-767

University of Oulu University of Oulu
Tweezer calib
𝑓𝑐 = 44 ± 2.5 𝐻𝑧
Modified from: PM Hansen, IM Tolic-Nørrelykkeb, H Flyvbjergc, K Berg-Sørensen (2006)
tweezercalib 2.1: Faster version of MATLAB package for precise calibration of optical tweezers
Computer Physics Communications 175(8), pp. 572-573

University of Oulu University of Oulu
Drag force is based on Stoke’s law, where viscous drag is used.
fc is the characteristic frequency
ktrap is the force constant, and x the
measured amplitude of the displacement
The thermal fluctuations S(f) of a colloid in an optical trap can be
described by a Lorentzian profile
is the drag coefficient for a sphere with radius r moving in a viscous
medium with viscosity
When laser power increases, trap stiffness increases and characteristic
frequency moves to upper frequencies.
Otto et al. Rev. Sci. Instrum. 79, 023710 2008

University of Oulu
Effect of setup/software modification
Typical PSD before (there few constant frequency peaks)
Typical PSD after (there are almost no intense peaks)

University of Oulu University of Oulu
0.25 mW, 2.54 µm silica bead (1000 fps)

University of Oulu University of Oulu
0.25 mW, 2.54 µm silica bead (1000 fps)

University of Oulu University of Oulu
0.6 mW, 2.54 µm silica bead (1000 fps)

University of Oulu University of Oulu
0.6 mW, 2.54 µm silica bead (1000 fps)

University of Oulu University of Oulu
0.75 mW, 2.54 µm silica bead (1000 fps)

University of Oulu University of Oulu
0.75 mW, 2.54 µm silica bead (1000 fps)

University of Oulu University of Oulu
1.75 mW, 2.54 µm silica bead (1000 fps)
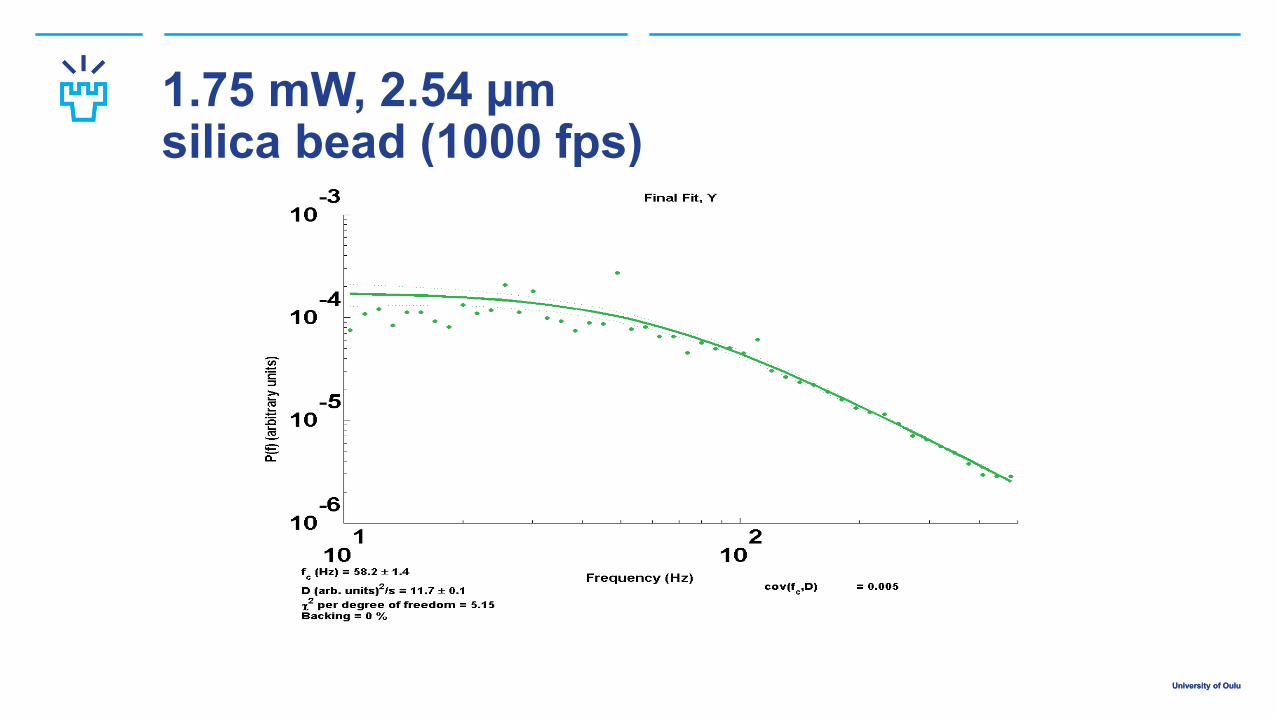
University of Oulu University of Oulu
1.75 mW, 2.54 µm silica bead (1000 fps)

University of Oulu University of Oulu
QPD-calibration ‒ QPD
‒ COMPONENTS

University of Oulu University of Oulu
28
http://www.jpk.com/detection.426.en.html
Lee et al., Journal of Biomedical Optics 21(3), 035001 (March 2016)

University of Oulu University of Oulu
Light matter interaction Elastic light scattering experiments
facilitated with optical tweezers
29

University of Oulu University of Oulu
Motivation
‒ Light scattering phenomenom is present when using optical
methods to study turbid materials and tissues
‒ Good theoretical models are needed
‒ It is important that models can be verified with measurements
‒ Near field effects?

University of Oulu University of Oulu
Some existing theoretical models
He et al., J. Opt. Soc. Am. A/Vol. 21, No. 10/October 2004
Simulation and modeling papers:
[1] Tsinopoulos, S. V., and Polyzos, D., “Scattering of He-Ne laser light by an average-sized red blood cell,“ Appl. Opt. 38, 5499-5510 (1999).
[2] Karlsson, A., He, J., Swartling, J., and Andersson-Engels, S., “Numerical simulations of light scattering by red blood cells,” IEEE Trans. Biomed. Eng. 52, 13-18 (2005).
[3] Nilsson, A. M. K., Alsholm, P., Karlsson, A., and Andersson-Engels, S., "T-matrix computations of light scattering by red blood cells," Appl. Opt. 37, 2735-2748 (1998).
[4] He, J., Karlsson, A., Swartling, J., and Andersson-Engels, S., “Light scattering by multiple red blood cells,” J. Opt.Soc. Am. A 21, 1953-1961 (2004).
[5] Lugovtsov, A. E., Priezzhev, A. V., and Nikitin, S. Y., “Red blood cells in laser beam field: calculations of light scattering,” Proc. SPIE 7022, 70220Y (2008).

University of Oulu University of Oulu
Scattering calculations form spheres
1,00E-07
1,00E-06
1,00E-05
1,00E-04
1,00E-03
1,00E-02
1,00E-01
1,00E+00
0 10 20 30 40 50
Sc
ale
d in
ten
sit
y
Scattering angle º
23.25 µm
10.0 µm
6.0 µm
3.1 µm

University of Oulu University of Oulu
33
Fig. Basic components of a typical goniometric setup with a cylindrical cuvette. L—light
source, C—cuvette, and D—detector/detection optics.
Kinnunen and Karmenyan, Journal of Biomedical Optics, 2015.

University of Oulu University of Oulu
34
Fig. Schematic of an optically trapped red blood cell (RBC) (a) and a combination of a
double-beam optical trap and goniometric setup (b).
Kinnunen and Karmenyan, Journal of Biomedical Optics, 2015.
Kinnunen et al., Journal of Biomedical Optics, 2014.

University of Oulu University of Oulu
Optical tweezers setup
Figure. Optical tweezer setup with Gaussian and elliptical tweezers.

University of Oulu University of Oulu
‒How to measure light
scattering from a single
particle or red blood
cell or several cells at
different orientations?

University of Oulu University of Oulu
How the fix the position of RBC in optical trap?
‒ Two beam optical tweezers system
- Two Gaussian beams
– Elliptical and Gaussian beams
M.Sc. Thesis, Antti Kauppila, Physics Department, University of Oulu, Finland (2009)
Red blood cells in elliptical optical tweezers
M.Sc. Thesis, Antti Kauppila, Physics Department,
University of Oulu, Finland (2009)

University of Oulu University of Oulu
Light scattering measurements
Figure. Red blood cells in elliptical tweezers during measurement.
Setup
- A He-Ne laser (05-LHP-151, Melles Griot), 5 mW
- Vertical polarization was used
- Cylindrical cuvette (shortened version of Helma 540.115)
- Amplified photomultiplier tube (PMT) (Thorlabs PMM02)
- A motorized rotation stage (Standa 8MR190-2-28)
No scattering is allowed
from the background
medium
University of Oulu University of Oulu
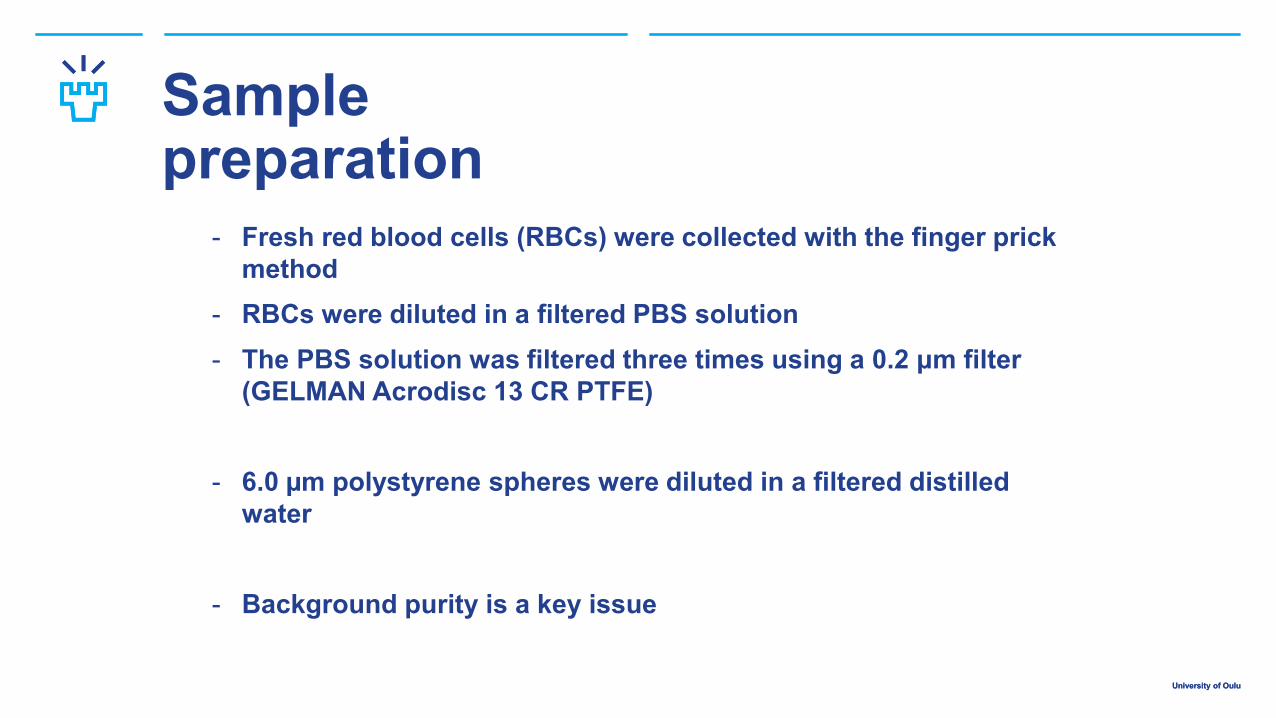
Sample preparation
- Fresh red blood cells (RBCs) were collected with the finger prick
method
- RBCs were diluted in a filtered PBS solution
- The PBS solution was filtered three times using a 0.2 μm filter
(GELMAN Acrodisc 13 CR PTFE)
- 6.0 µm polystyrene spheres were diluted in a filtered distilled
water
- Background purity is a key issue

University of Oulu University of Oulu
Measurements from single particles and RBCs
1.00E-03
1.00E-02
1.00E-01
1.00E+00
1.00E+01
0 10 20 30 40 50
Scattering Angle [°]
Sca
tterin
g In
tens
ity [a
.u.]
Measurement
Modeling
Collins et al. Proc SPIE, Vol. 7376, 2010.
Kinnunen et al. Biomed. Opt. Express 2, 1803-1814 (2011).
Kinnunen et al. Biomed. Opt. Express 2, 1803-1814
(2011).

University of Oulu University of Oulu
Two point tweezers
Kinnunen et al. Opt. Lett. 36(18), 3554-3556 (2011).

University of Oulu University of Oulu
Point and elliptical tweezer
Figure. Single RBC in point and elliptical optical tweezers (a), the same RBC illuminated with a He-Ne laser
(b), two cells in elliptical optical tweezers (c), and two RBCs illuminated with a He-Ne laser (d). Arrows show
direction of the incident laser light. The scale bar is 10 µm.
video video
Kauppila et al. Proc. SPIE 8097, 80970K (2011).
University of Oulu University of Oulu
1.00E-03
1.00E-02
1.00E-01
1.00E+00
1.00E+01
5 10 15 20 25
Scattering Angle [º]
Inte
nsity
[a.u
.]
3RBC
2RBC1
2RBC2
2RBC3
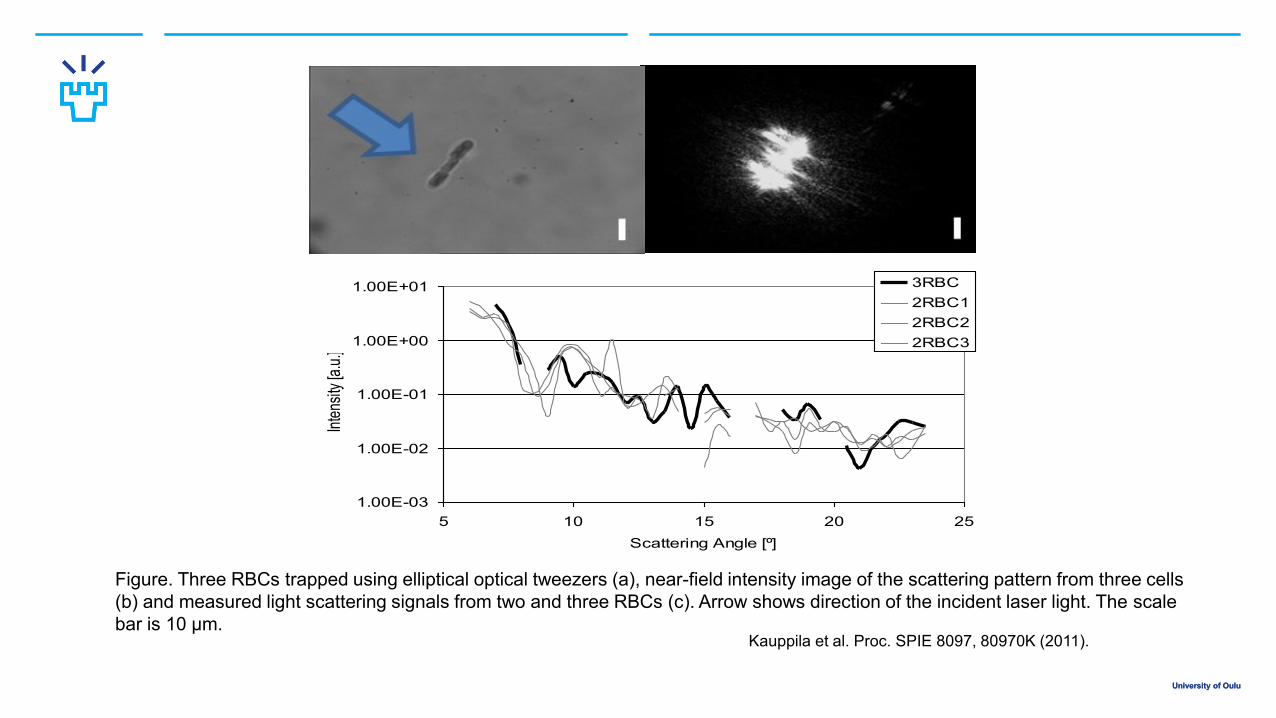
Figure. Three RBCs trapped using elliptical optical tweezers (a), near-field intensity image of the scattering pattern from three cells
(b) and measured light scattering signals from two and three RBCs (c). Arrow shows direction of the incident laser light. The scale
bar is 10 µm. Kauppila et al. Proc. SPIE 8097, 80970K (2011).

University of Oulu University of Oulu
1.00E-04
1.00E-03
1.00E-02
1.00E-01
1.00E+00
1.00E+01
0 10 20 30 40 50
Scattering Angle [º]
Inte
nsity
[a.u
.]
two RBCs, rim-on
two RBCs, rim-on
one RBC, rim-on
one RBC, rim-on
Figure. Two RBCs in rim-on position (a), near-field intensity image of scattering light from two cells (b) and
measured light scattering signals (c). Arrow shows direction of the incident laser light. The scale bar is 10 µm.
video
video
Kauppila et al. Proc. SPIE 8097, 80970K (2011).

University of Oulu University of Oulu
Discussion ‒ He et al. performed simulations with the FDTD
method and concluded that, when changing the
lateral distance of the cells in face-on
orientation, the scattering probability
distributions remain almost unaffected.
‒ Results for two cells in rim-on orientation show
that increasing the number of RBCs in rim-on
illumination has a clear effect on scattering.
‒ To increase the stability of the elliptical optical
tweezers, our measurements were made near
the bottom of the cuvette. Then again, to
decrease background reflections from the
bottom, it was necessary to conduct the
measurements as far above the bottom as
possible. This led to a compromise in the
signal-to-noise ratio.
‒ Measurement results supports the simulations

University of Oulu University of Oulu
RBC interaction force measurements
47

University of Oulu University of Oulu
UTILIZING OPTICAL TWEEZERS FOR MEASURING AGGREGATION FORCES AT A CELLULAR LEVEL
𝑓𝑐 = 44 ± 2.5 𝐻𝑧
P.M.Hansen et al., Computer Physics Communications 175(8),
2006
Figure. Trap can be calibrated by analyzing
power spectrum of Brownian motion.
𝑓𝑐 =𝑘𝑡𝑟𝑎𝑝
2𝜋𝛾
Figure. (a) – illustration of optical trapping, (b) – simplified schematic layout
Matti Kinnunen

University of Oulu University of Oulu
Experimental details
• The blood was drawn from a single healthy
male donor to avoid individual and gender
differences in the measured parameters.
• Age separation of RBCs was performed by 1
hour-long centrifugation at 30,000g @ 30°C as
described and used by most authors studying
RBCs aggregation
• Experiments were performed in autologous
plasma and gamma-globulin (IgG) solutions (20
mg/ml) within 8 hours after drawing the blood.
• Aggregation strength of RBC doublets was
calculated from the measured drag velocity
required to separate two cells trapped in a
single laser tweezers.

University of Oulu University of Oulu
Red blood cell aggregation and disaggregation in plasma and protein solutions
50
Lee et al., Journal of Biomedical Optics 21(3), 035001 (March 2016)

University of Oulu University of Oulu
51
Fig. Schematic layout of the optical tweezers setup.
Lee et al., Journal of Biomedical Optics 21(3), 035001 (March 2016)

University of Oulu University of Oulu
52
Fig. (1) Two noninteracting RBCs are trapped with OT and (2) a small interaction
area is formed, after which the OT are turned off. (3–5) RBCs start to spontaneously
overlap and form a compact doublet in the case of:
(a) plasma, or they do not spontaneously overlap in the case of:
(b) fibrinogen 2.5 mg∕ml þ albumin 35 mg∕ml solution. The cross marks show the
positions of the OT.
Lee et al., Journal of Biomedical Optics 21(3), 035001 (March 2016)

University of Oulu University of Oulu
53
Fig. Schematic sequences of RBC disaggregating force measurement: (1) two noninteracting RBCs
are trapped with OT; (2) the pair aggregate is formed by attaching the RBCs with a known interaction
area; (3) the RBCs are held aggregated at low OT power during the known interaction time; (4) one of the
cells is pulled with a known force. Step 4 is repeated multiple times slowly while increasing the
disaggregating force until (5) the cells are separated and the minimum force required for doublet
disaggregation is found. The cross marks show the positions of the OT, and the arrows show the direction
of pulling.
Lee et al., Journal of Biomedical Optics 21(3), 035001 (March 2016)

University of Oulu University of Oulu
54
Lee et al., Journal of Biomedical Optics 21(3), 035001 (March 2016)

University of Oulu University of Oulu
55
Fig. (a) Dependence of maximum achievable displacement on the trapping force in
plasma (concentrations of fibrinogen 1.9 mg∕ml and albumin 45 mg∕ml) and in the solution
of fibrinogen (2.5 mg∕ml) with albumin (35 mg∕ml). (b) Set of frames (1–4) demonstrating
the measurement process. As the linear overlap distance (A) decreases, a
higher force (F) is required to further separate the RBCs. The cross marks show the
positions of the OT and the arrows show the direction of pulling.
Lee et al., Journal of Biomedical Optics 21(3), 035001 (March 2016)

University of Oulu University of Oulu
56
Fig. Schematic description of force measurement. RBCs are trapped by two independent optical traps shown
as springs. The points of force application are shown only to designate the force direction, the actual force
being applied through a certain area. The trapping force of the unmoving trap (Ftrap1) was
always slightly stronger than that of the movable trap (Ftrap2 ). FA refers to the aggregating force. (A) The
cells are trapped and held from overlapping to each other with OT force greater than FA . (B) The cell escapes
from OT, as FA becomes slightly stronger or equal to the OT force. At this moment the FA is
considered to be matching Ftrap2 .
Lee et al., IEEE JSTQE, VOL. 22,
NO. 3, MAY/JUNE 2016

University of Oulu University of Oulu 57
Fig. (a) Set of frames demonstrating the steps of the measurement procedure.
The cross marks show the positions of OT and the arrow showthe direction
of pulling. The black arrow shows time course of the measurement and indicates
that force increases every step. (b) Dependence of maximum achievable linear
overlap distance on the pulling force in plasma.
Lee et al., IEEE JSTQE, VOL. 22,
NO. 3, MAY/JUNE 2016

University of Oulu University of Oulu
58
Fig. (a) Set of frames demonstrating the steps of the measurement procedure.
The cross marks show the positions of OT and the arrow showthe direction
of pulling. The black arrows show time course of the measurement. (b) Disaggregation
force dependence on the “initial” interaction area of the RBCs. The
grey colour stands for small and the black for large “initial” interaction area.
Lee et al., IEEE JSTQE, VOL. 22,
NO. 3, MAY/JUNE 2016

University of Oulu University of Oulu
Conclusions ‒ Optical tweezers is an appropriate tool for
manipulating particles and cells. It can be
used to keep the sample at place during
light scattering measurements as well as
to measure interaction forces between
different cells.
59

University of Oulu University of Oulu
Acknowledgments ‒ K. Lee
‒ M. D. Khokhlova
‒ E. V. Lyubin
‒ A. V. Priezzhev
‒ I. Meglinski
‒ A. V. Danilina
‒ V. D. Ustinov
‒ S. Shin
‒ A. A. Fedyanin
‒ A. Karmenyan
‒ A. Kauppila
‒ R. Myllylä
‒ J. Heikkilä
‒ S. Huttunen
60
Financial support:
• Academy of Finland,
• Infotech Oulu, University of Oulu
• Faculty of Information Technology and
Electrical Engineering, University of OUlu