optimizing crop management practices with dssat. our goal with increasing population and climate...
TRANSCRIPT

Optimizing Crop
Management Practices with
DSSAT

Our Goal• With increasing population and climate change,
the ability to maximize crop production is essential.
• We want to be able to predict optimal management practices for a variety of situations, including under environmental stresses such as during a drought, while minimizing pollution from unused fertilizer.
• We will use DSSAT to simulate crop growth under a range of management practices and determine the combination that produces the largest yield with the smallest nitrogen pollution.
• Find areas of DSSAT that can be improved.
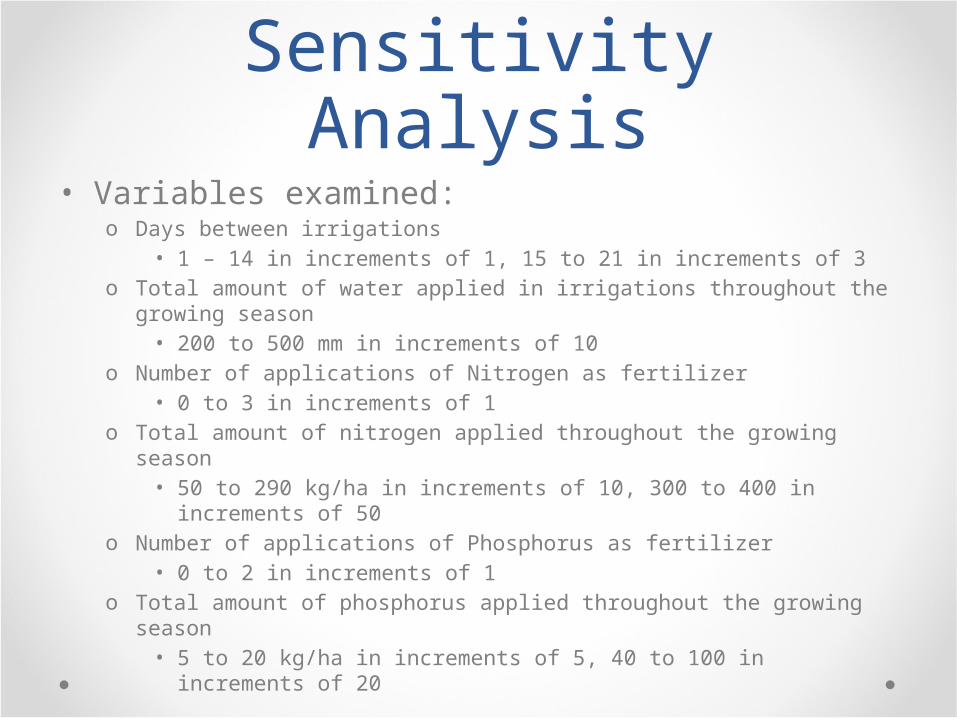
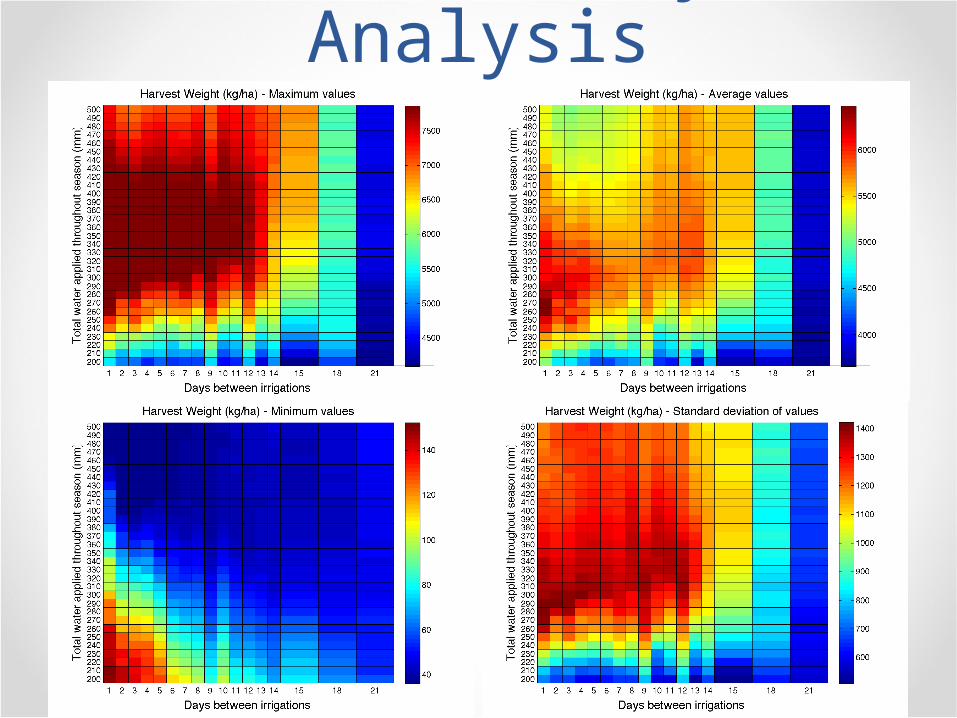
Sensitivity Analysis• Variables examined:
o Days between irrigations• 1 – 14 in increments of 1, 15 to 21 in increments of 3
o Total amount of water applied in irrigations throughout the growing season• 200 to 500 mm in increments of 10
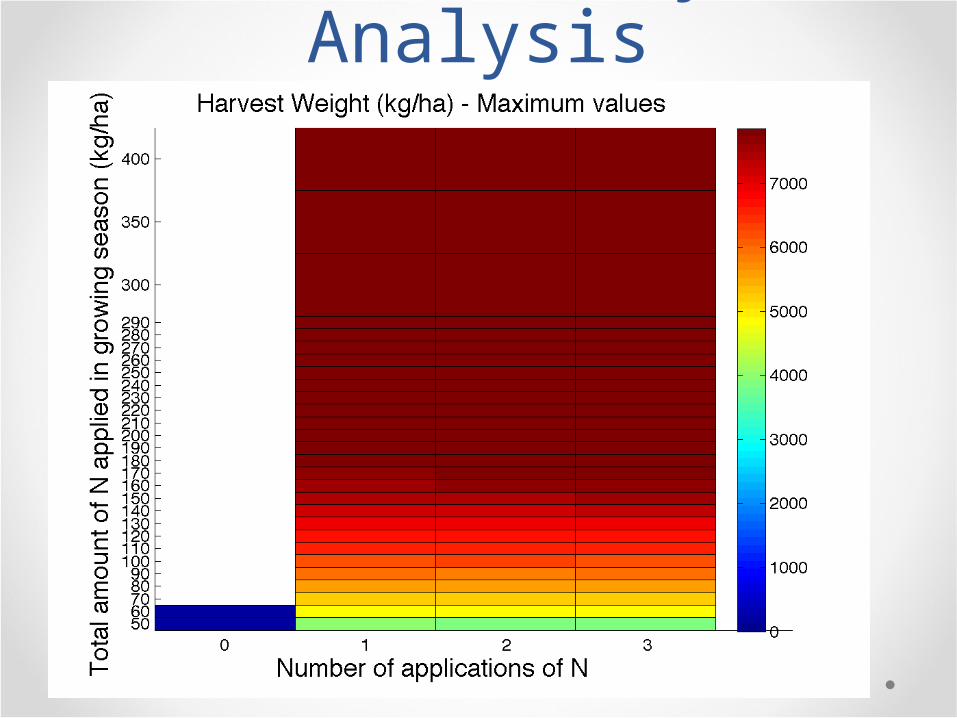
o Number of applications of Nitrogen as fertilizer• 0 to 3 in increments of 1
o Total amount of nitrogen applied throughout the growing season• 50 to 290 kg/ha in increments of 10, 300 to 400 in increments of
50o Number of applications of Phosphorus as fertilizer
• 0 to 2 in increments of 1o Total amount of phosphorus applied throughout the growing season
• 5 to 20 kg/ha in increments of 5, 40 to 100 in increments of 20

Sensitivity Analysis• Maize simulated in Ghana without precipitation• Planting date: June 17, 2004• Harvest date: September 6, 2004

Sensitivity Analysis
Sensitivity Analysis

Sensitivity Analysis

Harvest: 7860 kg/haWater amount: 320 mmDays between irrigations: 5N applied: 200 kgN applications: 3 P applied: 80 kgP applications: 2
Sensitivity Analysis
Optimal conditions:

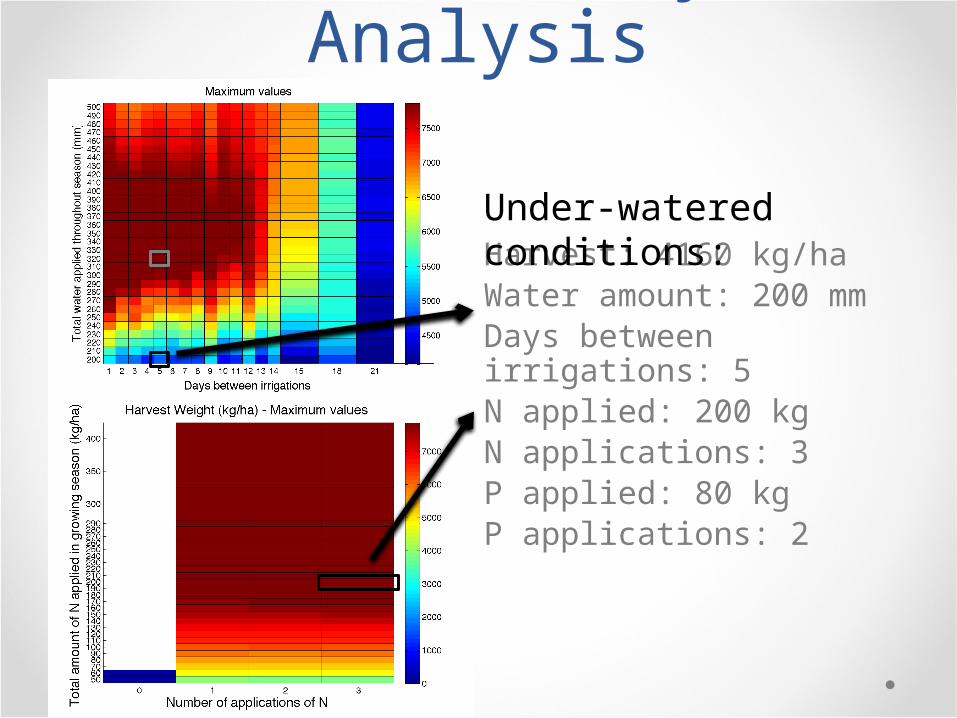
Harvest: 4160 kg/haWater amount: 200 mmDays between irrigations: 5N applied: 200 kgN applications: 3 P applied: 80 kgP applications: 2
Sensitivity Analysis
Under-watered conditions:

Harvest: 6375 kg/haWater amount: 500 mmDays between irrigations: 5N applied: 200 kgN applications: 3 P applied: 80 kgP applications: 2
Sensitivity Analysis
Overwatered conditions:
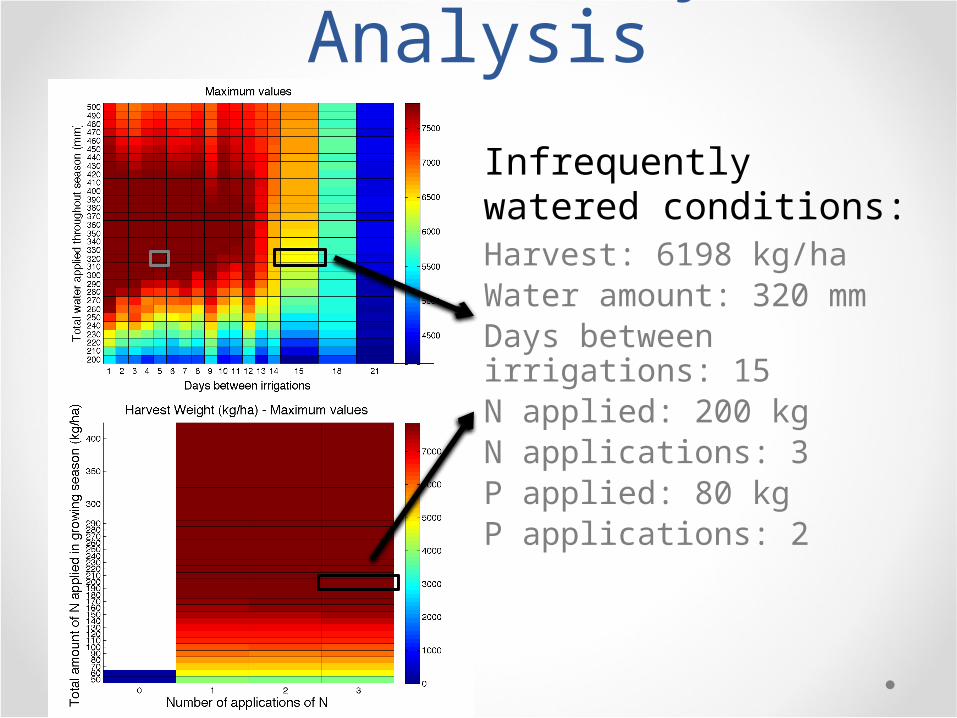
Harvest: 6198 kg/haWater amount: 320 mmDays between irrigations: 15N applied: 200 kgN applications: 3 P applied: 80 kgP applications: 2
Sensitivity Analysis
Infrequently watered conditions:

Harvest: 5918 kg/haWater amount: 320 mmDays between irrigations: 5N applied: 100 kgN applications: 3 P applied: 40 kgP applications: 2
Sensitivity Analysis
Fertilizer deprived conditions:
Harvest: 4160 kg/haWater amount: 200 mmDays between irrigations: 5N applied: 200 kgN applications: 3 P applied: 80 kgP applications: 2
Sensitivity Analysis
Under-watered conditions:

Effects of Water DeficiencyOptimal Conditions Under-watered
Conditions

Effects of Water DeficiencyOptimal Conditions Under-watered
Conditions

Harvest: 6375 kg/haWater amount: 500 mmDays between irrigations: 5N applied: 200 kgN applications: 3 P applied: 80 kgP applications: 2
Sensitivity Analysis
Overwatered conditions:

Effects of Over-wateringOptimal Conditions Over-watered Conditions

Effects of Water DeficiencyOptimal Conditions Over-watered Conditions

Harvest: 6198 kg/haWater amount: 320 mmDays between irrigations: 15N applied: 200 kgN applications: 3 P applied: 80 kgP applications: 2
Sensitivity Analysis
Infrequently watered conditions:
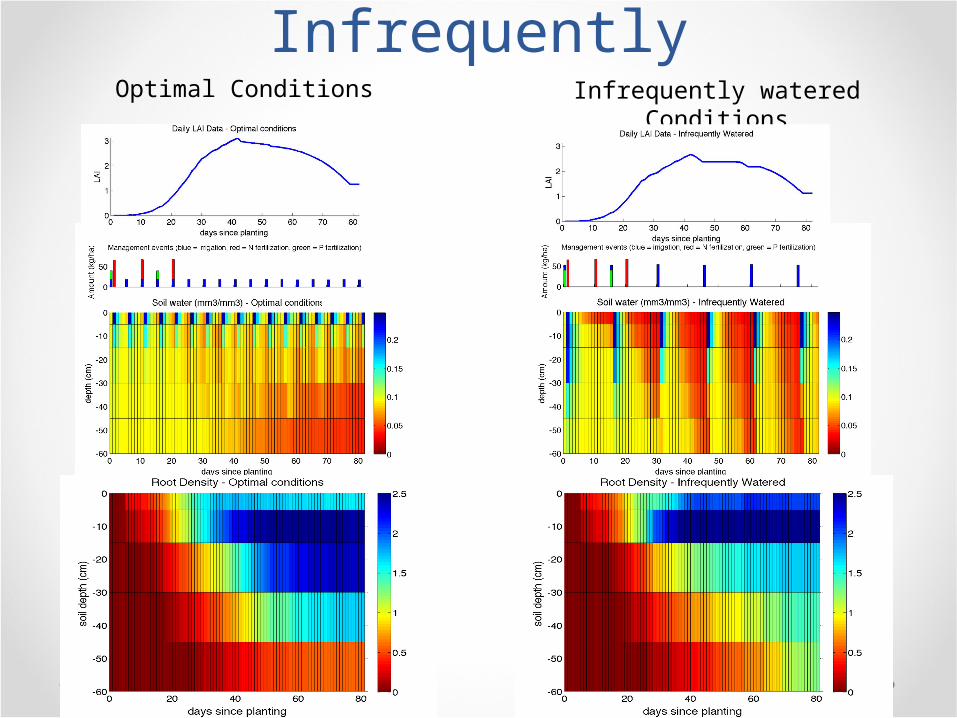
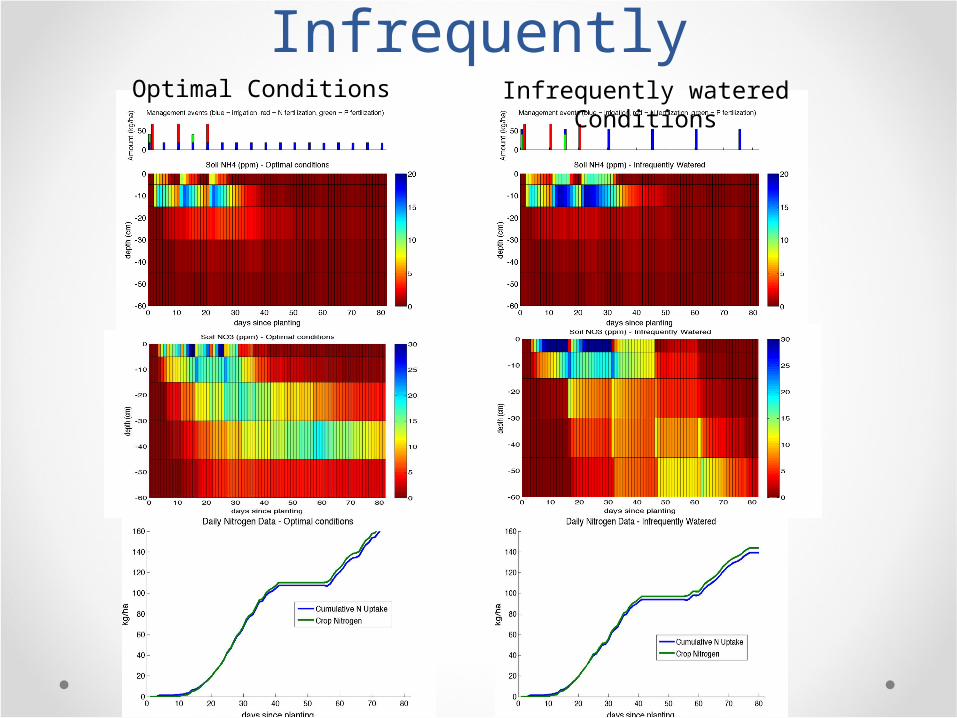
Effects of Watering Too Infrequently
Optimal Conditions Infrequently watered Conditions
Optimal Conditions Infrequently watered Conditions
Effects of Watering Too Infrequently

Harvest: 5918 kg/haWater amount: 320 mmDays between irrigations: 5N applied: 100 kgN applications: 3 P applied: 40 kgP applications: 2
Sensitivity Analysis
Fertilizer deprived conditions:
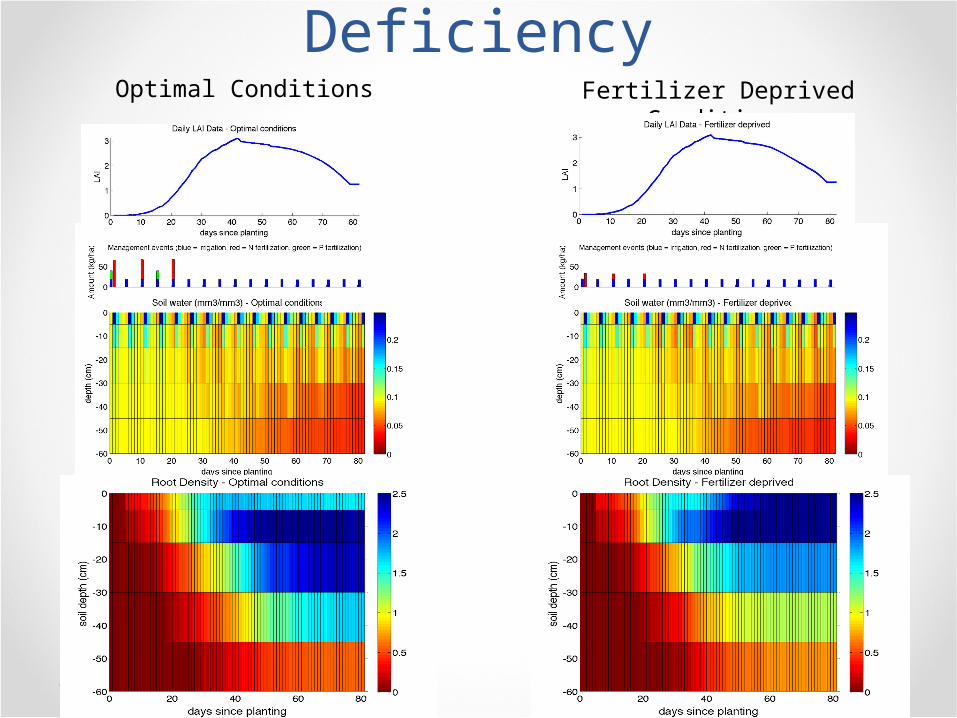
Effects of Fertilizer Deficiency
Optimal Conditions Fertilizer Deprived Conditions

Effects of Fertilizer Deficiency
Optimal Conditions Fertilizer Deprived Conditions

LAI vs harvest
Days between irrigations
Linear fit: LAI = 0.85858 + 0.00034544*harvestR squared value: 0.729

Unused nitrogen vs harvest
Unused nitrogen = nitrogen applied in fertilizer – cumulative nitrogen uptake

Conclusion• Performed exhaustive sensitivity analysis across
six degrees of freedom. This can be used to help identify optimal management practice strategies.
• These simulations and optimizations can be reproduced with different crop types, weather information, and soil properties.
• Can help identify weaknesses in DSSAT – for example, LAI values seem to be off.

Mysteries of DSSAT• Why does overwatering reduce
yield?o Water pushes nutrients deeper into the soil
faster than roots can grow down?• Why is there a spike in minimum harvest weight when nitrogen is added in two applications?
• Why is there a plateau in cumulative nitrogen uptake?o Crop doesn’t need more nitrogen in that
growth stage?
• Why does nitrogen spontaneously appear in the top soil layer when water deprived?o Nitrogen from second layer is brought up along
with water?• Why does an LAI of three seem to
be the maximum attainable value?


LAI vs harvestDays between irrigations
Days between irrigations

Unused nitrogen vs harvest
Days between irrigations
Days between irrigations
Unused nitrogen = nitrogen applied in fertilizer – cumulative nitrogen uptake

1,5
Sensitivity Analysis

Sensitivity Analysis

Sensitivity Analysis