organic particulate matter: new constraints from satellite and field observations reed college...
Post on 19-Dec-2015
231 views
TRANSCRIPT
Organic Particulate Matter: New constraints from satellite and field observations
Reed CollegeOctober 28, 2010
Colette L. Heald([email protected])
Photo courtesy: Cam McNaughton (taken from NASA’s DC-8)

AEROSOL: CONNECTION TO BIG RESEARCH TOPICS IN ENVIRONMENTAL SCIENCE…A MOTIVATION TO GET IT RIGHT!
AIR QUALITY / HEALTH
Clear DayVISIBILITY BIOSPHERE-ATMOSPHERE
CLIMATE

+ oxidants
Terpenes(gas-phase)PBAP
Hydrocarbons(gas-phase & particulate)
ORGANIC AEROSOL IN PARTICULAR…
Primary Organic Aerosol: emittedSecondary Organic Aerosol: formed
NATURAL ANTHROPOGENIC
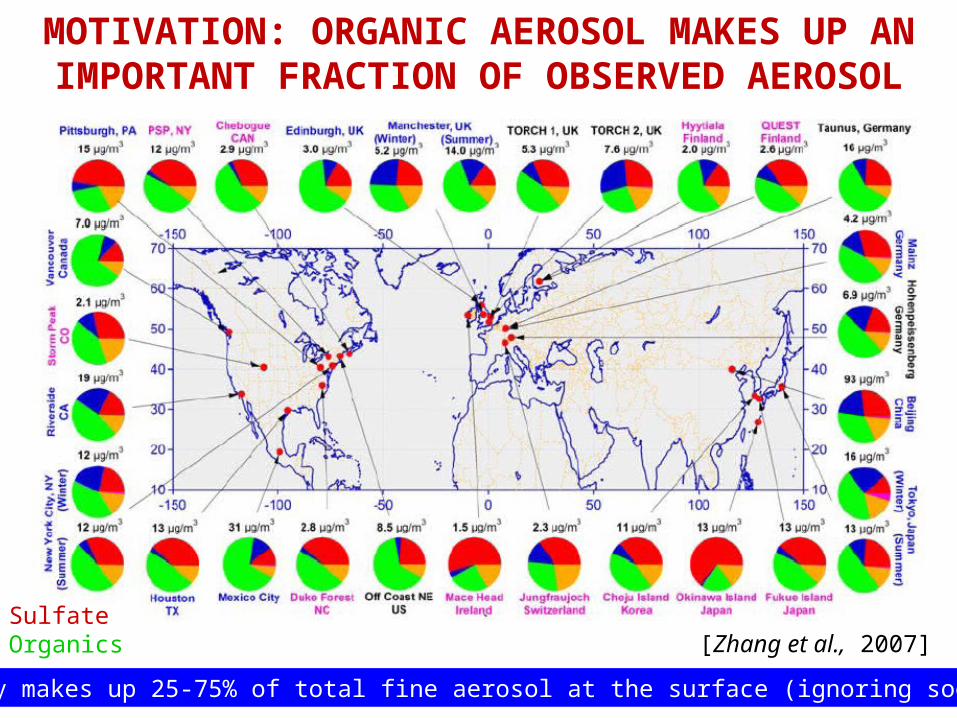
MOTIVATION: ORGANIC AEROSOL MAKES UP AN IMPORTANT FRACTION OF OBSERVED AEROSOL
Globally makes up 25-75% of total fine aerosol at the surface (ignoring soot here)
[Zhang et al., 2007]SulfateOrganics
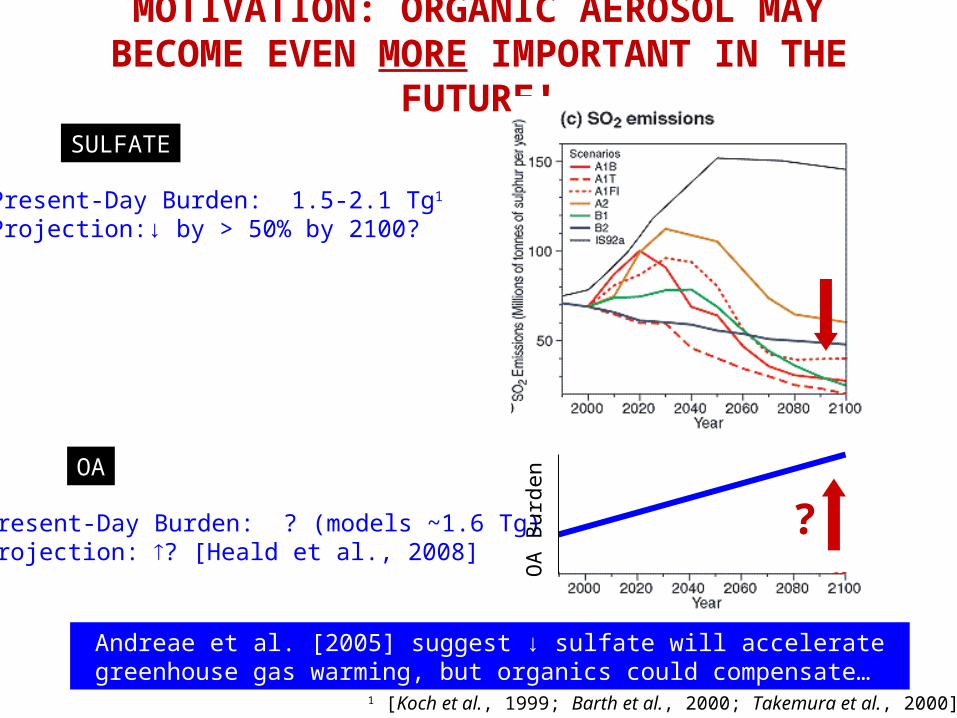
MOTIVATION: ORGANIC AEROSOL MAY BECOME EVEN MORE IMPORTANT IN THE FUTURE!
Present-Day Burden: 1.5-2.1 Tg1
Projection:↓ by > 50% by 2100?
SULFATE
OA
1 [Koch et al., 1999; Barth et al., 2000; Takemura et al., 2000]
Present-Day Burden: ? (models ~1.6 Tg)Projection: ? [Heald et al., 2008]
OA
Bur
den
Andreae et al. [2005] suggest ↓ sulfate will accelerate greenhouse gas warming, but organics could compensate…
?

CHALLENGES IN MODELING THE RIGHT LEVELS OF OA
SOA measured/modeled = 4-100!
[Volkamer et al., 2006]
Models do get it right sometimes (even more puzzling?) but is it for the right reason?
ITCT-2K4
IMPEXAMAZE-08
AMMA
Egbert

WHY DON’T MODELS GET IT RIGHT….
Terpenes(gas-phase)PBAP
Hydrocarbons(gas-phase & particulate)
Uncertain Formation (Missing sources? Poorly understood processes?)
Continuing Oxidation/Partitioning in the Atmosphere
10,000’s of (unidentified?) compounds with variable properties
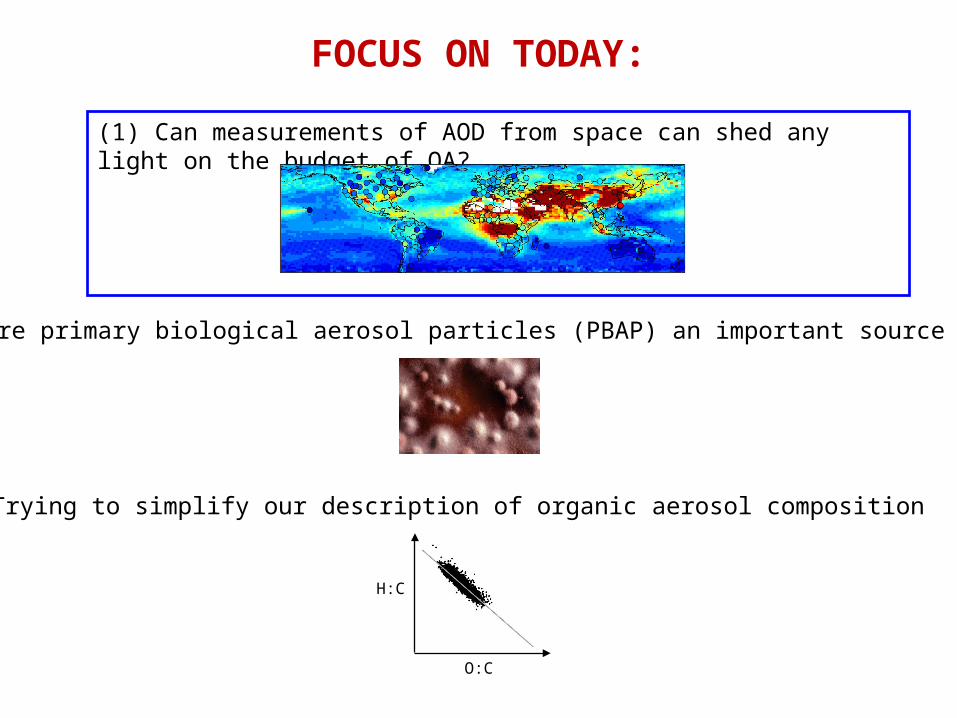
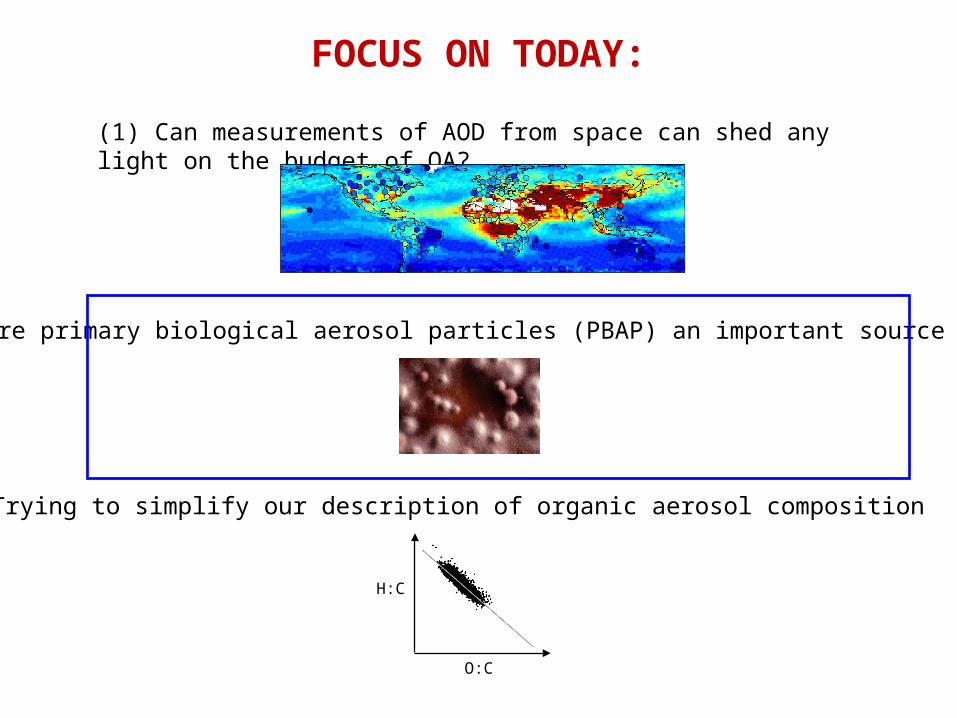
FOCUS ON TODAY:
(3) Trying to simplify our description of organic aerosol composition
(1) Can measurements of AOD from space can shed any light on the budget of OA?
H:C
O:C
(2) Are primary biological aerosol particles (PBAP) an important source of OA?
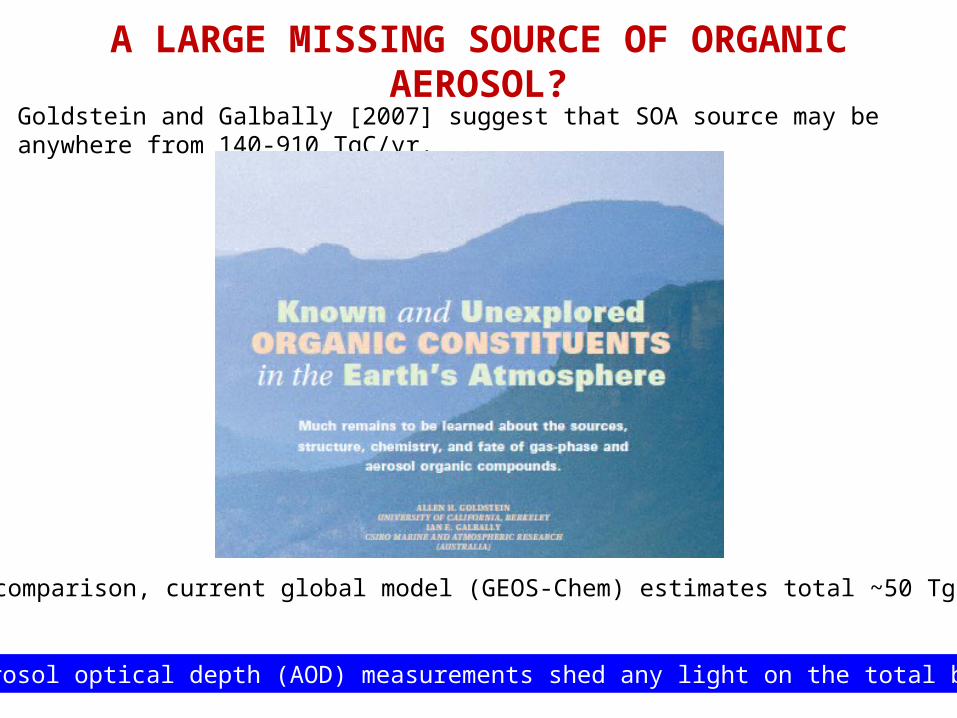
A LARGE MISSING SOURCE OF ORGANIC AEROSOL?Goldstein and Galbally [2007] suggest that SOA source may be anywhere from 140-910 TgC/yr.
Can total aerosol optical depth (AOD) measurements shed any light on the total budget of OA?
For comparison, current global model (GEOS-Chem) estimates total ~50 TgC/yr

ADVANTAGES AND CHALLENGES OF LOOKING AT AOD
Strategy: focus on continental AOD, use MISR
as a global constraint
Organicaerosol
Sulfate Dust
Sea SaltNitrate
SURFACE REFLECTANCE
SATELLITE AOD
Assumptions:Optical PropertiesSize Distributions
Aerosol Distributions
AEROSOL SPECIATED MASS CONCENTRATIONS
DEFINITION:Aerosol Optical
Depth (AOD) is the total extinction (from scattering
and absorption) of radiation due to aerosols as it
passes through the atmosphere
ADVANTAGE: Global view of total atmospheric columnCHALLENGE: AOD is an integrated measure of ALL aerosols – uncertainty on any single
derived particle type will be high.
Soot
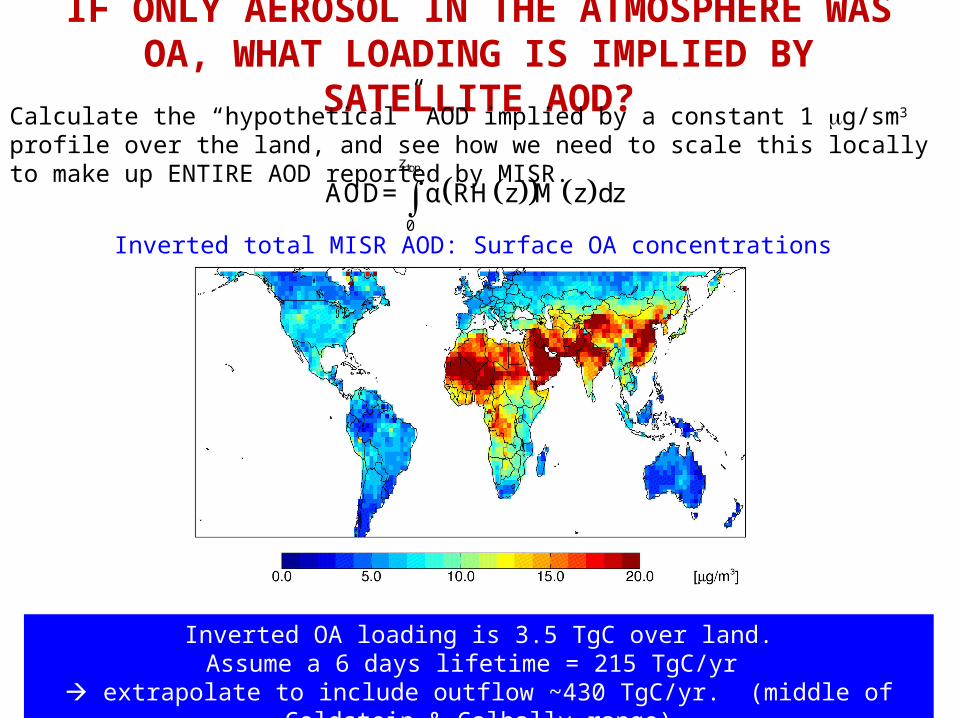
IF ONLY AEROSOL IN THE ATMOSPHERE WAS OA, WHAT LOADING IS IMPLIED BY SATELLITE AOD?
Calculate the “hypothetical” AOD implied by a constant 1 g/sm3 profile over the land, and see how we need to scale this locally to make up ENTIRE AOD reported by MISR.
Inverted OA loading is 3.5 TgC over land.Assume a 6 days lifetime = 215 TgC/yr
extrapolate to include outflow ~430 TgC/yr. (middle of Goldstein & Galbally range)
Inverted total MISR AOD: Surface OA concentrations
topz
0
AOD= α RH z M z dz
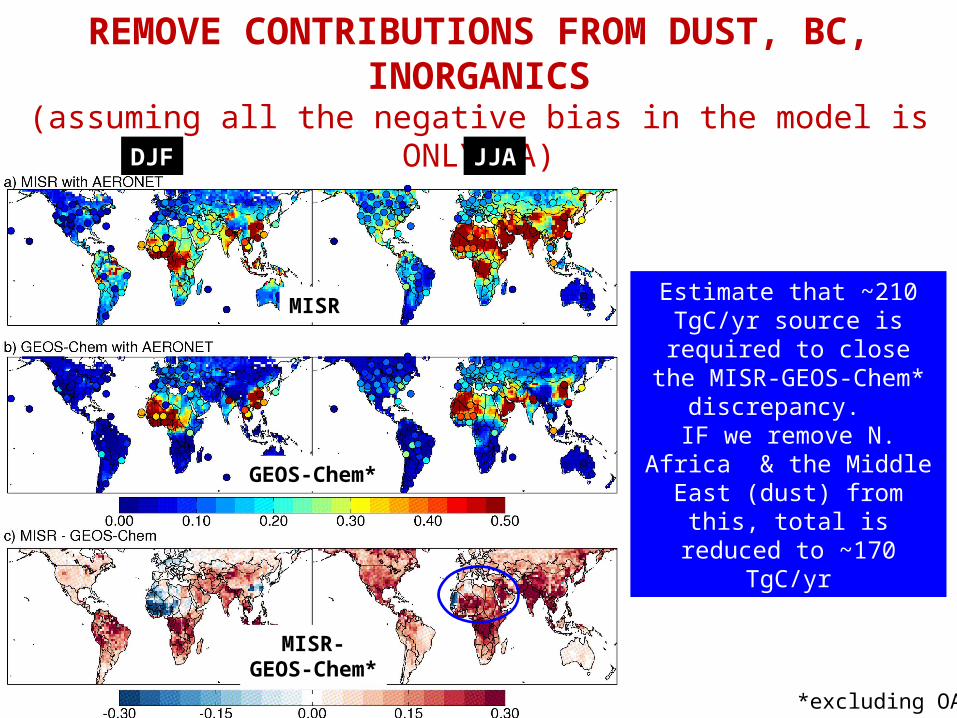
A MORE REALISTIC POSSIBILITY:REMOVE CONTRIBUTIONS FROM DUST, BC, INORGANICS
(assuming all the negative bias in the model is ONLY OA)
Estimate that ~210 TgC/yr source is required to close the
MISR-GEOS-Chem* discrepancy.
IF we remove N. Africa & the Middle East (dust) from this,
total is reduced to ~170 TgC/yr
DJF JJA
MISR
GEOS-Chem*
MISR-GEOS-Chem*
*excluding OA
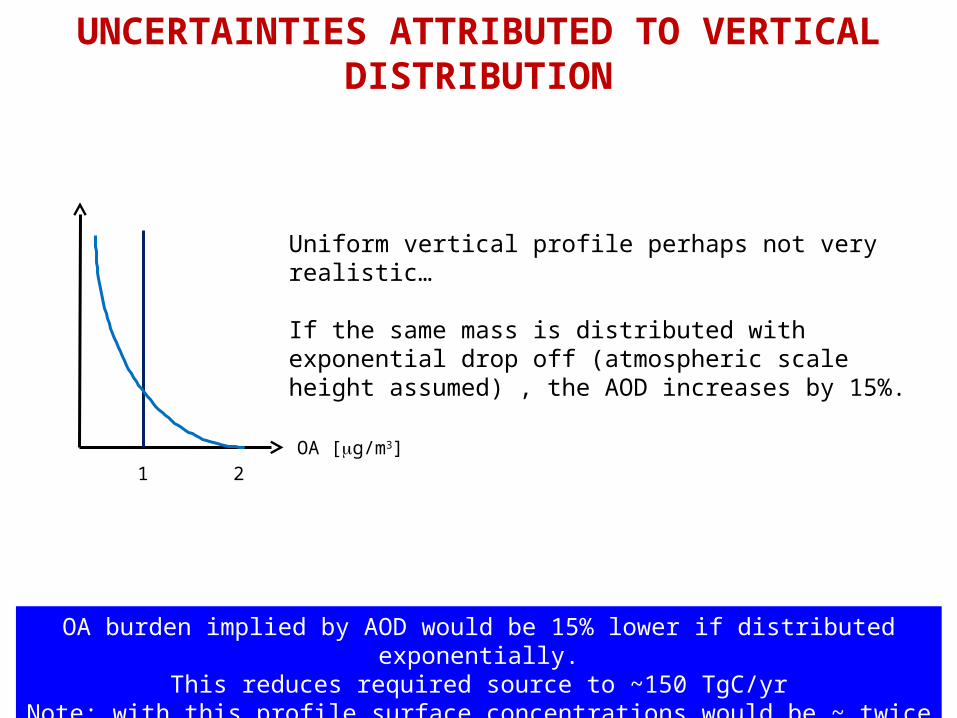
UNCERTAINTIES ATTRIBUTED TO VERTICAL DISTRIBUTION
Uniform vertical profile perhaps not very realistic…
If the same mass is distributed with exponential drop off (atmospheric scale height assumed) , the AOD increases by 15%.
OA burden implied by AOD would be 15% lower if distributed exponentially.This reduces required source to ~150 TgC/yr
Note: with this profile surface concentrations would be ~ twice as high.
1 2OA [g/m3]

SEASONALITY OF “INVERTED” OA BURDEN
Seasonality of “inverted” OA peaks in local spring/summer Coincident to peak in BVOC & oxidants (don’t forget fires too)…
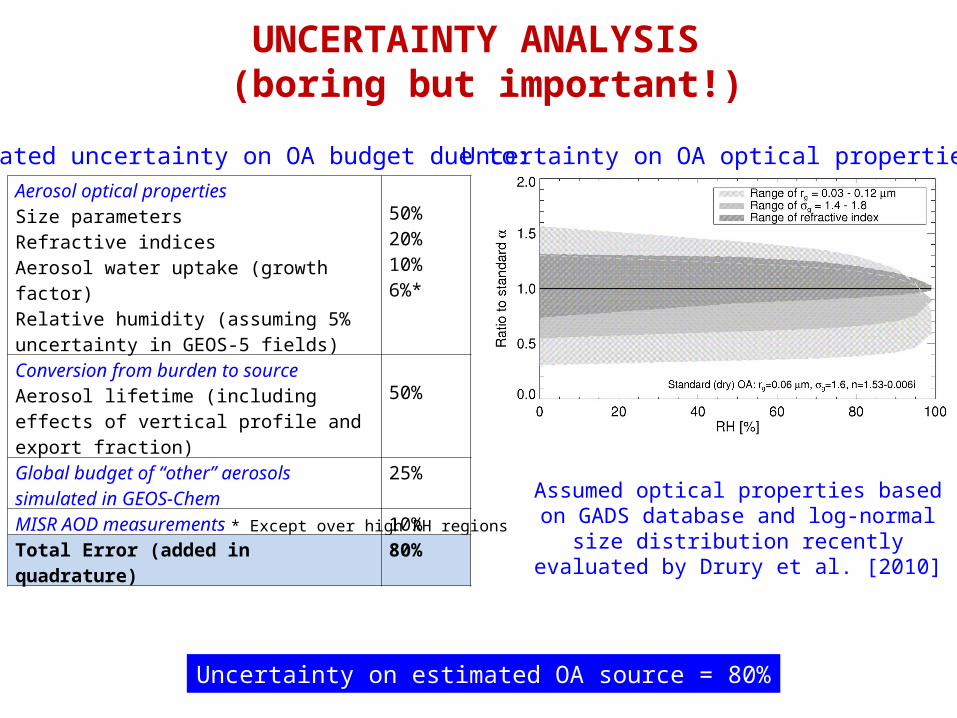
UNCERTAINTY ANALYSIS (boring but important!)
Assumed optical properties based on GADS database and log-normal size distribution recently
evaluated by Drury et al. [2010]
Uncertainty on estimated OA source = 80%
Estimated uncertainty on OA budget due to: Uncertainty on OA optical properties
* Except over high RH regions
Aerosol optical propertiesSize parametersRefractive indicesAerosol water uptake (growth factor)Relative humidity (assuming 5% uncertainty in GEOS-5 fields)
50%20%10%6%*
Conversion from burden to sourceAerosol lifetime (including effects of vertical profile and export fraction)
50%
Global budget of “other” aerosols simulated in GEOS-Chem
25%
MISR AOD measurements 10%
Total Error (added in quadrature) 80%

Suggests a MAXIMUM global source of ~150 TgC/yr of OA to the atmosphere.
This is more than THREE TIMES what is currently included in global models….
BUT at the low end of Goldstein & Gallbally [2007] range.
HAVE WE REDUCED THE UNCERTAINTY ON THE OA BUDGET?
910
430
210
47
170
If all AOD inverted for OA
Existing GEOS-Chem sources
If remove inorganic, dust and soot AOD from MISRIf remove N. Africa & Middle East
140 Final estimate (“likely” vertical distribution)150
Range estimated
by: Goldstein
and Galbally [2007]
All units in TgCyr-1
[Heald et al., in press, GRL]
FOCUS ON TODAY:
(3) Trying to simplify our description of organic aerosol composition
(1) Can measurements of AOD from space can shed any light on the budget of OA?
H:C
O:C
(2) Are primary biological aerosol particles (PBAP) an important source of OA?

PRIMARY BIOLOGICAL AEROSOL PARTICLES (PBAP)
POLLEN
BACTERIA VIRUSES
FUNGUS
ALGAEPLANTDEBRIS
Jaenicke [2005] suggests may be large (1000s Tg/yr)Elbert et al. [2007] suggest emission of fungal spores ~ 50 Tg/yr
PBAP estimates ~1000 Tg/yr would swamp all other sources of organic aerosol. KEY QUESTION: what is the size (lifetime) of these particles??
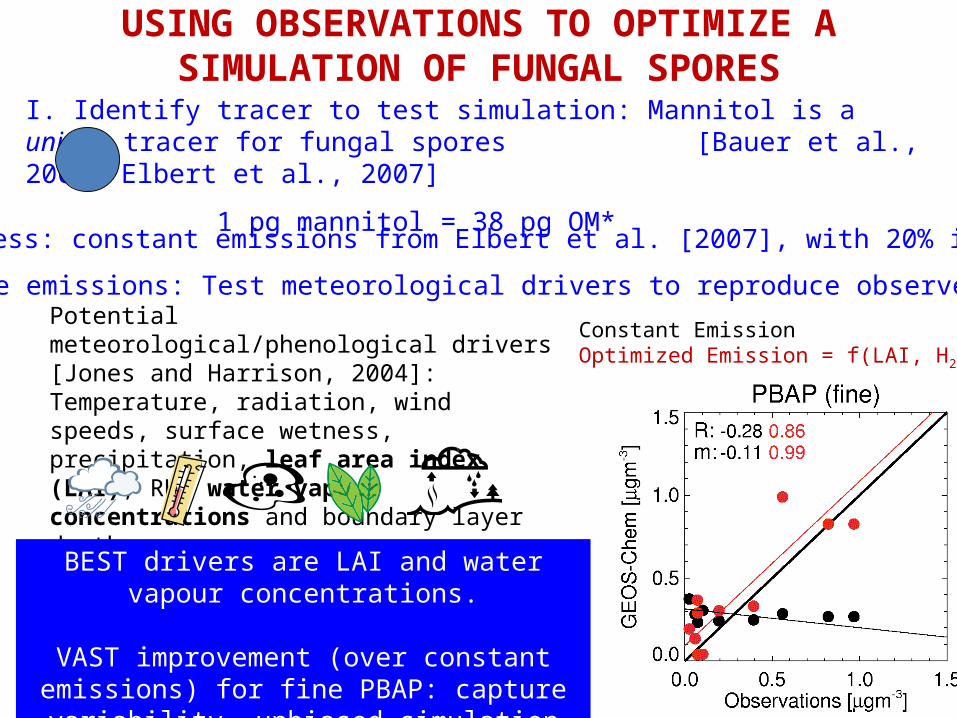
USING OBSERVATIONS TO OPTIMIZE A SIMULATION OF FUNGAL SPORES
I. Identify tracer to test simulation: Mannitol is a unique tracer for fungal spores [Bauer et al., 2008; Elbert et al., 2007]
1 pg mannitol = 38 pg OM*
II. First-guess: constant emissions from Elbert et al. [2007], with 20% in fine mode
III. Optimize emissions: Test meteorological drivers to reproduce observed variabilityPotential meteorological/phenological drivers [Jones and Harrison, 2004]: Temperature, radiation, wind speeds, surface wetness, precipitation, leaf area index (LAI), RH, water vapour concentrations and boundary layer depths
BEST drivers are LAI and water vapour concentrations.
VAST improvement (over constant emissions) for fine PBAP: capture variability, unbiased simulation
Constant EmissionOptimized Emission = f(LAI, H2O)
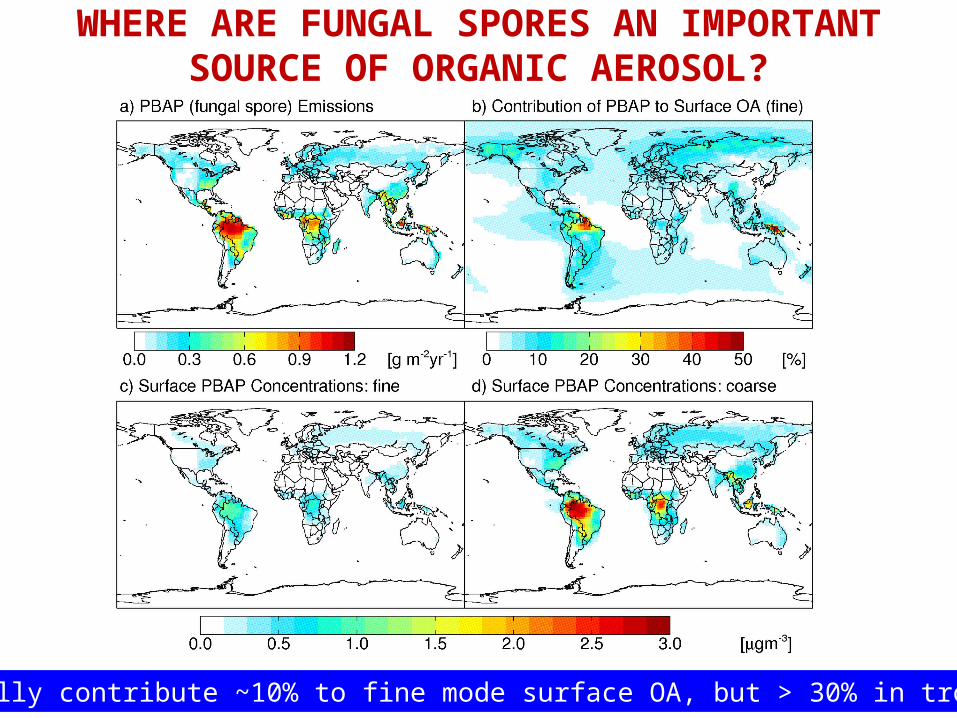
WHERE ARE FUNGAL SPORES AN IMPORTANT SOURCE OF ORGANIC AEROSOL?
Generally contribute ~10% to fine mode surface OA, but > 30% in tropics

WHEN ARE FUNGAL SPORES AN IMPORTANT SOURCE OF ORGANIC AEROSOL?
Pronounced seasonality in extratropics (corresponding to
vegetation cover), peaking in late-summer/fall as in measurements.
Taiwan
Hyytiala
[Sousa et al., 2008]
[Ho et al., 2005]
unpublished data, Hanna Manninen
Porto, Portugal
GEOS-Chem simulation
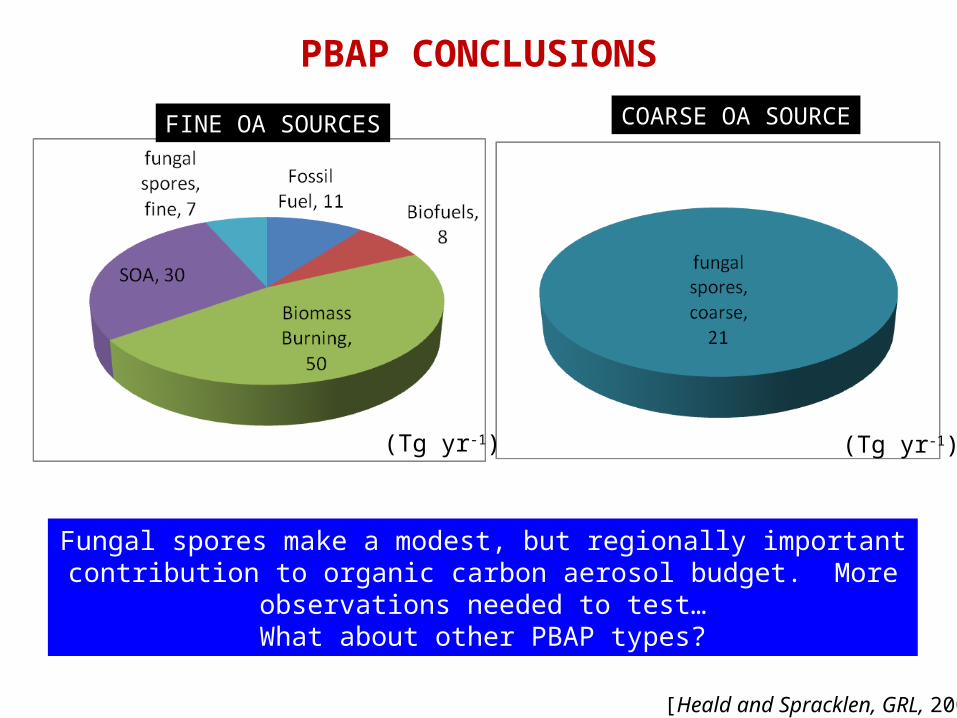
PBAP CONCLUSIONS
Fungal spores make a modest, but regionally important contribution to organic carbon aerosol budget. More observations needed to test…
What about other PBAP types?
FINE OA SOURCES COARSE OA SOURCE
(Tg yr-1) (Tg yr-1)
[Heald and Spracklen, GRL, 2009]

FOCUS ON TODAY:
(3) Trying to simplify our description of organic aerosol composition
(1) Can measurements of AOD from space can shed any light on the budget of OA?
H:C
O:C
(2) Are primary biological aerosol particles (PBAP) an important source of OA?
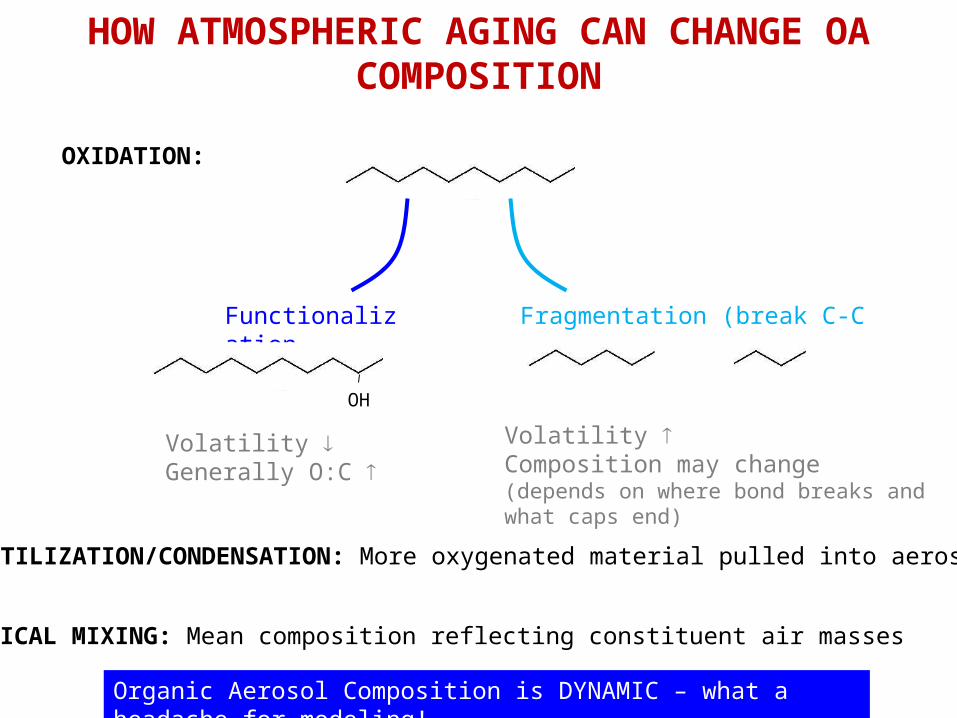
HOW ATMOSPHERIC AGING CAN CHANGE OA COMPOSITION
OXIDATION:
Functionalization Fragmentation (break C-C bonds)
OH
Volatility Generally O:C
Volatility Composition may change(depends on where bond breaks and what caps end)
VOLATILIZATION/CONDENSATION: More oxygenated material pulled into aerosol.
PHYSICAL MIXING: Mean composition reflecting constituent air masses
Organic Aerosol Composition is DYNAMIC – what a headache for modeling!
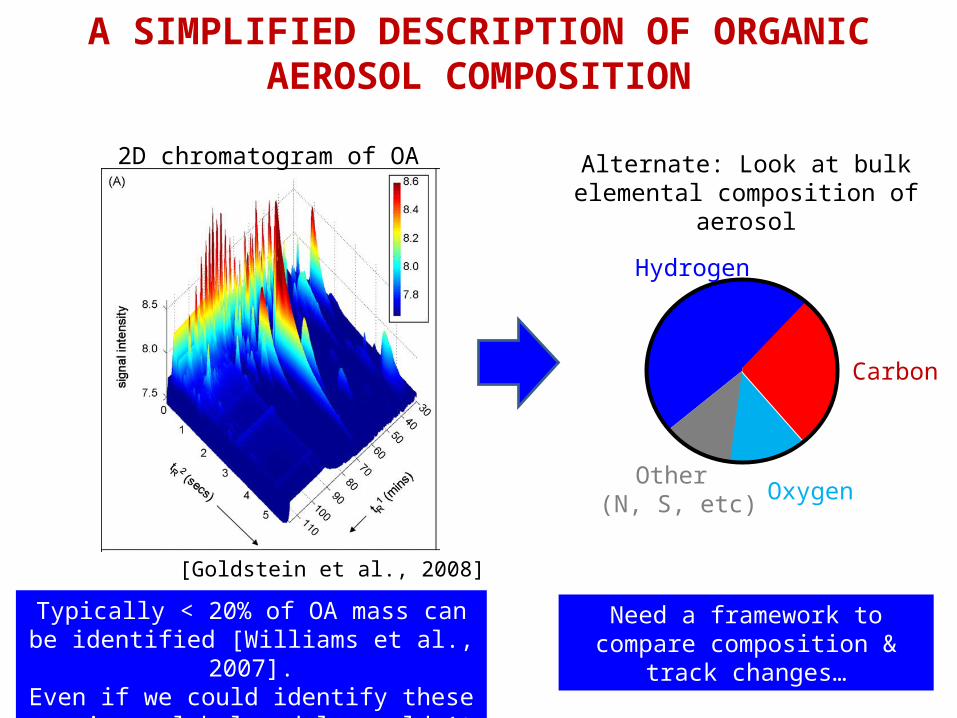
A SIMPLIFIED DESCRIPTION OF ORGANIC AEROSOL COMPOSITION
[Goldstein et al., 2008]
Typically < 20% of OA mass can be identified [Williams et al., 2007].
Even if we could identify these species, global models couldn’t handle this complexity!
2D chromatogram of OA
Hydrogen
Carbon
OxygenOther
(N, S, etc)
Alternate: Look at bulk elemental composition of aerosol
Need a framework to compare composition & track changes…

THE VAN KREVELEN DIAGRAMDeveloped by Van Krevelen in 1950’s to describe oil formation
Simple way to visualize changing composition

HOW DOES FUNCTIONALIZATION CHANGE AEROSOL COMPOSITION?
If replace aliphatic carbon (-CH2-) with functional group, composition changes as follows:
Example: Replace -CH2- with a carbonyl group -C(=O)- Add 1O, lose 2H, slope = -2

LAB & FIELD ORGANIC AEROSOL LINE UP IN A VAN KREVELEN DIAGRAM!
Surprisingly, despite complexity, aerosol composition changes during aging looks like carboxylation!
All measurements taken with the high resolution Aerosol Mass Spectrometer
(HR-AMS)

EXAMPLES FROM THREE FIELD CAMPAIGNS…
Riverside, California: dominated by urban sources
Amazon basin: clean, low loadings, more oxygenated
Mexico city (aircraft): regional sampling (clean & polluted)
Photochemical clock shows moves “down” the line with aging.
Some leveling off with long ages?

IMPLICATIONS
2. From a lab perspective: why does bulk OA “collapse” to this composition? What are the details of fragmentation & functionalization reactions in the atmosphere that result in net carboxylation?
1. From a modeling perspective: hope for a simple parameterization!
Need to understand aging timescale better (how fast do we move down the -1 slope?)
…
H:C
O:C
[Heald et al., GRL, 2010]
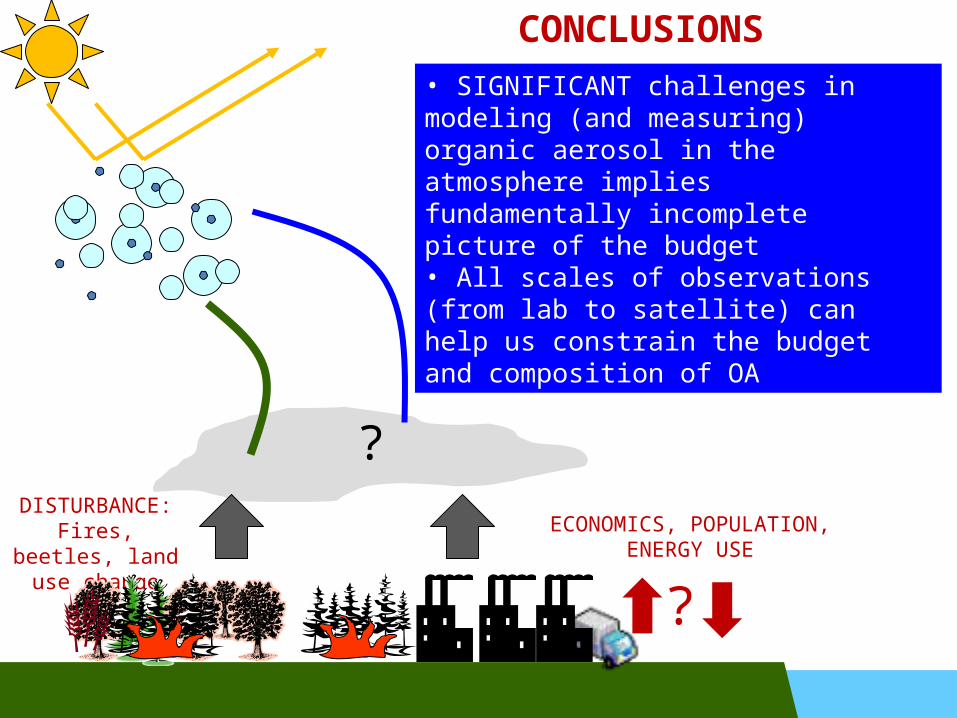
?DISTURBANCE:
Fires, beetles, land use change
ECONOMICS, POPULATION, ENERGY USE
?
CONCLUSIONS• SIGNIFICANT challenges in modeling (and measuring) organic aerosol in the atmosphere implies fundamentally incomplete picture of the budget• All scales of observations (from lab to satellite) can help us constrain the budget and composition of OA
ACKNOWLEDGEMENTS
Dave Ridley, Sonia Kreidenweis Easan Drury (CSU) (NREL)
Jesse Kroll Qi Chen & Scot Martin (MIT) (Harvard)
Jose Jimenez, Ken Docherty, Paulo Artaxo Delphine Farmer, Pete DeCarlo, (University of Sao Paulo)Allison Aiken (CU Boulder, currently or former) Dominick Spracklen
(University of Leeds)
Reed College and Julie Fry for the invitation!