ortac resources: kremnica project no. 2019the kremnica project is located in central slovakia 17 km...
TRANSCRIPT

Final
Ortac Resources: Kremnica Project No. 2019
Resource Estimate April 2012
Office Locations
Perth 87 Colin St, West Perth WA 6005 AUSTRALIA
PO Box 77, West Perth WA 6872 AUSTRALIA
Tel: +61 8 9213 9213 Fax: +61 8 9322 2576 ABN: 99 085 319 562 [email protected]
Brisbane Level 15, 300 Adelaide Street Brisbane QLD 4000 AUSTRALIA
PO Box 2207, Brisbane QLD 4001 AUSTRALIA
Tel: +61 7 3231 3800 Fax: +61 7 3211 9815 ABN: 99 085 319 562 [email protected]
Johannesburg Technology House, Greenacres Office Park, Cnr. Victory and Rustenburg Roads, Victory Park JOHANNESBURG 2195 SOUTH AFRICA
PO Box 2613, Parklands 2121 SOUTH AFRICA
Tel: + 27 11 782 2379 Fax: + 27 11 782 2396 Reg No. 1998/023556/07 [email protected]
Vancouver Suite 550, 1090 West Pender St, VANCOUVER BC V6E 2N7 CANADA
Tel: +1 604 683 7645 Fax: +1 604 683 7929 Reg No. 557150 [email protected]
Calgary Suite 850, 550 11th Avenue SW CALGARY, ALBERTA T2R 1M7
Tel +1 403 452 5559 Fax +1 403 452 5988 [email protected]
Belo Horizonte Afonso Pena 2770, CJ 201 A 205 Funcionários, 30.130-007, BELO HORIZONTE MG BRASIL
Tel: +55 (31) 3222-6286 Fax: +55 (31) 3222-6286 [email protected]
Oxford Lvl 3, The Magdalen Centre 1 Robert Robinson Avenue The Oxford Science Park OXFORD OX4 4GA
Tel: +44 1865 784 884 Fax: +44 1865 784 888 [email protected]
Website www.snowdengroup.com
This report has been prepared by Snowden Mining Industry Consultants (‘Snowden’) on behalf of Ortac Resources.
2012
All rights are reserved. No part of this document may be reproduced, stored in a retrieval system, or transmitted in any form or by any means, electronic, mechanical, photocopying, recording or otherwise, without the prior written permission of Snowden.
Prepared By L Farley BSc, MAusIMM Senior Consultant .................................................................
Reviewed By L Olssen
BSc, MAusIMM (CP) Principal Consultant ................................................................................................ I Jones BSc (Hons), MSc, FAusIMM (CP) Group General Manager – Geosciences ...............................
Issued by: Perth Office Doc Ref: 120531_FINAL_2019_Ortac_Kremnica_ResEst.docx
Last Edited: 31/05/2012 12:47:00 PM
Number of copies Snowden: 2 Ortac Resources: 2

Ortac Resources: Kremnica
Resource Estimate
. Final April 2012 3 of 37
1 Executive summary ............................................................................................................. 5
2 Introduction .......................................................................................................................... 7
3 Information sources ............................................................................................................. 9
3.1 Input data ................................................................................................................. 9
3.2 Data validation ......................................................................................................... 9
3.3 Bulk density .............................................................................................................. 9
3.4 QAQC .................................................................................................................... 10
4 Geological interpretation .................................................................................................... 11
4.1 Geological setting ................................................................................................... 11
4.2 Mineralised domains .............................................................................................. 13
4.3 Weathering surfaces .............................................................................................. 16
5 Coding and compositing of data ........................................................................................ 17
6 Statistical analysis of coded composite data ...................................................................... 18
7 Variography ....................................................................................................................... 22
7.1 Normal scores variograms ..................................................................................... 22
7.2 Indicator variography .............................................................................................. 23
8 Block modelling ................................................................................................................. 28
8.1 Block model ........................................................................................................... 28
8.2 Grade estimation .................................................................................................... 28
8.2.1 Ordinary kriging ...................................................................................... 28
8.2.2 Multiple indicator kriging ......................................................................... 29
9 Model validation................................................................................................................. 32
9.1.1 Global comparisons ................................................................................ 32
9.1.2 Visual validation ..................................................................................... 32
9.1.3 Grade trend plots ................................................................................... 33
10 Classification ..................................................................................................................... 34
11 Mineral Resource reporting ............................................................................................... 36
12 References ........................................................................................................................ 37
Tables
Table 1.1 Mineral Resource - Kremnica Gold project above a 0.40 g/t Au cut-off grade for open pit resources .......................................................... 5
Table 1.2 Mineral Resource - Kremnica Gold project above a 2.85 g/t Au cut-off grade for underground resources123 ............................................... 5
Table 3.1 Data files supplied by Ortac ...................................................................... 9
Table 4.1 Mineralised domains .............................................................................. 15
Table 5.1 Domain codes ........................................................................................ 17
Table 5.2 List of drillholes with selective sampling ................................................. 17

Ortac Resources: Kremnica
Resource Estimate
. Final April 2012 4 of 37
Table 6.1 Summary statistics by domain for gold ................................................... 19
Table 6.2 Summary statistics by domain for silver .................................................. 20
Table 6.3 Top cuts applied by domain gold ............................................................ 21
Table 6.4 Top cuts applied by domain silver .......................................................... 21
Table 7.1 Variogram model parameters for gold .................................................... 22
Table 7.2 Variogram model parameters for silver ................................................... 23
Table 7.3 Indicator variogram model parameters for gold – domain 10 .................. 24
Table 7.4 Indicator variogram model parameters for silver – domain 10 ................ 25
Table 7.5 Indicator variogram model parameters for gold – domain 11 .................. 26
Table 7.6 Indicator variogram model parameters for silver – domain 11 ................ 27
Table 8.1 Block model parameters for ordinary kriged estimate ............................. 28
Table 8.2 Block model parameters for indicator kriged estimate ............................ 28
Table 8.3 Search parameters for ordinary kriged grade estimation ........................ 29
Table 8.4 Search parameters for multiple indicator kriged grade estimation ........... 30
Table 8.5 Indicator cut-off grades for each threshold for domains 10 and 11 ......... 30
Table 9.1 Comparison of the mean declustered composite grade with the mean block model grade for gold within the primary search volume ................................................................................................... 32
Table 9.2 Comparison of the mean declustered composite grade with the mean block model grade for silver within the primary search volume ................................................................................................... 32
Table 10.1 JORC assessment and reporting criteria for estimation and reporting ................................................................................................. 35
Table 11.1 Mineral Resource - Kremnica Gold project above a 0.40 g/t Au cut-off grade for open pit resources ........................................................ 36
Table 11.2 Mineral Resource - Kremnica Gold project above a 2.85 g/t Au cut-off grade for underground resources123 ............................................. 36
Figures
Figure 4.1 First Vein System (Saint Barbara, 2009) ................................................ 12
Figure 4.2 The Šturec Resource and Surrounding Target Areas (Saint Barbara, 2009) ....................................................................................... 14
Figure 4.3 Mineralised domain wireframe surfaces ................................................. 16
Figure 9.1 Example cross section showing drillhole and block grades - 1229900 mN........................................................................................... 33
Figure 10.1 Example cross section showing model showing classification 1230050 mN........................................................................................... 34
Appendices
Histograms and log probability plots Appendix A
Variograms – ordinary kriging Appendix B
Variograms – indicator kriging Appendix C
Trend plots Appendix D

Ortac Resources: Kremnica
Resource Estimate
. Final April 2012 5 of 37
1 Executive summary Snowden Mining Industry Consultants ("Snowden") was commissioned by Ortac Resources Limited ("Ortac") to complete a resource estimate for the Schramen vein system within its Kremnica Gold project in Slovakia.
The resource estimate has been classified using the guidelines of the JORC Code (JORC, 2004) and reported separately for areas of potential open pit and underground mining. The Mineral Resource has been reported above a 0.40 g/t Au for the portion of the estimate which is potentially minable by open pit methods (Table 1.1). The potential open pit area was defined by an optimisation shell supplied by Ortac which was based on an economic cut-off grade of 0.26 g/t Au.
The Mineral Resource below the open pit optimisation has been reported above a cut-off of 2.85 g/t Au based on the assumption of underground mining (Table 1.2).
Table 1.1 Mineral Resource - Kremnica Gold project above a 0.40 g/t Au cut-off grade for open pit resources123
Resource Category Tonnes
(kt)
Density
(t/m3)
Au
(g/t)
Ag
(g/t)
AuEq
(g/t)
Au
(koz)
Ag
(koz)
AuEq
(koz)
Measured 3,000 2.17 1.69 13.5 1.96 161 1,291 187
Indicated 12,400 2.24 1.76 15.2 2.07 702 6,044 823
Measured + Indicated 15,400 2.23 1.75 14.9 2.05 863 7,335 1,010
Inferred 9,700 2.33 0.89 5.1 0.99 279 1,587 310
Total 25,100 2.27 1.42 11.1 1.64 1,141 8,922 1,320
Table 1.2 Mineral Resource - Kremnica Gold project above a 2.85 g/t Au cut-off grade for underground resources123
Resource Category Tonnes
(kt)
Density
(t/m3)
Au
(g/t)
Ag
(g/t)
AuEq
(g/t)
Au
(koz)
Ag
(koz)
AuEq
(koz)
Measured n/a n/a n/a n/a n/a n/a n/a n/a
Indicated 19 2.34 3.60 23.8 4.08 2 14 2
Measured + Indicated 19 2.34 3.60 23.8 4.08 2 14 2
Inferred 310 2.34 3.50 19.7 3.90 35 196 39
Total 328 2.34 3.51 20.0 3.91 37 211 41
The gold-silver mineralisation at Kremnica is part of a large low-sulphidation quartz-sericite-adularia epithermal-hydrothermal system hosted in Tertiary andesite volcanic flows and tuffs and lesser diorites and rhyolite dikes. It has been mined and explored since the 8th century with extensive modern exploration through drilling, adits and some open pit mining from the early 1960s through to the early 1990s.
1 Tonnes are reported to two significant figures. Grades are reported at two decimal places. Ounces are rounded to the nearest thousand. 2 Rounding may result in discrepancies in the table. 3 AuEq (gold equivalent) has been calculated for each block with an AuEq ratio of 50 parts Ag for every 1 part Au.

Ortac Resources: Kremnica
Resource Estimate
. Final April 2012 6 of 37
Snowden’s grade-tonnage estimate used data from the sampling of adits, surface and underground diamond drill core, surface reverse circulation drilling and trench samples. The database was compiled and verified by Ortac. Snowden’s validation checks indicate that the data is of sufficient quality to support the resource classifications applied.
Multiple indicator kriging was used to estimate the gold and silver grades into a block model constrained by the Ortac geological interpretation. This model reflects the interpreted structure and geology. Search ellipses and ranges used in estimation reflect the spatial continuity and trends of the mineralisation in each of the mineralised domains.
Density was assigned based on core measurements and measurements of bulk density from adits through the mineralised zone.
Snowden based the classification of the Mineral Resource upon a number of criteria, including the confidence in the geological interpretation, the integrity of the data, the spacing between the data, and the grade continuity as demonstrated by the variography.
The information in this report that relates to Mineral Resources as defined under the JORC Code (JORC, 2004) is based on information compiled by Mr Owen Mihalop who takes responsibility for the data and the geological interpretation; and Ms Lynn Olssen and Mr Ivor Jones who take responsibility for the estimation.
Mr Ivor Jones, (BSc (Hons), MSc, FAusIMM (CP)), is the Group General Manager - Geosciences at Snowden Mining Industry Consultants and assisted in producing the resource estimate based upon the data and interpretations provided by Ortac. Mr Jones has sufficient experience relevant to the type of deposit under consideration and to the activity which he is undertaking to qualify as a Competent Person as defined under the JORC Code.
Ms Lynn Olssen, (BSc, MAusIMM (CP)), is a Principal Consultant at Snowden Mining Industry Consultants and assisted in producing the resource estimate based upon the data and interpretations provided by Ortac. Ms Olssen has sufficient experience relevant to the type of deposit under consideration and to the activity which he is undertaking to qualify as a Competent Person as defined under the JORC Code.
Mr Owen Mihalop (MCSM, BSc (Hons), MSc, CEng, MIMMM) is the Technical Director of Ortac Resources Limited and provided the sample database as well as geological interpretations for the resource estimation. Mr Mihalop has sufficient experience relevant to the style of mineralisation and type of deposit under consideration and to the activity which he is undertaking to qualify as a Competent Person as defined under the JORC Code.

Ortac Resources: Kremnica
Resource Estimate
. Final April 2012 7 of 37
2 Introduction Snowden Mining Industry Consultants ("Snowden") was commissioned by Ortac Resources Limited ("Ortac") to complete a resource estimate for the Schramen vein system within its Kremnica Gold project in Slovakia. This resource is an update of the 2011 resource estimate which was also carried out by Snowden.
The Kremnica project is located in central Slovakia 17 km west of Banská Bystrica. The project comprises two contiguous properties: the Kremnica Mining Licence with an area of 11.79 km2
and the Lutila Exploration Licence with an area of 63.11 km2.
The gold-silver mineralisation at Kremnica is part of a large low-sulphidation quartz-sericite-adularia epithermal-hydrothermal system hosted in Tertiary andesite volcanic flows and tuffs and lesser diorites and rhyolite dikes.
Gold mining commenced at Kremnica in the 8th century and historical output totals 46,000 kg (1.5 million ounces) of gold and 208,000 kg (6.7 million ounces) of silver. Production was mostly from underground mine workings with some small open pits.
The Slovak Geological Survey carried out extensive exploration in the Kremnica area from 1981 to 1987, drilling 34 holes for over 25,000 m, although much of this was outside the main area of interest at Kremnica: the Šturec zone here referred to as the Schramen Vein system. The State-owned company, Rudne Bane, operated at Kremnica from 1987 to 1992. Rudne Bane undertook extensive adit development within the Šturec zone and produced 50,028 t averaging 1.54 g/t Au from a small open pit. However, the operation was not profitable and subsequently closed. There has been no production since that time.
Argosy Mining Corporation of Vancouver (Argosy) acquired the property in 1995 and completed a diamond core drilling programme in 1996 and a combined diamond core and reverse circulation (RC) drilling programme in 1997 for a total of 79 holes (12,306 m). This work led to an open pit resource estimate of 11.26 Mt at a grade of 1.8 g/t Au and 12.5 g/t Ag over the main Šturec zone.
Tournigan Gold Corporation (Tournigan) acquired the rights to the Kremnica project by purchasing Kremnica Gold a.s. from Argosy in July 2003. Tournigan then completed 104 diamond and reverse circulation drillholes (for 14,000 m) over the period 2004 to 2008. The majority of these holes were over the main Šturec zone, but also included contiguous mineralisation north and south of the main Šturec zone.
Following from Tournigan’s exploration, Beacon Hill Consultants (1988) Ltd, based in Vancouver, produced a pre-feasibility study on the Kremnica project in 2007 that established open pit reserves over the main Šturec zone of 16.23 Mt at a grade of 1.40 g/t Au and 11.08 g/t Ag. This study covered mining, processing, infrastructure and environmental matters, as well as an economic analysis.
In December 2009, following the acquisition of the Kremnica project, Ortac Resources completed a revision of the resource estimate instigated by Tournigan over the central portion of the Šturec zone in collaboration with Saint Barbara LLP. This estimate was subsequently updated by Snowden in 2011.
The May 2012 update includes 13 additional drillholes for a total of 2771.7m.

Ortac Resources: Kremnica
Resource Estimate
. Final April 2012 8 of 37
The scope of work for the Kremnica resource estimate includes:
• Data loading and integrity validation.
• Data coding, compositing and statistical analysis.
• Variography (gold and silver).
• Development of a block model defining each domain and assignment of density values to each domain.
• Estimation of gold and silver by ordinary kriging or multiple indicator kriging.
• Validation of the block model through visual inspection, input/output means and moving window statistics.
• Classification of the estimate in accordance with the JORC Code (JORC, 2004) guidelines.
• Reporting of the estimate and compilation of supporting documentation in accordance with JORC Code (JORC, 2004) and associated guidelines.

Ortac Resources: Kremnica
Resource Estimate
. Final April 2012 9 of 37
3 Information sources
3.1 Input data
Ortac supplied a desurveyed drillhole file in Datamine format (hole2011.dm) containing the additional drillholes since the previous 2011 estimate. This data was combined with the two files supplied for the 2011 estimate (holes.dm and holes1.dm). The files comprise data from the sampling of adits, surface and underground diamond drill core, surface reverse circulation samples and trench samples.
Wireframes of the surface topography, mineralised interpretations, weathering and geological domains were also provided in Datamine format. Table 3.1 summarises the data files supplied by Ortac that have been used in the resource estimation.
Table 3.1 Data files supplied by Ortac
Name Description
hole2011
holes.dm
Desurveyed drillhole file (2012 data)
Desurveyed drillhole file (2011 data)
holes1.dm Desurveyed drillhole file (2011 data)
fw2012tr/pt.dm Wireframe representing footwall to the main zone of mineralisation
hw2012tr/pt.dm Wireframe representing hangingwall to the main zone of mineralisation
sr2012tr/pt.dm Wireframe representing western boundary to the southern ridge mineralisation
dtmtr/pt.dm Wireframe representing topography
oxidetr/pt.dm Wireframe representing base of oxidation
sulphtr/pt.dm Wireframe representing top of sulphide mineralisation
crushtr/pt.dm Wireframe representing crush zone around mineralisation
fallentr/pt.dm Wireframe representing collapse zone over old workings
3.2 Data validation
The database was compiled and verified by Ortac. Snowden’s carried out basic validation checks which indicate that the data is of sufficient quality to support the resource classifications applied.
3.3 Bulk density
Density was assigned based on core measurements and measurement of bulk density from adits through the mineralised zone as supplied by Ortac. Variations in the density are known to exist due to the nature of the broken mineralisation in the collapse zone and due to void zones, and this variation has been estimated and incorporated into the model (Saint Barbara, 2009).
A global density of 2.34 t/m3 was applied to the main resource model. Within the collapse zone a density reduction factor of 0.88 was subsequently applied to take into account the broken nature of this zone. This factor was estimated by measuring the weight of material excavated from adits within the collapse zone and comparing it with the estimated weight (surveyed volume x density) of the mined out space itself.
A separate density factor was applied to the void zones by estimating the amount of void occurring within a block and applying that as a reduction factor to the density.

Ortac Resources: Kremnica
Resource Estimate
. Final April 2012 10 of 37
3.4 QAQC
As part of the 2011 resource estimate Snowden reviewed the report on the QAQC of the Kremnica prospect prepared by Saint Barbara LLP (2009) and is of the opinion that the Kremnica assay data is acceptable for resource estimation and for the classification of the resource estimate as applied. Snowden has not reviewed the QAQC results for the recent drilling program, however they understand that Ortac has reviewed this data and that there are no material issues.

Ortac Resources: Kremnica
Resource Estimate
. Final April 2012 11 of 37
4 Geological interpretation
4.1 Geological setting
The following information regarding the geological setting of the Kremnica district has been taken from the Saint Barbara resource estimate report (2009).
The predominant host rock in the Kremnica district is Tertiary andesite. It occurs as flows with minor inter-bedded tuffs and breccias. Diorites have been intersected in some drillholes and are thought to be both pre- and post-andesite. Rhyolite dykes are localised in north-south and southeast-striking structures. Rhyolite is relatively rare in the Šturec deposit, occurring as narrow dykes at the north end of the deposit and at depth. The Tertiary volcanic sequence overlies Mesozoic limestone, which has been intersected in some of the deeper drillholes in the district. These rocks are cut by north- to northeast-striking, steeply dipping faults that form a series of horsts and grabens.
As shown in Figure 4.1, the principal vein system at Kremnica (called the “First Vein System”) strikes north to north-northeast through the centre of the district and includes the Šturec deposit. The “Second Vein System” is near the town of Kremnica and consists of north- and northwest-striking veins. Due to its location beneath the town of Kremnica, the Second Vein System is not considered a viable resource or exploration target.
Gold-silver mineralisation at Kremnica is part of a large low-sulphidation quartz-sericite-adularia epithermal-hydrothermal system hosted in Tertiary andesite volcanic flows and tuffs and lesser diorites and rhyolite dykes. Host volcanic rocks are part of the northwest extremity of the relict Tertiary Carpathian Volcanic Arc that extends irregularly south from Slovakia to Turkey.
Mineralisation occurs in large banded to massive quartz veins, smaller quartz veins and sheeted veins, quartz stockwork veining, and silicified hydrothermal breccias. Geological work completed by Tournigan in 2005 demonstrated that gold and silver mineralisation within the sheeted veins and stockwork veining zones is primarily localised in areas immediately adjacent to the main vein zones.
Vein mineralogy consists of quartz, calcite, adularia, sericite-illite, and lesser chalcedony. Vein calcite is typically evidenced by quartz-after-calcite pseudomorph textures.
Alteration consists of a core of intense silicification (abundant quartz veining and silica flooding of vein wall rock), and large zones of argillic and propylitic clay alteration, which can include minor disseminated pyrite. Silicification is primarily quartz with lesser chalcedony.

Ortac Resources: Kremnica
Resource Estimate
. Final April 2012 12 of 37
Figure 4.1 First Vein System (Saint Barbara, 2009)

Ortac Resources: Kremnica
Resource Estimate
. Final April 2012 13 of 37
Gold occurs freely and in non-refractory association with sulphides and with silver as electrum. Besides electrum, silver occurs in the minerals polybasite, pyrargyrite, and argentite. Sulphide minerals consist predominately of pyrite and marcasite with much lesser amounts of chalcopyrite, arsenopyrite, stibnite, sphalerite, and galena. Sulphide concentrations rarely exceed 2% and average 0.5%. Average gold grades in the main Schramen Vein are approximately 2.0 g/t Au, but high-grade zones can exceed 30 g/t Au. Silver/gold ratios vary, but average approximately 8.5:1.
Large mineralised banded to massive quartz veins and associated silica, argillic, and propylitic alteration zones are localised along a major, broad structural zone that strikes approximately north to northeast and is mineralised for a length of at least 6.5 km. Some 80 veins are documented within the Kremnica vein system, with individual vein groups being up to 100 m thick.
The Kremnica vein system is reported to occur within a horst structure that is bounded by a larger, district-wide graben structure. Horst-graben structures imply normal and/or reverse faulting, but earlier, pre-mineralisation strike-slip movement within the structural zone may have occurred. This relation could have implications for future exploration within and outside the documented areas of mineralisation.
As reported by Smith and Kirkham (2004), a large area of argillic/propylitic alteration associated with a rhyolite flow-dome complex containing broad, low-level Au, Ag, and As- Sb-Hg-Tl soil geochemical anomalies occurs approximately 5 km south of, and on strike with, the main part of the Kremnica deposit. This area may represent the Kremnica mineralised volcanic/hydrothermal system at higher levels.
4.2 Mineralised domains
The Šturec deposit occurs in the southern part of the central First Vein System (Figure 4.2).

Ortac Resources: Kremnica
Resource Estimate
. Final April 2012 14 of 37
Figure 4.2 The Šturec Resource and Surrounding Target Areas (Saint Barbara, 2009)
As reported by Saint Barbara (2009), the deposit is continuously mineralised for 1,200 m along strike, is typically 100 m to 150 m wide, and extends to a known depth of at least 300 m. The deposit is open to extension both at depth and to the north and south. The heart of the deposit is the Schramen massive to sheeted quartz vein, which is up to 100 m wide along a 500 m strike section. The Schramen vein strikes almost due north, generally dips steeply to the east, and thins to the north, south, and at depth.
The second important element of the Šturec deposit is a northeast-striking quartz vein system that joins with the northern part of the Schramen vein. This vein system projects southwest away from the Schramen vein where it outcrops approximately 100 m west of the Schramen vein. It then bends to the south and strikes parallel to the Schramen vein. This vein system dips 40° to 55° east, re-joining with the Schramen vein at depth. Zones of stockwork gold mineralisation occur between the two principal veins. There are also numerous late crosscutting veins.

Ortac Resources: Kremnica
Resource Estimate
. Final April 2012 15 of 37
The effects of past mining are an important feature in the Šturec deposit. Portions of the two main vein systems have been mined from the surface and underground. Parts of the veins that were mined are filled with old mine backfill. A large fractured or brecciated zone now exists in the upper part of the deposit, which is believed to be partly attributable to past mining activity. Beacon Hill referred to this as being an “area of subsidence”.
Hydrothermal breccias are closely associated with the principal vein systems in the district. They are usually composed of quartz vein material, strongly silicified andesite, and (rarely) rhyolite clasts cemented by iron-sulphide-bearing silica. They occur predominately adjacent to the veins but breccias can merge into veins vertically and/or along strike.
The South Ridge Target occurs to the south of the Šturec deposit (Figure 4.2). It changes character from the typical white, vuggy banded epithermal quartz vein exemplified at the Šturec deposit to a more chalcedonic-pyrite silicified breccia to the south. Several splays also occur and the average grade of the mineralisation drops. The western footwall side of the South Ridge zone is defined as a moderately east-dipping (±45°) mineralised structure (vein system) that converges with the Schramen vein at depth and along strike to the north. At 1,230,470S on the mine grid, a major cross structure diverges to the southwest. It branches off the Schramen vein and can be traced on the surface over the ridge crest and down the west flank of the ridge to the field above the village of Lúcky. The vein system appears to be composed of three or more sets of veins striking between 35° to 80° northeast, and dips at between 65° to 70° to the south-southeast. The veins are surrounded by zones of intense stockwork veining and silicification. Between these two major structures is a wedge-shaped block that contains stockwork vein mineralisation and large crosscutting (ladder) veins.
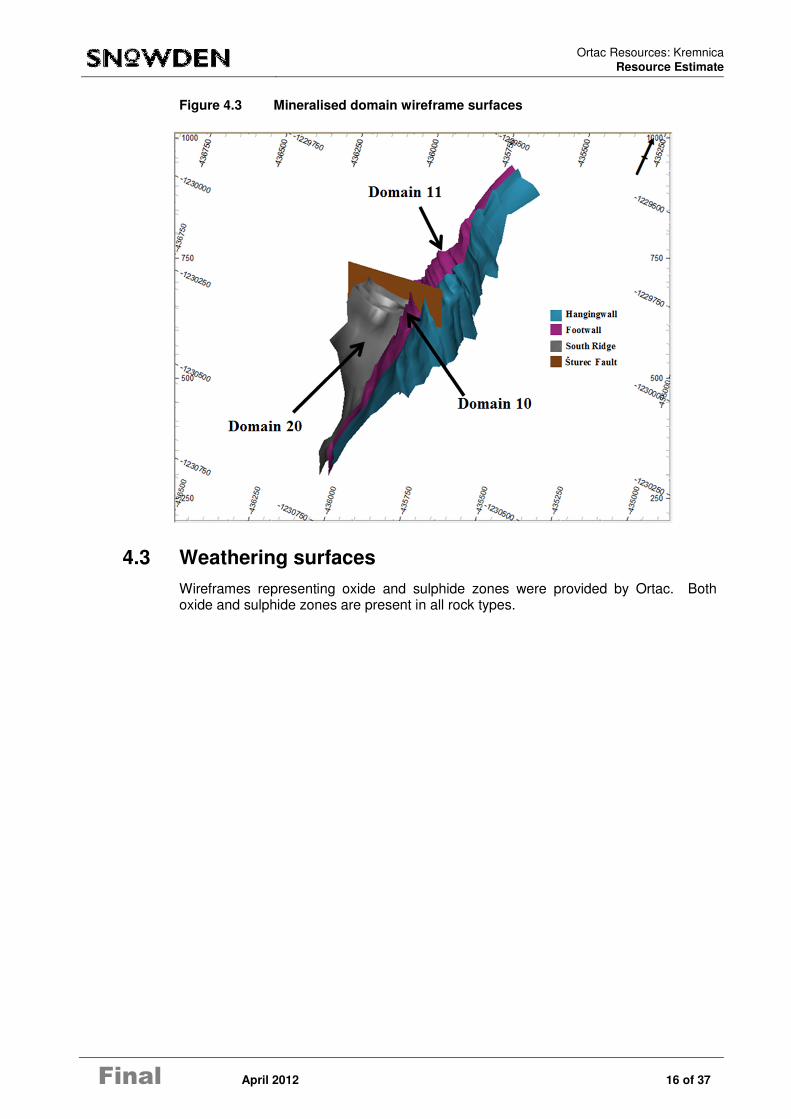
Figure 4.3 illustrates the main mineralised domains supplied by Ortac, which have been used estimation. These domains are also summarised in Table 4.1. Note the two main mineralised domains (domains 10 and 11) are divided by the Šturec Fault.
Table 4.1 Mineralised domains
Domain code Description
10 Mineralisation within the southern part of the Schramen Vein system (south of the Šturec Fault)
11 Mineralisation within the northern part of the Schramen Vein system (north of the Šturec Fault)
20 Mineralisation within the South Ridge Target
30 The collapse zone north of the Šturec Fault
Ortac Resources: Kremnica
Resource Estimate
. Final April 2012 16 of 37
Figure 4.3 Mineralised domain wireframe surfaces
4.3 Weathering surfaces
Wireframes representing oxide and sulphide zones were provided by Ortac. Both oxide and sulphide zones are present in all rock types.

Ortac Resources: Kremnica
Resource Estimate
. Final April 2012 17 of 37
5 Coding and compositing of data The validated dataset was coded by mineralised domain as shown in Table 5.1. Weathering domains were also initially coded in the data however review of the statistics in these domains indicated that the oxide and sulphide grade populations are similar and as such these domains were combined for all further analysis and estimation.
Table 5.1 Domain codes
Field name Value Description
RCODE 0 Waste zone (south of the Šturec Fault)
1 Waste zone (north of the Šturec Fault)
10 Mineralisation within the southern part of the Schramen Vein system (south of the Šturec Fault)
11 Mineralisation within the northern part of the Schramen Vein system (north of the Šturec Fault)
20 Mineralisation within the South Ridge Target
30 Collapse Zone
99 Void, Soil, Backfill
The coded dataset was composited to downhole intervals of 1 m and the composite lengths adjusted to ensure all intervals were included by setting MODE=1 in the Studio 3 compositing process COMPDH.
As a result of previous selective sampling practices where only mineralised zones were sampled, there are portions of drillholes containing absent grades which should contain low grade assays. In these drillholes, absent grade values for gold and silver (fields AUPPM and AGPPM) were reset to 0.001. Table 5.2 shows a list of drillholes which contained absent grade values within the mineralised zone.
Table 5.2 List of drillholes with selective sampling
BHID BHID BHID BHID
KAT-1 KV-14 KVS-12 KVS-3
KAT-2 KV-15 KVS-16 KVS-4
KC-V-14 KV-18 KVS-17 KVS-6
KG-LNV-1 KV-19 KVS-2 KVS-7-A
KG-LNV-2 KV-2 KVS-20 KVS-7-B
KG-LNV-3 KV-3 KVS-21 KVS-8-A
KG-LNV-4 KV-4 KVS-22 KVS-9-A
KG-LNV-5 KV-5 KVS-23 KVS-9-B
KG-LVS-1 KV-6 KVS-24 UKB-1
KG-LVS-2 KVS-1 KVS-25 VKB-1
KG-LVZ-1 KVS-10-A KVS-26
KR-8 KVS-10-B KVS-27
KV-1 KVS-11-A KVS-28
Drilling intervals that fell within voids (as coded in the drill data) had a value of 1 assigned to the field VOID.

Ortac Resources: Kremnica
Resource Estimate
. Final April 2012 18 of 37
6 Statistical analysis of coded composite data Statistical analysis was carried out on the composited data in each mineralised domain to determine the grade characteristics and ensure the domains were appropriate for estimation.
Cell weighted declustering was carried out for domains 10 and 11 to remove bias due to data clustering. No declustering was required in the other domains.
As discussed previously, initial analysis of the data by weathering domain indicated that there is no difference in grade population between the oxide and sulphide domains and as a result these were combined for all further analysis and estimation.
Table 6.1 and Table 6.2 show the summary statistics for gold and silver by mineralised domain. Histogram and log probability plots for all data are located in Appendix A.
The statistical analysis shows that the distributions of the main domains, 10 and 11, show mixed populations with a high degree of skew. As a result multiple indicator kriging was recommended and used for these domains.
Domain 30 (Collapse Zone) also shows similar characteristics to the main ore zones; however, due to the fact that this domain was a collapse zone (the mine collapsed around old workings) and was consequently to be classified as an Inferred estimate only, ordinary kriging was considered suitable.
The waste domains and domain 20 (South Ridge) are less skewed and are amenable to ordinary kriging with top cuts applied.
Top cuts were applied to both the gold and silver grades prior to the ordinary kriging grade estimation process. The top cut values shown in Table 6.3 and Table 6.4 were determined from histograms at the point where the distribution begins to breakdown and become erratic. No top cuts were applied to the multiple indicator kriged estimates for the two main ore zones (domains 10 and 11), however an ordinary kriged estimate was also run as a sensitivity in these domains and top cuts were applied for the ordinary kriged estimate.

Ortac Resources: Kremnica
Resource Estimate
. Final April 2012 19 of 37
Table 6.1 Summary statistics by domain for gold
Statistics Domain 0 Domain 1 Domain 10 Domain 11 Domain 20 Domain 30 Domain 99
Samples 12,019 34,306 1,407 6,156 2,663 347 1,315
Minimum 0.00 0.00 0.00 0.00 0.00 0.00 0.00
Maximum 18.05 47.79 77.00 264.34 20.61 18.58 43.42
Mean 0.05 0.10 0.83 2.04 0.74 1.11 0.58
Standard deviation 0.23 0.72 1.63 7.03 1.31 2.06 1.71
CV 5.10 7.09 1.95 3.45 1.77 1.85 2.93
Variance 0.05 0.51 2.64 49.36 1.71 4.23 2.92
Skewness 42.48 30.15 13.32 27.49 7.20 5.04 13.85
10% 0.00 0.00 0.11 0.18 0.12 0.10 0.00
20% 0.00 0.00 0.19 0.32 0.19 0.15 0.00
30% 0.00 0.00 0.23 0.48 0.26 0.25 0.00
40% 0.00 0.00 0.30 0.69 0.33 0.32 0.01
50% 0.00 0.00 0.40 0.94 0.41 0.43 0.30
60% 0.00 0.00 0.54 1.28 0.51 0.62 0.19
70% 0.01 0.02 0.71 1.76 0.66 0.84 0.39
80% 0.03 0.05 1.08 2.50 0.90 1.46 0.72
90% 0.11 0.15 1.82 3.98 1.46 2.56 1.66
95% 0.21 0.35 2.86 5.91 2.28 4.18 2.57
97.50% 0.38 0.73 4.44 8.68 3.42 6.24 3.85
99% 0.74 1.78 6.04 18.06 6.71 12.45 5.71

Ortac Resources: Kremnica
Resource Estimate
. Final April 2012 20 of 37
Table 6.2 Summary statistics by domain for silver
Statistics Domain 0 Domain 1 Domain 10 Domain 11 Domain 20 Domain 30 Domain 99
Samples 11,444 33,303 1,407 6,156 2,663 347 1,291
Minimum 0.00 0.00 0.00 0.00 0.00 0.00 0.00
Maximum 260.00 509.50 623.00 1018.05 53.39 26.23 249.13
Mean 0.55 1.63 6.26 17.60 4.18 4.28 6.28
Standard deviation 3.40 7.67 9.60 32.79 4.86 3.65 15.66
CV 6.23 4.71 1.53 1.86 1.16 0.85 2.50
Variance 11.58 58.76 92.20 1075 23.58 13.33 245.20
Skewness 44.05 21.86 20.07 13.64 3.65 1.84 8.94
10% 0.00 0.00 1.16 1.98 0.66 0.80 0.00
20% 0.00 0.00 1.80 3.47 1.12 1.39 0.00
30% 0.00 0.00 2.25 5.35 1.62 1.92 0.00
40% 0.00 0.00 2.99 7.56 2.13 2.80 0.02
50% 0.00 0.00 3.70 10.26 2.85 3.26 1.40
60% 0.03 0.00 4.80 13.00 3.60 3.98 3.10
70% 0.11 0.27 6.20 17.66 4.57 4.94 5.21
80% 0.35 1.16 8.33 23.88 6.00 6.72 9.50
90% 1.10 3.70 13.45 38.22 8.73 9.50 16.90
95% 2.30 7.27 20.53 54.28 12.00 11.87 24.71
97.50% 7.20 13.10 28.00 76.32 17.00 12.71 38.02
99% 11.63 27.32 41.12 115.46 26.80 16.08 52.91

Ortac Resources: Kremnica
Resource Estimate
. Final April 2012 21 of 37
Table 6.3 Top cuts applied by domain gold
Domain Top cut
Au (g/t)
Number of samples
cut
Uncut mean
Cut mean
Uncut standard deviation
Cut standard deviation
Uncut CV
Cut CV
0 1.2 51 0.05 0.04 0.23 0.11 5.10 3.00
1 3.0 179 0.10 0.06 0.72 0.22 7.09 3.48
10 10.0 5 1.03 0.93 6.68 1.23 2.51 1.33
11 12.0 62 1.93 1.66 4.58 1.75 2.37 1.05
20 10.0 13 0.74 0.68 1.31 0.92 1.77 1.37
30 10.0 4 1.11 0.94 2.06 1.33 1.85 1.41
Table 6.4 Top cuts applied by domain silver
Domain Top cut
Ag (g/t)
Number of samples
cut
Uncut mean
Cut mean
Uncut standard deviation
Cut standard deviation
Uncut CV
Cut CV
0 15 45 0.55 0.41 3.40 6.23 1.25 3.03
1 40 191 1.63 1.21 7.67 4.71 3.55 2.94
10 55 11 8.65 7.72 19.21 2.22 8.00 1.04
11 100 52 16.33 14.78 25.84 1.58 14.39 0.97
20 32 14 4.18 4.00 4.86 1.16 4.13 1.04
30 n/a n/a 4.28 n/a 3.65 n/a 0.85 n/a

Ortac Resources: Kremnica
Resource Estimate
. Final April 2012 22 of 37
7 Variography
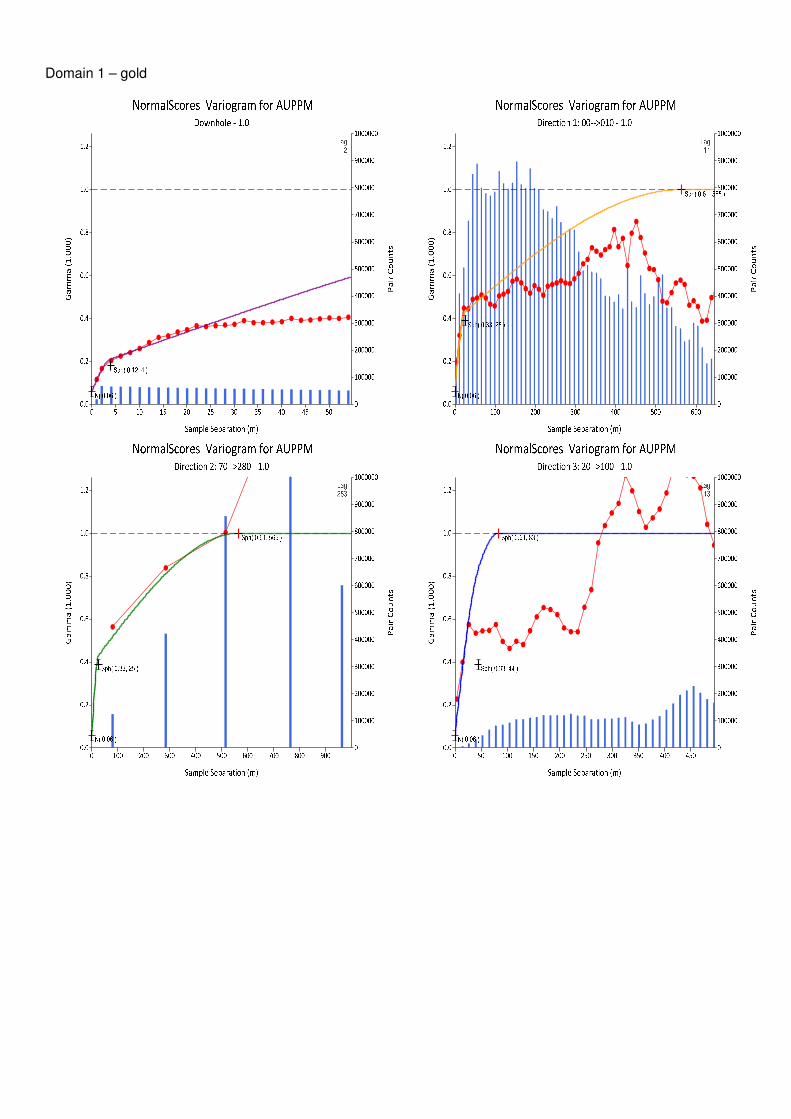
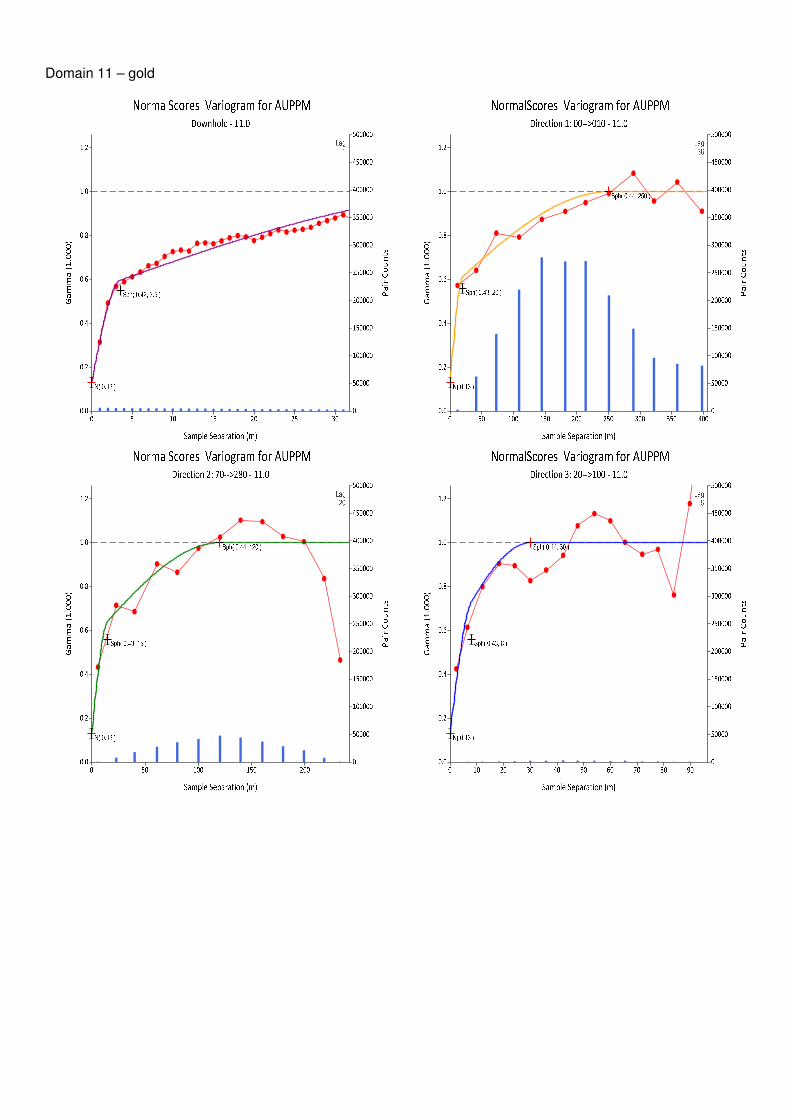
7.1 Normal scores variograms
For the ordinary kriging estimates, normal scores variograms were calculated and modelled for all domains due to the positively skewed nature of the grade distributions. The variogram models subsequently back-transformed into the original distribution prior to estimation.
The back-transformed variogram models for gold and silver are tabulated in Table 7.1 and Table 7.2 respectively. All variogram models are located in Appendix B.
Table 7.1 Variogram model parameters for gold
Domain Orientations Nugget Structure 1 Structure 2
Sill Range Sill Range
0 00/010 90/000 00/100
0.43 0.40 25 25 9
0.17 90 90 11
1 00/010 70/280 20/100
0.18 0.59 25 25 44
0.23 565 565 83
10 00/010 90/000 00/100
0.34 0.35 35 15 5
0.31 240 110 18
11 00/010 70/280 20/100
0.32 0.51 20 15 8
0.17 250 120 30
20 00/010 90/000 00/100
0.25 0.50 10 3 7
0.25 40 6 43
30 00/010 90/000 00/100
0.34 0.49 12 1 4
0.17 13 5 40

Ortac Resources: Kremnica
Resource Estimate
. Final April 2012 23 of 37
Table 7.2 Variogram model parameters for silver
Domain Orientations Nugget Structure 1 Structure 2
Sill Range Sill Range
0 00/010 90/000 00/100
0.49 0.48 63 70 28
0.02 133 178 34
1 00/010 70/280 20/100
0.19 0.55 20 7 28
0.25 42 41 34
10 00/010 90/000 00/100
0.27 0.40 14 27 3
0.33 264 104 18
11 00/010 70/280 20/100
0.22 0.55 25 7 5
0.24 195 159 39
20 00/010 90/000 00/100
0.08 0.62 5 6 2
0.31 22 54 5
30 00/010 90/000 00/100
0.24 0.31 11 3 2
0.46 12 5 4
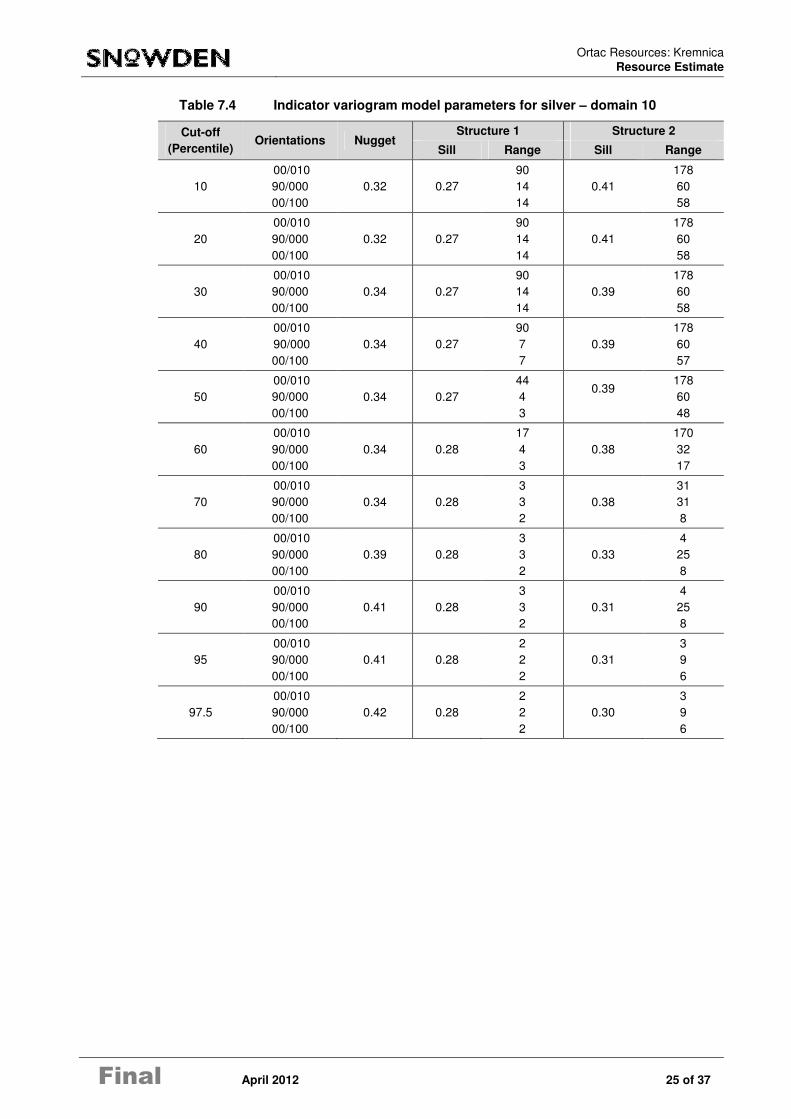
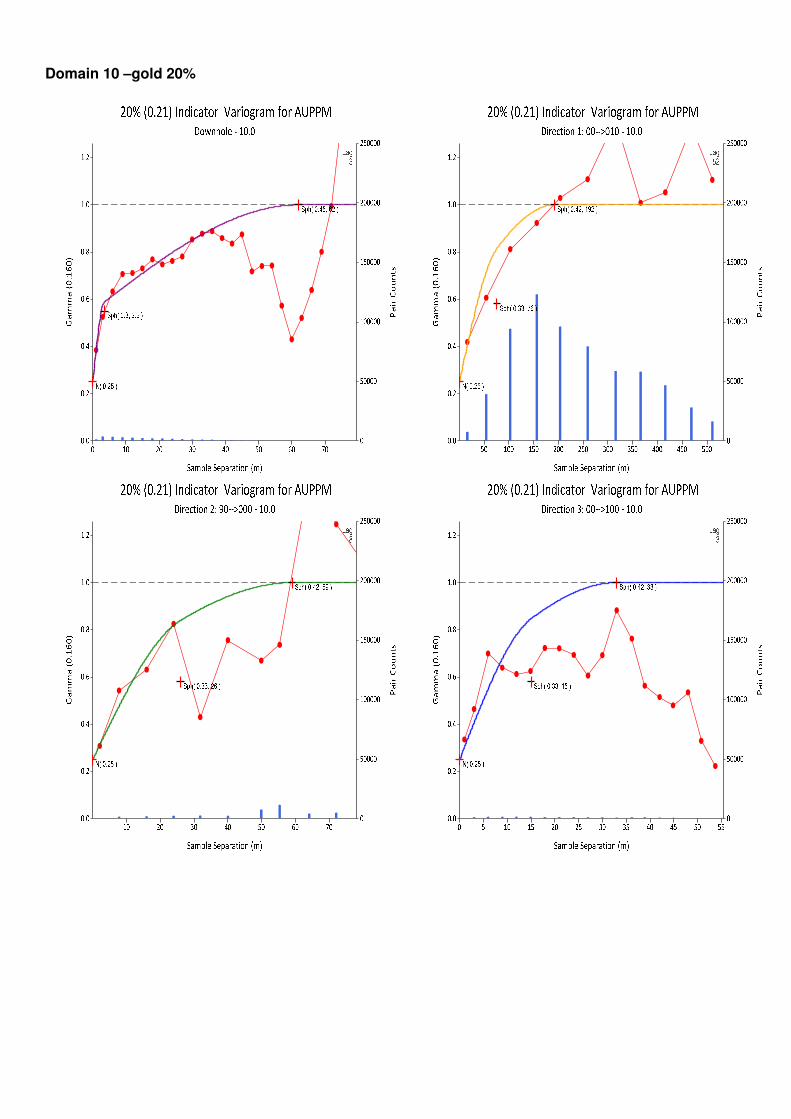
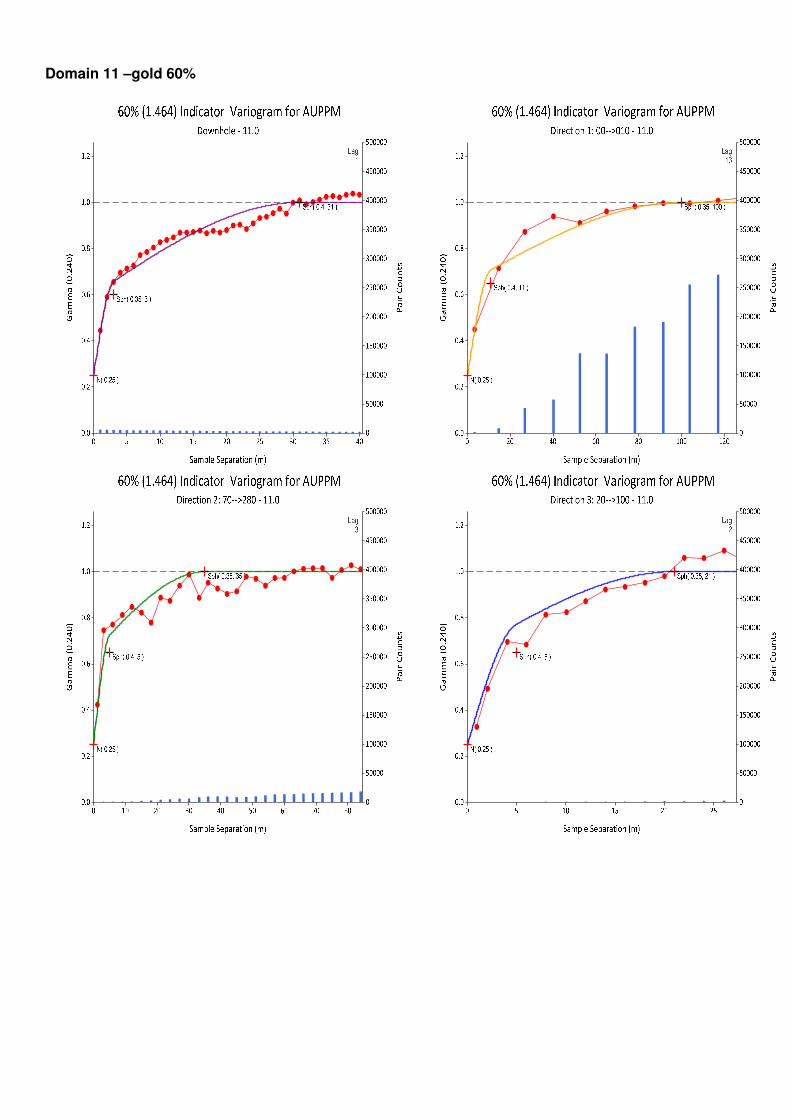
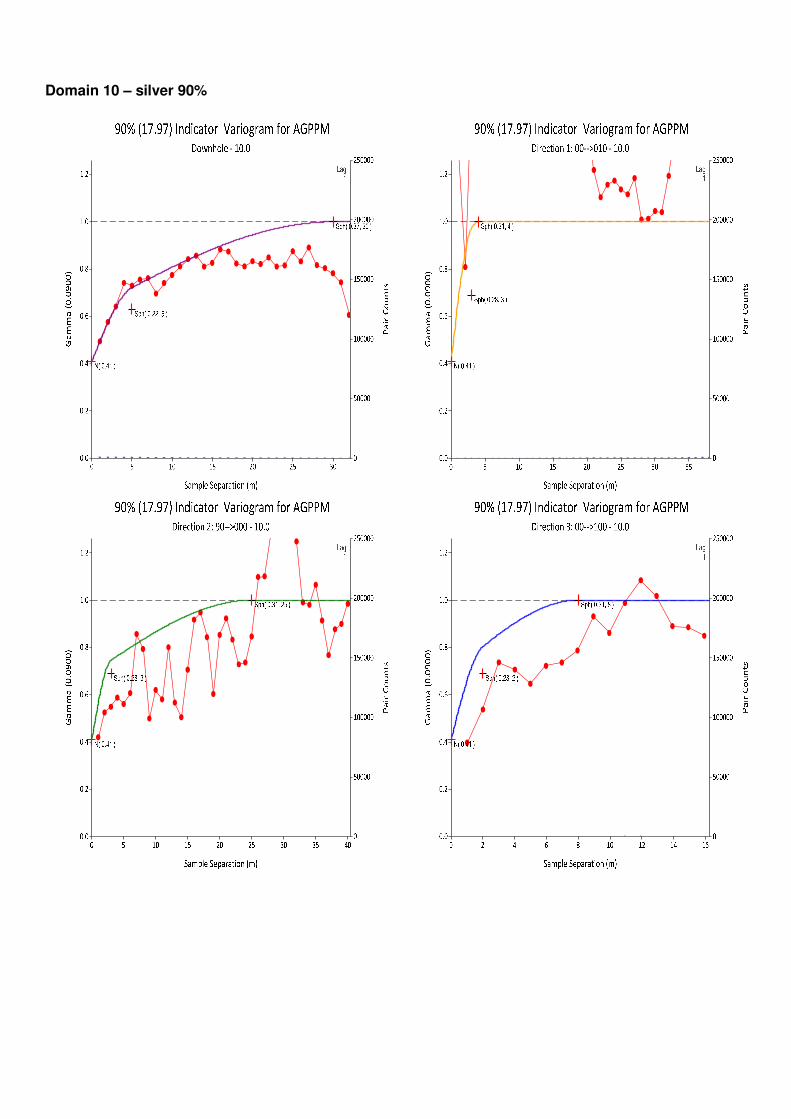
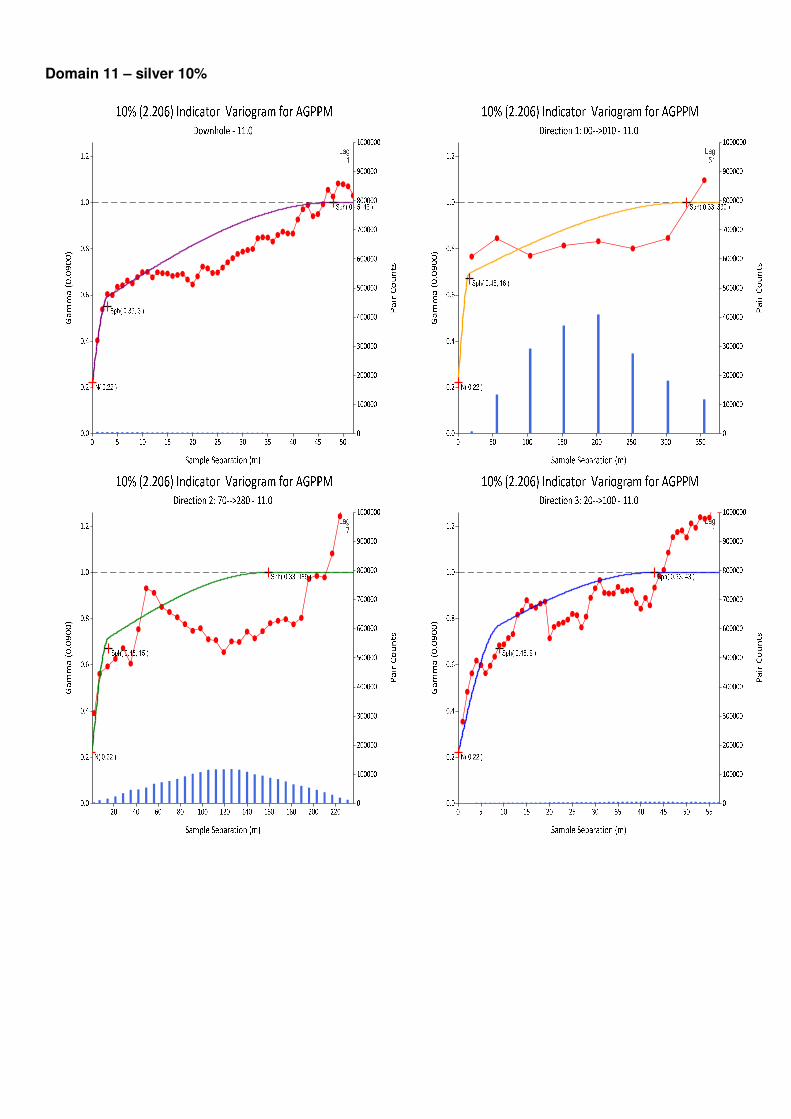
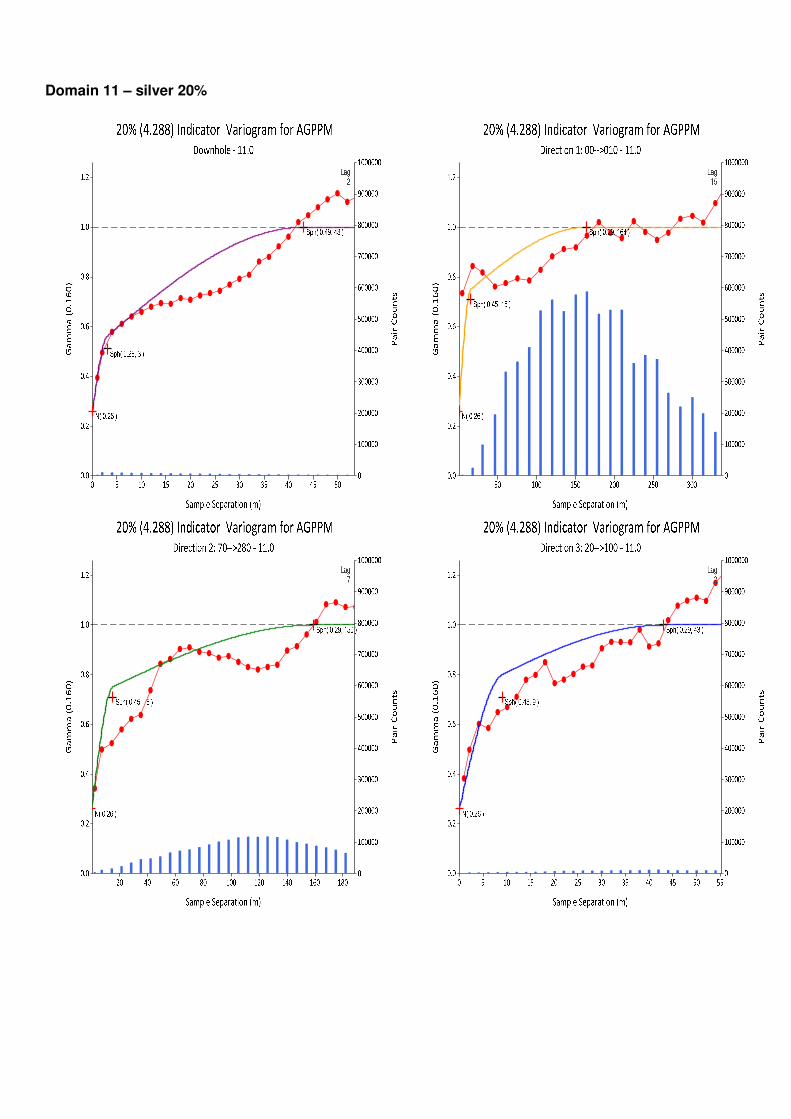
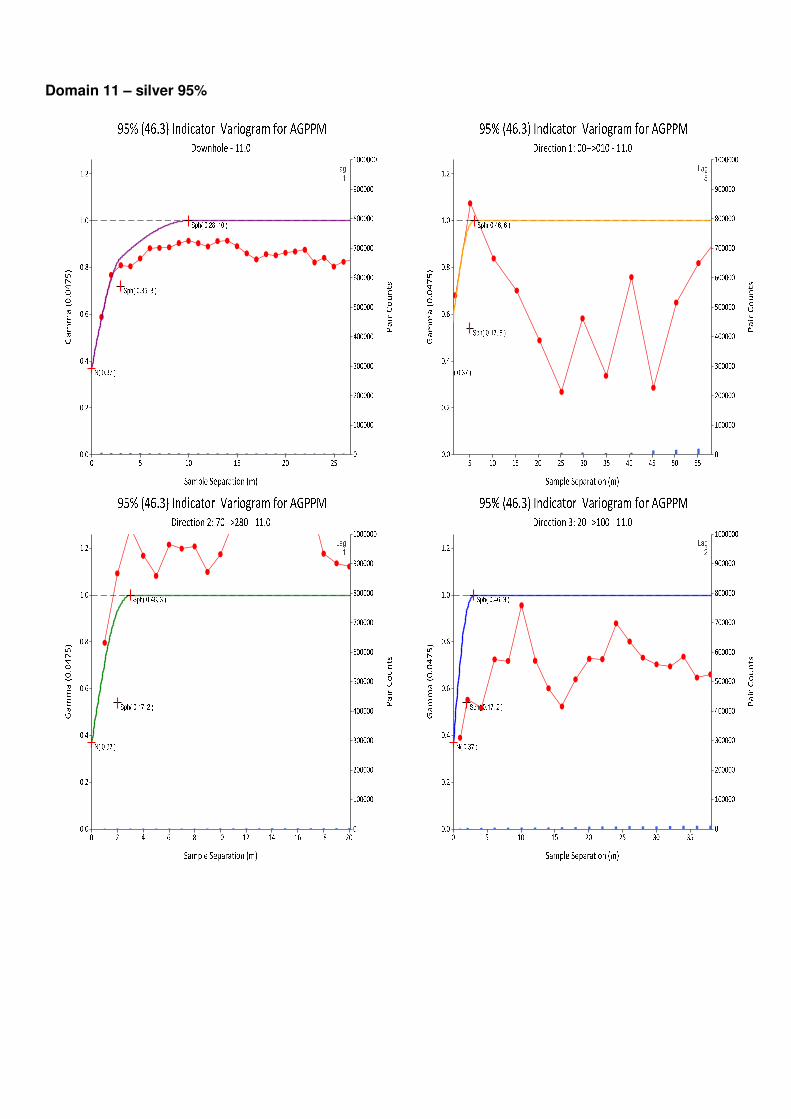
7.2 Indicator variography
Indicator variography was carried out for gold and silver within domains 10 and 11 to provide the inputs for the multiple indicator kriging. Indicator variograms for gold and silver are tabulated in Table 7.3 to Table 7.6.
Indicator variograms were calculated and modelled for the declies and the 95th and 97.5th percentiles of the populations. All variogram models are located in Appendix C.

Ortac Resources: Kremnica
Resource Estimate
. Final April 2012 24 of 37
Table 7.3 Indicator variogram model parameters for gold – domain 10
Cut-off (Percentile)
Orientations Nugget Structure 1 Structure 2
Sill Range Sill Range
10 00/010 90/000 00/100
0.25 0.33 76 26 15
0.42 193 61 33
20 00/010 90/000 00/100
0.25 0.33 76 26 15
0.42 192 59 33
30 00/010 90/000 00/100
0.25 0.33 66 19 15
0.42 173 57 33
40 00/010 90/000 00/100
0.26 0.33 65 17 15
0.41 165 49 23
50 00/010 90/000 00/100
0.28 0.30 64 17 15
0.42
165 49 22
60 00/010 90/000 00/100
0.30 0.30 24 9 9
0.40 164 48 20
70 00/010 90/000 00/100
0.35 0.30 4 3 3
0.35 34 26 20
80
00/010 90/000 00/100
0.36 0.21 2 2 2
0.43 7 7 7
90
00/010 90/000 00/100
0.37 0.21 2 2 2
0.42 5 5 3
95
00/010 90/000 00/100
0.40 0.21 2 2 2
0.39 4 4 3
97.5
00/010 90/000 00/100
0.40 0.21 2 2 2
0.39 3 3 3
Ortac Resources: Kremnica
Resource Estimate
. Final April 2012 25 of 37
Table 7.4 Indicator variogram model parameters for silver – domain 10
Cut-off (Percentile)
Orientations Nugget Structure 1 Structure 2
Sill Range Sill Range
10 00/010 90/000 00/100
0.32 0.27 90 14 14
0.41 178 60 58
20 00/010 90/000 00/100
0.32 0.27 90 14 14
0.41 178 60 58
30 00/010 90/000 00/100
0.34 0.27 90 14 14
0.39 178 60 58
40 00/010 90/000 00/100
0.34 0.27 90 7 7
0.39 178 60 57
50 00/010 90/000 00/100
0.34 0.27 44 4 3
0.39
178 60 48
60 00/010 90/000 00/100
0.34 0.28 17 4 3
0.38 170 32 17
70 00/010 90/000 00/100
0.34 0.28 3 3 2
0.38 31 31 8
80
00/010 90/000 00/100
0.39 0.28 3 3 2
0.33 4 25 8
90
00/010 90/000 00/100
0.41 0.28 3 3 2
0.31 4 25 8
95
00/010 90/000 00/100
0.41 0.28 2 2 2
0.31 3 9 6
97.5
00/010 90/000 00/100
0.42 0.28 2 2 2
0.30 3 9 6

Ortac Resources: Kremnica
Resource Estimate
. Final April 2012 26 of 37
Table 7.5 Indicator variogram model parameters for gold – domain 11
Cut-off (Percentile)
Orientations Nugget Structure 1 Structure 2
Sill Range Sill Range
10 00/010 70/280 20/100
0.25 0.40 49 26 26
0.35 524 131 46
20 00/010 70/280 20/100
0.25 0.40 26 26 5
0.35 361 131 45
30 00/010 70/280 20/100
0.25 0.40 19 6 5
0.35 285 129 43
40 00/010 70/280 20/100
0.25 0.40 11 6 5
0.35 170 129 42
50 00/010 70/280 20/100
0.25 0.40 11 5 5
0.35
137 88 21
60 00/010 70/280 20/100
0.25 0.40 11 5 5
0.35 100 35 21
70 00/010 70/280 20/100
0.29 0.40 11 5 5
0.31 94 27 18
80
00/010 70/280 20/100
0.34 0.18 11 4 4
0.48 71 6 6
90
00/010 70/280 20/100
0.38 0.18 11 2 2
0.44 54 4 4
95
00/010 70/280 20/100
0.38 0.18 7 2 2
0.44 9 4 4
97.5
00/010 70/280 20/100
0.39 0.18 5 2 2
0.43 6 4 4

Ortac Resources: Kremnica
Resource Estimate
. Final April 2012 27 of 37
Table 7.6 Indicator variogram model parameters for silver – domain 11
Cut-off (Percentile)
Orientations Nugget Structure 1 Structure 2
Sill Range Sill Range
10 00/010 70/280 20/100
0.22 0.45 16 15 9
0.33 330 159 43
20 00/010 70/280 20/100
0.26 0.45 15 15 9
0.29 164 159 43
30 00/010 70/280 20/100
0.26 0.45 9 9 9
0.29 164 158 32
40 00/010 70/280 20/100
0.26 0.45 9 9 9
0.29 143 140 27
50 00/010 70/280 20/100
0.26 0.45 9 9 9
0.29
120 120 25
60 00/010 70/280 20/100
0.26 0.43 9 9 9
0.31 117 99 25
70 00/010 70/280 20/100
0.27 0.35 9 5 5
0.38 112 96 25
80
00/010 70/280 20/100
0.30 0.28 9 5 5
0.42 109 27 25
90
00/010 70/280 20/100
0.31 0.17 9 3 3
0.52 66 4 4
95
00/010 70/280 20/100
0.37 0.17 5 2 2
0.46 6 3 3
97.5
00/010 70/280 20/100
0.37 0.17 3 2 2
0.46 4 3 3

Ortac Resources: Kremnica
Resource Estimate
. Final April 2012 28 of 37
8 Block modelling
8.1 Block model
Two block model prototypes were generated. The primary prototype with the larger parent cell size was used for the ordinary kriged grade estimation. The parent cell size was seclected basedon a kriging neighbourhood analysis undertaken for the previous, 2011, estimate. The parameters used to generate this prototype are shown in Table 8.1.
Table 8.1 Block model parameters for ordinary kriged estimate
Parameter Easting (X) Northing (Y) Elevation (Z)
Origin -436150 -1230950 40
Limit -435590 -1229300 900
Parent block size (m) 5 25 10
Number of blocks 112 66 86
Minimum sub-cell size (m) 1.25 6.25 2.5
Table 8.2 shows the parameters used to generated the prototype for the multiple indicator kriged grade estimation and for generating a void model. A smaller cell size was used so that the estimates could be averaged into the larger parent blocks (emulating a discretisation) within the mineralised domains. The block model was regularised using the larger parent cell size at the end of the grade estimation prior to reporting.
Table 8.2 Block model parameters for indicator kriged estimate
Parameter Easting (X) Northing (Y) Elevation (Z)
Origin -436150 -1230950 40
Limit -435590 -1229300 900
Parent block size (m) 1.25 6.25 2.5
Number of blocks 448 264 344
Sub-celling was used at the topographic and mineralised domain boundaries to more accurately define the volumes.
8.2 Grade estimation
Ordinary kriging was used to estimate gold and silver grades within domains 0, 1, 20 and 30. Multiple indicator kriging was used to estimate gold and silver grades within domains 10 and 11. Ordinary kriging was also carried out for domains 10 and 11 as a sensitivity.
The multiple indicator kriged grade model was regularised to the larger parent cell size prior to being combined with the ordinary kriged model. The void model was then added to the grade model prior to reporting.
8.2.1 Ordinary kriging
The orientation of the search ellipses was derived from the variogram orientations. The ranges for the primary search volume were also determined from the variograms as summarised in Table 8.3. Note the same search criteria were used for gold and silver.

Ortac Resources: Kremnica
Resource Estimate
. Final April 2012 29 of 37
Table 8.3 Search parameters for ordinary kriged grade estimation
Domain Search distance
(m)
Orientations
0
100
100
15
00/010
90/000
00/100
1
100
100
15
00/010
70/280
20/100
10
150
50
20
00/010
90/000
00/100
11
150
100
30
00/010
70/280
20/100
20
40
10
45
00/010
90/000
00/100
30
15
10
40
00/010
90/000
00/100
A minimum of 8 and a maximum of 24 informing samples were used for estimation. If the minimum number of samples required was not met, the search volume ranges were multiplied by a factor of 2 and a second search volume defined using a minimum of 2 and a maximum of 32 informing samples.
For the ordinary kriging, a block discretisation of 3 by 5 by 3 was used in the X, Y and Z directions respectively. If no grade was estimated for a particular block then a value of 0.001 was assigned.
8.2.2 Multiple indicator kriging
The orientation of the search ellipses was derived from the variogram orientations. The ranges for the primary search volume were also determined from the variograms as summarised in Table 8.4. Note the same search criteria were used for gold and silver.

Ortac Resources: Kremnica
Resource Estimate
. Final April 2012 30 of 37
Table 8.4 Search parameters for multiple indicator kriged grade estimation
Domain Search distance Orientations
10
150
50
20
00/010
90/000
00/100
11
150
100
30
00/010
70/280
20/100
A minimum of 10 and a maximum of 24 informing samples were used for estimation. If the minimum number of samples required was not met, the search volume ranges were multiplied by a factor of 2 and a second search volume defined using a minimum of 16 and a maximum of 30 informing samples. If the minimum number of samples required was not met within the second search ellipse the search volume ranges were multiplied by a factor of 3 and a third search volume defined using a minimum of 2 and a maximum of 30 informing samples.
Table 8.5 summarises the indicator cut-off grades for each threshold in domains 10 and 11.
Table 8.5 Indicator cut-off grades for each threshold for domains 10 and 11
Attribute Domain Threshold Percentile
Threshold Cut-off grade
Au 10
10 0.130
20 0.210
30 0.276
40 0.370
50 0.510
60 0.675
70 0.950
80 1.350
90 2.220
95 3.400
97.5 5.005
Au 11
10 0.200
20 0.395
30 0.600
40 0.840
50 1.145
60 1.464
70 1.951
80 2.620
90 3.986
95 5.630
97.5 8.010

Ortac Resources: Kremnica
Resource Estimate
. Final April 2012 31 of 37
Attribute Domain Threshold Percentile
Threshold Cut-off grade
Ag 10
10 1.200
20 2.140
30 3.000
40 4.021
50 5.377
60 6.855
70 8.706
80 11.890
90 17.970
95 25.930
97.5 37.000
Ag 11
10 2.206
20 4.288
30 6.358
40 8.493
50 10.800
60 13.340
70 17.200
80 22.400
90 33.930
95 46.300
97.5 62.740
The lower tail of the grade distribution was modelled using a power model for domains 10 and 11for gold and silver.
The upper tail of the grade population distribution, above the 97.55th percentile, was modelled using a hyperbolic mathematical model for domains 10 and 11 for gold and silver. Lower and upper tail models are located in Appendix C.

Ortac Resources: Kremnica
Resource Estimate
. Final April 2012 32 of 37
9 Model validation
9.1.1 Global comparisons
Validation of the final estimated grade model involved visual and statistical comparison of the estimated grades against the composite dataset within the mineralised domains (domains 10, 11 and 20).
Table 9.1 and Table 9.2 provide a global comparison of the estimated grades compared to the drillhole grades for gold and silver respectively.
This statistical comparison shows that gold and silver validate well globally.
Table 9.1 Comparison of the mean declustered composite grade with the mean block model grade for gold within the primary search volume
Domain Tonnes
(kt) Model
Number of samples
Data
10 9,713 0.59 1,407 0.83
11 16,201 1.90 6,156 2.04
20 16,272 0.63 2,663 0.74
Table 9.2 Comparison of the mean declustered composite grade with the mean block model grade for silver within the primary search volume
Domain Tonnes
(kt) Model
Number of samples
Data
10 9,713 5.97 1,407 6.26
11 16,201 15.61 6,156 17.60
20 16,272 3.57 2,663 4.18
9.1.2 Visual validation
Visual validation shows that the gold and silver estimates, while smoothed, follow the trend of the data reasonably well. Visual validation of the small cell model for the indicator kriging results shows a good correlation between data and the model (Figure 9.1).

Ortac Resources: Kremnica
Resource Estimate
. Final April 2012 33 of 37
Figure 9.1 Example cross section showing drillhole and block grades - 1229900 mN
9.1.3 Grade trend plots
In order to validate the grade trends in the model sectional validation graphs for the northing, easting and elevation direction was generated for gold and silver within domains 10, 11 and 20. The graphs compare the mean of the estimated grades to the mean of the input grades within a series of slices (bins). The graphs also show the number of input samples to give an indication of the support for each bin. All graphs are included in Appendix D.

Ortac Resources: Kremnica
Resource Estimate
. Final April 2012 34 of 37
10 Classification The resource estimate has been classified as Measured, Indicated and Inferred in accordance with the JORC Code (JORC, 2004) and associated guidelines. Table 10.1 lists the criteria pertinent to Table 1 of the JORC Code that have been used to derive the resource classification.
Snowden has based the classification of the Mineral Resource upon a number of criteria, including the confidence in the interpretation of the geological framework, the integrity of the data, the spatial continuity of the mineralisation as demonstrated by variography, and the quality of the estimation. The field in the model that designates the resource category is “RESCAT”. The Measured, Indicated, Inferred and Unclassified categories are RESCAT=1, 2, 3 and 0 respectively (Figure 10.1).
Areas of domain 10 and 11 with good geological confidence and covered by drilling of approximately 25 mE by 25 mN as well as underground sampling were classified and Measured Resources.
Areas of domain 10, 11 and 20 with drillhole coverage out to 50 mE by 50 mN with little or no underground sampling were classified as Indicated Resources.
All other areas of domain 10, 11 and 20 with drilling coverage were classified as Inferred Resources.
The Collapse Zone (domain 30) was classified as Inferred.
Areas outside of the ore zones were classed as unclassified.
Figure 10.1 Example cross section showing model showing classification 1230050 mN

Ortac Resources: Kremnica
Resource Estimate
. Final April 2012 35 of 37
Table 10.1 JORC assessment and reporting criteria for estimation and reporting
Item Comment
Database integrity Ortac has taken responsibility for the robustness of the database. Snowden has not fully reviewed the database integrity, but has found no reason to question the integrity or accuracy of the database provided.
Geological interpretation The interpretations have been completed by Ortac. The interpretations include three major mineralised domains (10, 11 and 20), spatial distribution of the different lithologies, and weathering domains.
Dimensions The main Kremnica area of mineralisation occurs within the Schramen massive to sheeted quartz vein, which is up to 100 m wide along a 500 m strike section. It strikes almost due north, generally dips steeply to the east, and thins to the north, south, and at depth.
Estimation and modelling techniques
Grades for gold and silver were estimated using ordinary block kriging and multiple indicator kriging as appropriate, into 5 mE by 25 mN by 10 mRL parent cells. Multiple indicator kriging was used for the main mineralised zones (domains 10 and 11).
Moisture Not applicable to this estimate – only dry mass considered.
Cut-off parameters Interpretation of mineralised zones at a nominal 0.50 g/t Au cut-off grade.
Resource estimate reported at a series of block cut-off grades within the mineralised zones. Reporting constrained within a pit optimisation based on a 0.26 g/t Au cut-off grade.
Mining factors and assumptions
No mining factors or assumptions have been applied.
Metallurgical factors and assumptions
No assumptions with respect to metallurgy have been applied. Metallurgical testwork has demonstrated that the gold is recoverable using standard techniques.
In situ density In-situ density set to 2.34 t/m3. Density of the Collapse Zone based on actual measurements from adit development. Density is also adjusted for void space within blocks.
Values are based on the average of density measurements on diamond core and adit samples.
Classification The estimate has been classified as a Measured, Indicated and Inferred Mineral Resource based on geological confidence, the integrity of the data, the spatial continuity of the mineralisation as demonstrated by variography, and the quality of the estimation.
Audits and reviews Snowden has completed an internal peer review of the estimate.
Relative confidence and accuracy
No studies of relative confidence have been carried out.

Ortac Resources: Kremnica
Resource Estimate
. Final April 2012 36 of 37
11 Mineral Resource reporting The resource estimate has been classified using the guidelines of the JORC Code (JORC, 2004) and reported separately for areas of potential open pit and underground mining. The Mineral Resource has been reported above a 0.40 g/t Au for the portion of the estimate which is potentially minable by open pit methods (). The potential open pit area was defined by an optimisation shell supplied by Ortac which was based on an economic cut-off grade of 0.26 g/t Au.
The Mineral Resource below the open pit optimisation has been reported above a cut-off of 2.85 g/t Au based on the assumption of underground mining (Table 11.2).
Table 11.1 Mineral Resource - Kremnica Gold project above a 0.40 g/t Au cut-off grade for open pit resources456
Resource Category Tonnes
(kt)
Density
(t/m3)
Au
(g/t)
Ag
(g/t)
AuEq
(g/t)
Au
(koz)
Ag
(koz)
AuEq
(koz)
Measured 3,000 2.17 1.69 13.5 1.96 161 1,291 187
Indicated 12,400 2.24 1.76 15.2 2.07 702 6,044 823
Measured + Indicated 15,400 2.23 1.75 14.9 2.05 863 7,335 1,010
Inferred 9,700 2.33 0.89 5.1 0.99 279 1,587 310
Total 25,100 2.27 1.42 11.1 1.64 1,141 8,922 1,320
Table 11.2 Mineral Resource - Kremnica Gold project above a 2.85 g/t Au cut-off grade for underground resources123
Resource Category Tonnes
(kt)
Density
(t/m3)
Au
(g/t)
Ag
(g/t)
AuEq
(g/t)
Au
(koz)
Ag
(koz)
AuEq
(koz)
Measured n/a n/a n/a n/a n/a n/a n/a n/a
Indicated 19 2.34 3.60 23.8 4.08 2 14 2
Measured + Indicated 19 2.34 3.60 23.8 4.08 2 14 2
Inferred 310 2.34 3.50 19.7 3.90 35 196 39
Total 328 2.34 3.51 20.0 3.91 37 211 41
4 Tonnes are reported to two significant figures. Grades are reported at two decimal places. Ounces are rounded to the nearest thousand. 5 Rounding may result in discrepancies in the table. 6 AuEq (gold equivalent) has been calculated for each block with an AuEq ratio of 50 parts Ag for every 1 part Au.

Ortac Resources: Kremnica
Resource Estimate
. Final April 2012 37 of 37
12 References Beacon Hill Consultants 2007, Kremnica Gold Project Pre-Feasibility Study. Unpublished internal report prepared by Beacon Hill Consultants Ltd for Tournigan Gold Corporation.
JORC, 2004. The Australasian Code for Reporting of Exploration Results, Mineral Resources and Ore Reserves, The JORC Code 2004 Edition, the Joint Ore Reserves Committee of the Australian Institute of Mining and Metallurgy, Australian Institute of Geoscientists and Mineral Council of Australia (JORC).
Saint Barbara LLP 2009, Updated 43-101 Resource Statement on the Kremnica Gold Deposit, Slovakia. Unpublished internal report prepared by Saint Barbara LLP for Ortac Resources PLC.
Smith, B.A., Kirkham, G.D, 2004, Kremnica Gold and Silver Project. Unplublished Independent Technical Report.
Snowden Mining Industry Consultants 2011, Ortac Resources : Kremnica Resource estimate January 2011 Unpublished internal report prepared by Snowden Mining Industry Consultants for Ortac Resources.

Histograms and log probability plots Appendix A

Log Histograms of the composite data (uncut) - gold
Fre
qu
en
cy (% of 12019 points)
Frequency (% of 34306 points)

Frequency (% of 1407 points)
Frequency (% of 6156 points)

Frequency (% of 2663 points)
Frequency (% of 347 points)

Frequency (% of 1315 points)

Log Histograms of the composite data (uncut) - silver
Frequency (% of 11444 points)
Frequency (% of 33303 points)

Frequency (% of 1407 points)
Frequency (% of 6156 points)

Frequency (% of 2663 points)
Frequency (% of 347 points)

Frequency (% of 1291 points)

Log probability plots of the composite data (uncut) - gold
Cumulative Probability %
Cumulative Probability %

Cumulative Probability %
Cumulative Probability %

Cumulative Probability %
Cumulative Probability %

Cumulative Probability %

Log probability plots of the composite data (uncut) – silver
Cumulative Probability %
Cumulative Probability %

Cumulative Probability %
Cumulative Probability %

Cumulative Probability %
Cumulative Probability %

Cumulative Probability %

Variograms – ordinary kriging Appendix B

Domain 0 – gold
Domain 1 – gold

Domain 10 – gold
Domain 11 – gold

Domain 20 – gold

Domain 30 – gold

Domain 0 – silver

Domain 1 – silver

Domain 10 – silver

Domain 11 – silver

Domain 20 – silver

Domain 30 – silver

Variograms – indicator kriging Appendix C

Domain 10 –gold 10%
Domain 10 –gold 20%

Domain 10 –gold 30%

Domain 10 –gold 40%

Domain 10 –gold 50%

Domain 10 –gold 60%

Domain 10 –gold 70%

Domain 10 –gold 80%

Domain 10 –gold 90%

Domain 10 –gold 95%

Domain 10 –gold 97.5%

Domain 10 –lower and upper tail - gold
Cumulative Probability %
Cumulative Probability %

Domain 11 –gold 10%

Domain 11 –gold 20%

Domain 11 –gold 30%

Domain 11 –gold 40%

Domain 11 –gold 50%
Domain 11 –gold 60%

Domain 11 –gold 70%

Domain 11 –gold 80%

Domain 11 –gold 90%

Domain 11 –gold 95%

Domain 11 –gold 97.5%

Domain 11 –lower and upper tail - gold
Cumulative Probability %
Cumulative Probability %

Domain 10 – silver 10%

Domain 10 – silver 20%

Domain 10 – silver 30%

Domain 10 – silver 40%

Domain 10 – silver 50%

Domain 10 – silver 60%

Domain 10 – silver 70%

Domain 10 – silver 80%
Domain 10 – silver 90%

Domain 10 – silver 95%

Domain 10 – silver 97.5%

Domain 10 –lower and upper tail - silver
Cumulative Probability %
Cumulative Probability %
Domain 11 – silver 10%
Domain 11 – silver 20%

Domain 11 – silver 30%

Domain 11 – silver 40%

Domain 11 – silver 50%

Domain 11 – silver 60%

Domain 11 – silver 70%

Domain 11 – silver 80%

Domain 11 – silver 90%
Domain 11 – silver 95%

Domain 11 – silver 97.5%

Domain 11 –lower and upper tail - silver
Cumulative Probability %
Cumulative Probability %

Trend plots Appendix D

Domain 10 – gold declustered
0
50
100
150
200
250
0
0.2
0.4
0.6
0.8
1
1.2
1.4
1.6
1.8
-435950 -435900 -435850 -435800
Nu
mb
er
of
Sa
mp
les
AU
PP
M
X Mid Point (Where RCODE = '10')
Ortac_AU_10_DEC: 5.00 Increments
Block Grade
Point Grade
No Samples
0
50
100
150
200
250
300
0
0.5
1
1.5
2
2.5
-1230850 -1230650 -1230450 -1230250 -1230050
Nu
mb
er
of
Sa
mp
les
AU
PP
M
Y Mid Point (Where RCODE = '10')
Ortac_AU_10_DEC: 25.00 Increments
Block Grade
Point Grade
No Samples

0
50
100
150
200
250
300
350
400
450
0
0.5
1
1.5
2
2.5
400 500 600 700 800
Nu
mb
er
of
Sa
mp
les
AU
PP
M
Z Mid Point (Where RCODE = '10')
Ortac_AU_10_DEC: 10.00 Increments
Block Grade
Point Grade
No Samples
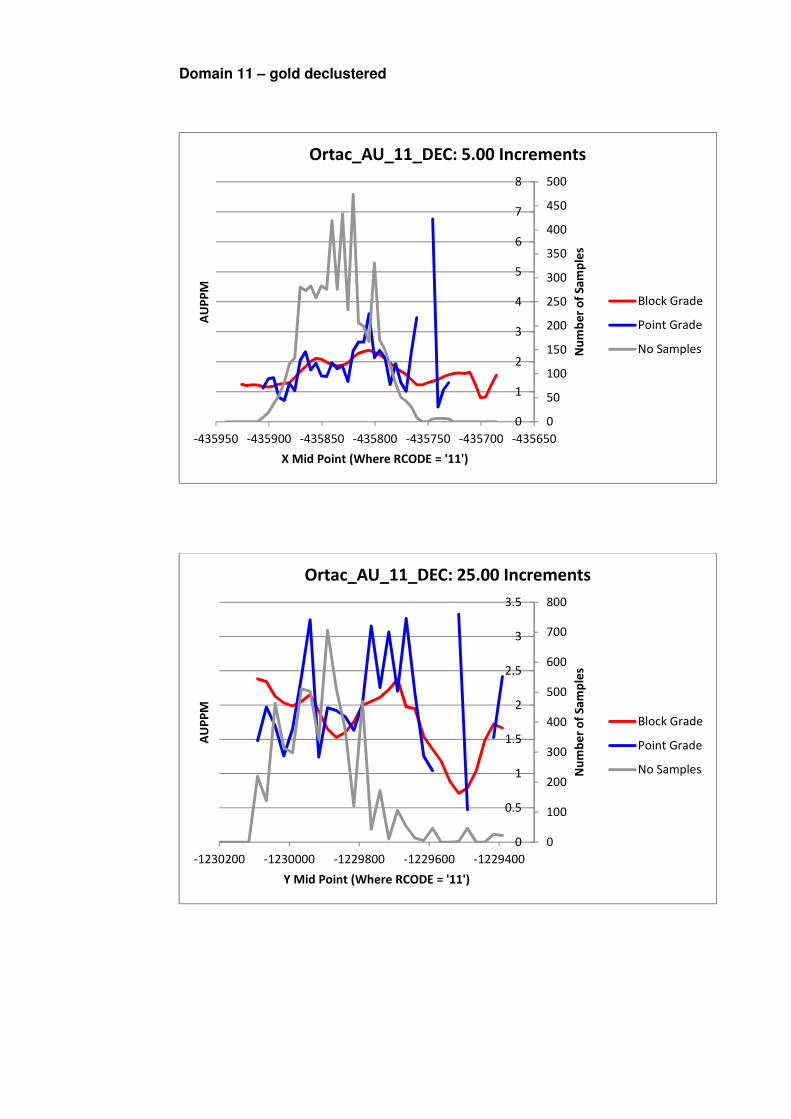
Domain 11 – gold declustered
0
50
100
150
200
250
300
350
400
450
500
0
1
2
3
4
5
6
7
8
-435950 -435900 -435850 -435800 -435750 -435700 -435650
Nu
mb
er
of
Sa
mp
les
AU
PP
M
X Mid Point (Where RCODE = '11')
Ortac_AU_11_DEC: 5.00 Increments
Block Grade
Point Grade
No Samples
0
100
200
300
400
500
600
700
800
0
0.5
1
1.5
2
2.5
3
3.5
-1230200 -1230000 -1229800 -1229600 -1229400
Nu
mb
er
of
Sa
mp
les
AU
PP
M
Y Mid Point (Where RCODE = '11')
Ortac_AU_11_DEC: 25.00 Increments
Block Grade
Point Grade
No Samples

0
200
400
600
800
1000
1200
1400
1600
0
0.5
1
1.5
2
2.5
3
3.5
4
4.5
5
350 450 550 650 750
Nu
mb
er
of
Sa
mp
les
AU
PP
M
Z Mid Point (Where RCODE = '11')
Ortac_AU_11_DEC: 10.00 Increments
Block Grade
Point Grade
No Samples

Domain 20 – gold raw
0
20
40
60
80
100
120
140
160
180
200
0
0.2
0.4
0.6
0.8
1
1.2
1.4
1.6
1.8
-436100 -436050 -436000 -435950 -435900 -435850
Nu
mb
er
of
Sa
mp
les
AU
PP
M
X Mid Point (RCODE: 20)
Ortac_AU_OK: 5.00 Increments
Block Grade
Point Grade
No Samples
0
100
200
300
400
500
600
0
0.2
0.4
0.6
0.8
1
1.2
1.4
-1230900 -1230700 -1230500 -1230300 -1230100
Nu
mb
er
of
Sa
mp
les
AU
PP
M
Y Mid Point (RCODE: 20)
Ortac_AU_OK: 25.00 Increments
Block Grade
Point Grade
No Samples
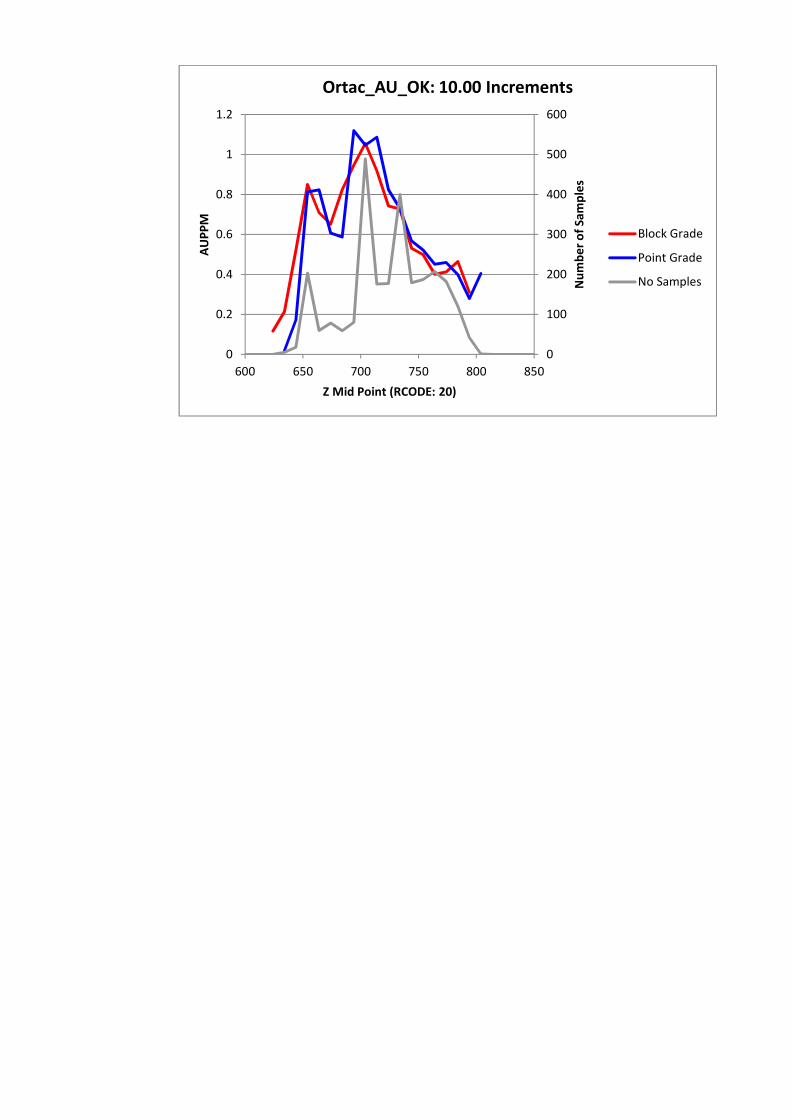
0
100
200
300
400
500
600
0
0.2
0.4
0.6
0.8
1
1.2
600 650 700 750 800 850
Nu
mb
er
of
Sa
mp
les
AU
PP
M
Z Mid Point (RCODE: 20)
Ortac_AU_OK: 10.00 Increments
Block Grade
Point Grade
No Samples

Domain 10 – silver declustered
0
50
100
150
200
250
0
2
4
6
8
10
12
-435950 -435900 -435850 -435800
Nu
mb
er
of
Sa
mp
les
AG
PP
M
X Mid Point (Where RCODE = '10')
Ortac_AG_10_DEC: 5.00 Increments
Block Grade
Point Grade
No Samples
0
50
100
150
200
250
300
0
2
4
6
8
10
12
14
16
18
-1230900 -1230700 -1230500 -1230300 -1230100
Nu
mb
er
of
Sa
mp
les
AG
PP
M
Y Mid Point (Where RCODE = '10')
Ortac_AG_10_DEC: 25.00 Increments
Block Grade
Point Grade
No Samples

0
50
100
150
200
250
300
350
400
450
0
1
2
3
4
5
6
7
8
9
400 500 600 700 800
Nu
mb
er
of
Sa
mp
les
AG
PP
M
Z Mid Point (Where RCODE = '10')
Ortac_AG_10_DEC: 10.00 Increments
Block Grade
Point Grade
No Samples

Domain 11 – silver declustered
0
50
100
150
200
250
300
350
400
450
500
0
5
10
15
20
25
30
35
40
-435950 -435900 -435850 -435800 -435750 -435700 -435650
Nu
mb
er
of
Sa
mp
les
AG
PP
M
X Mid Point (Where RCODE = '11')
Ortac_AG_11_DEC: 5.00 Increments
Block Grade
Point Grade
No Samples
0
100
200
300
400
500
600
700
800
0
10
20
30
40
50
60
-1230200 -1230000 -1229800 -1229600 -1229400
Nu
mb
er
of
Sa
mp
les
AG
PP
M
Y Mid Point (Where RCODE = '11')
Ortac_AG_11_DEC: 25.00 Increments
Block Grade
Point Grade
No Samples

0
200
400
600
800
1000
1200
1400
1600
0
5
10
15
20
25
30
35
350 450 550 650 750
Nu
mb
er
of
Sa
mp
les
AG
PP
M
Z Mid Point (Where RCODE = '11')
Ortac_AG_11_DEC: 10.00 Increments
Block Grade
Point Grade
No Samples

Domain 20 – silver raw
0
20
40
60
80
100
120
140
160
180
200
0
1
2
3
4
5
6
7
-436100 -436050 -436000 -435950 -435900 -435850
Nu
mb
er
of
Sa
mp
les
AG
PP
M
X Mid Point (RCODE: 20)
Ortac_AG_OK: 5.00 Increments
Block Grade
Point Grade
No Samples
0
100
200
300
400
500
600
0
1
2
3
4
5
6
7
-1230900 -1230700 -1230500 -1230300 -1230100
Nu
mb
er
of
Sa
mp
les
AG
PP
M
Y Mid Point (RCODE: 20)
Ortac_AG_OK: 25.00 Increments
Block Grade
Point Grade
No Samples

0
100
200
300
400
500
600
0
1
2
3
4
5
6
600 650 700 750 800 850
Nu
mb
er
of
Sa
mp
les
AG
PP
M
Z Mid Point (RCODE: 20)
Ortac_AG_OK: 10.00 Increments
Block Grade
Point Grade
No Samples