otes - share information | sanlam · pdf fileexternal operating environment emerging market...
TRANSCRIPT

Notes
1Sanlam investor presentation 2015 annual results

Notes
The Sanlam strategy
Operating environment
Strategic delivery
Financial review
Priorities
Outlook
2 Sanlam investor presentation 2015 annual results

Notes
The Sanlam StrategyMaximising shareholder value
3Sanlam investor presentation 2015 annual results

Notes
Strategic focusOptimising value creation
Stra
tegi
c pi
llars
TransformationDiversification
Optimal capital utilisation
Operational efficienciesEarnings growth
Sustainable value creation for shareholders
Maximising RoGEV
4 Sanlam investor presentation 2015 annual results

Notes
A strategy focused on growthDriving geographic, segment and product diversification
India/SE AsiaLower income
segments have similar dynamics than SA ELM
and RoA
DevelopedNiche, solutions
for SA & RoAclients
South AfricaSolid base & cash flows
Rest of AfricaDemographics, low
insurance penetration, competitive
environment, Pan-Africa opportunity
5Sanlam investor presentation 2015 annual results

Notes
Core regional focus areasDifferentiated approach per region
Large player in mature market with strong competition
Further diversifying distribution capability to drive growth: ELM footprint, Reality, health, digital, outcome based solutions, UB partnership, big data
Operational and capital efficiencies key in managing legacy book
South AfricaDelivering growth in mature market
Effective capital managem
ent
6 Sanlam investor presentation 2015 annual results

Notes
Core regional focus areasDifferentiated approach per region
Large player in mature market with strong competition
Further diversifying distribution capability to drive growth: ELM footprint, Reality, health, digital, outcome based solutions, UB partnership, big data
Operational and capital efficiencies key in managing legacy book
South AfricaDelivering growth in
mature market
Focus on accelerated organic growth to obtain leadership position in all countries
Cross-border alliances and relationships; capitalise onexpanded footprint from Saham Finances transaction
Geographic expansion in line with client and intermediary needs
Other Emerging Markets
Balance structural and organic growth
Other Emerging Markets
Balance structural and organic growth
Other Emerging Markets
Balance structural and organic growth
Effective capital managem
ent
7Sanlam investor presentation 2015 annual results

Notes
Core regional focus areasDifferentiated approach per region
Focus on accelerated organic growth to obtain leadership position in all countries
Cross-border alliances and relationships; capitalise onexpanded footprint from Saham Finances transaction
Geographic expansion in line with client and intermediary needs
Other Emerging Markets
Balance structural and organic growth
Products and services for SA and Rest of Africa client base
Sanlam UK consolidation; focus on efficiencies and distribution under new CEO
Wealth and investment management focus
Developed Markets
Niche approach
Effective capital managem
ent
8 Sanlam investor presentation 2015 annual results

Notes
Operating EnvironmentEconomic, political and internal pressures
9Sanlam investor presentation 2015 annual results

Notes
External operating environmentGlobal events impacting on our key markets
Slower growth in
ChinaUS interest
rates
Government & consumer
debtCommodity
prices
Commodity-based
economies under pressure
10 Sanlam investor presentation 2015 annual results

Notes
External operating environmentEmerging market economies under pressure from global events
Robust economic growth in 2015Macro-economic adjustment required to address wide government budget and current account deficitsCurrency weakened in line with ZARStrong competitive environment across all segments
Namibia
Macro environment and structural constraints limiting capital investment and economic activity Modest growth in employment and disposable incomePolitical events contributed to investment market and currency volatilityPublic/private sector engagement and cooperation to drive economic and employment growth very necessary
South Africa
11Sanlam investor presentation 2015 annual results

Notes
External operating environmentEmerging market economies under pressure from global events
Commodity prices and tight financial conditions impacting on growth and currencies of a number of countriesSofter economic growth to persist in 2016 Low insurance penetration enables new business growth despite short-term challengesLonger term growth potential remains intact
Rest of Africa
Best sovereign rating in Africa due to sound management of government financesRobust economic growth, but need to diversify economy away from reliance on diamondsBIHL maintains strong competitive advantage
Botswana
12 Sanlam investor presentation 2015 annual results

Notes
External operating environmentEmerging market economies under pressure from global events
Below-potential economic growth in 2015, but improvingDelays in roll out of infrastructure projects impacted on credit businesses – activity picked up towards end of 2015More stringent provisioning regulations implemented during 2016 will not affect IFRS-based resultsRobust long-term growth expectations
India
Relatively firm economic growth in 2015, some moderation expected in 2016Lower two-wheeler sales and competitive pressure impacting on general insurance growthUncertainty around effect of de -tariffing in 2016
Malaysia
13Sanlam investor presentation 2015 annual results

Notes
SA economy
Growth in real retail sales, GDP and PDI
Modest growth in all key metrics
-10%
-5%
0%
5%
10%
15%
20%
Growth y-o-y in real retail sales Growth y-o-y in real GDP Growth y-o-y in real PDI
14 Sanlam investor presentation 2015 annual results

Notes
Regional economic growthHigher growth outside of SA
-15%
-10%
-5%
0%
5%
10%
15%
20%
25%
South Africa Namibia Botswana Ghana Kenya India Malaysia
IMF estimates
15Sanlam investor presentation 2015 annual results

Notes
4%
5%
6%
7%
8%
9%
10%
12-1
3
01-1
4
02-1
4
03-1
4
04-1
4
05-1
4
06-1
4
07-1
4
08-1
4
09-1
4
10-1
4
11-1
4
12-1
4
01-1
5
02-1
5
03-1
5
04-1
5
05-1
5
06-1
5
07-1
5
08-1
5
09-1
5
10-1
5
11-1
5
12-1
5
9-year 5-year Short-term Avg Short-term
+200bps
+40bps
Interest rates
SA bond yields and short-term interest rates
Higher SA rates; other regions stable
Impact on growthVNB overall -12%Sanlam Sky VNB -25%Higher float income
16 Sanlam investor presentation 2015 annual results

Notes
SA equity and bond markets
Pressure on fee income in 2015 and 2016
Limiting growth in assets under management
95
100
105
110
115
120
125
12-1
3
01-1
4
02-1
4
03-1
4
04-1
4
05-1
4
06-1
4
07-1
4
08-1
4
09-1
4
10-1
4
11-1
4
12-1
4
01-1
5
02-1
5
03-1
5
04-1
5
05-1
5
06-1
5
07-1
5
08-1
5
09-1
5
10-1
5
11-1
5
12-1
5
All Share rebased All Bond rebased
7,6%
1,9%
10,1%
-3,9%
Average Alsi up 6%Average Albi up 8%
17Sanlam investor presentation 2015 annual results

Notes
Rand exchange rateSharp depreciation in 2015 against most currencies
80
90
100
110
120
130
140
150
160
12-1
3
01-1
4
02-1
4
03-1
4
04-1
4
05-1
4
06-1
4
07-1
4
08-1
4
09-1
4
10-1
4
11-1
4
12-1
4
01-1
5
02-1
5
03-1
5
04-1
5
05-1
5
06-1
5
07-1
5
08-1
5
09-1
5
10-1
5
11-1
5
12-1
5
United Kingdom United States Botswana India Malaysia Rest of Africa
18 Sanlam investor presentation 2015 annual results

Notes
Average Rand exchange rateSupported non-SA results
17.1%
8.6%
3.8%
-3.2%
11.7%
-1.4%
-5%
0%
5%
10%
15%
20%
USA UnitedKingdom
Botswana Rest of Africa India Malaysia
Contribution to growthNet result from financial services +R82m
New business +R1.5bn
Net VNB +R6m
RoGEV +4%
19Sanlam investor presentation 2015 annual results

Notes
Internal operating environment2015 results impacted by internal challenges and one-offs
Bad debt provisioning at STFC equipment financeOne-off item in Shriram Capital 2014 base System implementation challenges in KenyaActuarial reserving in Malaysia
Sanlam Emerging Markets
Loss of PIC funds in 2014 and 2015 impacting on SI results SI admin costs elevated by projects, regulatory compliance and additional marketing spendOne-off items in 2014 base at SEB and SI International (UK)
Sanlam Investments
20 Sanlam investor presentation 2015 annual results

Notes
Strategic DeliveryExceeding overall targets despite headwinds
21Sanlam investor presentation 2015 annual results

Notes
Top-line earnings growth
Earnings per shareNet operating profit per share increased by 6% (11% excl one-offs)Normalised headline earnings per share up 6%
Business volumesNew business volumes increased by 16% to R211bnNet fund inflows of R19bnNet life VNB up 6% on comparable basis & excl large SEB policy in ‘14Net VNB margin of 2.91% on comparable basis
Group Equity ValueGroup Equity Value of R50.57 per shareRoGEV per share of 12.8%
Financial performance in 2015
22 Sanlam investor presentation 2015 annual results

Notes
DiversificationInternational positioning focused on emerging markets
India
Malaysia
Philippines
Ghana
The Gambia
KenyaUganda
RwandaBurundiTanzania
MalawiZambia
BotswanaNamibia
Swaziland
South Africa
Switzerland
United Kingdom
USA
Australia
Ireland
Mozambique
MoroccoAlgeria
Tunisia
MaliSenegal
GuineaBurkina Faso
Cote D’Ivoire
TogoBeninNigeria
CameroonGabon
Republic of the CongoAngola
Zimbabwe
MadagascarMauritius
Lesotho
Emerging Markets - Indirect presence
Emerging Markets - Direct presence
Developed Markets
Saham Finances presence
Sanlam and Saham Finances presence
23Sanlam investor presentation 2015 annual results

Notes
SA Traditional58%SA Entry-level
18%
Namibia4%
Botswana9%
Rest of Africa7%
Other international4%
2015R1 360m
SA Traditional67%
SA Entry-level11%
Namibia5%
Botswana5%
Rest of Africa2%
Other international10%
Diversification – better balanced portfolioGeographic diversification
Net VNB Net operating profit
2015R7 269m
24 Sanlam investor presentation 2015 annual results

Notes
Life business46%
General insurance15%
Investment management
14%
Credit & structuring10%
Admin, health & other15%
2015R103 506m
Life business62%
General insurance14%
Investment management
12%
Credit & structuring11%
Admin, health & other1%
Diversification – better balanced portfolioLine of business diversification
Group Equity Value Net operating profit
2015R7 269m
25Sanlam investor presentation 2015 annual results

Notes
Capital efficiency
Balance 1 January 2015 3 300 Net investments (6 285)
Saham Finances (4 224)Rest of Africa other (29)Shriram Insurance (969)Afrocentric (703)Other (360)
Investment return & excess cover 1 285 Capital released from portfolios 4 000Available for investment 2 300
Discretionary capital
Available for strategic initiatives
26 Sanlam investor presentation 2015 annual results

Notes
Financial Review
27Sanlam investor presentation 2015 annual results

Notes
Changes in presentation / key assumptions
Accounting policies & basis of presentationNo change from 2014
Changes in RDR:Sanlam Life (10.1%): 200 bps up from December 2014Sanlam Sky (9.6%): 200 bps up from December 2014Negative impact on RoGEV and VNB
Weaker Rand exchange rate largely offset adverse impact of higher interest rates in SA and Namibia, apart from VNB
28 Sanlam investor presentation 2015 annual results
Notes
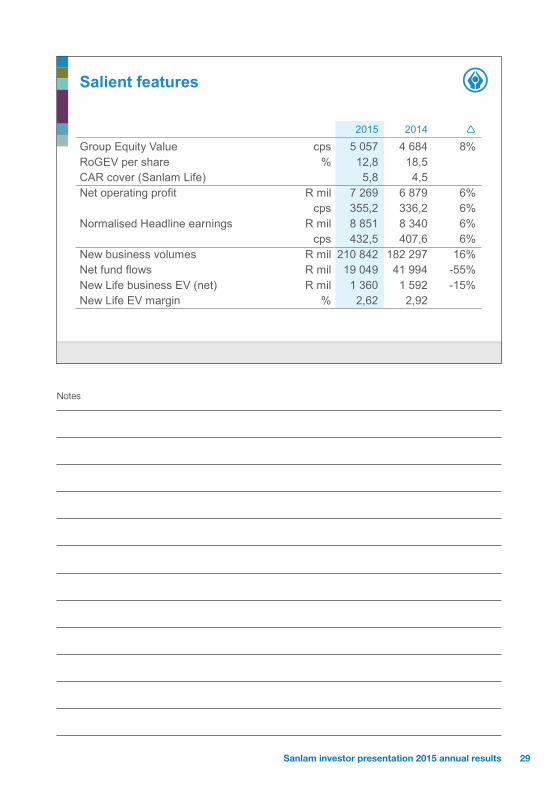
Salient features
2015 2014
Group Equity Value cps 5 057 4 684 8%RoGEV per share % 12,8 18,5CAR cover (Sanlam Life) 5,8 4,5Net operating profit R mil 7 269 6 879 6%
cps 355,2 336,2 6% Normalised Headline earnings R mil 8 851 8 340 6%
cps 432,5 407,6 6% New business volumes R mil 210 842 182 297 16% Net fund flows R mil 19 049 41 994 -55% New Life business EV (net) R mil 1 360 1 592 -15% New Life EV margin % 2,62 2,92
29Sanlam investor presentation 2015 annual results

Notes
Sanlam Personal Finance
30 Sanlam investor presentation 2015 annual results

Notes
Sanlam Personal Finance
R million 2015 2014
New business volumes 63 825 52 566 21% Sanlam Sky 1 279 1 127 13% Individual Life 12 829 12 443 3% Glacier 49 717 38 996 27%
Net flows 22 895 19 580Sanlam Sky 2 739 2 635Individual Life (3 005) (1 372)Glacier 23 161 18 317
31Sanlam investor presentation 2015 annual results

Notes
Sanlam Personal Finance
R million 2015 2014
Value of new life business 955 1 084 -12% Sanlam Sky 241 361 -33% Individual Life 502 551 -9% Glacier 212 172 23%Comparable economic basis 1 148 1 084 6%
New business margin 2,48% 3,12%Sanlam Sky 5,86% 9,51%Individual Life 2,59% 2,88%Glacier 1,40% 1,45%Comparable economic basis 2,89% 3,12%
32 Sanlam investor presentation 2015 annual results

Notes
Sanlam Personal Finance
R million 2015 2014
Gross operating profit 5 313 4 801 11% Sanlam Sky 1 125 949 19% Individual Life life and investments 3 378 3 162 7% Glacier 426 339 26% Personal loans 346 308 12% Other 38 43 -12%
Net operating profit 3 831 3 476 10%
Group Equity Value 38 249 38 453 RoGEV 12,1% 17,9%
label
33Sanlam investor presentation 2015 annual results

Notes
Sanlam Emerging Markets
34 Sanlam investor presentation 2015 annual results

Notes
Sanlam Emerging Markets
R million 2015 2014
New business volumes 11 913 9 259 29% Namibia 2 780 3 322 -16% Botswana 5 398 3 031 78% Rest of Africa 2 099 1 560 35% India/Malaysia 1 636 1 346 22%
Net fund flows (7 346) 3 971Namibia 358 1 021Botswana (9 781) 1 129Rest of Africa 1 459 1 451India/Malaysia 618 370
Value of new life business 448 431 4% Margin 5,97% 7,60%
35Sanlam investor presentation 2015 annual results

Notes
Sanlam Emerging Markets
R million 2015 2014
Gross operating profit 2 248 2 213 2% Namibia 618 534 16% Botswana 858 706 22%Rest of Africa 208 265 -22%India/Malaysia 572 749 -24%Corporate (8) (41) 80%
Net operating profit 1 197 1 241 -4%
Group equity value 18 047 14 571 RoGEV 29,9% 28,0%
36 Sanlam investor presentation 2015 annual results

Notes
Sanlam Investments
37Sanlam investor presentation 2015 annual results

Notes
Sanlam Investments
R million 2015 2014
Net investment business flows (3 251) 4 097Investment management SA (753) 4 152Wealth management 3 569 (29)International (6 065) (246)Capital management (2) 220New life business 6 664 13 859 -52% Employee benefits 2 913 10 154 -71% Sanlam UK 3 751 3 705 1% Net life business (261) 8 002Value of new life business 111 228 -51% Margin 1,34% 1,43%
38 Sanlam investor presentation 2015 annual results

Notes
Sanlam Investments
R million 2015 2014
Gross operating profit 1 877 1 927 -3% Investment management 1 205 1 337 -10%Employee benefits 501 325 54% Capital management 171 265 -35%
Net operating profit 1 417 1 468 -3%
Group Equity Value 22 412 20 122 Covered business 7 210 7 833 Other 15 202 12 289 RoGEV 21,3% 20,4%
39Sanlam investor presentation 2015 annual results

Notes
Sanlam Investments
Percentage of SIM’s benchmark-managed funds exceeding hurdle
Investment performance
2011
2012
2013
2014
2015
Rolling 3 year Rolling 5 year
100% 80% 60% 40% 20% 0% 20% 40% 60% 80% 100%
40 Sanlam investor presentation 2015 annual results

Notes
Santam
41Sanlam investor presentation 2015 annual results
Notes
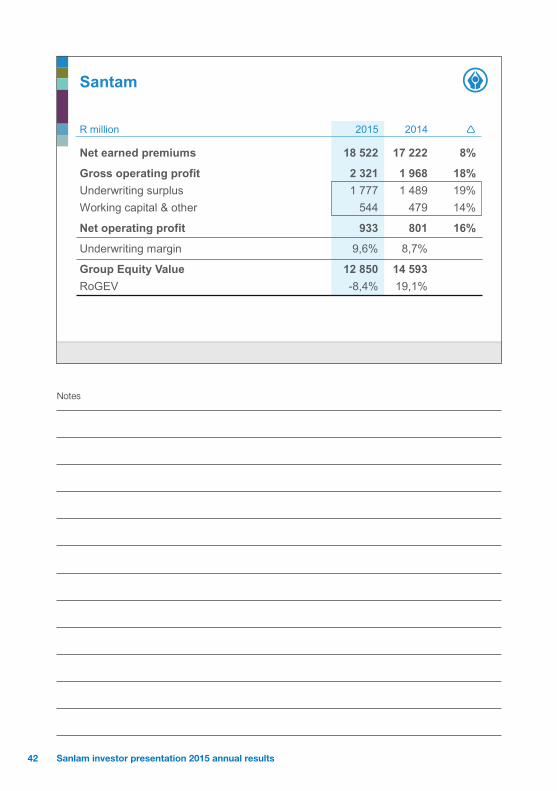
Santam
R million 2015 2014
Net earned premiums 18 522 17 222 8%
Gross operating profit 2 321 1 968 18% Underwriting surplus 1 777 1 489 19% Working capital & other 544 479 14%
Net operating profit 933 801 16%
Underwriting margin 9,6% 8,7%
Group Equity Value 12 850 14 593RoGEV -8,4% 19,1%
42 Sanlam investor presentation 2015 annual results

Notes
Sanlam Group
43Sanlam investor presentation 2015 annual results

Notes
Business flows
Gross NetR million 2015 2014 2015 2014
by businessPersonal Finance 63 825 52 566 21% 22 895 19 580 Emerging Markets 11 913 9 259 29% (7 346) 3 971 Sanlam Investments 116 582 103 250 13% (3 512) 12 099 Santam 18 522 17 222 8% 7 012 6 344
by licenceLife insurance 39 976 42 290 -5% 12 081 18 430 Investment 150 670 121 383 24% (523) 16 853 General insurance 20 196 18 624 8% 7 491 6 711
Total 210 842 182 297 16% 19 049 41 994
44 Sanlam investor presentation 2015 annual results

Notes
Operational efficiencies
Persistency – SA middle-income market
Focus on quality supports net fund flows
4.8
3.9 3.9 3.6
3.4 3.8 3.9
3.0 2.9 2.9 2.8 2.9 2.9
4.2 4.0
3.8 3.7 3.6
4.2
3.4
2.9 2.8 2.7 2.9 2.8 2.8
0
0.5
1
1.5
2
2.5
3
3.5
4
4.5
5
2003 2004 2005 2006 2007 2008 2009 2010 2011 2012 2013 2014 2015
Lapses, surrenders & fully paid-ups as % of in-force per half year
H1 H2
45Sanlam investor presentation 2015 annual results

Notes
Operational efficiencies
Persistency – SA lower income market
Focus on quality supports net fund flows
9.6 8.7
10.6 9.8
8.5
9.6 9.2
9.9
0
2
4
6
8
10
12
2012 2013 2014 2015
Lapses, surrenders & fully paid-ups as % of in-force per half year
H1 H2
46 Sanlam investor presentation 2015 annual results

Notes
Value of new covered business
Value of New Business MarginR million 2015 2014 2015 2014
Personal Finance 955 1 084 -12% 2,48% 3,12%
Emerging Markets 448 431 4% 5,97% 7,60%
Employee Benefits 85 198 -57% 1,96% 1,66%
Sanlam UK 26 30 -13% 0,66% 0,75%
Total 1 514 1 743 -13% 2,80% 3,09%
Net of minorities 1 360 1 592 -15% 2,62% 2,92%
Comparable economic basis 1 545 1 592 -3% 2,91% 2,92%
47Sanlam investor presentation 2015 annual results

Notes
Value of new covered business
Large SEB policy in 2014, Kenya and Zambia also affecting growth
Significant impact from higher long-term interest rates
0.0%
0.5%
1.0%
1.5%
2.0%
2.5%
3.0%
3.5%
0
200
400
600
800
1 000
1 200
1 400
1 600
1 800
2 000
2005 2006 2007 2008 2009 2010 2011 2012 2013 2014 2015South Africa Rest of AfricaOther International Margins - rhs
48 Sanlam investor presentation 2015 annual results

Notes
Net operating profit
R million 2015 2014
Personal Finance 3 831 3 476 10%
Emerging Markets 1 197 1 241 -4%
Sanlam Investments 1 417 1 468 -3%
Santam 933 801 16%
Corporate & other (109) (107) -2%
Total 7 269 6 879 6%
49Sanlam investor presentation 2015 annual results

Notes
Income statement
R million 2015 2014
Net operating profit 7 269 6 879 6% Per share 355,2 336,2 6%
Net investment return 1 946 1 794 8%
Other (364) (333) -9%
Normalised headline earnings 8 851 8 340 6% Per share 432,5 407,6 6%
Fund transfers 449 (15)
Headline earnings 9 300 8 325 12% Per share 459,5 411,6 12%
50 Sanlam investor presentation 2015 annual results

Notes
Group Equity Value
Equity Value RoGEVR million 2015 2014 Rm %
Group operations 91 558 87 739 12 191 13,8% Personal Finance 38 249 38 453 4 658 12,1% Emerging Markets 18 047 14 571 4 369 29,9% Investments 22 412 20 122 4 386 21,3% Santam 12 850 14 593 (1 222) -8,4%
Discretionary & Other 11 948 8 197 35 0,5%TOTAL 103 506 95 936 12 226 12,7% cps 5 057 4 684 598 12,8% Adjusted return 14,8% Return target 12,1%
51Sanlam investor presentation 2015 annual results

Notes
Group Equity Value earnings
R million 2015 2014
Net value of new business 1 360 1 592 -15%Existing business 5 328 4 881 9%Expected return on VIF 3 759 3 368 12%Operating experience variance 1 081 991 9%Operating assumption changes 488 522 -7%
6 688 6 473 3%Inv variances in-force 320 551 -42%Tax changes and goodwill (62) (168) 63%Economic assumption changes (1 608) 86 >-100%
5 338 6 942 -23%Return on net worth 1 699 1 297 31%EV earnings 7 037 8 239 -15%Non-life 5 189 7 344 -29%GEV earnings 12 226 15 583 -22%
52 Sanlam investor presentation 2015 annual results

Notes
Experience variancesPositive experience persisting
241
142 138
277 288 278
636
468
681
555
1 021 991
1 081
0.0%
0.5%
1.0%
1.5%
2.0%
2.5%
3.0%
3.5%
4.0%
4.5%
5.0%
0
200
400
600
800
1 000
1 200
2003 2004 2005 2006 2007 2008 2009 2010 2011 2012 2013 2014 2015
R'million % of VIF (rhs)
53Sanlam investor presentation 2015 annual results

Notes
Return on Group Equity ValueOut perform growth target of long-bond rate + 400bp
13.4 12.4 12.2 10.8 12.2 12.1 12.2
4.8 3.3
9.8
6.26.3
0.7
5.2
0
5
10
15
20
25
2010 2011 2012 2013 2014 2015 Avg
Target Out performance
54 Sanlam investor presentation 2015 annual results

Notes
2016 Priorities
55Sanlam investor presentation 2015 annual results

Notes
Challenges
South African life businessMaintaining new business and profit growth over the long termNew business margins
Sanlam Emerging Markets headwindsAppropriate capacity and level of support
Sanlam InvestmentsGrowing the base, in particular institutional net flows
Addressing challenges a key priority
56 Sanlam investor presentation 2015 annual results

Notes
Sanlam Personal Finance
Continue to anticipate evolving consumer needs and demands
Focus on profitable sales growthAdapt and expand product range across entry-level, middle and affluent marketContinued focus on risk business in middle and affluent marketsExpand and adapt distribution footprint Enhance Glacier product set and intermediary supportImprove big data and advanced analytics capabilities
Focus on operational efficiencies in distribution and operations
Transforming with the high levels of regulatory change
Ensure that all business units are agile, cost efficient and market orientated
57Sanlam investor presentation 2015 annual results

Notes
Sanlam Emerging Markets
Shift in focus to accelerated organic growth through enhancing partnerships, strategic alliances and expanding product range sensibly
Increased visibility of Sanlam brand as partnership brand for markets and employees
Vest and integrate the Saham Finances acquisition
Deliver on corporate opportunities in Africa in line with client and broker service needs to support the retail growth
Increased collaboration on human resource development across the cluster
Continued focus on governance, compliance and ethics
58 Sanlam investor presentation 2015 annual results

Notes
Sanlam Investments
Maintain consistent superior investment performance
Further leverage business model in SA to grow net inflows in retail
Enhance competitive positioning for institutional segments
Focus on implemented solutions for both retail and institutional clients
Further align UK businesses to enhance competitiveness in international market
Continued focus on transformation and people development
Continue focus on passive (Satrix)
Grow Alternative Investments
Focus on operational efficiencies in low growth environment
59Sanlam investor presentation 2015 annual results

Notes
Santam
Focus on profitable growth – both in SA and emerging markets
Capital review to consider future regulatory requirements, pending SAM implementation, review asset allocations
Technical support to SEM general insurance partners to unlock value
Improve operational efficiencies to optimise acquisition cost ratio
Implementation of new underwriting platform for intermediated business in SA
Work with local municipalities to reduce risk on the ground
60 Sanlam investor presentation 2015 annual results

Notes
Outlook
61Sanlam investor presentation 2015 annual results

Notes
Outlook for 2016
Growth in most markets (particularly SA) to remain below longer term potential – pressure on new business growth and margins
Investment market volatility to persist, adversely affecting fund -based fee income and return on capital portfolio
Exceptional underwriting performance at Santam will be difficult to repeat
Conclude and embed AfroCentric and Saham Finances transactions
Investment opportunities will remain under consideration – primary focus on Pan-African financial services positioning
Implementation of regulatory changes in SA and UK will continue to be a challenge – strategic focus on managing risks and capturing opportunities
Difficult year ahead; medium to long-term prospects intact
62 Sanlam investor presentation 2015 annual results

Notes
thank you
63Sanlam investor presentation 2015 annual results