outhwest climate outlook - climas.arizona.edu · a 92 percent chance that la niña will persist...
TRANSCRIPT
November 23, 2010
Southwest Climate Outlook
The information in this issue is available on the Web: http://climas.arizona.edu/outlooks/swco
Where snow has fallen in the high country it has melted. As of Novem-ber 18, the snowpack conditions in Arizona and New Mexico were exhib-iting less-than-average snow water equivalent (SWE) in most basins, according to...
Snowpack
During October, the sea surface temperature (SST) anomaly in the Niño 3.4 region—the region in the middle of the tropical Pacific Ocean often used to define El Niño–Southern Oscillation events—was 1.61 degrees Celsius below average...
In this issue...
Climate Assessment for the Southwest
page 14
Vol. 9 Issue 11
Climate and weather data support many important functions, including streamflow forecasting, determining dates to plant and harvest crops, and lending historical perspective to cur-rent warming trends....
Feature Article page 3
page 18ENSO
Photo Description: The combination of clouds from winter storms and soft evening light can create colorful sunsets in Arizona. The photo, taken in January 2008, over-looks the Santa Catalina Mountains near Tucson, Arizona.
Source: Stacy Egan.
Would you like to have your favorite photograph featured on the cover of the Southwest Climate Outlook? For consideration send a photo representing South-west climate and a detailed caption to: [email protected]

Southwest Climate Outlook, November 2010
2 | Climate Summary
Cap and Trade on GHGs in New MexicoThe New Mexico Environment Improvement Board recently adopted a cap on greenhouse gas emissions (GHG). The measure, which passed narrowly by a four to three vote, is the most comprehensive regulation in the nation, according to the New Mexico Environment Department. It will allow New Mexico to participate in the regional Western Climate Initiative’s greenhouse gas cap-and-trade program if and when other states or Canadian provinces in the program move forward with similar programs (Bloomberg, November 3).
The new regulations will allow trade credits to be generated for participation in the regional cap-and-trade program. The regulations will apply to sources that emit 25,000 metric tons of carbon dioxide or more per year and that consist of about 63 large industrial sources—primarily electricity generators, oil and gas developers, and large businesses. The state will reduce by 2 percent each year the number of GHG emission allowances that are allocated to each facility. The New Mexico program is scheduled to start in 2012 if the market size is sufficient to be efficient and cost-effective. The regula-tion will expire if an equally effective federal cap-and-trade program is implemented.
Read more about the cap-and-trade program in New Mexico at http://www.nmenv.state.nm.us/OOTS/press_releases.html
Table of Contents: 2 November 2010 Climate Summary 3 Feature Article
Recent Conditions 7 Temperature 8 Precipitation 9 U.S. Drought Monitor 10 Arizona Drought Status 11 New Mexico Drought Status12 Arizona Reservoir Levels13 New Mexico Reservoir Levels14 Southwest Snowpack
Forecasts15 Temperature Outlook16 Precipitation Outlook 17 Seasonal Drought Outlook18 El Niño Status and Forecast
Forecast Verification 19 Temperature Verification 20 Precipitation Verification
November Climate SummaryDrought– Drought conditions decreased in Arizona and increased in New Mexico during the last 30 days. More than 50 percent of Arizona and 69 percent of New Mexico remain drought free. The Four Corners region has been the hardest hit area.
Temperature– The water year continues to be warmer than average, in spite of a few cold snaps brought on by passing storms. Average temperatures in the last month also have been generally above average.
Precipitation– Storms that have passed through the Southwest since the water year be-gan have wafted northeast, clipping only northwest Arizona. Most of Arizona and New Mexico have been drier than average in the last month and since the water year began.
ENSO– The La Niña event remained at moderate to strong strength during October. Cool water beneath the sea surface and enhanced trade winds from the east likely will help sustain the strength of the event through the end of the year. There is more than a 92 percent chance that La Niña will persist through the January–March period.
Climate Forecasts– Probabilities for warm and dry conditions in many parts of the Southwest are greater than 50 percent through the winter and early spring.
The Bottom Line– Warm and dry conditions prevailed during the last month and could be a harbinger for future months. Althought these conditions helped expand drought in New Mexico, most of the Southwest is drought free. The moderate to strong La Niña event likely will grab future headlines, as it is projected to continue into the spring and these events often direct storms north of the Southwest, leaving the region dry. Many forecasts call for expanding drought conditions and below-average rain and snow. There is some indication that the La Niña event is nearing its peak strength, but it’s also possible that it will intensify. A dry winter could cause Lake Mead to drop below a critical water elevation and trigger additional releases from Lake Powell to temporarily stave water rationing in the Lower Colorado River Basin.
Disclaimer - This packet contains official and non-official forecasts, as well as other information. While we make every effort to verify this information, please understand that we do not warrant the accu-racy of any of these materials. The user assumes the entire risk related to the use of this data. CLIMAS, UA Cooperative Extension, and the State Climate Office at Arizona State University (ASU) disclaim any and all warranties, whether expressed or implied, in-cluding (without limitation) any implied warranties of merchantability or fitness for a particular purpose. In no event will CLIMAS, UA Cooperative, and the State Climate Office at ASU or The University of Arizona be liable to you or to any third party for any direct, indirect, incidental, consequential, special or exemplary damages or lost profit resulting from any use or misuse of this data
This work is published by the Climate Assessment for the Southwest (CLIMAS) project and the University of Arizona Cooperative Extension; and is funded by CLIMAS, Institute of the Environment, and the Technology and Research Initiative Fund of the University of Arizona Water Sustainability Program through the SAHRA NSF Science and Technology Center at the University of Arizona.
SWCO Staff:Mike Crimmins, UA Extension SpecialistStephanie Doster, Institute of the Environment EditorDan Ferguson, CLIMAS Program DirectorGregg Garfin, Institute of the Environment Deputy Director of OutreachZack Guido, CLIMAS Associate Staff ScientistRebecca Macaulay, Graphic ArtistGigi Owen, CLIMAS Assistant Staff ScientistNancy J. Selover, Arizona State Climatologist
Southwest Climate Outlook, November 2010
3 | Feature Article
http://climas.arizona.edu/library/feature-articles
By Zack Guido
This article accompanies two others written in March and April 2009. Together they summarize many of the important moni-toring networks that provide climate and weather data for the Southwest. The March 2009 article featured National Weather Service’s Cooperative Observer Program and the related Historical Climate Network. The April 2009 article described data from Remote Automated Weather Stations (RAWS) and the Arizona Meteorological Network (AZMET) and data generated by the Parameter-elevation Regressions on Independent Slopes Model (PRISM) statisti-cal technique.
Climate and weather data support many important functions, includ-
ing streamflow forecasting, determining dates to plant and harvest crops, and lending historical perspective to current warming trends. Despite clamors for a one-stop information clearinghouse, in-formation is scattered around the Internet, making accessibility challenging, even for those in the know.
Knowing what data is available is only half the battle. Understanding where stations are located, the quality control standards for the data, and other details about the limitations and utility of the data often requires substantial detective efforts, and sometimes even those cannot uncover the desired information.
A closer look at four networks clarifies some of the finer points about site loca-tions, quality control standards, and limitations. These networks include the automated snow telemetry stations (SNOTEL), which record conditions at frosty elevations in the West; the Climate Reference Network and Modernized His-torical Climate Network, which are new
Climate Data Part 3: snow, climate, and stream-flow networks
efforts established to record national and regional climate changes; and real-time streamflow gauges, which are the nation’s window into river conditions.
Automated Snow Telemetry NetworkThe Natural Resources Conservation Ser-vice (NRCS) monitors nearly 2,000 high-elevation stations and focal points around the West using SNOTEL and manual measurements called snow courses. The network is the nation’s principal source of climate and weather information at high elevations.
The primary use for SNOTEL is to moni-tor snowpack conditions that provide valuable information for streamflow fore-casters. The information is also vital to fire managers because high or low snowpacks either suppress fire potential in the spring or hasten drying, priming the landscape for elevated fire risks. Climate researchers
also rely on this network to characterize long-term changes at high elevations.
SNOTEL sites automatically record mea-surements every 15 minutes and transmit the data to NRCS; these increments are then averaged in hourly and daily format and are posted on the NRCS website.
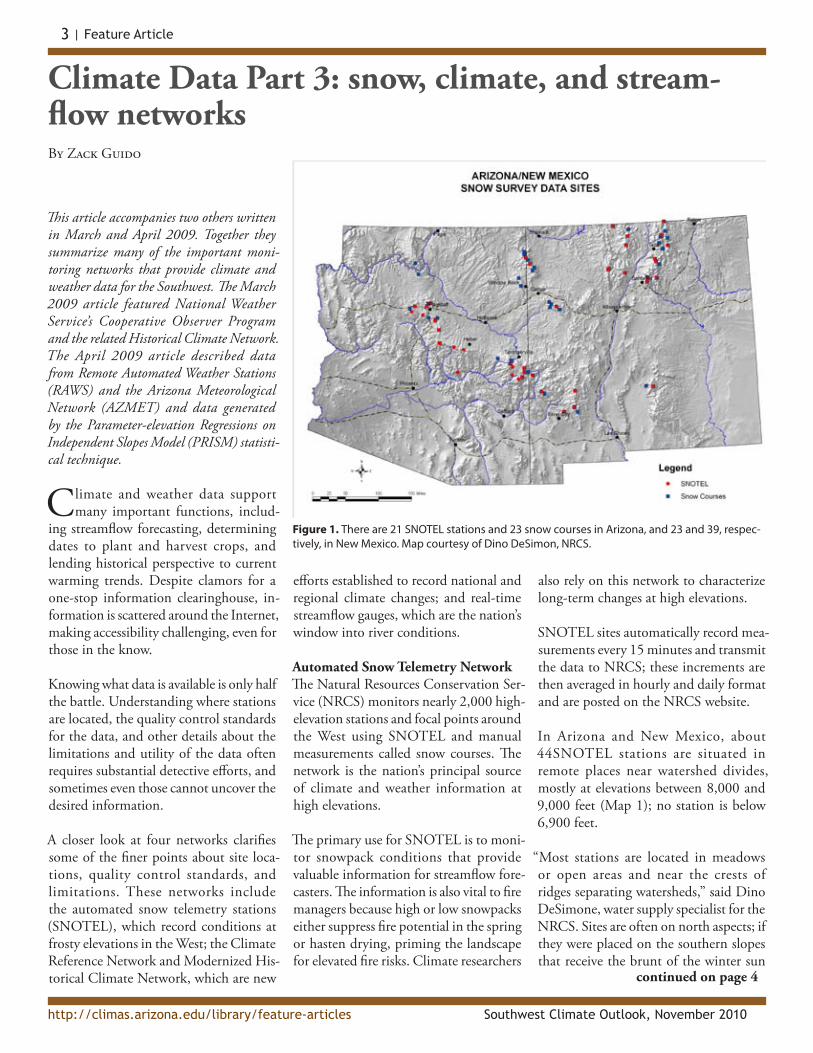
In Arizona and New Mexico, about 44SNOTEL stations are situated in remote places near watershed divides, mostly at elevations between 8,000 and 9,000 feet (Map 1); no station is below 6,900 feet.
“Most stations are located in meadows or open areas and near the crests of ridges separating watersheds,” said Dino DeSimone, water supply specialist for the NRCS. Sites are often on north aspects; if they were placed on the southern slopes that receive the brunt of the winter sun
Figure 1. There are 21 SNOTEL stations and 23 snow courses in Arizona, and 23 and 39, respec-tively, in New Mexico. Map courtesy of Dino DeSimon, NRCS.
continued on page 4
Southwest Climate Outlook, November 2010
4 | Feature Article
http://climas.arizona.edu/library/feature-articles
Climate Data Part 3, continued
warm spell can cause rapid melting that elevates flood risk.
Available data from snow course sites dates to the mid-1930s. Historically, snow course surveyors skied or snow-shoed into the remote sites about twice a month. Many of these snow courses are still operational today and account for about 60 percent of the 1,950 automated and manual monitoring sites in the West, including Alaska.
Climate Reference Network and Mod-ernized Historical Climate NetworkMost data networks were established to monitor weather, not climate. The dis-tinction is subtle, yet important. Weather monitoring is concerned with changes in temperature and precipitation, among other variables, over days to a few weeks, not over long periods lasting decades.
In most networks, many stations have been moved, had thermometers replaced,
or been influenced by the construction of nearby heat-absorbing buildings. These changes often cause artificial jumps in the measurements that become problematic for climate analysis. Although scientists have gone to great lengths to homogenize the data before and after the shift so that actual—as opposed to artificial— changes in the climate are recorded, many net-works remain susceptible to these changes, and thus inaccuracies.
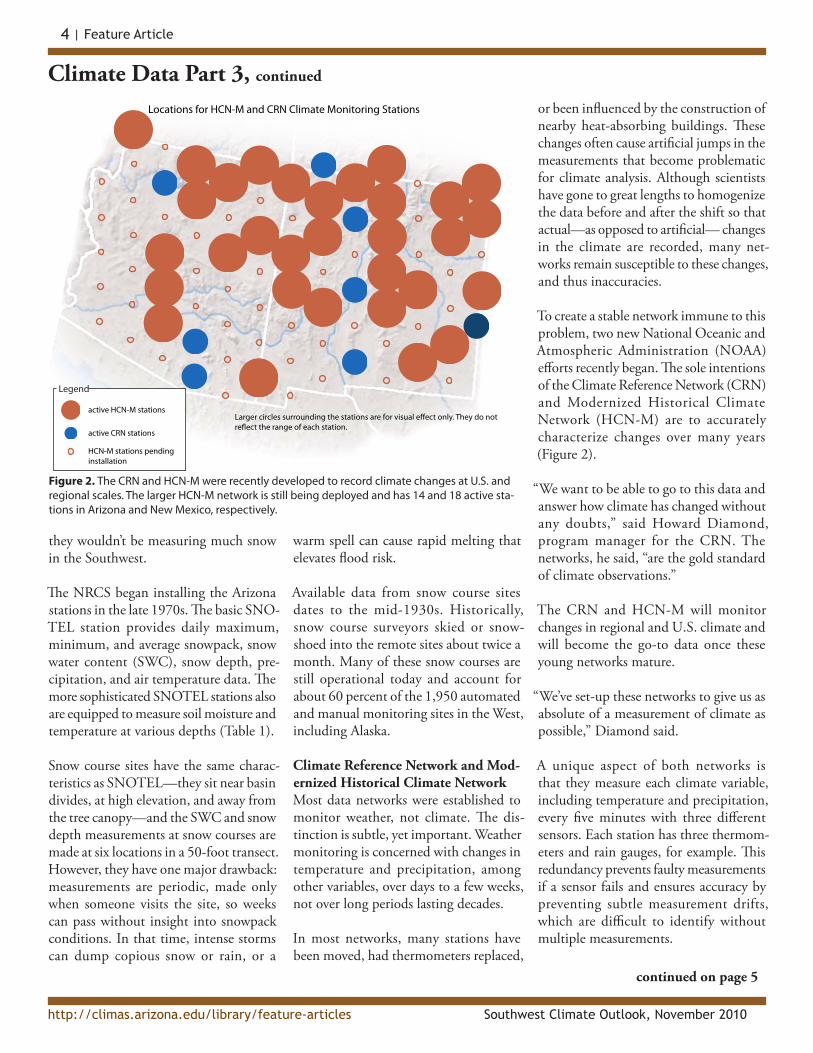
To create a stable network immune to this problem, two new National Oceanic and Atmospheric Administration (NOAA) efforts recently began. The sole intentions of the Climate Reference Network (CRN) and Modernized Historical Climate Network (HCN-M) are to accurately characterize changes over many years (Figure 2).
“We want to be able to go to this data and answer how climate has changed without any doubts,” said Howard Diamond, program manager for the CRN. The networks, he said, “are the gold standard of climate observations.”
The CRN and HCN-M will monitor changes in regional and U.S. climate and will become the go-to data once these young networks mature.
“We’ve set-up these networks to give us as absolute of a measurement of climate as possible,” Diamond said.
A unique aspect of both networks is that they measure each climate variable, including temperature and precipitation, every five minutes with three different sensors. Each station has three thermom-eters and rain gauges, for example. This redundancy prevents faulty measurements if a sensor fails and ensures accuracy by preventing subtle measurement drifts, which are difficult to identify without multiple measurements.
they wouldn’t be measuring much snow in the Southwest.
The NRCS began installing the Arizona stations in the late 1970s. The basic SNO-TEL station provides daily maximum, minimum, and average snowpack, snow water content (SWC), snow depth, pre-cipitation, and air temperature data. The more sophisticated SNOTEL stations also are equipped to measure soil moisture and temperature at various depths (Table 1).
Snow course sites have the same charac-teristics as SNOTEL—they sit near basin divides, at high elevation, and away from the tree canopy—and the SWC and snow depth measurements at snow courses are made at six locations in a 50-foot transect. However, they have one major drawback: measurements are periodic, made only when someone visits the site, so weeks can pass without insight into snowpack conditions. In that time, intense storms can dump copious snow or rain, or a
Figure 2. The CRN and HCN-M were recently developed to record climate changes at U.S. and regional scales. The larger HCN-M network is still being deployed and has 14 and 18 active sta-tions in Arizona and New Mexico, respectively.
continued on page 5
active HCN-M stations
active CRN stations
HCN-M stations pendinginstallation
Legend
Locations for HCN-M and CRN Climate Monitoring Stations
Larger circles surrounding the stations are for visual e�ect only. They do notre�ect the range of each station.

Southwest Climate Outlook, November 2010
5 | Feature Article
http://climas.arizona.edu/library/feature-articles
The sites in both networks are also selected to ensure that the environments will not change over time. Many of the HCN-M stations are placed on protected lands like wildlife refuges and national parks, where heat absorbing buildings and roads likely won’t alter the climate for another 100 years.
The CRN began in 2000 and consists of 122 sites around the U.S. There are three stations in Arizona and four in New Mexico (Map 2). The first station in Arizona began recording in 2002; the inaugural station in New Mexico began in 2003.
The CRN characterizes climate change at the national scale, whereas the HCN-M is focused on smaller, regional climate sig-nals and therefore requires a more closely spaced network.
The HCN-M network, on the other hand, will have 538 stations across the U.S. when all are installed. The difference in the number of sites reflects the intention of the networks. The HCN-M began in 2008 as a pilot project in the Arizona, New Mexico, Utah, and Colorado. The network is still under development in the region and has yet to be extended to the rest of the U.S. Currently, 14 stations in Arizona and 18 in New Mexico are operational. As many as 26 more sites will be installed in Arizona and 19 more in New Mexico.
Stations were initially spaced in a grid about 65 miles apart, and future stations will be separated by about 85 miles. Researchers determined that an 85-mile grid spacing would be sufficient to detect a 10 percent change in precipitation, per century, which is significant change in the West, and at least a 0.5-degree
Celsius temperature change per century, Diamond said in an email.
The CRN stations principally record temperature, precipitation, soil moisture and temperature, and relative humidity. Some experimental stations also measure wind speed and solar radiation. The HCN-M sites only monitor temperature and precipitation.
The data for both networks are available in hourly and daily format. Statistical algorithms check to make sure the data are within expected ranges and free of anomalous readings. The triple redun-dancy also helps ensure high quality and accurate data.
A limitation of these networks is that measurements began only recently. The longest record is only 10 years, rendering
Climate Data Part 3, continued
Table 1.
Network Data Source Principal Climate Variables
Available Data Intervals
Record Length Primary Ap-plication
Web Host
CRN 122 active sta-tions in U.S., 3 in AZ and 4 in NM
1. Temperature2. Precipitation3. Soil moisture4. Soil temp.5. Relative humidity
Measurement made every 5 minutes; easily accessible data are in hourly and daily format
Network began in 2000; first station in AZ and NM began in 2002 and 2003, respectively
Monitor U.S. climate changes
National Climatic Data Center (NCDC)
HCN-M Pilot proj-ect in the Southwest; 14 stations in AZ and 18 in NM
1. Temperature2. Precipitation
Measurement made every 5 minutes; easily accessible data are in hourly and daily format
Network began in January 2008
Monitor re-gional climate changes in U.S.
National Climatic Data Center (NCDC)
USGS Real Time
More than 9,200 real-time sites in U.S.; 232 in AZ and 141 in NM
1. Stream discharge2. Stream velocity3. Water height (stage)
Measurements made every 15–60 minutes; sub-hour data avail-able for 120 days, daily or monthly data available for entire record
Network began in 1889
Water manage-ment issues
U.S. Geolog-ical Survey (USGS)
SNOTEL* ~1,200 sta-tions in the West, includ-ing 21 in AZ and 23 in NM
1. Snowpack water content2. Snow depth3. Precipitation4. Air temperature
Measurements made every 15 minutes and averaged in daily or monthly format
Record began in AZ and NM in October 1978
Monitor high elevation snow conditions, principally for streamflow forecasting
Natural Resources Conserva-tion Service (NRCS)
*This information pertains only to automated SNOTEL sites and not snow courses.
CRN: U.S. Climate Reference NetworkHCN-M: Modernized U.S. Historical Climate Network
USGS-Real Time: U.S. Geological Survey Real-Time DataSNOTEL: Snow Telemetry
continued on page 5

Southwest Climate Outlook, November 2010
6 | Feature Article
http://climas.arizona.edu/library/feature-articles
trend analysis inadequate for climate studies. Another limitation is that most stations in both networks only measure a few climate parameters, forgoing other important variables such as wind.
Also, data only can be downloaded one station and year at a time, making retrieval cumbersome for queries of mul-tiple stations and years. Finally, there are large distances between stations, making it difficult to understand changes in rain and snow patterns in areas where precipi-tation is spotty, such as in the Southwest during the monsoon season.
These networks eventually will be best suited for detecting longer-term changes in temperature and winter precipitation in the Southwest and less effective at char-acterizing trends in summer precipitation in the Southwest.
Data for Rivers and StreamsClimate data pertain to more than temperature and precipitation. The information also includes streamflow measurements, which incorporate many climate-related phenomena such as tem-perature, precipitation, and soil moisture.
The U.S. Geological Survey (USGS) began streamflow monitoring in 1889 and has increased the streamflow network to include more than 25,000 active sta-tions in the U.S. About 9,200 of those are called real-time stations that automatically measure stream conditions every 15 to 60 minutes. The data usually are available on the USGS website within an hour. Arizona and New Mexico have 232 and 141 real-time stations, respectively.
The data generated by these stations are available for only 120 days and are
“provisional,” meaning they have not been quality controlled. The data, however, are
eventually converted into daily format and are quality controlled and labeled as
“approved.”
The daily data are archived and users can obtain them for the entire period of record for each station. The daily data can include average, median, maximum, and minimum streamflows and other stream-related variables, depending on the station. Real-time data does not have statistical sum-maries like averages or maximums.
Because the real-time data, as opposed to the daily format, lack quality control, users should be weary of potential inac-curacies, particularly after large events that can alter the stream channel and cause errors in the measurements. After an extreme event such as a flood, the USGS visits the site to recalibrate the station, but the data are corrected and become available in “approved” daily format.
The daily values include “provisional” dur-ing the last few months and “approved” data. While provisional data has not been vetted for accuracy, approved data under-goes several layers of quality control that include visual inspections by scientists and cross-checking with other variables.
For example, measured discharged is compared to the discharge calculated from a relationship between river height and flow volume. Approved data require no additional quality control but users of provisional data should be on the lookout for anomalous readings and avoid using the information at sites that experienced extreme events.
The USGS also measures groundwater, water quality, and limited meteorological data, including precipitation. The agency, however, does not quality control the precipitation data, which can only
be downloaded for the previous 120 days; there are no long-term records of precipitation.
Data come in many flavors that can present challenges for selecting the appro-priate network. It would be inapt, for example, to use precipitation data from the USGS network or data from the CRN and HCN-M to characterize changes in summer precipitation in the Southwest. Fortunately, there are many networks that produce information suitable for diverse purposes. Knowing what is available is an important first step to accessing and properly using data.
Where to find the data
SNOTEL and Snow Course1. Access SNOTEL sites for Arizona
and New Mexico: http://www.wcc.nrcs.usda.gov/snow
2. Access Snow Course sites for Arizona and New Mexico: http://www.wcc.nrcs.usda.gov/snowcourse
Climate Reference Network and Mod-ernized Historical Climate Network1. Information about CRN and HCN-M:
http://www.ncdc.noaa.gov/crn/obser-vations.htm
2. FTP access to a stations entire record in daily and monthly format: http://www.ncdc.noaa.gov/crn/prod-ucts.html
3. Data covering the last month: http://www.ncdc.noaa.gov/crn/obser-vations.htm
U.S. Geological Survey streamflow data1. Real-time data for Arizona:
http://waterdata.usgs.gov/az/nwis/rt
2. Real-time data for New Mexico: http://waterdata.usgs.gov/nm/nwis/rt
Climate Data Part 3, continued

Southwest Climate Outlook, November 2010
7 | Recent Conditions
Temperature (through 11/17/10)Data Source: High Plains Regional Climate Center
Temperatures since the water year began on October 1 gener-ally have been between 50 and 60 degrees Fahrenheit across northern Arizona and central New Mexico (Figure 1a). The deserts of southwestern Arizona have experienced temperatures between 60 and 75 degrees F, while southeastern Arizona has been between 60 and 65 degrees F. The higher elevations of northern and eastern Arizona and northern and western New Mexico have had cooler temperatures, ranging between 35 and 50 degrees F. These temperatures were generally 0–4 degrees F above average across Arizona and northern and western New Mexico (Figure 1b). Temperatures in northeastern and south-central New Mexico were 2–6 degrees F warmer than average. Small pockets of southwestern New Mexico were between 0 and 4 degrees F colder than average.
The past 30 days also have been warm, with temperatures rising between 0 to 3 degrees F above average in central, northern and western Arizona, and northern and eastern New Mexico (Figures 1c–d). Much of southwestern and west-central New Mexico have been 0–3 degrees F colder than average. The area in west-central Arizona with colder-than-average temperatures is due to a station move rather than unusually cold tempera-tures. The unseasonably warm temperatures are due to a lack of early winter storms across the Southwest, in part caused by the La Niña event. The La Niña circulation often brings high pressure over the Southwest, steering the winter storms north across the Pacific Northwest, Utah, and northern Colorado. When the Southwest has a dry winter, it is frequently warmer than average as well.Notes:The water year begins on October 1 and ends on September 30 of the fol-lowing year. Water year is more commonly used in association with precip-itation; water year temperature can be used to measure the temperatures associated with the hydrological activity during the water year.
Average refers to the arithmetic mean of annual data from 1971–2000. Departure from average temperature is calculated by subtracting current data from the average. The result can be positive or negative.
The continuous color maps (Figures 1a, 1b, 1c) are derived by taking mea-surements at individual meteorological stations and mathematically inter-polating (estimating) values between known data points. The dots in Fig-ure 1d show data values for individual stations. Interpolation procedures can cause aberrant values in data-sparse regions.
These are experimental products from the High Plains Regional Cli-mate Center.
On the Web:For these and other temperature maps, visit: http://www.hprcc.unl.edu/maps/current/
For information on temperature and precipitation trends, visit: http://www.cpc.ncep.noaa.gov/trndtext.shtml
Figure 1a. Water year '09–'10 (October 1 through November 17) average temperature.
Figure 1b. Water year '09–'10 (October 1 through November 17) departure from average temperature.
Figure 1c. Previous 30 days (October 19–November 17) departure from average temperature (interpolated).
Figure 1d. Previous 30 days (October 19–November 17) departure from average temperature (data collection locations only).
°F
1086420-2-4-6-8-10
°F
543210-1-2-3-4-5
°F
543210-1-2-3-4-5
°F
8580757065605550454035

Southwest Climate Outlook, November 2010
8 | Recent Conditions
Precipitation (through 11/17/10)Data Source: High Plains Regional Climate Center
Since the water year began on October 1, a few winter storms have crossed the Southwest and flowed northeast from Southern California into Utah and Colorado, leaving most of Arizona and New Mexico dry. Northwestern Arizona has been clipped by some of these storms and has received 150 to more than 300 percent of average precipitation. Other areas in both states, however, have received 25–90 percent of average precipitation. The driest areas have been southeastern Arizona and southern New Mexico, where rain has measured less than 25 percent of average (Figures 2a–b). The Sangre de Cristo Mountains in north-central New Mexico have received 110–200 percent of average precipitation. The biggest storms blew through in early October, bringing hail and spawning tornados in central and northern Arizona.
During the past 30 days, northwestern Arizona has received 2–75 percent of average precipitation, and the lower Colorado River has been wetter than average (Figures 2c–d). Northern New Mexico currently tallies between 100 and 200 percent of average. Eastern Arizona and southwestern New Mexico, on the other hand, have received less than 25 percent of average precipitation in the last month, which is consistent with their dry conditions since the beginning of the water year. Unfortu-nately, this dry pattern is forecast to continue through the winter, although some winter storms will pass through the Southwest.
Notes:The water year begins on October 1 and ends on September 30 of the following year. As of October 1, 2010, we are in the 2011 water year. The water year is a more hydrologically sound measure of climate and hydro-logical activity than is the standard calendar year.
Average refers to the arithmetic mean of annual data from 1971–2000. Percent of average precipitation is calculated by taking the ratio of current to average precipitation and multiplying by 100.
The continuous color maps (Figures 2a, 2c) are derived by taking measure-ments at individual meteorological stations and mathematically interpo-lating (estimating) values between known data points. Interpolation pro-cedures can cause aberrant values in data-sparse regions.
The dots in Figures 2b and 2d show data values for individual meteoro-logical stations.
On the Web:For these and other precipitation maps, visit: http://www.hprcc.unl.edu/maps/current/
For National Climatic Data Center monthly precipitation and drought reports for Arizona, New Mexico, and the Southwest region, visit: http://lwf.ncdc.noaa.gov/oa/climate/research/2003/perspectives.html#monthly
Figure 2a. Water year '09–'10 (October 1 through November 17) percent of average precipitation (interpolated).
Figure 2b. Water year '09–'10 (October 1 through November 17) percent of average precipitation (data collection locations only).
Figure 2c. Previous 30 days (October 19–November 17) percent of average precipitation (interpolated).
Figure 2d. Previous 30 days (October 19–November 17) percent of average precipitation (data collection locations only).
300200150130110100907050255
300200150130110100907050255
80040020015012510075502552
80040020015012510075502552
%
%
%
%
Southwest Climate Outlook, November 2010
9 | Recent Conditions
U.S. Drought Monitor (data through 11/16/10)Data Sources: U.S. Department of Agriculture, National Drought Mitigation Center, National Oceanic and Atmospheric Administration
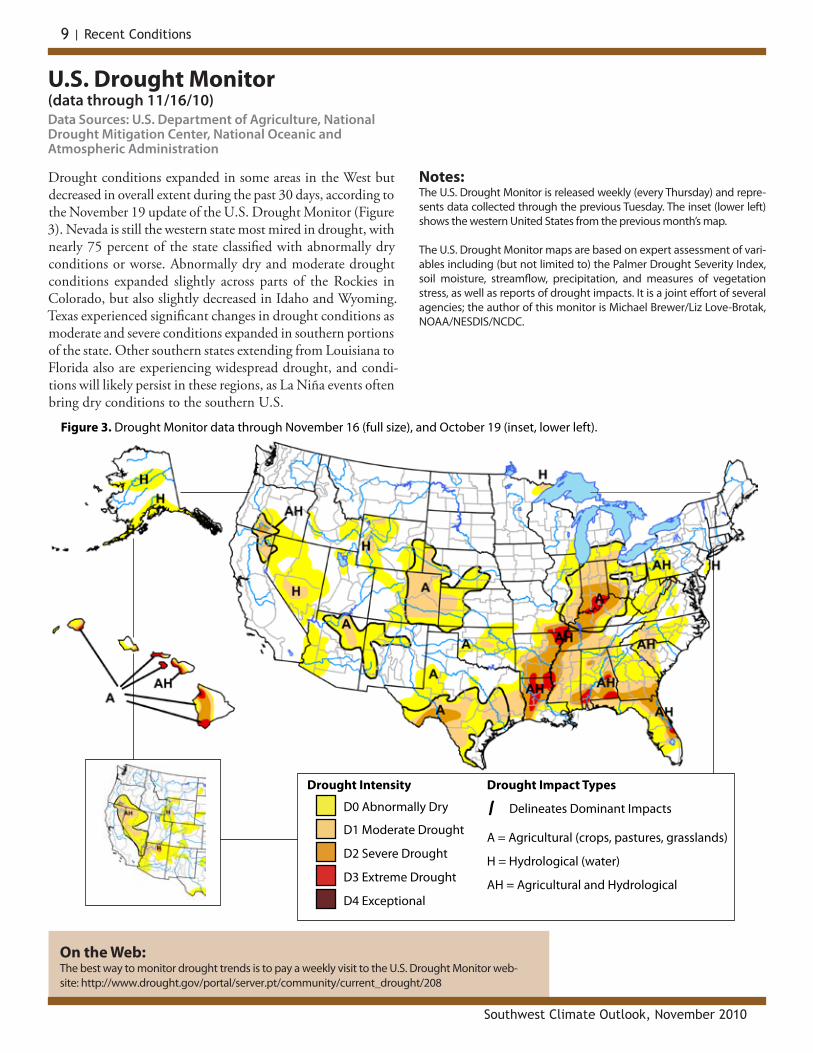
Drought conditions expanded in some areas in the West but decreased in overall extent during the past 30 days, according to the November 19 update of the U.S. Drought Monitor (Figure 3). Nevada is still the western state most mired in drought, with nearly 75 percent of the state classified with abnormally dry conditions or worse. Abnormally dry and moderate drought conditions expanded slightly across parts of the Rockies in Colorado, but also slightly decreased in Idaho and Wyoming. Texas experienced significant changes in drought conditions as moderate and severe conditions expanded in southern portions of the state. Other southern states extending from Louisiana to Florida also are experiencing widespread drought, and condi-tions will likely persist in these regions, as La Niña events often bring dry conditions to the southern U.S.
Notes:The U.S. Drought Monitor is released weekly (every Thursday) and repre-sents data collected through the previous Tuesday. The inset (lower left) shows the western United States from the previous month’s map.
The U.S. Drought Monitor maps are based on expert assessment of vari-ables including (but not limited to) the Palmer Drought Severity Index, soil moisture, streamflow, precipitation, and measures of vegetation stress, as well as reports of drought impacts. It is a joint effort of several agencies; the author of this monitor is Michael Brewer/Liz Love-Brotak, NOAA/NESDIS/NCDC.
On the Web:The best way to monitor drought trends is to pay a weekly visit to the U.S. Drought Monitor web-site: http://www.drought.gov/portal/server.pt/community/current_drought/208
Figure 3. Drought Monitor data through November 16 (full size), and October 19 (inset, lower left).
Drought Impact Types
Delineates Dominant Impacts
A = Agricultural (crops, pastures, grasslands)
H = Hydrological (water)
AH = Agricultural and HydrologicalD3 Extreme Drought
D4 Exceptional
Drought Intensity
D0 Abnormally Dry
D1 Moderate Drought
D2 Severe Drought
Southwest Climate Outlook, November 2010
10 | Recent Conditions
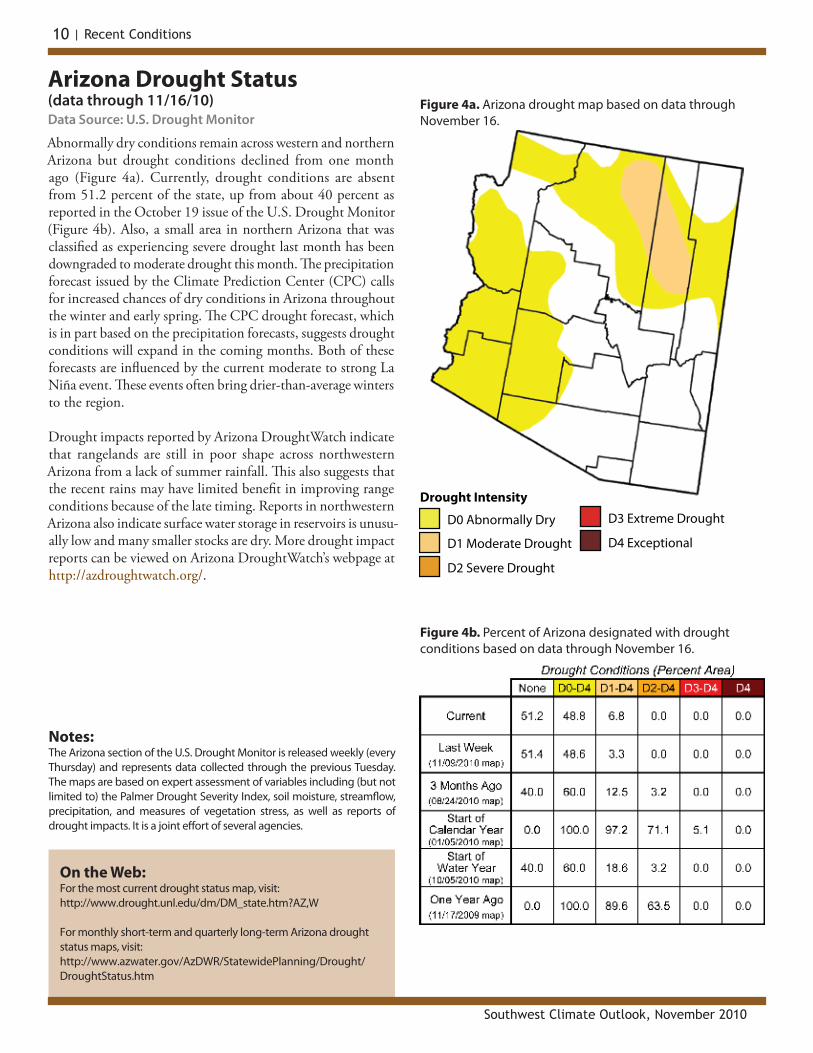
Arizona Drought Status (data through 11/16/10)Data Source: U.S. Drought Monitor
Abnormally dry conditions remain across western and northern Arizona but drought conditions declined from one month ago (Figure 4a). Currently, drought conditions are absent from 51.2 percent of the state, up from about 40 percent as reported in the October 19 issue of the U.S. Drought Monitor (Figure 4b). Also, a small area in northern Arizona that was classified as experiencing severe drought last month has been downgraded to moderate drought this month. The precipitation forecast issued by the Climate Prediction Center (CPC) calls for increased chances of dry conditions in Arizona throughout the winter and early spring. The CPC drought forecast, which is in part based on the precipitation forecasts, suggests drought conditions will expand in the coming months. Both of these forecasts are influenced by the current moderate to strong La Niña event. These events often bring drier-than-average winters to the region.
Drought impacts reported by Arizona DroughtWatch indicate that rangelands are still in poor shape across northwestern Arizona from a lack of summer rainfall. This also suggests that the recent rains may have limited benefit in improving range conditions because of the late timing. Reports in northwestern Arizona also indicate surface water storage in reservoirs is unusu-ally low and many smaller stocks are dry. More drought impact reports can be viewed on Arizona DroughtWatch’s webpage at http://azdroughtwatch.org/.
On the Web:For the most current drought status map, visit: http://www.drought.unl.edu/dm/DM_state.htm?AZ,W
For monthly short-term and quarterly long-term Arizona drought status maps, visit:http://www.azwater.gov/AzDWR/StatewidePlanning/Drought/DroughtStatus.htm
Notes:The Arizona section of the U.S. Drought Monitor is released weekly (every Thursday) and represents data collected through the previous Tuesday. The maps are based on expert assessment of variables including (but not limited to) the Palmer Drought Severity Index, soil moisture, streamflow, precipitation, and measures of vegetation stress, as well as reports of drought impacts. It is a joint effort of several agencies.
Figure 4a. Arizona drought map based on data through November 16.
Figure 4b. Percent of Arizona designated with drought conditions based on data through November 16.
D3 Extreme Drought
D4 Exceptional
Drought Intensity
D0 Abnormally Dry
D1 Moderate Drought
D2 Severe Drought
Southwest Climate Outlook, November 2010
11 | Recent Conditions
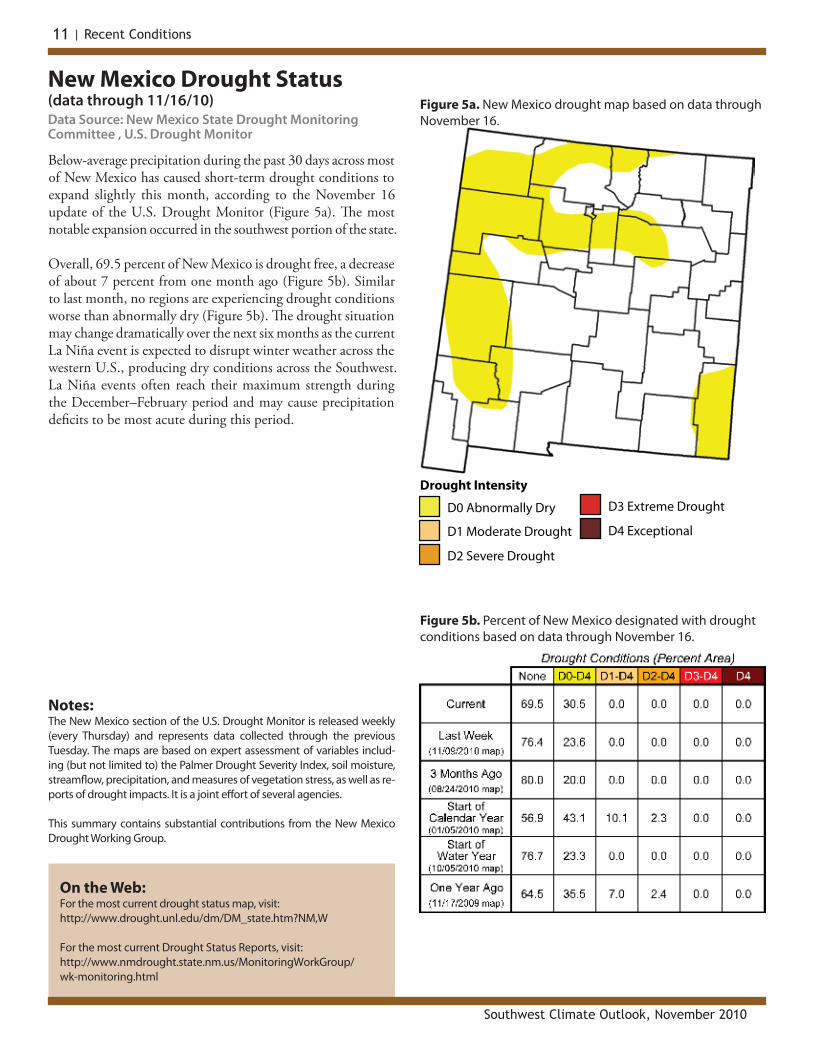
New Mexico Drought Status (data through 11/16/10)Data Source: New Mexico State Drought Monitoring Committee , U.S. Drought Monitor
Below-average precipitation during the past 30 days across most of New Mexico has caused short-term drought conditions to expand slightly this month, according to the November 16 update of the U.S. Drought Monitor (Figure 5a). The most notable expansion occurred in the southwest portion of the state.
Overall, 69.5 percent of New Mexico is drought free, a decrease of about 7 percent from one month ago (Figure 5b). Similar to last month, no regions are experiencing drought conditions worse than abnormally dry (Figure 5b). The drought situation may change dramatically over the next six months as the current La Niña event is expected to disrupt winter weather across the western U.S., producing dry conditions across the Southwest. La Niña events often reach their maximum strength during the December–February period and may cause precipitation deficits to be most acute during this period.
Notes:The New Mexico section of the U.S. Drought Monitor is released weekly (every Thursday) and represents data collected through the previous Tuesday. The maps are based on expert assessment of variables includ-ing (but not limited to) the Palmer Drought Severity Index, soil moisture, streamflow, precipitation, and measures of vegetation stress, as well as re-ports of drought impacts. It is a joint effort of several agencies.
This summary contains substantial contributions from the New Mexico Drought Working Group.
On the Web:For the most current drought status map, visit: http://www.drought.unl.edu/dm/DM_state.htm?NM,W
For the most current Drought Status Reports, visit:http://www.nmdrought.state.nm.us/MonitoringWorkGroup/wk-monitoring.html
Figure 5a. New Mexico drought map based on data through November 16.
Figure 5b. Percent of New Mexico designated with drought conditions based on data through November 16.
D3 Extreme Drought
D4 Exceptional
Drought Intensity
D0 Abnormally Dry
D1 Moderate Drought
D2 Severe Drought

Arizona Reservoir Levels(through 10/31/10)Data Source: Salt River Project, U.S. Bureau of Reclamation, U.S. Geological Survey, and AZ Game and Fish
On the Web:Portions of the information provided in this figure can be accessed at the NRCS website: http://www.wcc.nrcs.usda.gov/wsf/reservoir/resv_rpt.html
The Natural Resources Conservation Service had not reported reservoir levels before publication of this issue. The data were assembled from a variety of other sources, including the Bureau of Reclamation and the U.S. Geological Survey.
During October, combined storage in Lakes Mead and Powell decreased by 73,200 acre-feet, which was less than expected due to significant local precipitation in the region around Lake Powell. As of November 1 combined storage in the lakes was at 50 percent of capacity (Figure 6), which is 1.7 percent, or 862,000 acre-feet, less than a year ago. Overall reservoir storage in the Colorado River Basin is around 55 percent of capacity. Storage in reservoirs not on the main stem of the Colorado River decreased in October by around 49,500 acre-feet. Storage in the Salt and Verde river basins is greater than average and greater than last year.
Notes:The map gives a representation of current storage levels for reservoirs in Arizona. Reservoir locations are numbered within the blue circles on the map, corresponding to the reservoirs listed in the table. The cup next to each reservoir shows the current storage level (blue fill) as a percent of total capacity. Note that while the size of each cup varies with the size of the reservoir, these are representational and not to scale. Each cup also represents last year’s storage level (dotted line) and the 1971–2000 reser-voir average (red line).
The table details more exactly the current capacity level (listed as a per-cent of maximum storage). Current and maximum storage levels are given in thousands of acre-feet for each reservoir. One acre-foot is the volume of water sufficient to cover an acre of land to a depth of 1 foot (approximately 325,851 gallons). On average, 1 acre-foot of water is enough to meet the demands of 4 people for a year. The last column of the table list an increase or decrease in storage since last month. A line indicates no change.
These data are based on reservoir reports updated monthly by the Na-tional Water and Climate Center of the U.S. Department of Agriculture’s Natural Resource Conservation Service (NRCS). For additional information, contact Dino DeSimone, [email protected].
Gila River
Little
Colorado
River
Colo
rado
River
VerdeRiver
Salt River
8
7
6
54
3
2
1
CLIMASwww.climas.arizona.edu
Legend
Reservoir Average
0%
100%
50%Current Level
Last Year's Levelsize of cups is
representational of reservoir size, but not to scale
Figure 6. Arizona reservoir levels for October as a percent of capacity. The map depicts the average level and last year's storage for each reservoir. The table also lists current and maximum storage levels, and change in storage since last month.
1. Lake Powell
2. Lake Mead
3. Lake Mohave
4. Lake Havasu
5. Lyman Reservoir
6. San Carlos
7. Verde River System
8. Salt River System
* thousands of acre-feet
Max Storage*
Change in Storage*
Current Storage*
Capacity Level
Reservoir Name
24,322.0
26,159.0
1,810.0
619.0
30.0
875.0
287.4
2,025.8
47.8
-121.0
-237.8
42.0
-0.4
-13.6
5.7
-41.2
15,314.8
9,971.0
1,437.0
602.2
18.3
119.9
172.1
1,824.0
63%
38%
79%
97%
61%
14%
60%
90%
Southwest Climate Outlook, November 2010
12 | Recent Conditions

New Mexico Reservoir Levels(through 10/31/10)Data Source: USDA-NRCS, National Water and Climate Ctr.
On the Web:Portions of the information provided in this figure can be accessed at the NRCS website: http://www.wcc.nrcs.usda.gov/wsf/reservoir/resv_rpt.html
Total reservoir storage in New Mexico decreased by only 36,300 acre-feet in October (Figure 7). Storage in the Navajo reservoir—New Mexico’s second largest reservoir—decreased by about 19,500 acre-feet. The Santa Rosa Reservoir declined by about 20 percent during October.
In water-related news, the New Mexico state engineer stated that federal funding is needed for the development of the Ute Pipeline, one of the most critical rural drinking water projects in the U.S. (www.ptonline.com, November 4). The pipeline will provide water from Ute Reservoir to communities where groundwater depletion in the Ogallala Aquifer threatens water supplies. The proposed cost for the pipeline is $500 million and will serve key agricultural communities in eastern New Mexico, including Clovis and Portales, which are threatened by groundwater declines in the aquifer.
Notes:The map gives a representation of current storage levels for reservoirs in New Mexico. Reservoir locations are numbered within the blue circles on the map, corresponding to the reservoirs listed in the table. The cup next to each reservoir shows the current storage level (blue fill) as a percent of total capacity. Note that while the size of each cup varies with the size of the reservoir, these are representational and not to scale. Each cup also represents last year’s storage level (dotted line) and the 1971–2000 reser-voir average (red line).
The table details more exactly the current capacity level (listed as a per-cent of maximum storage). Current and maximum storage levels are given in thousands of acre-feet for each reservoir. One acre-foot is the volume of water sufficient to cover an acre of land to a depth of 1 foot (approximately 325,851 gallons). On average, 1 acre-foot of water is enough to meet the demands of 4 people for a year. The last column of the table list an increase or decrease in storage since last month. A line indicates no change.
These data are based on reservoir reports updated monthly by the Na-tional Water and Climate Center of the U.S. Department of Agriculture’s Natural Resource Conservation Service (NRCS). For additional information, contact Wayne Sleep, [email protected].
Southwest Climate Outlook, November 2010
13 | Recent Conditions
Gila
San Juan River
Canadian
River
Rio
Gra
nde
Rive
r
Peco
sRi
ver
CLIMASwww.climas.arizona.edu
15
14
13
12
11
10
9
8
7
6 5
43
21
Legend
Reservoir Average
0%
100%
50%Current Level
Last Year's Levelsize of cups is
representational of reservoir size, but not to scale
Figure 7. New Mexico reservoir levels for October as a percent of capacity. The map depicts the average level and lastyear's storage for each reservoir. The table also lists current and maximum storage levels, and change in storage since last month.
Capacity Level
1. Navajo
2. Heron
3. El Vado
4. Abiquiu
5. Cochiti
6. Bluewater
7. Elephant Butte
8. Caballo
9. Brantley
10. Lake Avalon
11. Sumner
12. Santa Rosa
13. Costilla
14. Conchas
15. Eagle Nest
* thousands of acre-feet
Current Storage*
Max Storage*
Change in Storage*
Reservoir Name
1,696.0
400.0
190.3
1,192.8
491.0
38.5
2,195.0
332.0
1,008.2
4.0
102.0
438.3
16.0
254.2
79.0
82%
64%
49%
15%
11%
19%
17%
6%
2%
58%
15%
10%
43%
9%
65%
1,392.8
255.8
94.1
181.1
52.0
7.3
372.5
18.4
18.2
2.3
14.9
43.0
6.9
22.6
51.1
-19.5
-0.8
-17.2
3.1
0.4
3.7
6.6
-3.0
-0.1
0.4
0.0
-10.4
0.4
2.0
-2.3

Southwest Climate Outlook, November 2010
14 | Recent Conditions
Southwest Snowpack(updated 11/18/10)Data Sources: National Water and Climate Center, Western Regional Climate Center
Where snow has fallen in the high country it has melted. As of November 18, the snowpack conditions in Arizona and New Mexico were exhibiting less-than-average snow water equivalent (SWE) in most basins, according to the Natural Resources Conservation Service’s (NRCS) snow telemetry (SNOTEL) monitoring stations (Figure 8). The average SWE for Arizona is approximately 20 percent of the 1971–2000 average. The San Francisco River Basin reports the lowest SWE values in the state, with approximately 5 percent of average.
In New Mexico, most basins have reported less than 42 percent of average. SWE in the Mimbres River Basin, however, is more than 600 percent of average because 0.3 inches of SWE have fallen; the historical average is only 0.1 inches.
The Rocky Mountain states to the north, which supply most of the water in the Colorado River and Rio Grande, have experienced near-average early winter snowfall. The NOAA–Climate Prediction Center’s winter outlook for December–February shows a greater chance for above-average temperatures and below-average precipitation for many parts of Arizona, New Mexico, Utah, and Colorado through the winter and early spring. These forecasts are based on the current moderate to strong La Niña event. These events tend to bring drier and warmer-than-average conditions to the region.
Notes: Snowpack telemetry (SNOTEL) sites are automated stations that measure snowpack depth, temperature, precipitation, soil moisture content, and soil saturation. A parameter called snow water content (SWC) or snow water equivalent (SWE) is calculated from this information. SWC refers to the depth of water that would result by melting the snowpack at the SNO-TEL site and is important in estimating runoff and streamflow. It depends mainly on the density of the snow. Given two snow samples of the same depth, heavy, wet snow will yield a greater SWC than light, powdery snow.
This figure shows the SWC for selected river basins, based on SNOTEL sites in or near the basins, compared to the 1971–2000 average values. The number of SNOTEL sites varies by basin. Basins with more than one site are represented as an average of the sites. Individual sites do not always report data due to lack of snow or instrument error. CLIMAS generates this figure using daily SWC measurements made by the Natural Resource Con-servation Service.
On the Web:For color maps of SNOTEL basin snow water content, visit: http://www.wrcc.dri.edu/snotelanom/basinswe.html
For NRCS source data, visit: http://www.wcc.nrcs.usda.gov/snow/
For a list of river basin snow water content and precipitation, visit: http://www.wrcc.dri.edu/snotelanom/snotelbasin
13 10
8
4
6 7
3 2 1
15 14 11 12
9
5
110% to 124%
90% to 109%
75% to 89%
50% to 74%
25% to 49%
125% to 149%
150% to 174%175% to 200%
> 200%
< 25%
No snow reported
Figure 8. Average snow water equivalent (SWE) in percent of average for available monitoring sites as of November 18.
AZ NM
UT CO
WY
ID
Arizona Basins 1 Verde River Basin 2 Central Mogollon Rim 3 Little Colorado - Southern Headwaters 4 Salt River Basin
New Mexico Basins 5 Mimbres River Basin 6 San Francisco River Basin 7 Gila River Basin 8 Zuni/Bluewater River Basin 9 Pecos River 10 Jemez River Basin
11 San Miguel, Dolores, Animas, and San Juan River Basins 12 Rio Chama River Basin 13 Cimarron River Basin 14 Sangre de Cristo Mountain Range Basin 15 San Juan River Headwaters
CLIMASwww.climas.arizona.edu
Southwest Climate Outlook, November 2010
15 | Forecasts
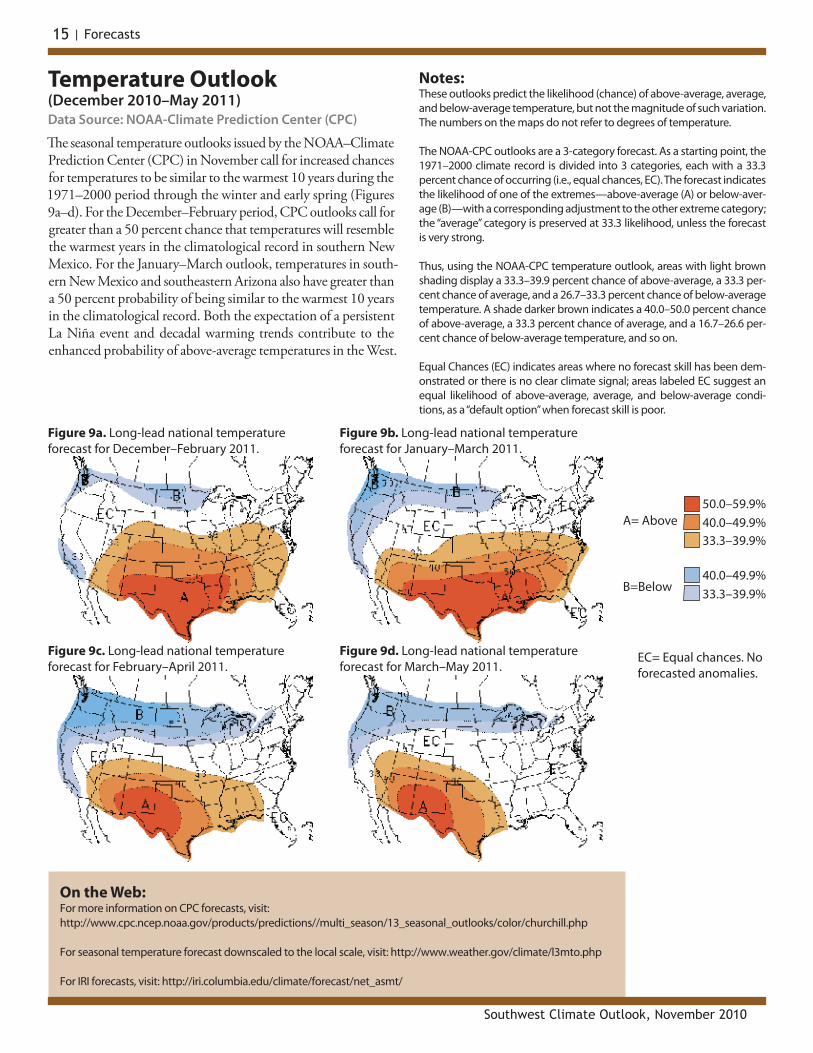
Temperature Outlook (December 2010–May 2011)Data Source: NOAA-Climate Prediction Center (CPC)
The seasonal temperature outlooks issued by the NOAA–Climate Prediction Center (CPC) in November call for increased chances for temperatures to be similar to the warmest 10 years during the 1971–2000 period through the winter and early spring (Figures 9a–d). For the December–February period, CPC outlooks call for greater than a 50 percent chance that temperatures will resemble the warmest years in the climatological record in southern New Mexico. For the January–March outlook, temperatures in south-ern New Mexico and southeastern Arizona also have greater than a 50 percent probability of being similar to the warmest 10 years in the climatological record. Both the expectation of a persistent La Niña event and decadal warming trends contribute to the enhanced probability of above-average temperatures in the West.
Notes:These outlooks predict the likelihood (chance) of above-average, average, and below-average temperature, but not the magnitude of such variation. The numbers on the maps do not refer to degrees of temperature.
The NOAA-CPC outlooks are a 3-category forecast. As a starting point, the 1971–2000 climate record is divided into 3 categories, each with a 33.3 percent chance of occurring (i.e., equal chances, EC). The forecast indicates the likelihood of one of the extremes—above-average (A) or below-aver-age (B)—with a corresponding adjustment to the other extreme category; the “average” category is preserved at 33.3 likelihood, unless the forecast is very strong.
Thus, using the NOAA-CPC temperature outlook, areas with light brown shading display a 33.3–39.9 percent chance of above-average, a 33.3 per-cent chance of average, and a 26.7–33.3 percent chance of below-average temperature. A shade darker brown indicates a 40.0–50.0 percent chance of above-average, a 33.3 percent chance of average, and a 16.7–26.6 per-cent chance of below-average temperature, and so on.
Equal Chances (EC) indicates areas where no forecast skill has been dem-onstrated or there is no clear climate signal; areas labeled EC suggest an equal likelihood of above-average, average, and below-average condi-tions, as a “default option” when forecast skill is poor.
On the Web:For more information on CPC forecasts, visit: http://www.cpc.ncep.noaa.gov/products/predictions//multi_season/13_seasonal_outlooks/color/churchill.php
For seasonal temperature forecast downscaled to the local scale, visit: http://www.weather.gov/climate/l3mto.php
For IRI forecasts, visit: http://iri.columbia.edu/climate/forecast/net_asmt/
Figure 9a. Long-lead national temperature forecast for December–February 2011.
Figure 9b. Long-lead national temperature forecast for January–March 2011.
Figure 9d. Long-lead national temperature forecast for March–May 2011.
Figure 9c. Long-lead national temperature forecast for February–April 2011.
EC= Equal chances. No forecasted anomalies.
A= Above 40.0–49.9%33.3–39.9%
50.0–59.9%
B=Below 33.3–39.9%40.0–49.9%

Southwest Climate Outlook, November 2010
16 | Forecasts
Precipitation Outlook (December 2010–May 2011)Data Source: NOAA-Climate Prediction Center (CPC)
Notes:These outlooks predict the likelihood (chance) of above-average, average, and below-average precipitation, but not the magnitude of such variation. The numbers on the maps do not refer to inches of precipitation.
The NOAA-CPC outlooks are a 3-category forecast. As a starting point, the 1971–2000 climate record is divided into 3 categories, each with a 33.3 percent chance of occurring (i.e., equal chances, EC). The forecast indicates the likelihood of one of the extremes—above-average (A) or below-aver-age (B)—with a corresponding adjustment to the other extreme category; the “average” category is preserved at 33.3 likelihood, unless the forecast is very strong.
Thus, using the NOAA-CPC precipitation outlook, areas with light green shading display a 33.3–39.9 percent chance of above-average, a 33.3 percent chance of average, and a 26.7–33.3 percent chance of below- average precipitation. A shade darker green indicates a 40.0–50.0 percent chance of above-average, a 33.3 percent chance of average, and a 16.7–26.6 percent chance of below-average precipitation, and so on.
Equal Chances (EC) indicates areas where no forecast skill has been dem-onstrated or there is no clear climate signal; areas labeled EC suggest an equal likelihood of above-average, average, and below-average condi-tions, as a “default option” when forecast skill is poor.
On the Web:For more information on CPC forecasts, visit: http://www.cpc.ncep.noaa.gov/products/predictions//multi_season/13_seasonal_outlooks/color/churchill.php(note that this website has many graphics and November load slowly on your computer)
For IRI forecasts, visit: http://iri.columbia.edu/climate/forecast/net_asmt/
The NOAA–Climate Prediction Center (CPC) precipitation outlooks suggest drier-than-average conditions for most of the winter and early spring in all of Arizona and western New Mexico (Figures 10a–d). Probabilities for elevated temperatures are more than 40 percent in the southern halves of Arizona and New Mexico for the December–February period (Figure 10a). Probabilities for increased temperatures exceed 50 percent in southern parts of both states during the January–March and February–April periods (Figures 10b–c). In early spring, ele-vated temperatures are still expected, but odds decrease slightly in both states (Figure 10d). These outlooks are influenced heav-ily by the strong La Niña event. Chances that Arizona and New Mexico will receive drier-than-average conditions are highest in the January–March and February–April periods because La Niña events are strongest during these periods and the atmosphere has had time to adjust to cooling sea surface temperatures.
33.3–39.9%40.0–49.9%B= Below
EC= Equal chances. No forecasted anomalies.
Figure 10c. Long-lead national precipitation forecast for February–April 2011.
Figure 10a. Long-lead national precipitation forecast for December–February 2011.
Figure 10b. Long-lead national precipitation forecast for January–March 2011.
Figure 10d. Long-lead national precipitation forecast for March–May 2011. 33.3–39.9%
40.0–49.9%A=Above
Southwest Climate Outlook, November 2010
17 | Forecasts
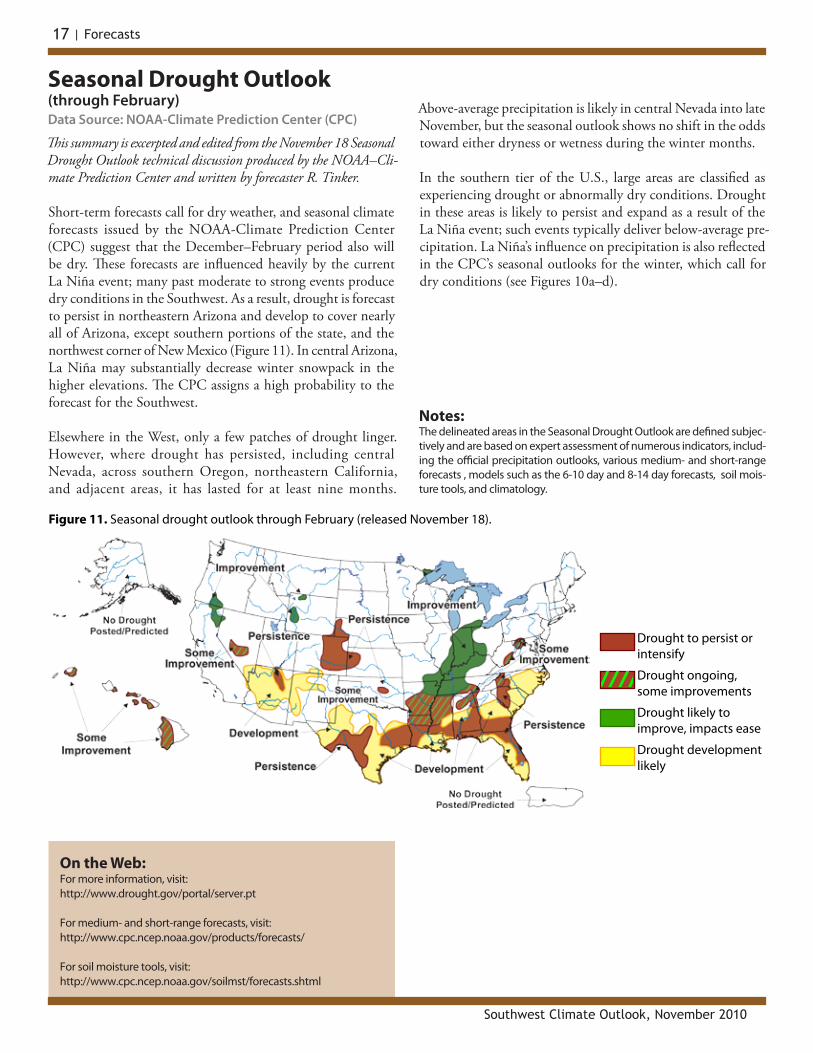
Seasonal Drought Outlook(through February)Data Source: NOAA-Climate Prediction Center (CPC)
This summary is excerpted and edited from the November 18 Seasonal Drought Outlook technical discussion produced by the NOAA–Cli-mate Prediction Center and written by forecaster R. Tinker.
Short-term forecasts call for dry weather, and seasonal climate forecasts issued by the NOAA-Climate Prediction Center (CPC) suggest that the December–February period also will be dry. These forecasts are influenced heavily by the current La Niña event; many past moderate to strong events produce dry conditions in the Southwest. As a result, drought is forecast to persist in northeastern Arizona and develop to cover nearly all of Arizona, except southern portions of the state, and the northwest corner of New Mexico (Figure 11). In central Arizona, La Niña may substantially decrease winter snowpack in the higher elevations. The CPC assigns a high probability to the forecast for the Southwest.
Elsewhere in the West, only a few patches of drought linger. However, where drought has persisted, including central Nevada, across southern Oregon, northeastern California, and adjacent areas, it has lasted for at least nine months.
Notes:The delineated areas in the Seasonal Drought Outlook are defined subjec-tively and are based on expert assessment of numerous indicators, includ-ing the official precipitation outlooks, various medium- and short-range forecasts , models such as the 6-10 day and 8-14 day forecasts, soil mois-ture tools, and climatology.
On the Web:For more information, visit: http://www.drought.gov/portal/server.pt
For medium- and short-range forecasts, visit: http://www.cpc.ncep.noaa.gov/products/forecasts/
For soil moisture tools, visit: http://www.cpc.ncep.noaa.gov/soilmst/forecasts.shtml
Above-average precipitation is likely in central Nevada into late November, but the seasonal outlook shows no shift in the odds toward either dryness or wetness during the winter months.
In the southern tier of the U.S., large areas are classified as experiencing drought or abnormally dry conditions. Drought in these areas is likely to persist and expand as a result of the La Niña event; such events typically deliver below-average pre-cipitation. La Niña’s influence on precipitation is also reflected in the CPC’s seasonal outlooks for the winter, which call for dry conditions (see Figures 10a–d).
Figure 11. Seasonal drought outlook through February (released November 18).
Drought to persist or intensify
Drought ongoing, some improvements
Drought likely to improve, impacts ease
Drought development likely

El Niño Status and ForecastData Sources: NOAA-Climate Prediction Center (CPC), International Research Institute for Climate and Society (IRI)
Notes:The first figure shows the standardized three month running average values of the Southern Oscillation Index (SOI) from January 1980 through September 2010. The SOI measures the atmospheric response to SST changes across the Pacific Ocean Basin. The SOI is strongly associated with climate effects in the Southwest. Values greater than 0.5 represent La Niña conditions, which are frequently associated with dry winters and sometimes with wet summers. Values less than -0.5 represent El Niño con-ditions, which are often associated with wet winters.
The second figure shows the International Research Institute for Climate and Society (IRI) probabilistic El Niño-Southern Oscillation (ENSO) forecast for overlapping three month seasons. The forecast expresses the prob-abilities (chances) of the occurrence of three ocean conditions in the EN-SO-sensitive Niño 3.4 region, as follows: El Niño, defined as the warmest 25 percent of Niño 3.4 sea-surface temperatures (SSTs) during the three month period in question; La Niña conditions, the coolest 25 percent of Niño 3.4 SSTs; and neutral conditions where SSTs fall within the remaining 50 percent of observations. The IRI probabilistic ENSO forecast is a subjec-tive assessment of current model forecasts of Niño 3.4 SSTs that are made monthly. The forecast takes into account the indications of the individual forecast models (including expert knowledge of model skill), an average of the models, and other factors.
On the Web:For a technical discussion of current El Niño conditions, visit: http://www.cpc.ncep.noaa.gov/products/analysis_monitoring/enso_advisory/
For more information about El Niño and to access graphics similar to the figures on this page, visit: http://iri.columbia.edu/climate/ENSO/
During the month of October, the sea surface temperature (SST) anomaly in the Niño 3.4 region—the region in the middle of the tropical Pacific Ocean often used to define El Niño–Southern Oscillation events—was 1.61 degrees Celsius below average, indicative of moderate to strong conditions. A La Niña Advisory issued by the NOAA–Climate Prediction Center several months ago therefore remains in effect, which signifies that a La Niña event is being observed and is expected to continue. The Southern Oscillation Index (SOI) remains high but dipped slightly in the last month to 2.6 to 1.8 (Figure 12a). The current La Niña is evolving similarly to past episodes in 1970–1, 1973–4, and 1998–9, according to the International Research Institute for Climate and Society (IRI).
The large extent of cool ocean temperatures below the surface in the central and eastern Pacific Ocean, along with strong trade winds, suggest the current La Niña will persist during the coming months. The strong trade winds will help perpetuate the event because they induce upwelling in the central and eastern tropical Pacific Ocean, bringing the cool water to the surface. However, substantial additional cooling appears unlikely at this
point, as November is near the typical time of peak strength, according to IRI. There is also some indication that the current La Niña may have already experienced its peak in October; it is also possible that a second and possibly stronger maximum will develop in the next month or two , which occurred in the 1998–99 event.
Presently, the models and observations indicate an approxi-mately 99 percent chance that La Niña conditions will continue during the November–January period (Figure 12b). The probabilities remain high at 92 percent or greater for the January–March period; they decline to about 62 percent by March–May.
Year
SOI V
alue
El NiñoEl Niño
La NiñaLa Niña
Figure 12a. The standardized values of the Southern Oscillation Index from January 1980–September 2010. La Niña/El Niño occurs when values are greater than 0.5 (blue) or less than -0.5 (red) respectively. Values between these thresholds are relatively neutral (green).
2.52.01.51.00.5
0-0.5-1.0-1.5-2.0-2.5-3.0-3.5-4.0-4.5
CLIMASwww.climas.arizona.edu
1990
2000
1982
1984
1986
1988
1992
1994
1996
1998
2002
2004
2006
1980
2008
2010
El NiñoNeutralLa Niña
Time Period
100
90
80
70
60
50
40
30
20
10
0
Prob
abili
ty (%
)
Figure 12b. IRI probabilistic ENSO forecast for El Niño 3.4 monitoring region (released November 18). Colored lines represent average historical probability of El Niño, La Niña, and neutral.
Nov– Jan
2010
Dec– Feb
Jan– Mar
Feb– Apr
Mar– May
Apr– Jun
May– Jul
Jun– Aug
Jul– Sep
Aug– Oct
2011
Southwest Climate Outlook, November 2010
18 | Forecasts

Temperature Verification(December 2010–May 2011)Data Source: Forecast Evaluation Tool
For a thorough description of the interpretation of these maps, see the feature article, “Evaluating forecasts with the RPSS,” in the April 2009 issue of the Southwest Climate Outlook.
Comparisons of observed temperature for December–February to forecasts issued in November for the same period suggest that forecasts have not been more accurate than a forecast of equal chances (i.e., 33 percent chance that temperature will be above-, below-, or near-average) in most of Arizona and New Mexico (Figure 13a). Forecast skill—a measure of the accuracy of the forecast—is substantially higher than equal changes only in northwest Arizona for this period. For the January–March period, forecasts have been better than equal chances in south-ern regions of both states and northwest Arizona (Figure 13b). For the three-month lead times, forecasts issued in November generally have been more accurate in Arizona than in New Mexico (Figures 13c). Forecasts for the March–May period have been more accurate than equal chances in all of the Southwest (Figure 13d). While bluish hues suggest that CPC historical
On the Web:For more information on the Forecast Evaluation Tool, visit http://fet.hwr.arizona.edu/ForecastEvaluationTool/
For a CLIMAS publication that explains how to use the Forecast Evaluation Tool, visit http://www.climas.arizona.edu/feature-articles/november-2005
Notes:These maps evaluate the historical performance of the one- to four-month long-lead forecasts made by NOAA’s Climate Prediction Center (CPC). The maps convey the historical accuracy of the CPC forecasts in relation to the reference forecast, which assigns a 33 percent chance to the three CPC cat-egories, “above,” “below,” and “neutral.” These categories indicate whether conditions are predicted to be similar to the warmest, coolest, or normal temperatures for 1971 to 2000. The maps are generated from the Fore-cast Evaluation Tool, which was developed by The University of Arizona in partnership with NOAA, NASA, NSF, and the University of California-Irvine.
The maps display the Ranked Probability Skill Score (RPSS). The more the forecasts and actual weather match, the bluer the color. A bluish or reddish RPSS indicates the forecast is more accurate or less accurate, respectively, than assigning a 33 percent chance to each of the three CPC categories.
The RPSS is calculated by comparing all the forecasts made since De-cember 1994 for particular seasons and specified lead times to the actual weather of the season.
forecasts have been more accurate than equal chances, caution is advised to users of the seasonal forecasts for regions with reddish colors.
Forecast Performance
Good
Bad
= NO DATA (situation has not occured)
Figure 13a. RPSS for December 2010–February 2011.
Figure 13c. RPSS for February–April 2011.
Figure 13b. RPSS for January–March 2011.
Figure 13d. RPSS for March–May 2011.
Southwest Climate Outlook, November 2010
19 | Forecast Verification
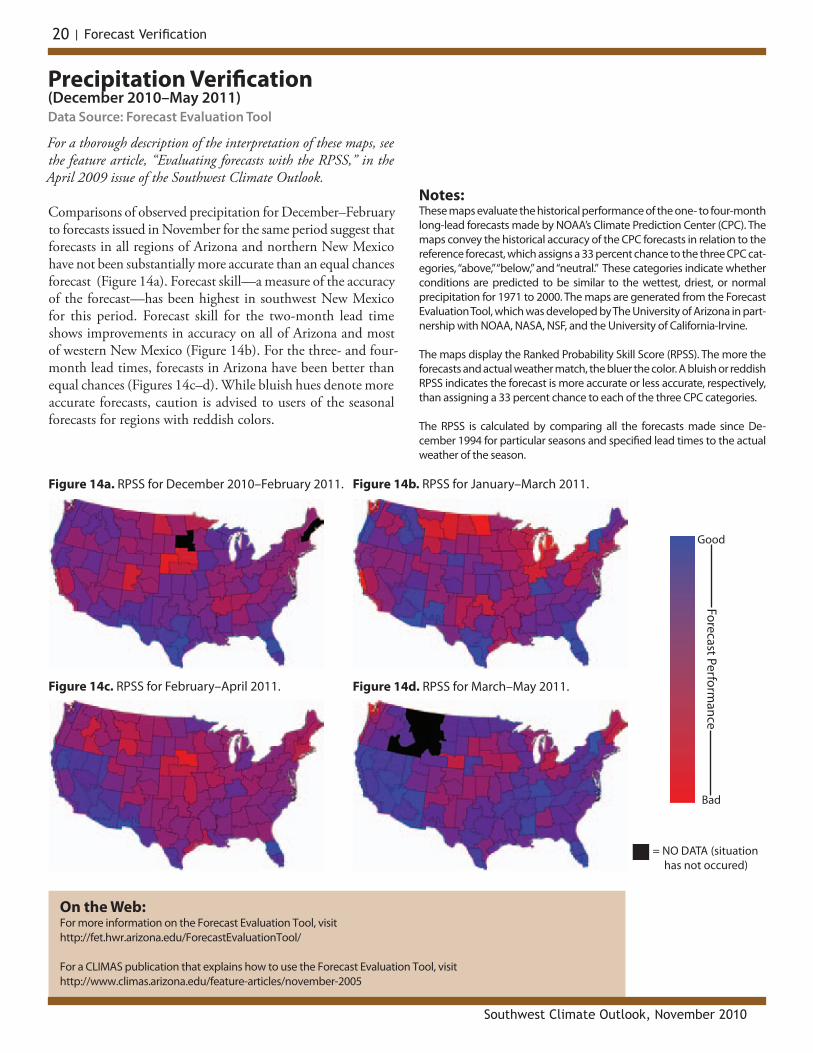
Precipitation Verification(December 2010–May 2011)Data Source: Forecast Evaluation Tool
For a thorough description of the interpretation of these maps, see the feature article, “Evaluating forecasts with the RPSS,” in the April 2009 issue of the Southwest Climate Outlook.
Comparisons of observed precipitation for December–February to forecasts issued in November for the same period suggest that forecasts in all regions of Arizona and northern New Mexico have not been substantially more accurate than an equal chances forecast (Figure 14a). Forecast skill—a measure of the accuracy of the forecast—has been highest in southwest New Mexico for this period. Forecast skill for the two-month lead time shows improvements in accuracy on all of Arizona and most of western New Mexico (Figure 14b). For the three- and four-month lead times, forecasts in Arizona have been better than equal chances (Figures 14c–d). While bluish hues denote more accurate forecasts, caution is advised to users of the seasonal forecasts for regions with reddish colors.
On the Web:For more information on the Forecast Evaluation Tool, visit http://fet.hwr.arizona.edu/ForecastEvaluationTool/
For a CLIMAS publication that explains how to use the Forecast Evaluation Tool, visit http://www.climas.arizona.edu/feature-articles/november-2005
Notes:These maps evaluate the historical performance of the one- to four-month long-lead forecasts made by NOAA’s Climate Prediction Center (CPC). The maps convey the historical accuracy of the CPC forecasts in relation to the reference forecast, which assigns a 33 percent chance to the three CPC cat-egories, “above,” “below,” and “neutral.” These categories indicate whether conditions are predicted to be similar to the wettest, driest, or normal precipitation for 1971 to 2000. The maps are generated from the Forecast Evaluation Tool, which was developed by The University of Arizona in part-nership with NOAA, NASA, NSF, and the University of California-Irvine.
The maps display the Ranked Probability Skill Score (RPSS). The more the forecasts and actual weather match, the bluer the color. A bluish or reddish RPSS indicates the forecast is more accurate or less accurate, respectively, than assigning a 33 percent chance to each of the three CPC categories.
The RPSS is calculated by comparing all the forecasts made since De-cember 1994 for particular seasons and specified lead times to the actual weather of the season.
Forecast Performance
Good
Bad
= NO DATA (situation has not occured)
Figure 14a. RPSS for December 2010–February 2011.
Figure 14c. RPSS for February–April 2011.
Figure 14b. RPSS for January–March 2011.
Figure 14d. RPSS for March–May 2011.
Southwest Climate Outlook, November 2010
20 | Forecast Verification