outline of paper on the changing value of skills
TRANSCRIPT
THE GROWTH AND VALUATION OF GENERIC SKILLS
Andy Dickerson and Francis Green
University of Kent at Canterbury
January 2002
Abstract A method for measuring generic job skills, derived from survey data on detailed job activities, is demonstrated. Using factor analysis, indices are derived for literacy, numeracy, physical skills, technical know-how, high-level communication skills, planning skills, client communication skills, horizontal communication skills, problem-solving skills and checking skills. Indices are also derived for task diversity and autonomy, and for computing skills, capturing both the centrality of computer use and the level of complexity with which computers are used. Based on British surveys in 1997 and 2001, it is shown that there is an upward movement in most of these generic skills, the single exception being physical skills. Computing skills stand out as expanding rapidly. In cross-section hedonic wage equations, some generic skills, including computer skills and high-level communication skills, carry positive wage premia while others, such as physical skills, are associated with lower wages. Some of the cross-section associations are attributable to firm- or individual- effects, and only computer and high-level communication skills are shown to significantly affect the growth of pay in a cohort analysis. Over and above the impact of the individual job-holder’s tasks, more intensive computer use by the establishment’s workforce raises pay. While computers at the establishment are associated with higher pay for managers, their individual computer use does not attract a wage premium. Finally, no part of the gender pay gap can be accounted for by differences in levels of generic skills between men and women.
JEL Numbers: J31 Keywords: Skills, Wages, Computers Acknowledgements: This is a substantially altered version of an earlier paper, presented at the EEEG Annual Conference, Newcastle University, June 1998. We are grateful for the helpful suggestions of participants and of subsequent commentators, including Anna Vignoles and John Bynner. Funds for the 1997 Skills Survey were provided by the Economic and Social Research Council through its research programme entitled “The Learning Society”, under Grant No. L123251032. The 2001 Skills Survey was funded through a contract between the UK Government’s Department for Education and Skills and the Centre for Skills Knowledge and Organisational Performance (SKOPE) at the Universities of Oxford and Warwick. We are grateful to Ken Mayhew, the Director of SKOPE, for continued support, to Rosa Fernandez for research assistance, and to other co-researchers on the two surveys, including David Ashton, Bryn Davies, Alan Felstead and Duncan Gallie. Address for Correspondence: Andy Dickerson, Department of Economics, Keynes College, University of Kent at Canterbury, Canterbury, Kent, CT2 7NP, UK. Tel: +44 (0)1227 827305, Fax: +44 (0)1227 827784; email: [email protected].
1
THE GROWTH AND VALUATION OF GENERIC SKILLS
1. Introduction
Considerable attention has been paid in recent years to the proposition that several identifiable
generic skills have grown in importance in the modern workplace (e.g. Darrah, 1996;
Thomson et al, 1995; Appelbaum et al, 2000). This presumed importance has led the
governments of many industrialised countries to attempt to improve the delivery of certain
generic skills which it was felt were lacking in some sections of the workforce. In particular,
there has been a policy focus on certain core skills, including communication skills,
numeracy, information technology skills, problem-solving skills, and the skills necessary to
work with other people.1 In this paper we describe a methodology for estimating the extent of
usage of generic skills at work, and present estimates of their recent growth in Britain and of
their valuation in the labour market.
Hitherto there have been few attempts to investigate the degree of usage of such core skills
and other generic skills, nor their association, if any, with labour market rewards. Generic
skills are not easily quantified and are typically defined in slightly different ways from case to
case. A rare example of comparable generic skills data is afforded by the International Adult
Literacy Survey (IALS) developed by the OECD (OECD and Statistics Canada, 1995; OECD,
Human Resources Development Canada and Statistics Canada, 1997). The IALS measures
the frequency of usage of literacy and numeracy skills at the workplace, and also tests
respondents on their levels of these skills. Surveys were carried out in several countries
during the 1990s. A notable finding to emerge from analyses of these surveys is that literacy
1 The UK Government also includes in its list of “key skills” the skill of “improving one’s own learning and performance”. It has inserted all key skills into both school and the
2
and numeracy skills are robust and strong determinants of pay (e.g. Freeman and Schettkat,
2001; Green et al, 2002), over and above conventional indicators of educational achievement.
With this finding, the studies also follow in a small tradition of research linking pay to
objective tests of one or other skill or ability, where the test emerges from the school or non-
work environment (e.g. Murnane et al, 1995). However, one drawback with the IALS is that
they only cover a narrow range of generic work skills. The surveys do not, for example,
collect information on problem-solving, communication or information technology skills, all
of which are thought to have become increasingly important in the workplace.2
In this paper we examine evidence drawn from two specially designed surveys which deploy
a job analysis approach that has been borrowed and adapted from commercial psychology.
Respondents are asked about the skills they utilise in their jobs. We derive measures of a wide
range of generic skills, assess their content validity and, by comparing the two surveys, use
the measures to provide evidence on recent trends in the utilisation of each type of skill. We
then investigate the extent to which these generic skills are valued in the labour market. In
particular, skills which carry a premium can be regarded as perhaps being in relatively short
supply, once other contributions to the rewards associated with jobs have been accounted for.
This approach builds on the methods of previous studies which have used proprietory data
based on job analyses by Hays and other commercial ventures (Cappelli, 1993; Cappelli and
Rogovsky, 1994; O'Shaughnessy et al, 2001). These studies have also shown a connection
between skill measures and pay, but here the indicator of skill is attached explicitly to the job
rather than to the person. Such data have also been useful for assessing the extent and origin
university curricula, introduced a separate Key Skills Qualification from September 2000, and explicitly embedded the skills within other qualifications. 2 Another drawback with IALS is that the surveys are conducted only infrequently, since they tend to be expensive to administer.
3
of skill changes over time. Nevertheless, studies using commercial data are limited by their
scope - they are typically confined to large organisations and to specific occupational classes -
and by the scarcity of available databases. Moreover, the range of skill scores generally
available from commercial job analyses does not normally match even loosely the portfolio of
core generic skills that typically enters public debate.
The approach used here also builds on previous studies that have examined the impact of
computing skills. Krueger (1993) suggested that the introduction of a computer generated
wage rises for individual workers because it created a demand for this specific skill, and that
therefore the expansion of computers was responsible for part of the increased wage
inequality in the United States. Subsequent studies have, however, cast considerable doubt on
this hypothesis (DiNardo and Pischke, 1997; Entorf and Kramarz, 1997; Haisken-DeNew and
Schmidt, 1999). In particular, fixed-effects estimations have shown that much of the proposed
impact of computer usage on wages disappears once the correlation of computers with
unobserved individual heterogeneity is accounted for. What remains is a small wage gain
deriving from experience with using computers, estimated for 1980s France at no more than
about 5 percent after six years (Entorf and Kramarz, 1997), and even less in the early 1990s
(Entorf et al, 1999). Thus, one account of the cross-section correlation found by Krueger is
that more able workers are being selected to use computers, and that these workers would be
highly paid anyway, because their ability makes them more productive even without
computers. In all this literature, however, the information available about how computers are
used is very restricted; for the most part, the results are obtained from a variable that simply
distinguishes whether or not a computer is used at work.3 There is no distinction between the
3 Entorf and Kramarz (1997) are able to distinguish different types of new technology, partly related to the distinction between manual and non-manual work; however, use of
4
levels of sophistication of computer use, or even according to how central computers are to
the job. Presumably, however, one would expect computer skills to be valued (if at all) the
more highly, the more complex and advanced their level of usage and the more central they
are to the job. We attempt to test these hypotheses below.
The method and evidence that we present have implications with regard to planning the
supply of skills, for skill-supplying institutions and for education and training policy. There
are also consequences for the large and growing literature which argues that increasing wage
inequality in Anglo-Saxon economies is primarily driven by skill-biased technical change.
The evidence for this argument mainly rests largely on conventional, education-based,
measures of skills, or else on relatively crude skill measures derived from occupational class.
These indicators provide only imperfect indicators of the nature of the skill-biased change in
the workplace. Typically, rising wage inequality is found to be associated to a considerable
extent with rising inequality within educational groups, and while these may be attributed to
residual unmeasured skills or abilities the story remains unsatisfactory while such skills
remain unspecified. Progress towards obtaining more satisfactory measures of skills, and
investigation of their association with labour market rewards, could therefore assist over a
period of time in validating the arguments used to explain increasing wage inequality in
recent years (Borghans et al, 2001).
After describing the data and its design principles in Section 2, we examine in Section 3 the
problem of identifying and measuring skills. We use factor analysis to generate a simpler
representation of a large number of detailed skills. We thereby derive measures of several
microcomputers and other computer connections could presumably involve substantially varying levels of computing skills.
5
generic skills which workers utilise in their workplace, and seek to provide reasonable
interpretations based on this methodology. We measure generic computing skills separately
because the data affords a precise classification based both on the centrality of computer
usage and on the complexity of that use. These measures are then used to provide a
description of all generic skills in 1997 and 2001 in Britain and of how they changed in this
interval. In Section 4, we use hedonic wage equations to compute the value of the generic
skills, controlling for conventional determinants of individual wages. We also control for
some firm-level fixed effects, and examine whether within-cohort changes in pay are
associated with changes in individuals’ skills.
2. Data and Methodology
2.1 Data
We utilise data drawn from the 1997 Skills Survey and from the 2001 Skills Survey. Each is a
large-scale cross-sectional representative survey of individuals aged between 20 and 60 in
Britain in paid work at the time of interview. The first wave was conducted in spring 1997
and the second in spring 2001. The achieved samples were 2467 and 4470 respectively. In
both cases, random sampling methods were used, and the achieved samples were
representative of the British population. Full details of the sampling frame and fieldwork
methods can be found in Ashton et al (1999) and Felstead et al (2002).
The questionnaires comprise a detailed investigation of the nature of the individual’s job with
an emphasis on the activities that the job entails. Additional information is obtained on the
organisation in which the individual works, pay and changes that have occurred in the job in
the last 5 years. Some background demographic information on each individual was also
6
collected. The two questionnaires contain a core of questions asked in identical ways in the
two surveys and hence it is possible to examine both the distribution and the changes in
generic skills over time.4
2.2 Methodology
In this paper we utilise mainly the job analysis questions in order to measure the level and
value of skills. Initially, we pool the data from the two survey years in order to maximise the
accuracy and interpretability of our analyses, but we also consider the changes between the
two years.
There are two main stages in our analysis. First, we derive measures of generic skills from the
activities that individuals associate with their jobs, and present evidence on how these
changed between 1997 and 2001. Second, we compute the value of these generic skills. Using
the compensating wage differentials literature as an analogy, we formulate and estimate a
hedonic wage equation, the coefficients of which will be the shadow prices of the particular
attributes or skills.
3. Measuring Generic and Computing Skills
3.1 Derivation of Generic Skills Indicators Using Factor Analysis
Respondents were asked a large number of detailed questions about their job’s characteristics.
In particular, one section of the questionnaire, focussing on the activities involved in carrying
out their work, was prefaced by the following statement:
4 The objective of comparability was integral to the design of the surveys, both of which were directed by Francis Green. The surveys utilised the same survey company, now called the
7
‘You will be asked about different activities which may or may not be part of your job. We are interested in finding out what types of activities your job involves and how important these are’.
Respondents were then asked: ‘in your job, how important is [a particular job activity]’. The
response scale offered was: ‘essential’, ‘very important’, ‘fairly important’, ‘not very
important’ and ‘not at all important or does not apply’. Examples of the activities included
working with a team of people, working out the causes of problems or faults, making
speeches or presentations and planning the activities of others. The questionnaire focused on
36 activities designed to cover the tasks carried out in a wide range of jobs (see Table A1 for
details). One of these concerned the use of computers, and we shall discuss computer skills
separately below. The remaining 35 items provide the main source for our analysis of all other
generic skills. These items were measured in identical ways in both 1997 and 2001.
To reduce these items to an interpretable set of skills indices, a data reduction methodology is
required. We utilise factor analysis, which is related to principal components analysis (PCA)
(see, for example, Lawley and Maxwell, 1971, Tatsuoka and Lohnes, 1988). Though PCA is a
more common procedure in economics, factor analysis is more suited to our purpose here
since it produces a number of factors which capture the correlations between different job
activities, and which can therefore hopefully be identified as generic job skills. In PCA, a set
of variables is transformed into an equal number of orthogonal new variates or components
which have maximum variance subject to being uncorrelated with one another.5 In contrast,
factor analysis seeks to account for the covariances between the variables in terms of a lesser
National Centre for Social Research, and the same sampling methods. 5 Typically, the first few components will account for a large proportion of the total variance of the original variables, and hence can be used to summarise the original data.
8
number of hypothetical variables or factors.6 Factor analysis proceeds by decomposing the
variance of each (standardised) variable into a unique part (which is treated as a residual) and
a shared part which along with the other variables’ shared components, contributes to the
factors identified. That is, factor analysis produces a decomposition of the variables into a set
of common factors, and a residual component unrelated to these factors. We identify these
common factors as our generic skills.
The factors are chosen in such a way as to capture as much of the correlation as possible in
the variables (here, the 35 job activities), while also being amenable to interpretation in terms
of the relevant theoretical concepts – in this case, to the concepts of generic skill types. The
35 activities detailed in Table A1 were first recast into 35 numeric variables. We transformed
the ordinal scale of ‘importance’ for each variable into a cardinal scale, running from 1
(meaning ‘essential’) to 5 (meaning ‘not at all important’). Then, using factor analysis, we
reduced these 35 activities to 10 generic skill measures.
In order to aid interpretation of the resulting factors, we employed an oblique rotation7 to a
simpler structure to produce our factor loadings, and the estimated factor scores for each
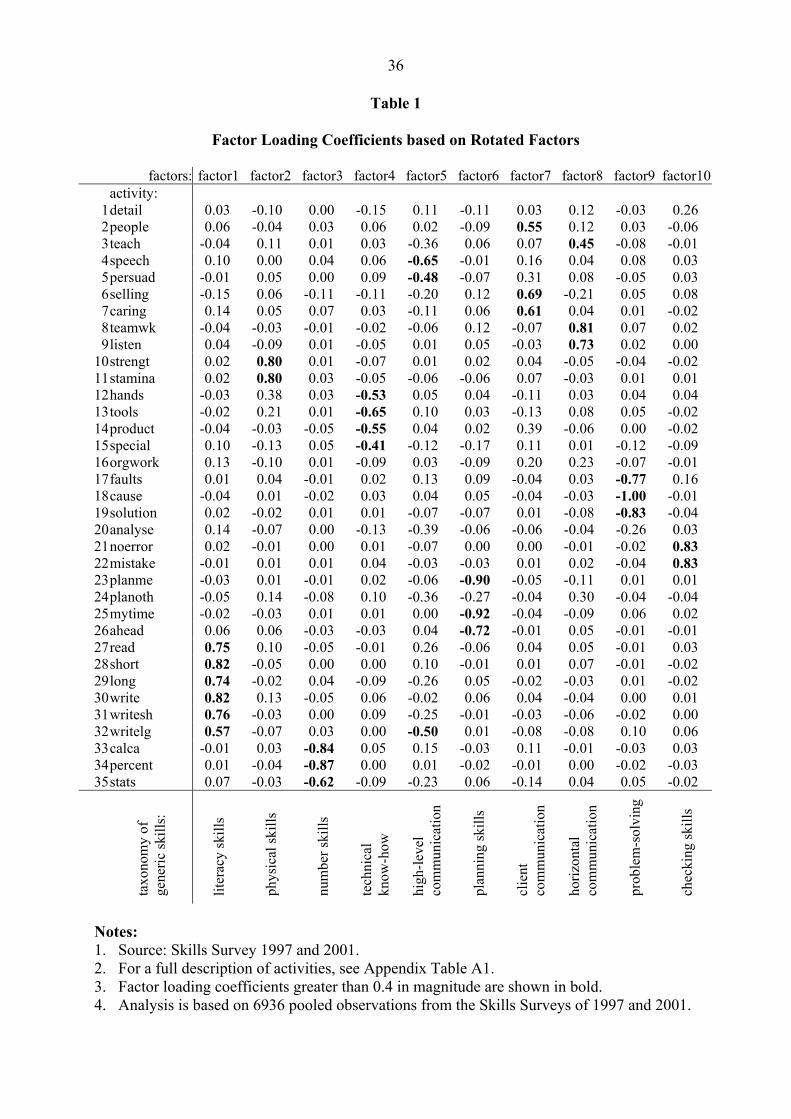
individual. The factor loading coefficients are presented in Table 1. To interpret the
coefficients in this table, we can read across the rows; thus, for example, most of the sample
6 That is, whereas PCA is variance-orientated, factor analysis is covariance-orientated (Lawley and Maxwell, 1971: 2-3) – or, more strictly, correlation-orientated since it uses the standardised variables. Moreover, in PCA the components are defined as linear combinations of the variables, whereas in factor analysis, the observed variables are linear combinations of the hypothesised factors. 7 We used the Promax method, with a power of 4, though the results are not greatly sensitive to the choice of this parameter. Note that this (oblique) rotation does not preserve the original orthogonality of the factors. However, in this particular case, since we would not want our generic skills to be orthogonal to one another, this is an advantage of the rotation method rather than a disadvantage.
9
variance in activity 27 ‘reading written information’ (read) is accounted for by factor 1,
although factor 5 also has quite a high weight in determining this activity.8 The resulting
rotation satisfies many of the criteria originally suggested by Thurstone (1947) for a
simplified factor structure. In particular, each activity contributes a high loading to at most
one factor. To illustrate this fact, we have highlighted (in bold) factor loadings greater than
0.4 in magnitude. It can be seen that each activity variable has a loading greater than 0.4 for at
most one factor (with the exception of activity 32: ‘writing long documents’ (writelg) which
has a loading greater than 0.4 for two activities), and each factor has a loading of greater than
0.4 for only a few activities. Only a very small number of activities are not well-defined by
the rotated factors (activity 1: ‘paying close attention to detail’ (detail); activity 16:
‘knowledge of how the organisation works’ (orgwork); activity 20: ‘analysing complex
problems’ (analyse); and activity 24: ‘planning the activities of others’ (planoth); and the
latter two only just miss the 0.4 criterion used in the table). Hence the activities differentiate
the factors, and the factors are differentiated by the activities. This is therefore a simpler
structure than that given by the original factor loadings.
Having identified the factors more clearly following the rotation to this simpler structure, we
now seek to interpret these factors which correspond to the notion of ‘generic skills’. At the
bottom of Table 1, we have labelled the columns according to a taxonomy which is based on
the activities which have the highest loadings. Recall that the activities are scaled 1 to 5 (high
to low) so that for factor 1, for example, the analysis has in fact identified non-literacy skills
since this factor has a high positive loading on reading and writing activities. Hence we
8 More precisely, the variance in activity 27 ‘reading written information’ (read), once normalised to unity, is decomposed into a sum of squared factor loadings plus a residual which is its unique component. Thus (0.752+0.262=) 63% of the variation in reading written information can be accounted for by factor 1 and factor 5.
10
simply multiply the resulting score by -1 to produce our measure of literacy skills. A similar
transformation is necessary in order to use the nomenclature that we have attached to the
interpretation of the 2nd, 7th, 8th and 10th factors.
Standard practice for factor analyses requires an element of judgement by the researcher over
the choice of factor extraction method, how many factors to retain, how to rotate those factors
to a simpler structure, and how to generate factor scores. We have chosen to define 10 generic
skills for a number of reasons. First, this number of retained factors generated easily
interpretable skill-types. Second, the same set of factors were found whether we use just
males, just females or the whole sample, and whether or not we restricted the sample to either
1997 or 2001 only. Thirdly, the selection of 10 factors is also (weakly) supported by the scree
test as first suggested by Cattell (1966), although this is not decisive since it indicates a
gradual slope after just the first two factors. Finally, a preliminary PCA indicated that 10
components would account for 70% of the variance of the activities which, while arbitrary,
seemed a high proportion.9 We used the principal factors method for extraction and we used
the regression method for deriving factor scores. Fortunately, the procedures we used were
not greatly sensitive to the choices made. Similar patterns were obtained using other methods
of extraction and factor scoring.
9 There are only 8 principal components with eigenvalues greater than unity (a common rule in choosing the number of principal components to retain), but, as noted above, factor analysis and PCA have different objectives. In any event, the analysis presented below is not particularly sensitive to the precise choice of the number of factors. A further reduction to 8 factors rather than the 10 utilised in the analysis below identifies a very similar set of generic skills; essentially, the physical skills are combined with the technical know-how to give a generic ‘manual dexterity’ skill category, and the problem-solving skills are combined with the checking skills to produce a generic ‘problem searching and solutions’ skill. The other 6 skill categories listed above are still separately identifiable after rotation of the factors.

11
Thus the factor analysis generates a taxonomy of generic skills which can be summarised as
follows:
1. literacy skills both reading and writing forms, notices, memos, signs, letters,
short and long documents etc. 2. physical skills the use of physical strength and/or stamina
3. number skills adding, subtracting, division, decimal point or fraction
calculations etc., and/or more advanced maths or stats procedures 4. technical know-
how knowing how to use tools, equipment or machinery, knowing about products and services, specialist knowledge and/or skill in using one’s hands
5. high-level communication
a range of related managerial skills, including persuading or influencing others, making speeches or presentations, writing long reports, analysing complex problems in depth
6. planning skills planning activities, organising one’s own time and thinking ahead
7. client communication
dealing with people, selling a product or service, counselling or caring for customers or clients
8. horizontal communication
teaching or training and/or working with a team of people, listening carefully to colleagues
9. problem-solving detecting, diagnosing, analysing and resolving problems
10. checking skills noticing and checking for errors
These 10 generic skill measures emerging from this analysis largely match our priors about
the types of skills involved in jobs. Moreover, their inter-relationships also seem to confirm
our expectations. The first 10 rows of Table 2 present the correlations between the estimated
generic skills. Non-manual generic skills are highly correlated with each other as one might
anticipate. Physical skills are negatively correlated with all other generic skills except
technical know-how.10
As with other job-based indicators of skill (such as occupation), it is possible for the skills of
job-holders to differ from the skills required to do the jobs, at least in the short term. The job
12
analysis method provides a direct measure of job skills but only a proxy measure for the skills
of the job-holder. If a job-holder’s skills are inadequate for the job, it might be expected that
over time they may acquire the necessary skills through training or on-the-job learning, or
else move to another more suitable job. But it is also possible that poor job performance could
be tolerated for some time. Similarly, a job-holder might have skills in excess of those
required for the job. In that case, there is an incentive for the job-holder to transform the job,
or to move jobs to gain more satisfaction and a greater reward for the skills that they have, but
labour market frictions could prevent such adjustments from happening. Thus, it should be
noted that when we refer to generic skills in this paper, this is a measure of job skills used in
the job, and only a proxy for the individual job-holder’s skills.11
3.2 The Distribution and Growth of Generic Skills
Given that these measures form the basis of much of the remainder of the analysis presented
below, it will be useful first to seek some further support for the methodology by examining
the composition of these measures of generic skills across a number of characteristics of the
sample. For example, do the measures have a plausible correspondence to standard measures
of skills based on occupation and education? Since the generic skills indices are constructed
to have a mean of zero across all the observations, we can easily compare how these generic
skills measures correlate with conventional occupation and education-based measures. In
10 All the correlation coefficients in Table 2 are significantly different from zero at the 1% level or better. 11 From the perspective of human capital theory this is a disadvantage of our method, to be traded off against the advantage of being able to generate a range of generic skill indicators not otherwise available. However, from the perspective of other theories of wage determination, such as job queuing theory, the characteristics of the job assume greater importance. Indeed, there is some evidence from IALS that measures of job skills are at least as important as measures of individuals’ skills in the determination of wages (Green et al, 2002).
13
particular, a positive mean for any occupation or education group would indicate that the skill
is being used by that group more than average and vice versa.
A breakdown of the generic skills by occupation is provided in Table 3. It is apparent that
there is indeed a good correspondence between broad occupational classification and the
generic skill indices, but that we have provided a richer classification of skill utilisation (and
demands) than one based simply on occupation. For example, those engaged in managerial
occupations are using above average levels of high-level communication, planning and client
communication skills. Managers are similar in this regard to those engaged in professional
occupations, but the latter are characterised by higher levels of literacy and high-level
communication and lower levels of client communication. In contrast, workers in craft
occupations which utilise both physical skills and what we have termed technical know-how
can be compared with operatives and other elementary occupations which, while also
demanding physical skills, require little in the way of technical know-how, and score well
below average on communication skills. Client communication skills are important to those in
sales-based occupations, but are apparently not combined with other skills dimensions unlike
those in managerial occupations. Thus the measures of generic skills appear to be sensibly
related to occupations, while providing a richer and more detailed classification in terms of
what skills different occupations utilise.
A similar breakdown by highest level of education attained and by gender is provided in
Table 4. Most of the non-manual generic skills we have identified strongly increase
monotonically with educational qualifications. This is as would be expected for literacy and
numeracy since these are formally tested with educational qualifications, but is perhaps more
14
surprising for some of the other measures of generic skills. The widest variation in generic
skills across education is for high-level communication skills.
There are only very small differences in the mean levels of literacy skills used by men and
women in their jobs, but there are larger and significant differences in numeracy, technical
know-how and problem-solving skill utilisation, all of which men use more in their jobs than
women. Men also utilise more physical skills than women as expected, but less
communication skills, with the exception of high-level communication. The latter is
undoubtedly related to occupational differences as seen above.12
The change in the usage of generic skills over time is shown in Table 5. With the exception of
physical skills, the average level of every generic skill that we have identified from the factor
analysis has significantly increased between 1997 and 2001. While some of these differences
appear small, they are all significantly positive at the 1% level as shown by the t-statistics and
p-values presented in the second and third columns of the table. These changes confirm the
often-cited increased demand for generic job skills in recent years. A longer time span of data,
only to be gleaned from future surveys, would be able to confirm whether the growth of
generic skills represents a genuine trend or is a reflection of a short-term cyclical movement.
However, it is worth noting that the growth of generic skills is not merely the result of a
higher skilled younger generation replacing a lesser skilled cohort of retirees from the
workforce. To demonstrate this, Table 5 also presents results from a decomposition of the
1997-2001 change into a within-cohort change and a between-cohort change.13 Three cohorts
are defined as: older workers born before 1941 (and hence ‘retired’ by 2001 since they are
12 Felstead et al (2001) show that it is especially part-time jobs, mainly held by women, which utilise lower levels of most generic skills.
15
over 60 years of age); ‘prime age’ workers born between 1941 and 1977 (and hence present in
both surveys); and, finally, younger workers born after 1977 (and hence not present in the
1997 survey since they are less than 20 years old). The within-cohort change is dominant in
all cases where the generic skill has significantly grown. Although the changes are gradual, it
does appear that existing cohorts of workers are moving to higher levels of generic skills
usage.
3.3 The Distribution and Growth of Computing Skills
To measure computing skills, two questions were asked of the respondents in both 1997 and
2001 about their use of information technology. Alongside the job activity variables analysed
above, individuals were asked:
‘how important is using a computer, ‘PC’, or other types of computerised equipment?’,
again using the 5 point scale ranging from ‘essential’ to ‘not at all important’. As shown in
Table 6, Panel A, the proportion reporting that computer use was essential in their job
increased from just over 30% in 1997 to almost 40% in 2001, an increase of one third, while
the proportion reporting that computer use was ‘not at all important’ fell by one third from
30% to just over 20%. These are large changes given that the surveys were administered only
4 years apart, signalling an ongoing rapid diffusion of computing technologies.14
For those respondents who reported some computer usage, a subsidiary set of questions was
asked about their computing skills and other qualifications. One of these questions related to
the complexity with which computers were used within their jobs:
13 There is also a very small residual due to changing cohort sizes. 14 The rapidity of diffusion also implies that international comparisons of computer use need to consider seriously the dates for comparison.
16
‘Which of the words in CAPITALS best describes your use of computers or computerised equipment in your job? STRAIGHTFORWARD (for example, using a computer for straightforward
routine procedures such as printing out an invoice in a shop); MODERATE (for example, using a computer for word-processing and/or
spreadsheets or communicating with others by ‘email’); COMPLEX (for example, using a computer for analysing information or
design, including use of computer aided design or statistical analysis packages);
ADVANCED (for example, using computer syntax and/or formulae for programming).’
The responses to this question are shown in Table 6, Panel B. Despite the rapid spread of
computer usage to wider sections of the workforce, there is no evidence that the average level
of complexity of use is falling. Indeed, there has been an increase in the complexity of
computing usage at the less sophisticated end of the range with a shift in the proportion
reporting ‘straightforward’ usage to those reporting ‘moderate’ usage on the basis of the
above scale.15 At the more advanced end of the range of complexity, there has been little
change between the two survey dates.
There is a very strong positive relationship between the two measures of computing skills –
usage and complexity – in the data. As shown in Table 2, the rank order correlation
coefficient between the two measures is 0.793. Furthermore, although younger workers use
computers more and with greater complexity than older workers, most of the increase in
computer skills shown in Table 6 is a within-cohort change; for example, for the cohort aged
20 to 56 years old in 1997 (and thus 24 to 60 years old in 2001), the proportion reporting that
using a computer was ‘essential’ increased from 31.3% to 39.3%, while the proportion
reporting that using a computer was ‘not at all important’ fell from 30.2% to 21.5%.
15 For a detailed descriptive analysis of the growth of computing skills over 1997 to 2001, and of further aspects of computing and internet skills in 2001, see Felstead et al (2002). The association of the growth of computing in Britain with the growth in the demand for skills is shown in Green et al (2002).
17
3.4 Measuring Other Generic Job Skills: Task Discretion and Variety
The Skills Surveys also ask a number of other questions pertaining to generic features of jobs
that are normally seen as relating to skills utilised in the job. These include task discretion and
variety. Task discretion is seen as a skill, because if employers are to act without close
supervision, they must know what tasks are to be done and how to do them. Task discretion is
also a reflection of trust by the line manager/employer in the conformity of the employee to
appropriate effort norms. For these reasons, task discretion has long been an important focus
for sociological enquiry since the work of Braverman (1974) and subsequently Friedman
(1977) and Spenner (1990). While variety in the tasks to be employed is related to task
discretion, since more discretion (which in itself entails greater skill) is likely to facilitate
efficient switching between tasks, variety is also likely to require a wider range of skills.
Earlier analysis has shown that there has been some diminution over the last decade in the
extent of task discretion and related autonomy in British workplaces (Felstead et al, 2002).
Nevertheless, it will be of interest to examine whether task discretion and more task variety
are associated with a wage premium: to the extent that they are each linked with, and
proxying for, a generic skill that is not otherwise captured by other indices, one would expect
to find a wage premium associated with the higher productivity that they potentially afford.
However, both autonomy and variety are also presumably valued attributes of jobs, for which
employees would willingly concede a negative compensating differential. The balance of
effects ought therefore to be a matter for empirical investigation.
We derived a discretion index from the responses to five questions. The first asked
respondents directly:
‘How much choice do you have over the way in which you do your job?’
18
The other four questions asked respondents how much influence they personally had on:
‘deciding what tasks to do’, ‘how you are to do the task’, ‘how hard you work’, and ‘the
quality standards to which you work’. Each question offered a four-point response scale. A
factor analysis was conducted on these five variables, with one factor being retained. The
factor score was then used as the discretion index.16
Task variety is measured in the surveys by summing the 5-point responses to the questions:
‘How often does your work involve carrying out short, repetitive tasks?’
and
‘How much variety is there in your job?’
and standardising (i.e. zero mean and unit variance) the resulting index.
4. Hedonic Wage Equations
We now turn to consider the value of the skills indices that we have identified in the factor
analysis. We can regard these indices as similar to job attributes in the empirical analysis of
compensating wage differentials. In such studies, it is common practice to specify a reduced
form relationship between wages and a vector of job attributes, the estimated coefficients of
which are the shadow prices of those attributes (e.g. Lucas, 1977; McNabb, 1989).
Competitive equalisation of workers’ utilities across jobs then generates positive shadow
prices for job attributes which are unpleasant, and vice versa. Analogously, in our skills
analysis, given perfect competition in the labour market, and all firms with equal marginal
rates of substitution between skills types, then the relative values of the coefficients on skills
16 In practice, this procedure did not produce results greatly different from taking a simple unweighted average of the standardised responses to the five variables.
19
are estimates of their relative supply prices.17 Hence our basic framework for valuing skills is
to estimate a hedonic wage equation including the vector of generic and other skills.
4.1 The Value of Skills
Table 7 reports the coefficients from the estimates of a hedonic wage equation for the two
waves of the Skills Survey pooled together. The dependent variable is the log of real gross
hourly wages18, augmented by 10% for those individuals reporting that their employer also
contributes to a pension scheme.19 The regressors shown are the generic and computing skills
described above. One problem is that it is likely that not all aspects of any job are fully
captured by the job attributes questions in a survey of this kind. One way to attempt to capture
any missing skills might be to estimate a standard Mincerian earnings function and augment
this by our measures of skills. Yet, to the extent that (the output of) schooling is highly
correlated with many of the observed skills, this is less than ideal. Since the problem of
unobserved variables is typically non-trivial in estimates of hedonic price equations, we
attempt to mitigate any bias induced by unobserved job skill attributes by including a number
of control variables. Of course, these control variables will also capture the impact of the
usual institutional and contractual characteristics of jobs on wages. The regressions therefore
also include: a dummy for gender; a quadratic in potential work experience; control variables
for the highest education level achieved; whether the job involves shift work; whether the job
involves supervising or managing others; whether the job is normally done ‘almost
exclusively’ by the opposite gender; whether the job is part-time, or temporary, in the private
17 Of course, in a dynamic environment, the price of slow-to-adjust skills will move above or below their supply price delivering quasi-rent to the holders of any scarce skills. 18 Wages are deflated by the RPI index to 1997 prices, and trimmed by 0.5% at the top of the distribution to remove the impact of extreme outliers. 19 None of the substantive results presented below are sensitive to the omission of this allowance for pension contributions.
20
or public sector; whether the job is located in a firm with more than 25 employees; and 17
industry dummies (1-digit SIC92 classification); and 11 regional dummies.
Column (1) of Table 7 presents the coefficients on all of the generic skills, and on discretion
and variety. For comparison with previous studies, computing skills are represented in this
column by a simple (1,0) computing usage dummy variable. Activities which are associated
with a positive and significant (at 5% or better) impact on pay are high-level communication,
planning, task discretion, variety and computing usage. Given that our measures of skills
(other than computing) have unit variance, and the dependent variable is log wages, the
coefficients represent the proportionate increase in pay for a one standard deviation increase
in each of the measures of skills. Thus, an individual with high-level communication skills
which are one standard deviation above the mean enjoys an 8.5% higher level of rewards than
an individual with the mean level of high-level communication skills in the sample.
Activities which are associated with lower pay are physical skills, numerical skills and client
communication. The negative coefficient on physical skills is perhaps not surprising. A partial
explanation is that many manual skills such as physical stamina have a relatively low (or even
zero) supply price. More importantly, manual activities are negatively correlated with other
observed and unobserved activities which use positively valued skills. That is, where physical
skills are particularly important, workers are typically not using other more highly valued
skills.
That numerical skills attract a (small) negative premium is at first sight surprising, especially
given other evidence which suggests the increasing importance of mathematics skills (Dolton
and Vignoles, 1999) and of cognitive skills (Murnane et al, 1995), of which numerical skills
21
are a crucial and tangible component. The answer to this apparent puzzle lies in the fact that
numerical skills are highly correlated with computing skills and in the substantial positive
impact of computing skills.20 The simple computer usage dummy indicates that computer
users have a 14% pay premium, approximately the same order of magnitude as has been
found in similar studies for other countries.
The coefficients on the control variables conform to our prior expectations. Conditional on
industry and region, pay increases monotonically with the required qualifications to do the
job, and is higher if the job involves shift work, managing or supervising others, if it is
predominantly done by men or located in a larger firm (more than 25 employees). In contrast,
pay is lower if the job is predominantly done by women, or if it is part-time or in the private
sector. There is a concave relationship between pay and experience, with a peak in the age-
earnings profile (evaluated at the sample means) after approximately 30 years of work
experience.
In column (2), we replace the simple computer usage dummy with indicators of the different
levels of computing complexity (‘straightforward’, ‘moderate’, ‘complex’ and ‘advanced’),
the omitted (base) category being those who do not use computers at all as in column (1). It is
found that higher levels of computing complexity are associated with higher wage premia.
The differences between the estimated coefficients for successive levels of complexity are all
highly significant, with the exception of ‘moderate’ usage and ‘complex’ usage which yield a
similar return. This increasing profile of wages with computing complexity suggests that
using a simple (1,0) computer usage dummy to capture any wage effects associated with
20 As shown in Table 2, computing complexity has its highest positive correlation with numerical skills, while computing usage has its second highest positive correlation with
22
computers is likely to be misleading. It is evident, for example, that using a computer for
programming purposes receives a substantively greater premium than using it for sending
email.21 This is plausible and sensible, yet cannot be discerned from previous studies which
have no measure of the complexity with which computers are utilised.
We also investigated at this stage whether the centrality of computers to the job also had an
association with wages. A plausible expectation is that computer usage is likely to be more
highly associated with wages when computers are regarded as ‘essential’ to the job, than
when they are used but seen as ‘not very important’. In a separate analysis (not shown) this
expectation is confirmed. However, the centrality scale of computer usage is extremely highly
correlated with the complexity scale – as shown in Table 2, the Spearman rank correlation
coefficient of the two measures is 0.793. We also therefore investigated whether the centrality
of computer usage had any link with wages after controlling for the complexity level. By
interacting the complexity measure with an indicator of whether computers are regarded as
being of high-importance (‘essential’ or ‘very important’) or low-importance (‘fairly
important’ or ‘not very important’), we can test whether the premium to complexity differs
according to the centrality/importance of usage. An F-test for the equality of the returns to
each of the four levels of complexity according to whether computing has high/low
importance yields an F-statistic of F(4,5127) = 0.67 (p = 0.61), and hence we can conclude
that conditional on complexity of use, the centrality of usage carries no additional premium.
This is further evidence in favour of the importance of assessing the tasks for which
computers are being used in order to estimate the wage premium that accrues to computing –
numerical skills (second to literacy). 21 For example, individuals with the highest level of computing skills (advanced) receive a wage premium for this skill of 24%, which is much greater than those with the most straightforward usage who receive a premium of only 11%.
23
it is not the centrality of computing per se that carries the premium, but rather the nature of
the tasks for which they are used that is important.
Columns (3) and (4) of Table 7 separate male and female employees. The reason for
investigating this split is the possibility that the associations of the skills with wages could
differ according to gender. However, while there is a large unaccounted for difference in pay
between the jobs in which men and women are employed, in general the returns to the various
activities/skills are quite similar.22 The exception is the greater returns to computing
complexity that women receive, although there are rather fewer women than men who work
in jobs which require the highest two levels of complexity. These higher returns to computing
complexity result in the differences between the skills returns for men and women being
(marginally) jointly significant (significant at 10% although not at 5%).23
Differences in the levels and prices of skills contribute to the differences in mean pay of men
and women. A conventional index of discrimination is that part of the gender pay gap that
cannot be attributable to differences in skills. Standard analyses represent skills differences
between men and women in terms of schooling and work experience measures, leaving
unmeasured skills unaccounted for. The generic skills measures available in this study
constitute a substantive proportion of the skills that are unmeasured in conventional studies of
discrimination. Given that the levels of most generic skills differ between men and women, it
is of interest as to whether the measures of generic skills also contribute to the gender pay
22 In a pooled regression, a test of the equality of returns for men and women to the 10 generic skills plus task discretion and variety is not rejected at conventional levels: F(12,5115) = 1.45; p = 0.14. 23 In a pooled regression, a test of the equality of returns for men and women to the 10 generic skills plus task discretion and variety and the 4 levels of computing complexity yields: F(16,5115) = 1.61; p = 0.06.
24
gap, and hence affect the conventional index of discrimination. To investigate this question,
we used the coefficients in columns (3) and (4) of Table 7 to calculate a standard Oaxaca
(1973) decomposition of the gender pay gap. Of the 26 percentage point difference in (log)
pay between men and women (which equates to a 30% raw pay gap), 82% can be attributed to
differences in skills and other attributes such as schooling and experience, while the
remaining 18% results from differences in the rates of return to skills and these other
attributes. Thus our measure of discrimination in pay is ( .18 30% ) 5.4%× = 24 However,
omitting the 16 different measures of skills reduces the proportion of the gap that is
unexplained from 18% to 14%. This finding suggests that it may not be reasonable to attribute
any of the residual pay gap in conventional studies to unobserved skills. If anything, the
additional skills which we have been able to account for work marginally in favour of
females, thereby not reducing but marginally increasing measured discrimination when
generic skills are included.
4.2 Extensions
There are two sets of issues raised by the estimates discussed up to this point. First is the
question as to whether estimates of the values in a cross-section potentially capture treatment
effects, rather than non-causal associations attributable to unobserved variables. Second is the
question as to whether it is ideal to assume, as we have so far, that skill values are uniform
across different segments of the economy.
4.2.1 Establishment Fixed Effects
24 While this is on the low side of recent estimates of the degree of discrimination, we are able to account for a very large number of differences in the jobs that men and women do that contribute to the pay gap, including education, experience, part-time, shift work, industry, region, etc.
25
To several commentators it has seemed unlikely that presenting workers with a computer
should of itself generate higher wages. The suspicion that, rather, higher ability (hence higher
paid) workers were selected for computer usage has been confirmed in previous studies. Thus,
the computer skills premium, though genuine, cannot be used to support a thesis of skill-
biased technological change. Similarly here, the premium for, say, higher-level
communication skills cannot of itself be used to argue that rising demand for communication
skills is likely to change the wage structure. All that can be said is that people with these skills
(and whatever unobserved factors they are proxies for) receive higher pay. Part of the case
against computers having a causal effect has been that computer use dummy variables have
similar effects to the usage of other tools which also showed a return, using German data
(Dinardo and Pischke, 1997). Since the return to these other tools was not plausibly a
treatment effect, one should not accept that computers are either. However, in the data we
have used here we have controlled for a much greater range of job attributes (including the
use of tools and equipment, a component of ‘technical know-how’), and characterised the
complexity of the way in which computers are used. Most of the other skills do not have a
positive association with pay, while more complex computer use does. Moreover, this has
been a period of rapid expansion of computer usage in Britain. Hence, it remains possible that
requiring computer usage in a job may indeed generate higher pay in Britain (ref. Bell?). Such
an effect need not be instantaneous, since transferable computer skills learned on the job
would presumably raise workers’ marginal productivity over time.
Nevertheless, even our greater range of job attributes may not capture all the skills needed in
jobs. One possible source of bias is that jobs requiring more complex computer usage are
likely to be more frequent in establishments where more advanced technology are deployed
(Refs.). Since higher technology firms are known to pay greater wages (Liu et al; other), the
26
complexity measure could be picking up an establishment effect on wages, rather than the
impact of the individual’s job characteristics.25
To investigate this possibility, we include in column (5) of Table 7 a variable which measures
the degree of utilisation of computers at the individuals’ workplace. We use the responses to
the question:
‘In your workplace, what proportion of employees work with computerised or automated equipment?’
to construct a banded measure of firm-level computing (less than 25% of employees, between
25% and 75% of employees, more than 75% of employees). Unfortunately, this question was
only asked in 2001 Skills Survey. As can be seen in column (5), this variable has a monotonic
and significantly positive effect on wages. It also serves to reduce the coefficients on the
individual complexity variables26, suggesting that part of the premium associated with
computer use lies not so much with personal computing skills as with the (technological)
characteristics of the firm. It is possible that an additional part of the premium could be
associated with other, unobserved, firm fixed effects; moreover there remain possible
unobserved individual fixed effects, to which we return shortly.
4.2.2 Skill Values Within Occupations
Implicit in the above analysis is the assumption that all skills and job attributes are valued and
therefore priced identically across all of the economy. Yet we have already seen in Table 3
that there are considerable differences in the mean levels of generic skills across occupation.
25 Entorf et al (1997), however, found little evidence of unobserved firm-level fixed effects in France in the 1980s. CHECK. 26 For the 2001 data, the coefficients on the computing complexity variables excluding the firm-level computing measure are 0.106, 0.170, 0.173 and 0.265 for the four levels of complexity (straightforward, moderate, complex and advanced respectively).
27
Given that an individual’s portfolio of skills cannot be unbundled and sold in different
occupations, it is possible that skills will not be equally valued in all occupations. Even if
unbundling were possible, skill could attain different values in different occupations either as
a quasi-rent owing to fluctuations in demand or more permanently because of market
segmentation. The results in Table 7 can therefore be regarded as indicative of the average
value of skills in the workforce, but a more detailed valuation, obtained by disaggregating by
occupation, is also potentially informative.
The first column of Table 8 replicates the results from Table 7 column (2) for comparison,
while the remaining columns of Table 8 present the same regression separately for each of the
major occupational groups.27 These estimates give, then, for each occupation, the value of
each job skill conditional on being utilised in that occupation.28 A number of features are
evident. First, while literacy skills are negatively valued for managers, they carry a positive
premium for operatives and workers in other elementary occupations where they are used.
However, as shown in Table 3, on average, operatives and, especially, workers in elementary
occupations typically utilise very low level of literacy skills in their jobs. Moreover, it is to be
expected that literacy skills are poorest amongst those in lower level manual occupations. A
possible interpretation therefore is that literacy skills are valued in these occupations because,
although utilised less, they are in scarcer supply. Secondly, physical skills carry a negative
premium in all occupations except elementary occupations where the coefficient is
insignificant. Thus, the negative premium in the overall results is not simply a proxy for
27 There are small cell sizes (5 or fewer individuals) for level 4: advanced computing usage in occupational groups 6, 7, 8 and 9, and also for level 3: complex computing usage in occupational group 9 and hence these are omitted. 28 Because skills affect selection into occupations, the coefficients do not give unbiased estimates of skill values. For example, part of the value of high-level communication skills is
28
occupation. Rather, within each occupation the use of physical skills are likely to suggest low
levels of other unobserved skills. Thirdly, high-level communication skills are rewarded in the
higher occupational classes (managerial, associate professional and clerical) only. Again, we
can interpret this as reflecting the high demand for these skills in higher ranked occupations,
though obviously the association is far from perfect. Fourth, variety is positively valued
within several occupations, but discretion only receives a significant premium for managers
and operatives. Finally, the returns to computing complexity are mainly increasing in
complexity, although for professionals the computing premium does not differ by complexity,
and for associate professionals, the premium is small and insignificant.
That there may be differences in the returns to individuals’ characteristics across sectors
because of the impossibility of renting different skills to different employers has been long
recognised: see, for example, Mandelbrot (1962) and Heckman and Scheinkman (1987). The
latter present empirical evidence that rejects the uniform pricing of individuals’ observed and
unobserved attributes/characteristics in sub-sectors of the US economy. While we do not have
the panel data necessary to implement the type of test developed by Heckman and
Scheinkman, we can formally test the equality of the returns to the observed measures of
skills under consideration in this paper. Table 10 presents the results of the tests for the
equality of the return to each of our measures of skills across the 9 occupation groups for the
pooled data as considered in Table 8. As can be seen, the results here are mixed; some skills
are valued similarly across occupational sectors, while others are valued quite differently. Of
the skills that are positively valued in Table 8, high-level communication, planning and task
likely to derive from being selected into an occupation where that skill is in high demand. There is no sensible way of separately identifying this selection process with the data.
29
variety receive significantly different returns in different sectors while the largest
dissimilarities are for the price/return to computing skills.
Table 9 replicates Table 8 except that it includes the measure of firm-level computing which
is available in 2001 only. Most of the pattern noted above still holds. However, it is apparent
that the premium on individual computing skills for managers and skilled trades workers is
insignificant. Rather, the impact of technology, as captured by the indicator for widespread
computing, is quite large. This finding is consistent with the conjecture of Bresnahan (199?)
that the impact of computing on managers’ skills and wages is to be found, not in individual
computer use, but rather in computers’ interaction with complementary managerial skills
which underpin innovative activities to raise productivity.29
4.2.3 Within-Cohort Estimates
Finally, we return to the issue as to how far the skill valuations observed in cross-sections
represent genuine treatment effects. That is, does the observed return to high-level
communication skills mean that someone acquiring and using these skills can, other things
equal, gain higher pay? Or are these skills just proxies for some other set of abilities that are
in any case receiving a premium? Ideally a panel of individual data would assist us in
resolving this question. Currently, no such panel exists which includes the array of generic
skills measures and our ranked indicators of computer skills.
In its absence, an alternative procedure is feasible, which should generate estimates that are
less precise but less likely to be biased by the presence of unobserved heterogeneity than the
30
conventional cross-section estimates presented above. We calculate the change in average
skills used in a group of similar jobs (for shorthand, a ‘job’) between 1997 and 2001 and use
this as a proxy for the changes in skills of workers doing the same job. Changes in pay can
then be regressed against changes in skills to determine the extent to which increases in pay
are rewards to increases in skills. We define ‘jobs’ by occupation and age and gender. More
precisely, we computed means for our skills for 9 occupation groups × 8 age groups (at
approximately 5 year intervals with an adjustment for the youngest and oldest cohorts of
workers in our sample) × 2 gender groups, for each of the two survey years. Thus, an example
of a cohort would be female sales workers aged between 44 and 48 in 1997 and 48 to 52 in
2001. The 144 ‘jobs’ form the basis for our analysis. This cohort analysis is formally
equivalent to the construction of a pseudo-panel (Deaton, 1985) and requires the assumption
that the workers in the job are similar at both time points. Some of the cell sizes are rather
small, especially for the 1997 survey, and we investigate the sensitivity of our results to
different ways of dealing with these small cell sizes below.
Table 11 presents hedonic wage equation for the change in (log) pay in these jobs between
1997 and 2001. Column (1) includes the changes in the skills between the two surveys, with
computing complexity measured as a simple index (0 denotes ‘computers not used’, through
to 4 for ‘advanced’ usage), together with regional dummies. The constant term indicates that
real wages grew by about 8% over this period. Around 35% of this change can be explained
by changes in skills (plus regional effects), although few of these changes are individually
statistically significant. The most important contributory factors are the increases in high-level
communication skills and computing skills. These are the two skills which had the largest
29 It is notable that high-level communication skills are strongly positively correlated with the proportion of computers at the workplace, and that this correlation is stronger amongst
31
positive premia in the cross-section estimates. The estimates imply that an
occupation/gender/age cohort which moves to acquire and use in their jobs greater amounts of
these skills will gain a genuine wage premium. A tentative conclusion, therefore, is that an
increase in demand for either computing skills or high-level communication skills could have
significant effects on the wage structure. All other skill indicators, however, carry
insignificant coefficients.
Column (2) also includes a number of the control variables that we considered previously in
the pooled regression. Around half of the change in real wages is explained by changes in
skills, education, experience, and the nature of employment (part-time etc). Once again,
computing skills are shown to be important in explaining increases in pay.
While the conclusions from the results presented in Table 11 are necessarily tentative given
the small number of observations per cell and the low degrees of freedom in the regressions,
they are robust to alternative specifications of the regression and to omission of observations
based on only a few individuals - computing skills always remain a significant determinant of
changes in wages over the period under investigation.
5. Conclusion
The findings from the 1997 and the 2001 Skills Surveys suggest that it is feasible to collect
indicators of a considerably wider range of skills than hitherto achieved. One advantage of
this method is that the obtained indicators are available at the cost of sufficient time within a
high quality survey. The disadvantage is that the indicators are derived from job requirements,
managers than among other occupational groups.
32
rather than the individual job-holders’ own skills. The latter can only be measured directly by
a more costly testing process, with evident restrictions on the scope and generality of the
measures obtained. Indeed, another advantage to the job analysis method is that, in addition to
covering a wide range of generic job skills, it is possible in particular to devise richer
indicators of computing skills that can take into account the very different ways that
computers are actually used across jobs. The large number and the richness of the skill
measures, together with many other individual-level and firm-level controls, also go some
way to addressing problems of unobserved heterogeneity that are potentially present in
previous studies. Moreover, by regressing wage changes against changes in skills between the
two comparable surveys, it has been possible to go further in removing unobserved fixed
effects, though at the cost of some precision in the estimates compared to what would be
feasible in a panel.
The analysis has allowed us to address several empirical issues in respect of the British labour
market. Our main findings are:
(a) We have confirmed the findings of case studies, that there is an upward movement in most
generic skills – the exception being physical skills. Computing skills stand out as
expanding rapidly.
(b) Both high-level communication skills and computing skills carry positive wage premia,
controlling for all other indicators of skill, conventional or otherwise. Moreover, the
greater the complexity of computer use, the higher the pay premium.
(c) Over and above the impact of the job-holder’s actual job tasks, the extent to which the
establishment’s work force uses computers raises pay.
(d) Other skills also have significant values in the cross-section estimates, some positive and
some negative. It is possible that in many cases the estimates are just associations, rather
33
than reflecting causal effects. The change-within-cohorts estimates are not precise enough
to suggest that any of these skills have significant causal impacts on pay.
(e) There are significant differences, as one might expect, between the generic skills in jobs
held by men from those held by women. However, these differences do not contribute to
accounting for any of the unexplained gender pay gap that is conventionally attributed to
discrimination.
These findings confirm the need for policy in the current era to focus on ensuring that there
are sufficient ongoing supplies of computing and high-level communication skills. The
limitations of the current study also merit addressing in future research. One issue is that the
impact of skills mismatches has been largely ignored. In ongoing work, the relation between
skill under-utilisation and skill over-utilisation is being investigated. Second, the causal
relationship between generic skills and the wage structure will only receive further elucidation
as it becomes possible to collect ongoing data at regular intervals.
34
REFERENCES Appelbaum, E., T. Bailey and A. L. Kalleberg (2000). Manufacturing Advantage: Why High-
Performance Work Systems Pay Off. Ithaca and London, Cornell University Press.
Ashton, D., B. Davies, A. Felstead and F. Green (1999). Work Skills In Britain. Oxford, SKOPE, Oxford and Warwick Universities.
Borghans, L., F. Green and K. Mayhew (2001). “Skills measurement and economic analysis: an introduction.” Oxford Economic Papers 53 (3): 375-384.
Braverman, H. (1974). Labor and Monopoly Capital. New York: Monthly Review Press.
Cappelli, P. (1993). “Are Skill Requirements Rising? Evidence from Production and Clerical Jobs.” Industrial and Labor Relations Review 46 (3): 515-530.
Cappelli, P. and N. Rogovsky (1994). “New work systems and skill requirements.” International Labour Review 133 (2): 205-220.
Cattell, R. B. (1966). “The Scree Test for the Number of Factors”, Multivariate Behavioural Research 1: 245-276.
Darrah, C. N. (1996). Learning and Work: An Exploration in Industrial Ethnography. New York, Garland Publishing.
Deaton, A. (1985), “Panel Data from a Time-series of Cross-sections”, Journal of Econometrics 30: 109-126.
DiNardo, J. E. and J. S. Pischke (1997). “The returns to computer use revisited: have pencils changed the wage structure too?.” Quarterly Journal of Economics CXIII (1): 291-304.
Dolton, P. and A. Vignoles (1999). The Case for Reforming A-levels, Discussion Paper No. 422, Centre for Economic Performance, London School of Economics.
Entorf, H. and F. Kramarz (1997). “Does unmeasured ability explain the higher wages of new technology workers?” European Economic Review 41 (8): 1489-1509.
Entorf, H., M. Gollac and F. Kramarz (1999). “New Technologies, Wages, and Worker Selection.” Journal of Labor Economics 17 (3): 464-491.
Felstead A., D. Gallie and F. Green (2002). Work Skills in Britain, 1986-2001, Department for Education and Skills.
Freeman, R. and R. Schettkat (2001). “Skill Compression, Wage Differentials and Employment: Germany vs the US.” Oxford Economic Papers 53 (3): 582-603.
Friedman, A. L. (1977). Industry and Labour. London: Macmillan.
Green, F., S. McIntosh and A. Vignoles (2002). “The utilisation of education and skills. Evidence from Britain.” The Manchester School of Economic and Social Studies, forthcoming.
Haisken-DeNew, J. P. and C. M. Schmidt (1999). Money for Nothing and Your Chips for Free? The Anatomy of the PC Wage Differential, Discussion Paper No. 178, Deutches Institut fur Wirtschaftsforschung, Berlin.
Heckman, J. and J. Scheinkman (1987). “The Importance of Bundling in a Gorman-Lancaster Model of Earnings.” Review of Economic Studies 54(2): 243-255.
Krueger, A. B. (1993). “How computers have changed the wage structure - evidence from microdata, 1984-1989.” Quarterly Journal of Economics CVIII (1): 33-60.
35
Lawley, D. N. and A. E. Maxwell (1971). Factor Analysis as a Statistical Method, 2nd edition, London: Butterworths.
Lucas, R. E. B. (1977). “Hedonic Wage Equations and Psychic Wages in the Returns to Schooling.” American Economic Review 67 (September): 549-558.
Mandelbrot, B. (1962). “Paretian Distributions and Income Maximisation”. Quarterly Journal of Economics 76: 57-85.
McNabb, R. (1989). “Compensating Wage Differentials: Some Evidence for Britain.” Oxford Economic Papers 41: 327-338.
Murnane, R. J., J. B. Willet and F. Levy (1995). “The growing importance of cognitive skills in wage determination.” Review of Economics and Statistics 77: 251-266.
Oaxaca, R. (1973). “Male-Female Wage Differentials in Urban Labour Markets.” International Economic Review, 14: 693-709.
OECD and Statistics Canada (1995). Literacy, Economy and Society, Results of the First International Adult Literacy Survey. Paris and Ottawa, OECD.
OECD, Human Resources Development Canada and Statistics Canada (1997). Literacy Skills for the Knowledge Society - Further Results from the International Adult Literacy Survey. Paris, OECD.
O’Shaughnessy, K. C., D. I. Levine and P. Cappelli (2001). “Changes in managerial pay structures 1986–1992 and rising returns to skill.” Oxford Economic Papers 53 (3): 482-507.
Spenner, K. I. (1990). “Skill. Meanings, Methods, Measures.” Work and Occupations 17 (4): 399-421.
Tatsuoka, M. M. and P. R. Lohnes (1988). Multivariate Analysis: Techniques for Educational and Psychological Research, 2nd edition, New York: Macmillan.
Thompson, P., T. Wallace, G. Flecker and R. Ahlstrand (1995). “It ain’t what you do, it’s the way that you do it: production organisation and skill utilisation in commercial vehicles.” Work, Employment and Society 9 (4): 719-742.
Thurstone, L. L. (1947). Multiple Factor Analysis, Chicago: University of Chicago Press.
36
Table 1
Factor Loading Coefficients based on Rotated Factors
factors: factor1 factor2 factor3 factor4 factor5 factor6 factor7 factor8 factor9 factor10 activity:
1detail 0.03 -0.10 0.00 -0.15 0.11 -0.11 0.03 0.12 -0.03 0.26 2people 0.06 -0.04 0.03 0.06 0.02 -0.09 0.55 0.12 0.03 -0.06 3teach -0.04 0.11 0.01 0.03 -0.36 0.06 0.07 0.45 -0.08 -0.01 4speech 0.10 0.00 0.04 0.06 -0.65 -0.01 0.16 0.04 0.08 0.03 5persuad -0.01 0.05 0.00 0.09 -0.48 -0.07 0.31 0.08 -0.05 0.03 6selling -0.15 0.06 -0.11 -0.11 -0.20 0.12 0.69 -0.21 0.05 0.08 7caring 0.14 0.05 0.07 0.03 -0.11 0.06 0.61 0.04 0.01 -0.02 8teamwk -0.04 -0.03 -0.01 -0.02 -0.06 0.12 -0.07 0.81 0.07 0.02 9listen 0.04 -0.09 0.01 -0.05 0.01 0.05 -0.03 0.73 0.02 0.00
10strengt 0.02 0.80 0.01 -0.07 0.01 0.02 0.04 -0.05 -0.04 -0.02 11stamina 0.02 0.80 0.03 -0.05 -0.06 -0.06 0.07 -0.03 0.01 0.01 12hands -0.03 0.38 0.03 -0.53 0.05 0.04 -0.11 0.03 0.04 0.04 13tools -0.02 0.21 0.01 -0.65 0.10 0.03 -0.13 0.08 0.05 -0.02 14product -0.04 -0.03 -0.05 -0.55 0.04 0.02 0.39 -0.06 0.00 -0.02 15special 0.10 -0.13 0.05 -0.41 -0.12 -0.17 0.11 0.01 -0.12 -0.09 16orgwork 0.13 -0.10 0.01 -0.09 0.03 -0.09 0.20 0.23 -0.07 -0.01 17faults 0.01 0.04 -0.01 0.02 0.13 0.09 -0.04 0.03 -0.77 0.16 18cause -0.04 0.01 -0.02 0.03 0.04 0.05 -0.04 -0.03 -1.00 -0.01 19solution 0.02 -0.02 0.01 0.01 -0.07 -0.07 0.01 -0.08 -0.83 -0.04 20analyse 0.14 -0.07 0.00 -0.13 -0.39 -0.06 -0.06 -0.04 -0.26 0.03 21noerror 0.02 -0.01 0.00 0.01 -0.07 0.00 0.00 -0.01 -0.02 0.83 22mistake -0.01 0.01 0.01 0.04 -0.03 -0.03 0.01 0.02 -0.04 0.83 23planme -0.03 0.01 -0.01 0.02 -0.06 -0.90 -0.05 -0.11 0.01 0.01 24planoth -0.05 0.14 -0.08 0.10 -0.36 -0.27 -0.04 0.30 -0.04 -0.04 25mytime -0.02 -0.03 0.01 0.01 0.00 -0.92 -0.04 -0.09 0.06 0.02 26ahead 0.06 0.06 -0.03 -0.03 0.04 -0.72 -0.01 0.05 -0.01 -0.01 27read 0.75 0.10 -0.05 -0.01 0.26 -0.06 0.04 0.05 -0.01 0.03 28short 0.82 -0.05 0.00 0.00 0.10 -0.01 0.01 0.07 -0.01 -0.02 29long 0.74 -0.02 0.04 -0.09 -0.26 0.05 -0.02 -0.03 0.01 -0.02 30write 0.82 0.13 -0.05 0.06 -0.02 0.06 0.04 -0.04 0.00 0.01 31writesh 0.76 -0.03 0.00 0.09 -0.25 -0.01 -0.03 -0.06 -0.02 0.00 32writelg 0.57 -0.07 0.03 0.00 -0.50 0.01 -0.08 -0.08 0.10 0.06 33calca -0.01 0.03 -0.84 0.05 0.15 -0.03 0.11 -0.01 -0.03 0.03 34percent 0.01 -0.04 -0.87 0.00 0.01 -0.02 -0.01 0.00 -0.02 -0.03 35stats 0.07 -0.03 -0.62 -0.09 -0.23 0.06 -0.14 0.04 0.05 -0.02
taxo
nom
y of
ge
neric
skill
s:
liter
acy
skill
s
phys
ical
skill
s
num
ber s
kills
tech
nica
l kn
ow-h
ow
high
-leve
l co
mm
unic
atio
n
plan
ning
skill
s
clie
nt
com
mun
icat
ion
horiz
onta
l co
mm
unic
atio
n
prob
lem
-sol
ving
chec
king
skill
s
Notes: 1. Source: Skills Survey 1997 and 2001. 2. For a full description of activities, see Appendix Table A1. 3. Factor loading coefficients greater than 0.4 in magnitude are shown in bold. 4. Analysis is based on 6936 pooled observations from the Skills Surveys of 1997 and 2001.
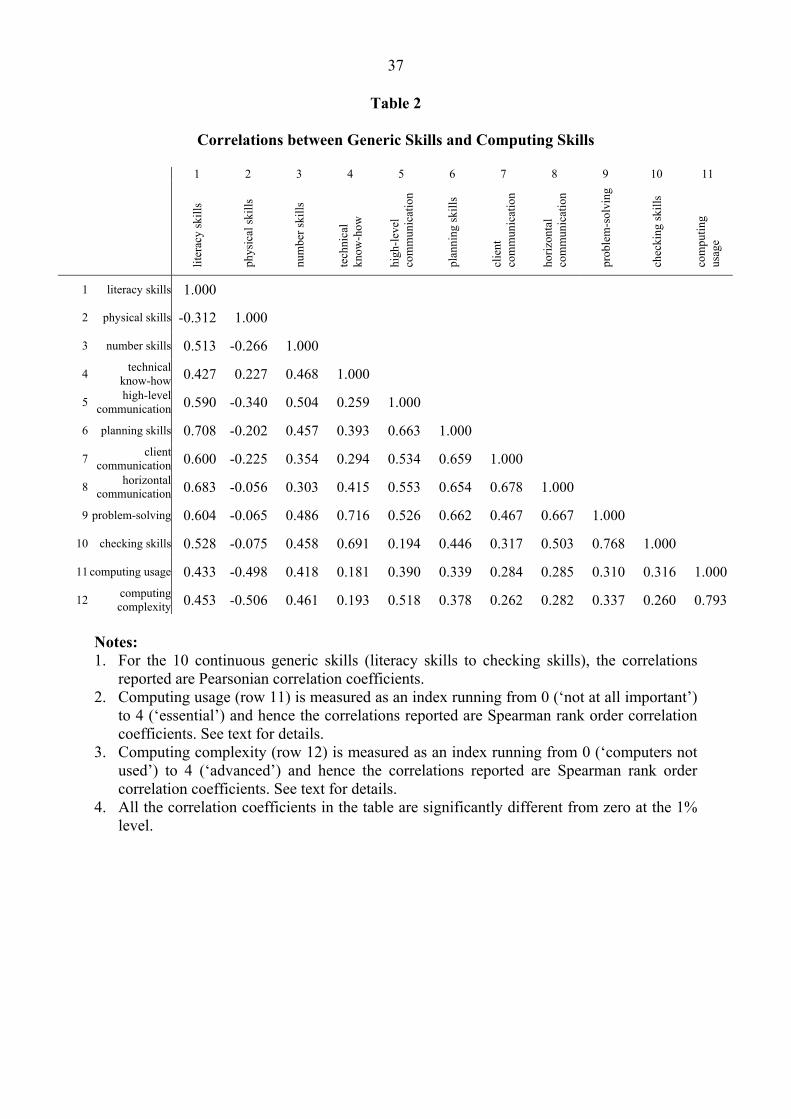
37
Table 2
Correlations between Generic Skills and Computing Skills
1 2 3 4 5 6 7 8 9 10 11
liter
acy
skill
s
phys
ical
skill
s
num
ber s
kills
tech
nica
l kn
ow-h
ow
high
-leve
l co
mm
unic
atio
n
plan
ning
skill
s
clie
nt
com
mun
icat
ion
horiz
onta
l co
mm
unic
atio
n
prob
lem
-sol
ving
chec
king
skill
s
com
putin
g us
age
1 literacy skills 1.000
2 physical skills -0.312 1.000
3 number skills 0.513 -0.266 1.000
4 technical know-how 0.427 0.227 0.468 1.000
5 high-level communication 0.590 -0.340 0.504 0.259 1.000
6 planning skills 0.708 -0.202 0.457 0.393 0.663 1.000
7 client communication 0.600 -0.225 0.354 0.294 0.534 0.659 1.000
8 horizontal communication 0.683 -0.056 0.303 0.415 0.553 0.654 0.678 1.000
9 problem-solving 0.604 -0.065 0.486 0.716 0.526 0.662 0.467 0.667 1.000
10 checking skills 0.528 -0.075 0.458 0.691 0.194 0.446 0.317 0.503 0.768 1.000
11 computing usage 0.433 -0.498 0.418 0.181 0.390 0.339 0.284 0.285 0.310 0.316 1.000
12 computing complexity 0.453 -0.506 0.461 0.193 0.518 0.378 0.262 0.282 0.337 0.260 0.793
Notes: 1. For the 10 continuous generic skills (literacy skills to checking skills), the correlations
reported are Pearsonian correlation coefficients. 2. Computing usage (row 11) is measured as an index running from 0 (‘not at all important’)
to 4 (‘essential’) and hence the correlations reported are Spearman rank order correlation coefficients. See text for details.
3. Computing complexity (row 12) is measured as an index running from 0 (‘computers not used’) to 4 (‘advanced’) and hence the correlations reported are Spearman rank order correlation coefficients. See text for details.
4. All the correlation coefficients in the table are significantly different from zero at the 1% level.
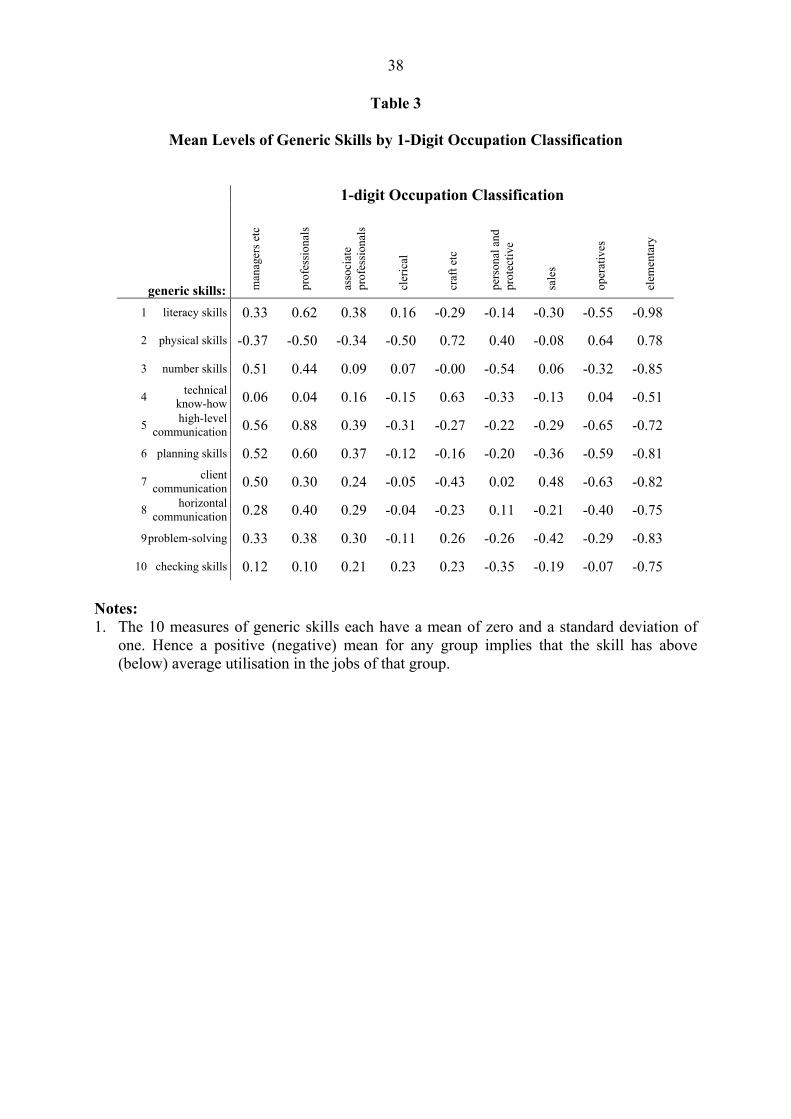
38
Table 3
Mean Levels of Generic Skills by 1-Digit Occupation Classification
1-digit Occupation Classification
generic skills: man
ager
s etc
prof
essi
onal
s
asso
ciat
e pr
ofes
sion
als
cler
ical
craf
t etc
pers
onal
and
pr
otec
tive
sale
s
oper
ativ
es
elem
enta
ry
1 literacy skills 0.33 0.62 0.38 0.16 -0.29 -0.14 -0.30 -0.55 -0.98
2 physical skills -0.37 -0.50 -0.34 -0.50 0.72 0.40 -0.08 0.64 0.78
3 number skills 0.51 0.44 0.09 0.07 -0.00 -0.54 0.06 -0.32 -0.85
4 technical know-how 0.06 0.04 0.16 -0.15 0.63 -0.33 -0.13 0.04 -0.51
5 high-level communication 0.56 0.88 0.39 -0.31 -0.27 -0.22 -0.29 -0.65 -0.72
6 planning skills 0.52 0.60 0.37 -0.12 -0.16 -0.20 -0.36 -0.59 -0.81
7 client communication 0.50 0.30 0.24 -0.05 -0.43 0.02 0.48 -0.63 -0.82
8 horizontal communication 0.28 0.40 0.29 -0.04 -0.23 0.11 -0.21 -0.40 -0.75
9 problem-solving 0.33 0.38 0.30 -0.11 0.26 -0.26 -0.42 -0.29 -0.83
10 checking skills 0.12 0.10 0.21 0.23 0.23 -0.35 -0.19 -0.07 -0.75 Notes: 1. The 10 measures of generic skills each have a mean of zero and a standard deviation of
one. Hence a positive (negative) mean for any group implies that the skill has above (below) average utilisation in the jobs of that group.
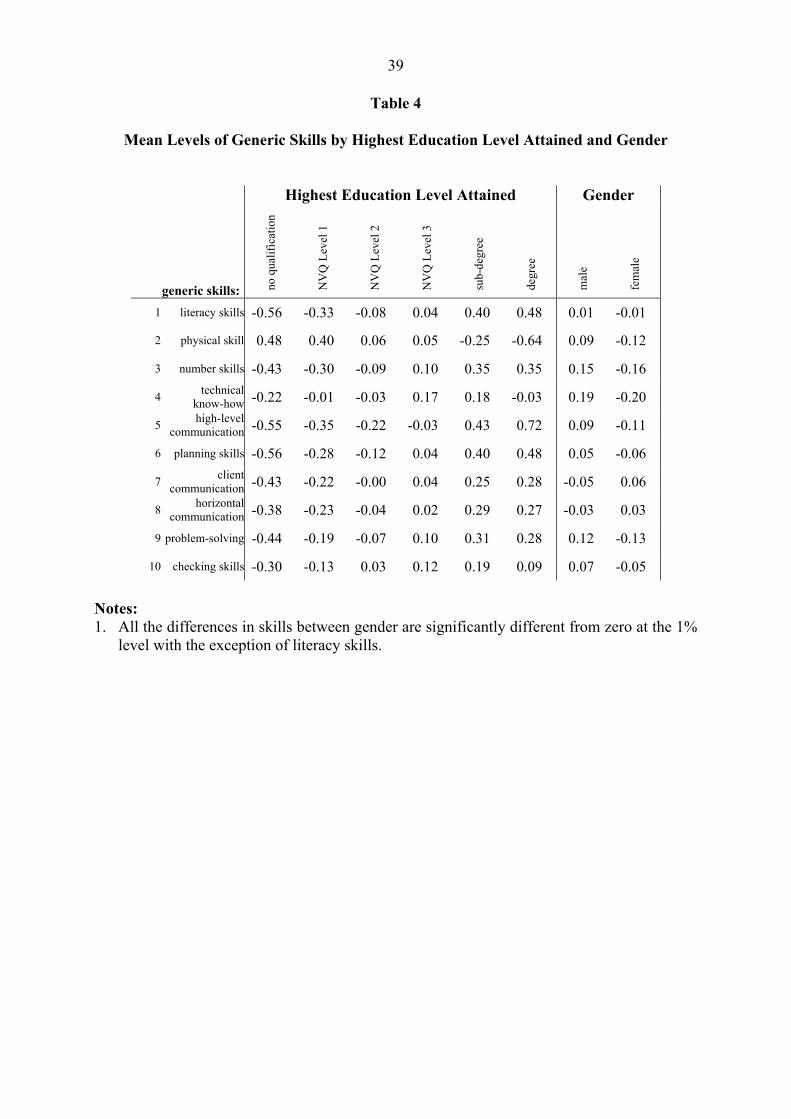
39
Table 4
Mean Levels of Generic Skills by Highest Education Level Attained and Gender
Highest Education Level Attained Gender
generic skills: no q
ualif
icat
ion
NV
Q L
evel
1
NV
Q L
evel
2
NV
Q L
evel
3
sub-
degr
ee
degr
ee
mal
e
fem
ale
1 literacy skills -0.56 -0.33 -0.08 0.04 0.40 0.48 0.01 -0.01
2 physical skill 0.48 0.40 0.06 0.05 -0.25 -0.64 0.09 -0.12
3 number skills -0.43 -0.30 -0.09 0.10 0.35 0.35 0.15 -0.16
4 technicalknow-how -0.22 -0.01 -0.03 0.17 0.18 -0.03 0.19 -0.20
5 high-levelcommunication -0.55 -0.35 -0.22 -0.03 0.43 0.72 0.09 -0.11
6 planning skills -0.56 -0.28 -0.12 0.04 0.40 0.48 0.05 -0.06
7 clientcommunication -0.43 -0.22 -0.00 0.04 0.25 0.28 -0.05 0.06
8 horizontalcommunication -0.38 -0.23 -0.04 0.02 0.29 0.27 -0.03 0.03
9 problem-solving -0.44 -0.19 -0.07 0.10 0.31 0.28 0.12 -0.13
10 checking skills -0.30 -0.13 0.03 0.12 0.19 0.09 0.07 -0.05 Notes: 1. All the differences in skills between gender are significantly different from zero at the 1%
level with the exception of literacy skills.
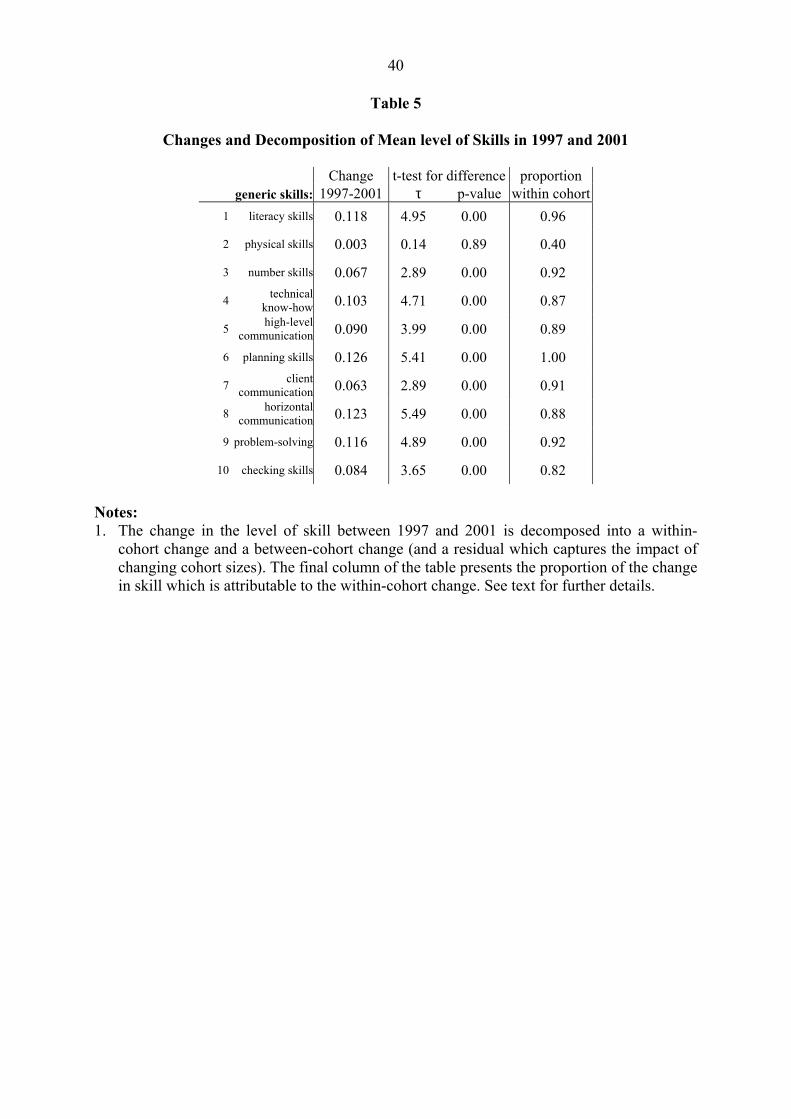
40
Table 5
Changes and Decomposition of Mean level of Skills in 1997 and 2001
Change t-test for difference proportion generic skills: 1997-2001 τ p-value within cohort
1 literacy skills 0.118 4.95 0.00 0.96
2 physical skills 0.003 0.14 0.89 0.40
3 number skills 0.067 2.89 0.00 0.92
4 technicalknow-how 0.103 4.71 0.00 0.87
5 high-levelcommunication 0.090 3.99 0.00 0.89
6 planning skills 0.126 5.41 0.00 1.00
7 clientcommunication 0.063 2.89 0.00 0.91
8 horizontalcommunication 0.123 5.49 0.00 0.88
9 problem-solving 0.116 4.89 0.00 0.92
10 checking skills 0.084 3.65 0.00 0.82 Notes: 1. The change in the level of skill between 1997 and 2001 is decomposed into a within-
cohort change and a between-cohort change (and a residual which captures the impact of changing cohort sizes). The final column of the table presents the proportion of the change in skill which is attributable to the within-cohort change. See text for further details.
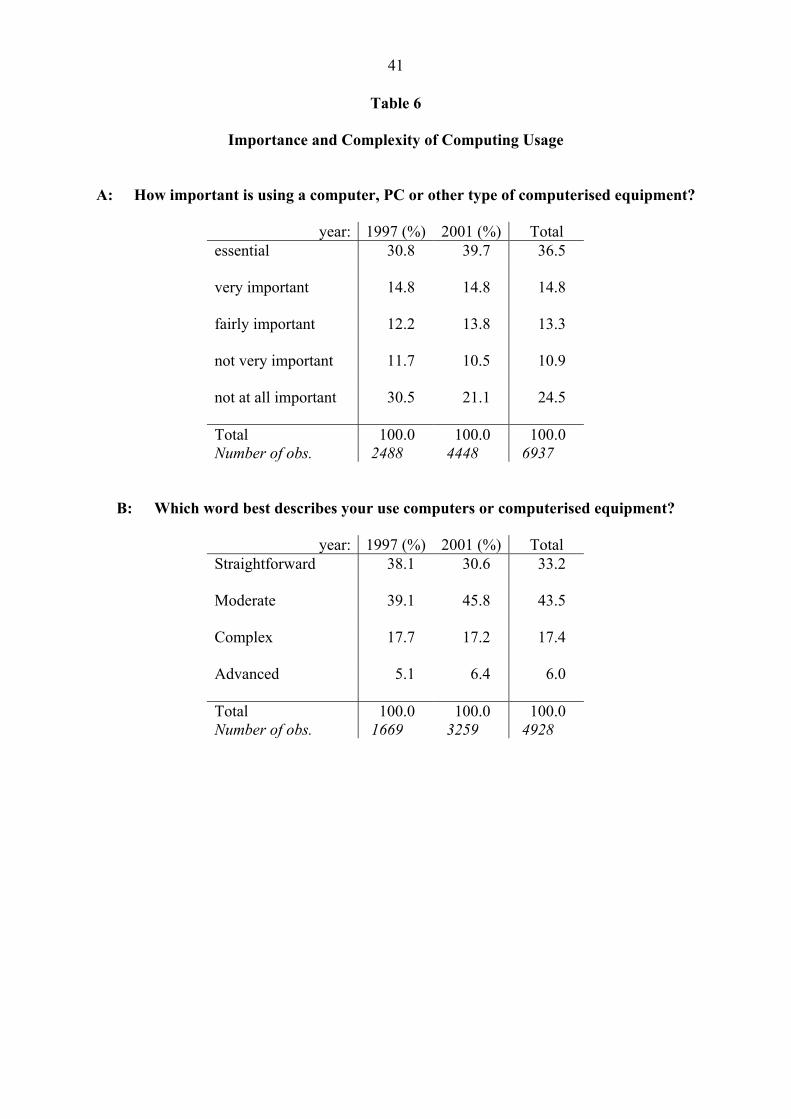
41
Table 6
Importance and Complexity of Computing Usage A: How important is using a computer, PC or other type of computerised equipment?
year: 1997 (%) 2001 (%) Total essential 30.8 39.7 36.5 very important 14.8 14.8 14.8 fairly important 12.2 13.8 13.3 not very important 11.7 10.5 10.9 not at all important 30.5 21.1 24.5 Total 100.0 100.0 100.0 Number of obs. 2488 4448 6937
B: Which word best describes your use computers or computerised equipment?
year: 1997 (%) 2001 (%) Total Straightforward 38.1 30.6 33.2 Moderate 39.1 45.8 43.5 Complex 17.7 17.2 17.4 Advanced 5.1 6.4 6.0 Total 100.0 100.0 100.0 Number of obs. 1669 3259 4928

42
Table 7
Estimates of Hedonic Wage Equations: Skills Activities plus Other Controls
(1) (2) (3) (4) (5) 1997 & 2001 1997 & 2001 1997 & 2001 1997 & 2001 2001 only All
employees All
employees Male
employees Female
employees All
employees literacy skills -0.002 -0.002 -0.008 0.003 -0.009 (0.009) (0.009) (0.013) (0.012) (0.011) physical skills -0.094 -0.085 -0.102 -0.069 -0.081 (0.008)*** (0.008)*** (0.012)*** (0.010)*** (0.010)*** number skills -0.022 -0.024 -0.027 -0.020 -0.011 (0.007)*** (0.007)*** (0.011)** (0.009)** (0.009) technical know-how 0.018 0.013 0.019 0.006 0.002 (0.010)* (0.010) (0.015) (0.012) (0.012) high-level 0.085 0.079 0.085 0.077 0.089 communication (0.009)*** (0.009)*** (0.015)*** (0.012)*** (0.012)*** planning skills 0.051 0.049 0.036 0.052 0.050 (0.009)*** (0.009)*** (0.015)** (0.012)*** (0.012)*** client communication -0.062 -0.056 -0.063 -0.034 -0.050 (0.009)*** (0.009)*** (0.014)*** (0.012)*** (0.012)*** horizontal 0.021 0.019 0.030 -0.002 0.009 communication (0.011)* (0.011)* (0.017)* (0.015) (0.015) problem-solving -0.009 -0.007 -0.006 -0.005 -0.008 (0.011) (0.011) (0.018) (0.014) (0.015) checking skills -0.001 -0.001 0.006 -0.002 -0.011 (0.010) (0.010) (0.015) (0.012) (0.013) discretion 0.014 0.013 0.020 0.004 0.015 (0.006)** (0.006)** (0.009)** (0.008) (0.008)** variety 0.043 0.042 0.044 0.035 0.046 (0.005)*** (0.005)*** (0.008)*** (0.007)*** (0.007)*** computing usage$ 0.136 - - - - (0.014)*** computing complexity $ - 0.113 0.090 0.115 0.076 level 1: straightforward (0.014)*** (0.022)*** (0.019)*** (0.020)*** computing complexity$ - 0.171 0.144 0.193 0.131 level 2: moderate (0.016)*** (0.024)*** (0.021)*** (0.022)*** computing complexity$ - 0.169 0.167 0.174 0.128 level 3: complex (0.020)*** (0.028)*** (0.028)*** (0.027)*** computing complexity$ - 0.244 0.204 0.299 0.213 level 4: advanced (0.028)*** (0.036)*** (0.049)*** (0.035)*** firm-level computing$ - - - - 0.046 level 2: 25-75% (0.018)*** firm-level computing$ - - - - 0.101 level 3: more than 75% (0.018)*** constant 1.391 1.238 1.249 1.430 1.258 (0.062)*** (0.062)*** (0.084)*** (0.094)*** (0.084)*** Number of observations 5191 5191 2592 2599 3294 R-squared 0.60 0.60 0.56 0.62 0.60

43
Notes: 1. All regressions in Table 7 also include: a dummy for gender; a quadratic in potential work
experience; control variables for highest education level achieved (5); whether the job involves shift work (1), or supervising or managing others (2); whether the job is normally done ‘almost exclusively’ by the opposite gender (2); whether the job is part-time (1), or temporary (1), or in the private or public sector (1); whether the job is located in a firm with more than 25 employees (1); 17 industry dummies (1-digit SIC92 classification); and 11 regional dummies.
2. Standard errors in parentheses; $ denotes dummy variable. 3. * denotes significant at 10%; ** denotes significant at 5%; *** denotes significant at 1%.
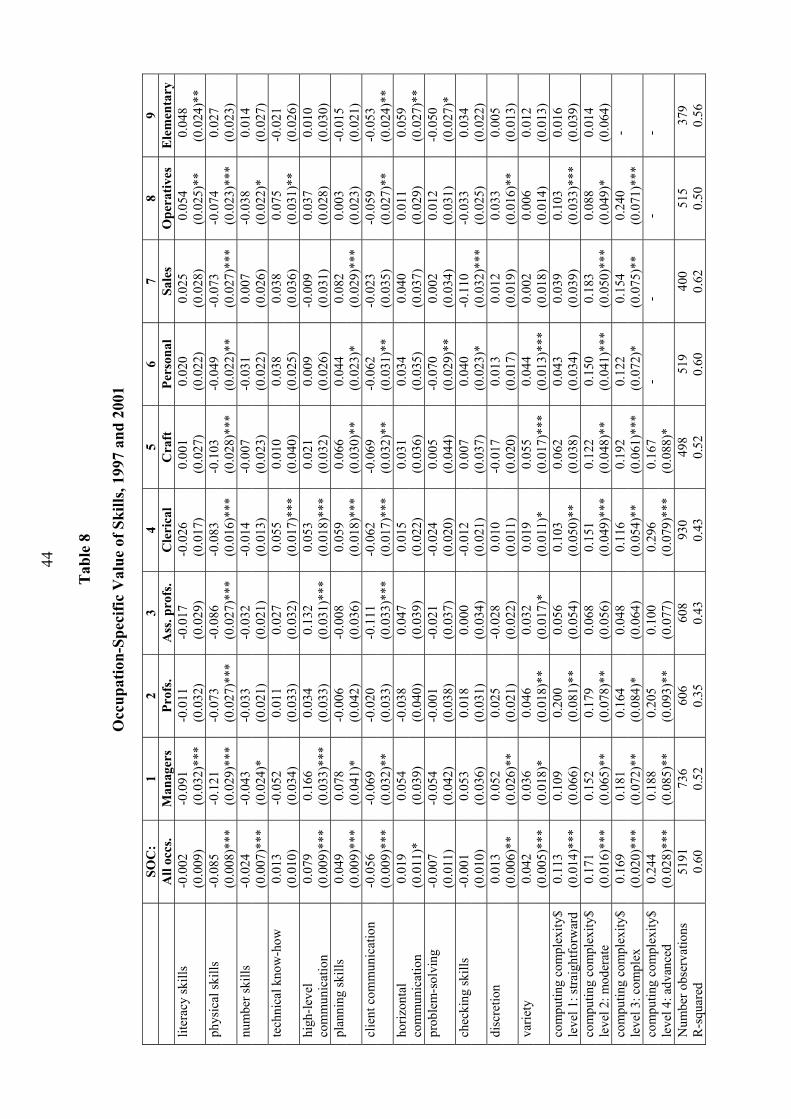
44
T
able
8
O
ccup
atio
n-Sp
ecifi
c V
alue
of S
kills
, 199
7 an
d 20
01
SO
C:
12
34
56
78
9
All
occs
. M
anag
ers
Prof
s. A
ss. p
rofs
. C
leri
cal
Cra
ftPe
rson
alSa
les
Ope
rativ
es
Ele
men
tary
liter
acy
skill
s
-0
.002
-0.0
91-0
.011
-0.0
17-0
.026
0.00
10.
020
0.02
50.
054
0.04
8
(0.0
09)
(0
.032
)***
(0.0
32)
(0.0
29)
(0.0
17)
(0.0
27)
(0.0
22)
(0.0
28)
(0.0
25)*
*(0
.024
)**
phys
ical
skill
s
-0.0
85-0
.121
-0
.073
-0.0
86-0
.083
-0.1
03-0
.049
-0.0
73-0
.074
0.02
7
(0.0
08)*
**
(0
.029
)***
(0.0
27)*
**(0
.027
)***
(0.0
16)*
**(0
.028
)***
(0.0
22)*
*(0
.027
)***
(0.0
23)*
**(0
.023
)nu
mbe
r ski
lls
-0.0
24
-0.0
43
-0.0
33
-0.0
32
-0.0
14
-0.0
07
-0.0
310.
007
-0.0
38
0.01
4
(0.0
07)*
**
(0
.024
)*(0
.021
)(0
.021
)(0
.013
)(0
.023
)(0
.022
)(0
.026
)(0
.022
)*(0
.027
)te
chni
cal k
now
-how
0.01
3 -0
.052
0.01
10.
027
0.05
50.
010
0.03
80.
038
0.07
5-0
.021
(0
.010
)
(0.0
34)
(0.0
33)
(0.0
32)
(0.0
17)*
**(0
.040
)(0
.025
)(0
.036
)(0
.031
)**
(0.0
26)
high
-leve
l
0.07
90.
166
0.03
40.
132
0.05
3 0.
021
0.00
9-0
.009
0.03
70.
010
com
mun
icat
ion
(0.0
09)*
**
(0.0
33)*
**
(0.0
33)
(0.0
31)*
**(0
.018
)***
(0.0
32)
(0.0
26)
(0.0
31)
(0.0
28)
(0.0
30)
plan
ning
skill
s
0.
049
0.07
8 -0
.006
-0.0
08
0.05
9 0.
066
0.04
40.
082
0.00
3-0
.015
(0
.009
)***
(0.0
41)*
(0.0
42)
(0.0
36)
(0.0
18)*
**(0
.030
)**
(0.0
23)*
(0.0
29)*
**(0
.023
)(0
.021
)cl
ient
com
mun
icat
ion
-0
.056
-0
.069
-0.0
20-0
.111
-0.0
62
-0.0
69-0
.062
-0.0
23
-0.0
59-0
.053
(0
.009
)***
(0.0
32)*
*(0
.033
)(0
.033
)***
(0.0
17)*
**(0
.032
)**
(0.0
31)*
*(0
.035
)(0
.027
)**
(0.0
24)*
*ho
rizon
tal
0.
019
0.05
4-0
.038
0.04
7 0.
015
0.03
10.
034
0.04
00.
011
0.05
9co
mm
unic
atio
n
(0
.011
)*(0
.039
)(0
.040
)(0
.039
)(0
.022
)(0
.036
)(0
.035
)(0
.037
)(0
.029
)(0
.027
)**
prob
lem
-sol
ving
-0
.007
-0.0
54-0
.001
-0.0
21-0
.024
0.00
5-0
.070
0.00
20.
012
-0.0
50
(0.0
11)
(0
.042
)(0
.038
)(0
.037
)(0
.020
)(0
.044
)(0
.029
)**
(0.0
34)
(0.0
31)
(0.0
27)*
chec
king
skill
s
-0
.001
0.05
30.
018
0.00
0-0
.012
0.00
70.
040
-0.1
10-0
.033
0.03
4
(0.0
10)
(0
.036
)(0
.031
)(0
.034
)(0
.021
)(0
.037
)(0
.023
)*(0
.032
)***
(0.0
25)
(0.0
22)
disc
retio
n
0.01
30.
052
0.02
5-0
.028
0.01
0-0
.017
0.01
30.
012
0.03
30.
005
(0
.006
)**
(0
.026
)**
(0.0
21)
(0.0
22)
(0.0
11)
(0.0
20)
(0.0
17)
(0.0
19)
(0.0
16)*
*(0
.013
)va
riety
0.
042
0.03
60.
046
0.03
20.
019
0.05
50.
044
0.00
20.
006
0.01
2
(0
.005
)***
(0.0
18)*
(0
.018
)**
(0.0
17)*
(0
.011
)*(0
.017
)***
(0.0
13)*
**(0
.018
)(0
.014
)(0
.013
)co
mpu
ting
com
plex
ity$
0.11
3 0.
109
0.20
00.
056
0.10
30.
062
0.04
3 0.
039
0.10
30.
016
leve
l 1: s
traig
htfo
rwar
d (0
.014
)***
(0
.066
) (0
.081
)**
(0.0
54)
(0.0
50)*
*(0
.038
)(0
.034
)(0
.039
)(0
.033
)***
(0.0
39)
com
putin
g co
mpl
exity
$ 0.
171
0.15
2
0.17
90.
068
0.15
10.
122
0.15
00.
183
0.08
8 0.
014
leve
l 2: m
oder
ate
(0.0
16)*
**
(0.0
65)*
* (0
.078
)**
(0.0
56)
(0.0
49)*
**
(0
.048
)**
(0.0
41)*
**(0
.050
)***
(0.0
49)*
(0.0
64)
com
putin
g co
mpl
exity
$ 0.
169
0.18
1
0.
164
0.04
80.
116
0.19
20.
122
0.15
4 0.
240
- le
vel 3
: com
plex
(0
.020
)***
(0
.072
)**
(0.0
84)*
(0
.064
) (0
.054
)**
(0
.061
)***
(0.0
72)*
(0.0
75)*
*(0
.071
)***
com
putin
g co
mpl
exity
$ 0.
244
0.18
8
0.
205
0.10
00.
296
0.16
7 -
- -
-le
vel 4
: adv
ance
d (0
.028
)***
(0
.085
)**
(0.0
93)*
* (0
.077
)
(0.0
79)*
**
(0.0
88)*
Num
ber o
bser
vatio
ns
5191
736
606
608
930
498
519
400
515
379
R-s
quar
ed
0.60
0.52
0.35
0.43
0.43
0.52
0.60
0.62
0.50
0.56
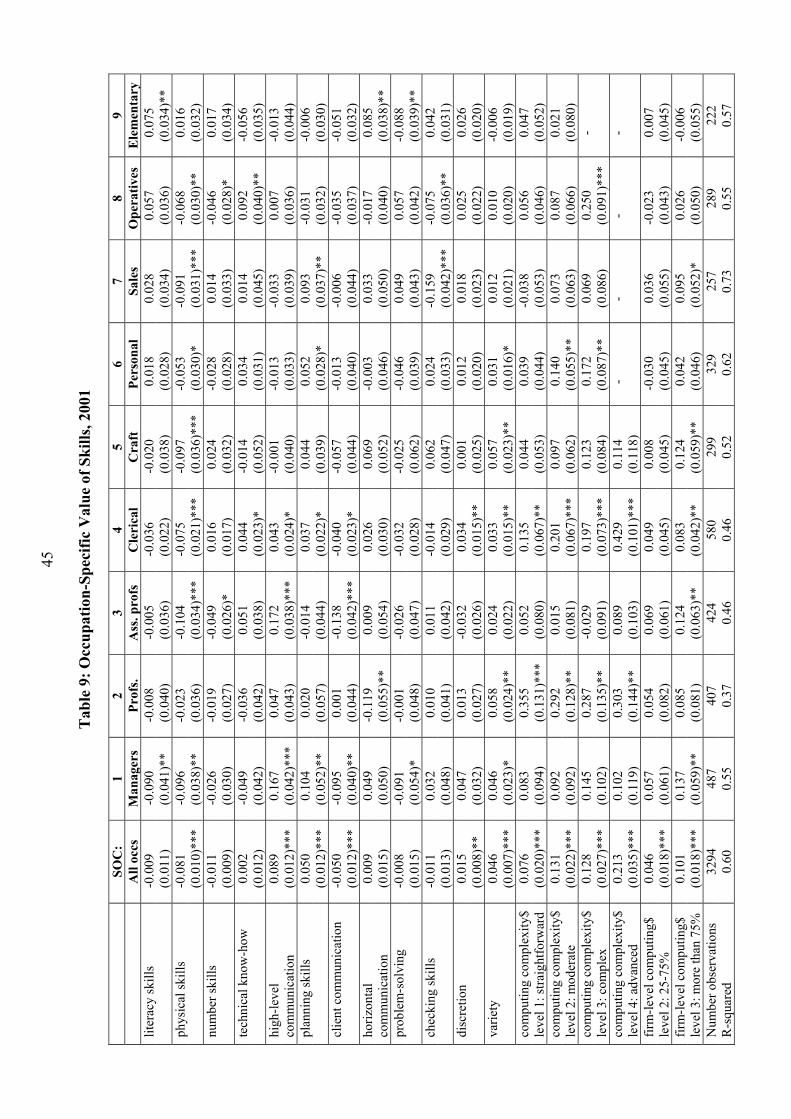
45
T
able
9: O
ccup
atio
n-Sp
ecifi
c V
alue
of S
kills
, 200
1
SOC
:1
23
45
67
89
A
ll oc
cs
Man
ager
s Pr
ofs.
Ass
. pro
fs
Cle
rica
l
C
raft
Pers
onal
Sale
sO
pera
tives
E
lem
enta
rylit
erac
y sk
ills
-0.0
09-0
.090
-0.0
08-0
.005
-0.0
36-0
.020
0.01
80.
028
0.05
7 0.
075
(0
.011
)
(0.0
41)*
*(0
.040
)(0
.036
)(0
.022
)(0
.038
)(0
.028
)(0
.034
)(0
.036
)(0
.034
)**
phys
ical
skill
s
-0
.081
-0.0
96-0
.023
-0.1
04-0
.075
-0.0
97-0
.053
-0.0
91-0
.068
0.01
6
(0.0
10)*
**
(0
.038
)**
(0.0
36)
(0.0
34)*
**(0
.021
)***
(0.0
36)*
**(0
.030
)*(0
.031
)***
(0.0
30)*
*(0
.032
)nu
mbe
r ski
lls
-0
.011
-0
.026
-0.0
19-0
.049
0.
016
0.02
4 -0
.028
0.01
4 -0
.046
0.01
7
(0.0
09)
(0
.030
)(0
.027
)(0
.026
)*(0
.017
)(0
.032
)(0
.028
)(0
.033
)(0
.028
)*(0
.034
)te
chni
cal k
now
-how
0.
002
-0.0
49-0
.036
0.05
10.
044
-0.0
140.
034
0.01
40.
092
-0.0
56
(0.0
12)
(0
.042
)(0
.042
)(0
.038
)(0
.023
)*(0
.052
)(0
.031
)(0
.045
)(0
.040
)**
(0.0
35)
high
-leve
l
0.
089
0.16
70.
047
0.17
20.
043
-0.0
01-0
.013
-0.0
330.
007
-0.0
13co
mm
unic
atio
n
(0
.012
)***
(0
.042
)***
(0
.043
)(0
.038
)***
(0.0
24)*
(0.0
40)
(0.0
33)
(0.0
39)
(0.0
36)
(0.0
44)
plan
ning
skill
s
0.05
0 0.
104
0.02
0-0
.014
0.
037
0.04
40.
052
0.09
3-0
.031
-0.0
06
(0.0
12)*
**
(0
.052
)**
(0.0
57)
(0.0
44)
(0.0
22)*
(0.0
39)
(0.0
28)*
(0.0
37)*
*(0
.032
)(0
.030
)cl
ient
com
mun
icat
ion
-0
.050
-0
.095
0.00
1-0
.138
-0.0
40-0
.057
-0.0
13-0
.006
-0.0
35-0
.051
(0
.012
)***
(0.0
40)*
*(0
.044
)(0
.042
)***
(0.0
23)*
(0.0
44)
(0.0
40)
(0.0
44)
(0.0
37)
(0.0
32)
horiz
onta
l
0.
009
0.04
9-0
.119
0.00
9 0.
026
0.06
9-0
.003
0.03
3-0
.017
0.08
5co
mm
unic
atio
n (0
.015
)
(0.0
50)
(0.0
55)*
*(0
.054
)(0
.030
)(0
.052
)(0
.046
)(0
.050
)(0
.040
)(0
.038
)**
prob
lem
-sol
ving
-0
.008
-0.0
91-0
.001
-0.0
26-0
.032
-0.0
25-0
.046
0.04
90.
057
-0.0
88
(0.0
15)
(0
.054
)*(0
.048
)(0
.047
)(0
.028
)(0
.062
)(0
.039
)(0
.043
)(0
.042
)(0
.039
)**
chec
king
skill
s
-0
.011
0.03
20.
010
0.01
1-0
.014
0.06
20.
024
-0.1
59-0
.075
0.04
2
(0.0
13)
(0
.048
)(0
.041
)(0
.042
)(0
.029
)(0
.047
)(0
.033
)(0
.042
)***
(0.0
36)*
*(0
.031
)di
scre
tion
0.
015
0.04
70.
013
-0.0
320.
034
0.00
10.
012
0.01
8 0.
025
0.02
6
(0.0
08)*
*
(0.0
32)
(0.0
27)
(0.0
26)
(0.0
15)*
*(0
.025
)(0
.020
)(0
.023
)(0
.022
)(0
.020
)va
riety
0.
046
0.04
60.
058
0.02
40.
033
0.05
70.
031
0.01
20.
010
-0.0
06
(0.0
07)*
**(0
.023
)*
(0.0
24)*
*(0
.022
) (0
.015
)**
(0.0
23)*
*(0
.016
)*(0
.021
)(0
.020
)(0
.019
)co
mpu
ting
com
plex
ity$
0.07
6 0.
083
0.35
50.
052
0.13
50.
044
0.03
9-0
.038
0.05
60.
047
leve
l 1: s
traig
htfo
rwar
d
(0
.020
)***
(0.0
94)
(0.1
31)*
**(0
.080
)(0
.067
)**
(0.0
53)
(0.0
44)
(0.0
53)
(0.0
46)
(0.0
52)
com
putin
g co
mpl
exity
$ 0.
131
0.09
2
0.29
2 0.
015
0.20
10.
097
0.14
00.
073
0.08
70.
021
leve
l 2: m
oder
ate
(0.0
22)*
**
(0.0
92)
(0.1
28)*
* (0
.081
)
(0
.067
)***
(0.0
62)
(0.0
55)*
*(0
.063
)(0
.066
)(0
.080
)co
mpu
ting
com
plex
ity$
0.12
8 0.
145
0.28
7-0
.029
0.19
7 0.
123
0.17
20.
069
0.25
0-
leve
l 3: c
ompl
ex
(0.0
27)*
**
(0.1
02)
(0.1
35)*
* (0
.091
)
(0
.073
)***
(0.0
84)
(0.0
87)*
*(0
.086
)(0
.091
)***
com
putin
g co
mpl
exity
$ 0.
213
0.10
2
0.
303
0.08
90.
429
0.11
4-
- -
-le
vel 4
: adv
ance
d (0
.035
)***
(0
.119
) (0
.144
)**
(0.1
03)
(0
.101
)***
(0
.118
)fir
m-le
vel c
ompu
ting$
0.
046
0.05
70.
054
0.06
90.
049
0.00
8-0
.030
0.03
6-0
.023
0.00
7le
vel 2
: 25-
75%
(0
.018
)***
(0.0
61)
(0.0
82)
(0.0
61)
(0.0
45)
(0.0
45)
(0.0
45)
(0.0
55)
(0.0
43)
(0.0
45)
firm
-leve
l com
putin
g$
0.
101
0.13
70.
085
0.12
40.
083
0.12
40.
042
0.09
50.
026
-0.0
06le
vel 3
: mor
e th
an 7
5%
(0.0
18)*
**
(0.0
59)*
* (0
.081
) (0
.063
)**
(0.0
42)*
*(0
.059
)**
(0.0
46)
(0.0
52)*
(0.0
50)
(0.0
55)
Num
ber o
bser
vatio
ns
3294
487
407
424
580
299
329
257
289
222
R-s
quar
ed
0.60
0.55
0.37
0.46
0.46
0.52
0.62
0.73
0.55
0.57

46
Notes to Table 8 and Table 9: 1. All regressions in Table 8 and Table 9 also include: a dummy for gender; a quadratic in
potential work experience; control variables for highest education level achieved (5); whether the job involves shift work (1), or supervising or managing others (2); whether the job is normally done ‘almost exclusively’ by the opposite gender (2); whether the job is part-time (1), or temporary (1), or in the private or public sector (1); whether the job is located in a firm with more than 25 employees (1); 17 industry dummies (1-digit SIC92 classification), and 11 regional dummies.
2. Standard errors in parentheses; $ denotes dummy variable. 3. * denotes significant at 10%; ** denotes significant at 5%; *** denotes significant at 1%.
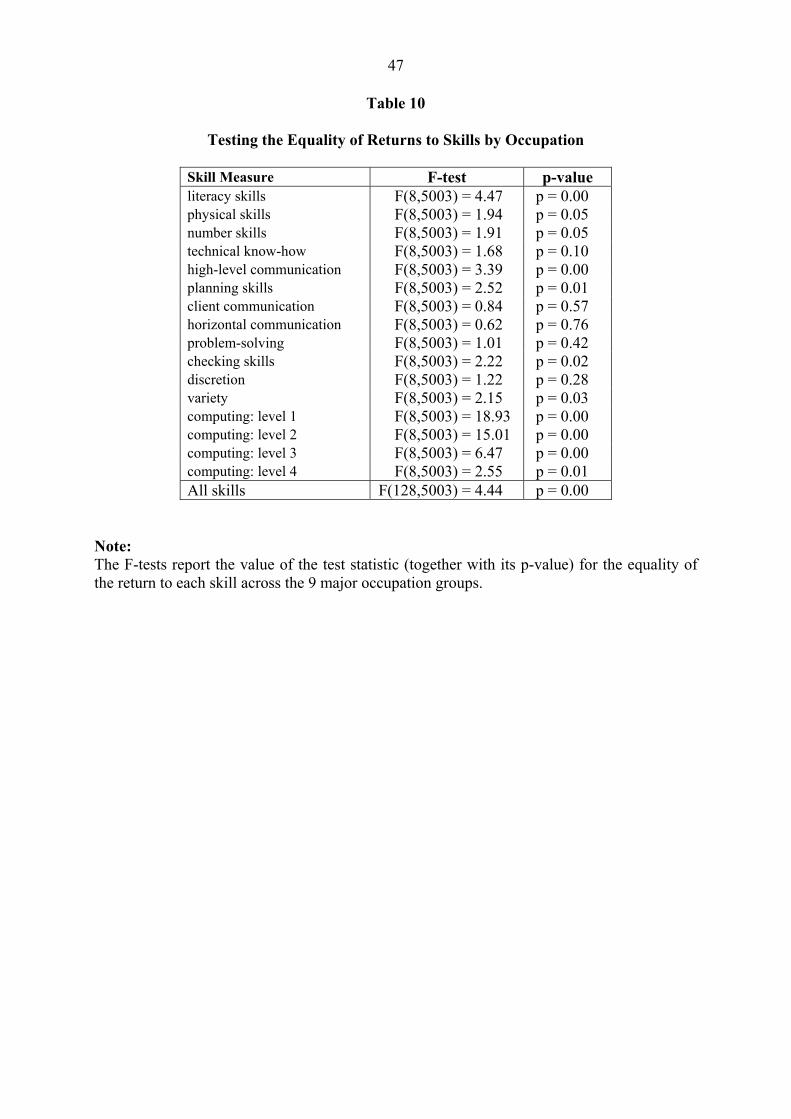
47
Table 10
Testing the Equality of Returns to Skills by Occupation
Skill Measure F-test p-value literacy skills F(8,5003) = 4.47 p = 0.00 physical skills F(8,5003) = 1.94 p = 0.05 number skills F(8,5003) = 1.91 p = 0.05 technical know-how F(8,5003) = 1.68 p = 0.10 high-level communication F(8,5003) = 3.39 p = 0.00 planning skills F(8,5003) = 2.52 p = 0.01 client communication F(8,5003) = 0.84 p = 0.57 horizontal communication F(8,5003) = 0.62 p = 0.76 problem-solving F(8,5003) = 1.01 p = 0.42 checking skills F(8,5003) = 2.22 p = 0.02 discretion F(8,5003) = 1.22 p = 0.28 variety F(8,5003) = 2.15 p = 0.03 computing: level 1 F(8,5003) = 18.93 p = 0.00 computing: level 2 F(8,5003) = 15.01 p = 0.00 computing: level 3 F(8,5003) = 6.47 p = 0.00 computing: level 4 F(8,5003) = 2.55 p = 0.01 All skills F(128,5003) = 4.44 p = 0.00
Note: The F-tests report the value of the test statistic (together with its p-value) for the equality of the return to each skill across the 9 major occupation groups.
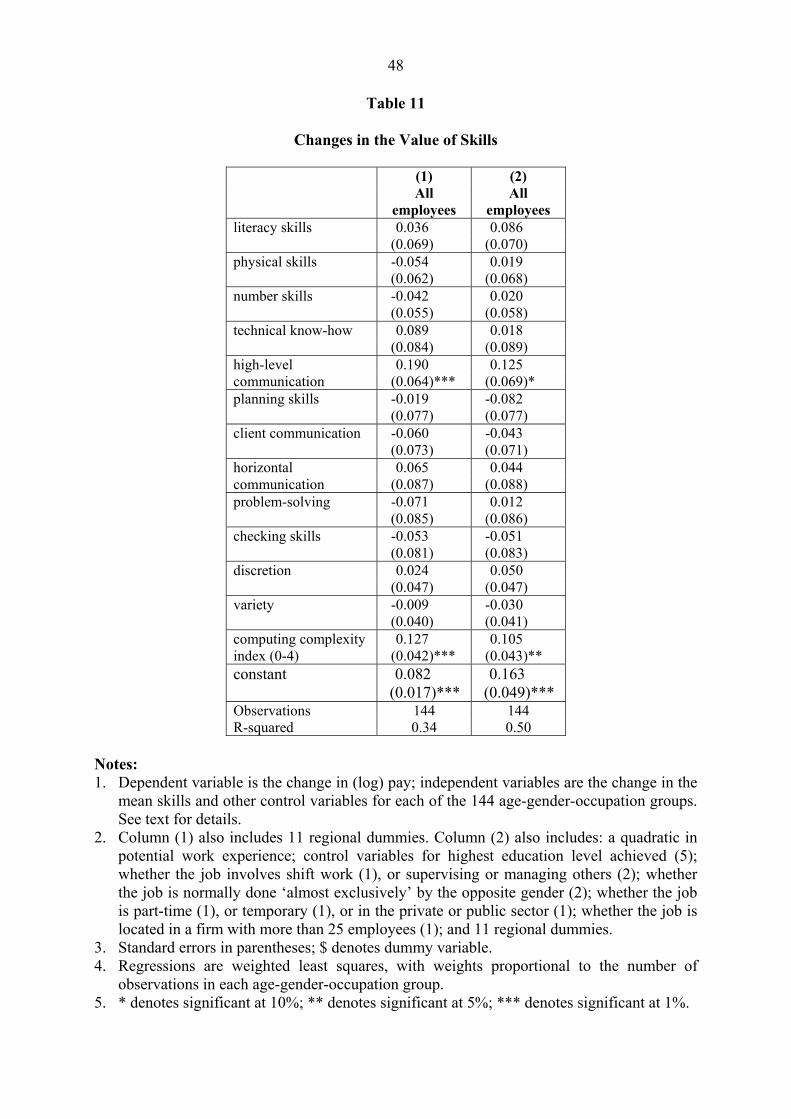
48
Table 11
Changes in the Value of Skills
(1) (2) All
employees All
employees literacy skills 0.036 0.086 (0.069) (0.070) physical skills -0.054 0.019 (0.062) (0.068) number skills -0.042 0.020 (0.055) (0.058) technical know-how 0.089 0.018 (0.084) (0.089) high-level 0.190 0.125 communication (0.064)*** (0.069)* planning skills -0.019 -0.082 (0.077) (0.077) client communication -0.060 -0.043 (0.073) (0.071) horizontal 0.065 0.044 communication (0.087) (0.088) problem-solving -0.071 0.012 (0.085) (0.086) checking skills -0.053 -0.051 (0.081) (0.083) discretion 0.024 0.050 (0.047) (0.047) variety -0.009 -0.030 (0.040) (0.041) computing complexity 0.127 0.105 index (0-4) (0.042)*** (0.043)** constant 0.082 0.163 (0.017)*** (0.049)*** Observations 144 144 R-squared 0.34 0.50
Notes: 1. Dependent variable is the change in (log) pay; independent variables are the change in the
mean skills and other control variables for each of the 144 age-gender-occupation groups. See text for details.
2. Column (1) also includes 11 regional dummies. Column (2) also includes: a quadratic in potential work experience; control variables for highest education level achieved (5); whether the job involves shift work (1), or supervising or managing others (2); whether the job is normally done ‘almost exclusively’ by the opposite gender (2); whether the job is part-time (1), or temporary (1), or in the private or public sector (1); whether the job is located in a firm with more than 25 employees (1); and 11 regional dummies.
3. Standard errors in parentheses; $ denotes dummy variable. 4. Regressions are weighted least squares, with weights proportional to the number of
observations in each age-gender-occupation group. 5. * denotes significant at 10%; ** denotes significant at 5%; *** denotes significant at 1%.
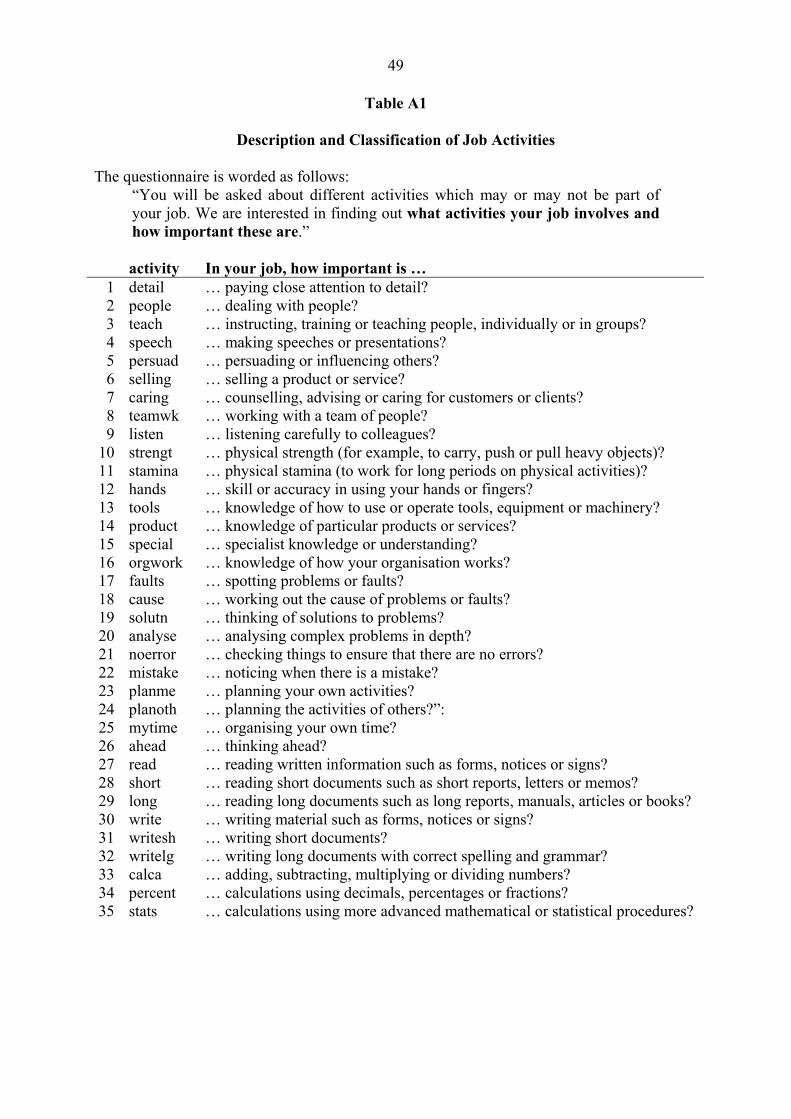
49
Table A1
Description and Classification of Job Activities The questionnaire is worded as follows:
“You will be asked about different activities which may or may not be part of your job. We are interested in finding out what activities your job involves and how important these are.”
activity In your job, how important is …
1 detail … paying close attention to detail? 2 people … dealing with people? 3 teach … instructing, training or teaching people, individually or in groups? 4 speech … making speeches or presentations? 5 persuad … persuading or influencing others? 6 selling … selling a product or service? 7 caring … counselling, advising or caring for customers or clients? 8 teamwk … working with a team of people? 9 listen … listening carefully to colleagues?
10 strengt … physical strength (for example, to carry, push or pull heavy objects)? 11 stamina … physical stamina (to work for long periods on physical activities)? 12 hands … skill or accuracy in using your hands or fingers? 13 tools … knowledge of how to use or operate tools, equipment or machinery? 14 product … knowledge of particular products or services? 15 special … specialist knowledge or understanding? 16 orgwork … knowledge of how your organisation works? 17 faults … spotting problems or faults? 18 cause … working out the cause of problems or faults? 19 solutn … thinking of solutions to problems? 20 analyse … analysing complex problems in depth? 21 noerror … checking things to ensure that there are no errors? 22 mistake … noticing when there is a mistake? 23 planme … planning your own activities? 24 planoth … planning the activities of others?”: 25 mytime … organising your own time? 26 ahead … thinking ahead? 27 read … reading written information such as forms, notices or signs? 28 short … reading short documents such as short reports, letters or memos? 29 long … reading long documents such as long reports, manuals, articles or books? 30 write … writing material such as forms, notices or signs? 31 writesh … writing short documents? 32 writelg … writing long documents with correct spelling and grammar? 33 calca … adding, subtracting, multiplying or dividing numbers? 34 percent … calculations using decimals, percentages or fractions? 35 stats … calculations using more advanced mathematical or statistical procedures?