overcoming the existence of extreme outlier data by using...
TRANSCRIPT
Science Nature 1(1), pp.022- 032 (2018)
e-ISSN: 2654-6264
DOI: https://doi.org/10.30598/ SNVol1Iss1pp022-032year2018
Overcoming the Existence of Extreme Outlier Data by
Using Robust MM Method Based on The Objective
Function of Tukey bisquare
Georgina Maria Tinungki
Mathematics Department, Faculty of Mathematics and Natural Sciences, Universitas Hasanuddin Makassar,
Ujung Pandang, Indonesia
Received : July 24, 2018
Revised
Accepted
: August 24, 2018
: September 3, 2018
Published : September 8, 2018
Copyright @ All rights are reserved by Georgina Maria Tinungki
Corresponding author: *Email: [email protected] ; [email protected]
022
Overcoming the Existence of Extreme Outlier Databy Using Robust MM Method Based on
The Objective Function of Tukey bisquare
Abstract
A widely used estimation method in estimating regression
model parameters is the ordinary least square (OLS) that
minimizes the sum of the error squares. In addition to the ease of
computing, OLS is a good unbiased estimator as long as the error
component assumption ( ) in the given model is met.
However, in the application, it is often encountered violations of
assumptions. One of the violation types is the violation of
distributed error assumption which is caused by the
existence of the outlier on observation data. Thus, a solid method
is required to overcome the existence of outlier, that is Robust
Regression. One of the Robust Regression methods commonly
used is robust MM method. Robust MM method is a combination
of breakdown point and high efficiency. Results obtained based on
simulated data generated using SAS software 9.2, shows that the
use of objective weighting function tukey bisquare is able to
overcome the existence of extreme outlier. Furthermore, it is
determined that the value of tuning constant c with Robust MM
method is 4.685 and it is obtained95% of efficiency. Thus, the
obtained breakdown point is 50%.
Keywords : Objective function of Tukey bisquare,
Robust MM method, Outlier.
Article
1. Introduction
According to Willems and Aelst (2005), the least
squares method for linear regression model is known to
be very sensitive to data transmission. Outlieris an oddity
*Corresponding author: Georgina Maria Tinungki,
Scientist of Hasanuddin University, Research area/ interest:
Mathematical and Statistical.
E-mail:[email protected] ; [email protected]
and signifies a data point that is totally different
compared with other data (Tinungki, 2018). Various
rules have been propose to reject the outlier (removing
the existing data which contain outlier, after that the data
is re-analyzed without outlier). The act of rejecting
outlier is not a proper act. Occasionally, outliercan
provide information that other data points can not
provide, for example, it is caused by existence of outlier
from a combination of unusual circumstances that may
be very important and need to be investigated further
(Blatná, Dagmar. 2006).
023
Overcoming the Existence of Extreme Outlier Databy Using Robust MM Method Based on
The Objective Function of Tukey bisquare
Robust regression is an important method to
analyzed data contaminated by outlier. Robust regression
consists of 5 estimation methods, they are: M-estimator,
Least Median Square (LMS) -estimator, Least Trimmed
Square (LTS) -esterimeter, S-estimator, and
MM-estimator (Salibian et al., 2010). The MM
estimation method was introduced by Tinungki, 2018.
This estimate is a combination of estimation methods
that have a high breakdown value (LTS-estimator or
S-estimator) and M-estimator (Rousseeuw et al., 2012).
The solidity of an estimator can be measured based
on the breakdown point and the efficiency of the
estimator. Breakdownpoint is the proportion or
percentage of contaminated data that can still be handled
by an estimator before concluding a false estimation
while, the efficiency refers to the accuracy of an
estimator which is measured by the magnitude of a
variable (Gad et al., 2016).
2. Literature Review
2.1 Regression Analysis Model
Regression analysis is used to see whether there is
a relationship between independent variables ( ) and the
dependent variable ( ). If there is relation between
variables (x) and variables (y) it can be seen whether
the rise or fall value of the variable (x) will cause the rise
of the value of variable (y) or vice versa. The linear
regression model can generally be written as follows
( i=1,2,…,n)
(2.1)
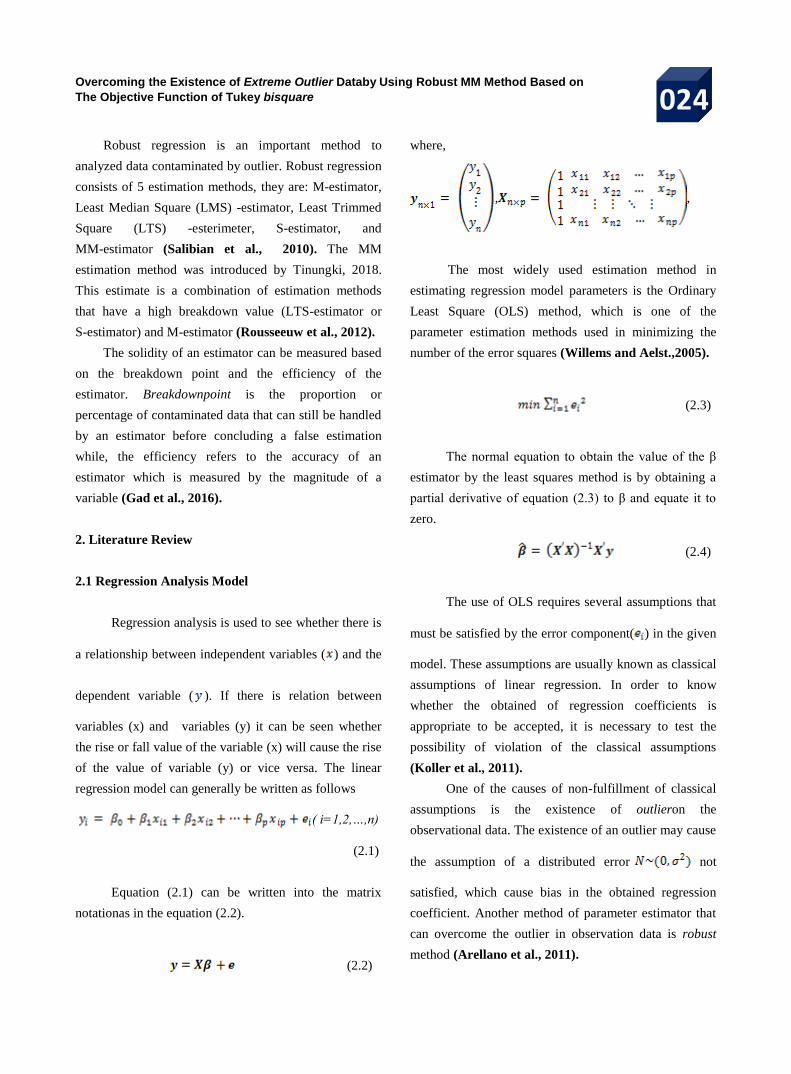
Equation (2.1) can be written into the matrix
notationas in the equation (2.2).
(2.2)
where,
, ,
The most widely used estimation method in
estimating regression model parameters is the Ordinary
Least Square (OLS) method, which is one of the
parameter estimation methods used in minimizing the
number of the error squares (Willems and Aelst.,2005).
(2.3)
The normal equation to obtain the value of the β
estimator by the least squares method is by obtaining a
partial derivative of equation (2.3) to β and equate it to
zero.
(2.4)
The use of OLS requires several assumptions that
must be satisfied by the error component( ) in the given
model. These assumptions are usually known as classical
assumptions of linear regression. In order to know
whether the obtained of regression coefficients is
appropriate to be accepted, it is necessary to test the
possibility of violation of the classical assumptions
(Koller et al., 2011).
One of the causes of non-fulfillment of classical
assumptions is the existence of outlieron the
observational data. The existence of an outlier may cause
the assumption of a distributed error not
satisfied, which cause bias in the obtained regression
coefficient. Another method of parameter estimator that
can overcome the outlier in observation data is robust
method (Arellano et al., 2011).
024

Overcoming the Existence of Extreme Outlier Databy Using Robust MM Method Based on
The Objective Function of Tukey bisquare
One of the first steps to get a correct analysis is
detecting the existence of an outlier. Even though an
outlier is often known as error or noise, outlier may
contain important information. The detected outlier is a
distorted data candidate, which may lead to specific error
in the model, estimated biased parameters, and wrong
results. Hence, it is important to conduct outlier
identification before modeling and analysis (Williams, et
al, 2002).
Chen Colin, 2002 mentions that historically, three
types of outlier problems are overcame with robust
regression: 1) Outliers in dependent variables (y), 2)
Outliers in free variables (x) also called leverage points
and 3) Outliers in dependent variables (y) and the
independent variable (x). Rousseeuw et al, 2012
described two types of outlier data in the regression.
First, the-i observed data shows a large difference
between the xi regression vectors and the central point of
the data; such case is called leverage point. The second,
the-i observed data shows a large difference between the
dependent variable and mean of predicted by the
model; it called as regression outlier.
2.2 Robust MM-Estimator
According to Chen Colin, 2002, MM-estimator
classes were first introduced by Stuart, Chaterine.
2011, for linear regression. According to Stuart &
Chaterine. 2011, MM-estimator is defined in three
steps. The first step, the estimated initial parameter of
regression is calculated by using LTS-estimator method.
The second step, calculating residual and robust
estimation scale using M-estimator. The last, calculating
the last parameter estimation using M estimator (Bailer
et al., 2012). Robust MM method is a procedure used in
estimating regression parameter (Kutner, M.H. 2004),
which minimize the scale of error with breakdown point
up to 50%. Robust MM method is as below
(2.5)
By deriving the equation (2.5) on , it is obtained
(2.6)
Where ψ is the derivation ofρ.By defining the weights
Thus, the equation (2.6) is shown below
which can be written into matrix form below
(2.7)
Robust MM method is solved using Iterative Reweighted
Least Square (IRLS) method as in the equation (2.8)
(Fox, John. 2002).
025
Overcoming the Existence of Extreme Outlier Databy Using Robust MM Method Based on
The Objective Function of Tukey bisquare
(2.8)
Parameter Significance Test
1. Hypothesis
2. Test Statistics: Wald Test
3. Significance Level:
4. Rejection Area H0: If the value of and degree
of freedom 1.
3. Results and Discussion
In this research, the data used is simulation data
generated using software SAS 9.2. The application
ofrobust MM method in estimating parameters β using
simulation data for different sample sizes on three types
of outliers, as follows:
1. Determining the parameters for the population
and . In this case it is set that and j =
0,1.
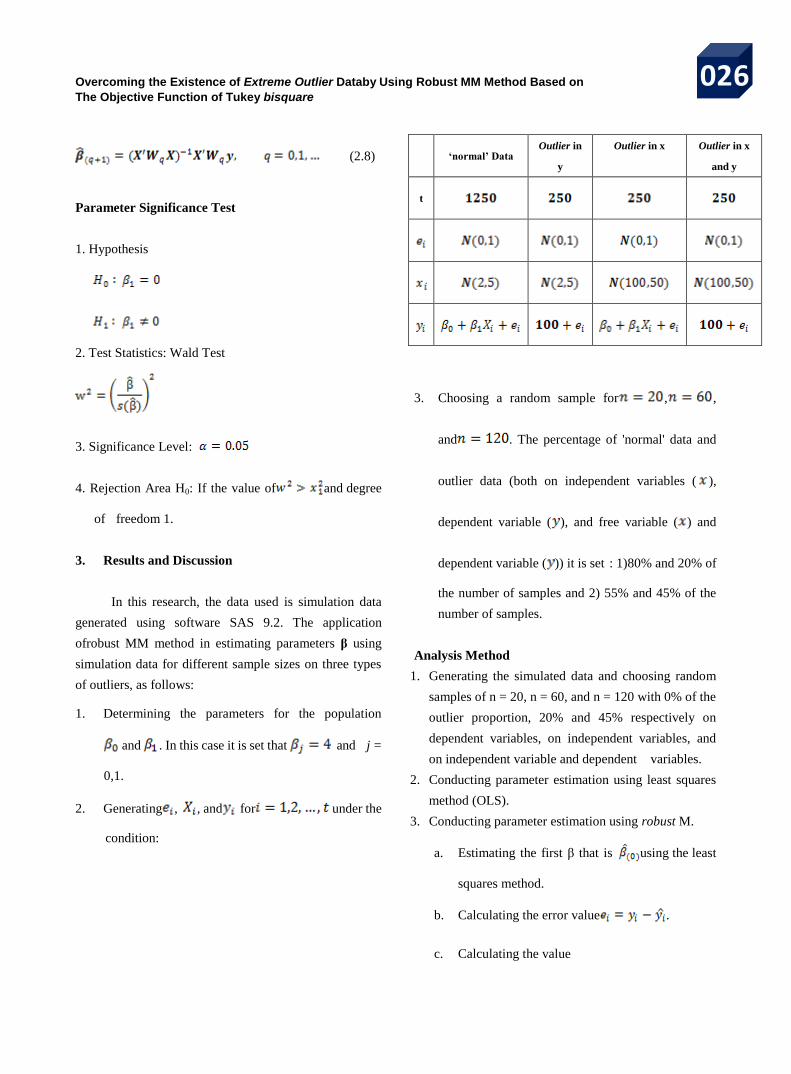
2. Generating , , and for under the
condition:
‘normal’ Data Outlier in
y
Outlier in x Outlier in x
and y
t
3. Choosing a random sample for , ,
and . The percentage of 'normal' data and
outlier data (both on independent variables ( ),
dependent variable ( ), and free variable ( ) and
dependent variable ( )) it is set : 1)80% and 20% of
the number of samples and 2) 55% and 45% of the
number of samples.
Analysis Method
1. Generating the simulated data and choosing random
samples of n = 20, n = 60, and n = 120 with 0% of the
outlier proportion, 20% and 45% respectively on
dependent variables, on independent variables, and
on independent variable and dependent variables.
2. Conducting parameter estimation using least squares
method (OLS).
3. Conducting parameter estimation using robust M.
a. Estimating the first β that is using the least
squares method.
b. Calculating the error value .
c. Calculating the value
026
Overcoming the Existence of Extreme Outlier Databy Using Robust MM Method Based on
The Objective Function of Tukey bisquare
d. Calculating the value
e. Calculating the weighting value( ) based on
the specified weighting function.
f. Calculating using least weighted square based
on the weighting value .
g. Repeating the step b to fin order to obtained the
convergent value .
h. Testing whether the independent variable (x) has
a significant influence on the dependent variable
(y) using the wald test.
4. Performing parameter estimation using robust S
method
a. Estimating the first β that is using the least
squares method.
b. Calculating the error value .
c. Calculating the value
d. Calculating the value
e. Calculating the weighting value ( ) based on
the specified weighting function.
f. Calculating using least weighted square based
on weightingvalue .
g. Repeating the step b to f in order to obtainedthe
convergent value of .
h. Testing whether the independent variable (x) has
a significant influence on the dependent variable
(y) using the wald test.
5.Performing parameter estimation using robust
S method
a. Estimating the first β that is using the least
squares method.
b. Calculating the error value .
c. Calculating the value
d. Calculating the value
e. Calculating the weighting ( ) based on the
specified weighting function.
f. Calculating using the least weighted square
based on the weighting value .
g. Repeating the step b to f in order to obtained the
convergent value of .
027
Overcoming the Existence of Extreme Outlier Databy Using Robust MM Method Based on
The Objective Function of Tukey bisquare
h. Testing whether the independent variable (x) has
a significant influence on the dependent variable
(y) using the wald test.
6. Performing parameter estimation using robust MM
method.
a. Estimating the first β that is using robust S
method.
b. Calculating the error value .
c. Calculating the value
d. Calculating the value
e. Calculating the weighting value ( ) based on
the specified weighting function, that is
objective function with is Tukey
Bisquare, which can be written in this following
form:
f. Calculating using the least weighted square
based on the weighting value .
g. Repeating the step b to f in order to obtained the
convergent value .
h. Testing whether the independent variable (x) has
a significant influence on the dependent variable
(y) using the wald test.
7. Calculating Mean Square Error (MSE) based on the
regression model obtained from OLS, and robust
MM.
Description:
vector of estimated parameters
vector of real coefficient model.
8. Determining the best method based on the smallest
MSE.
3.1. Parameter Estimation
Before performing the parameter estimation, the
outlier identification was performed on simulation data
for three sample numbers and three different outlier
types along with data without outliers to ensure that the
data obtained was in accordance with the objectives of
the study.
(to be continued on p. 029.)
028
Overcoming the Existence of Extreme Outlier Databy Using Robust MM Method Based on
The Objective Function of Tukey bisquare
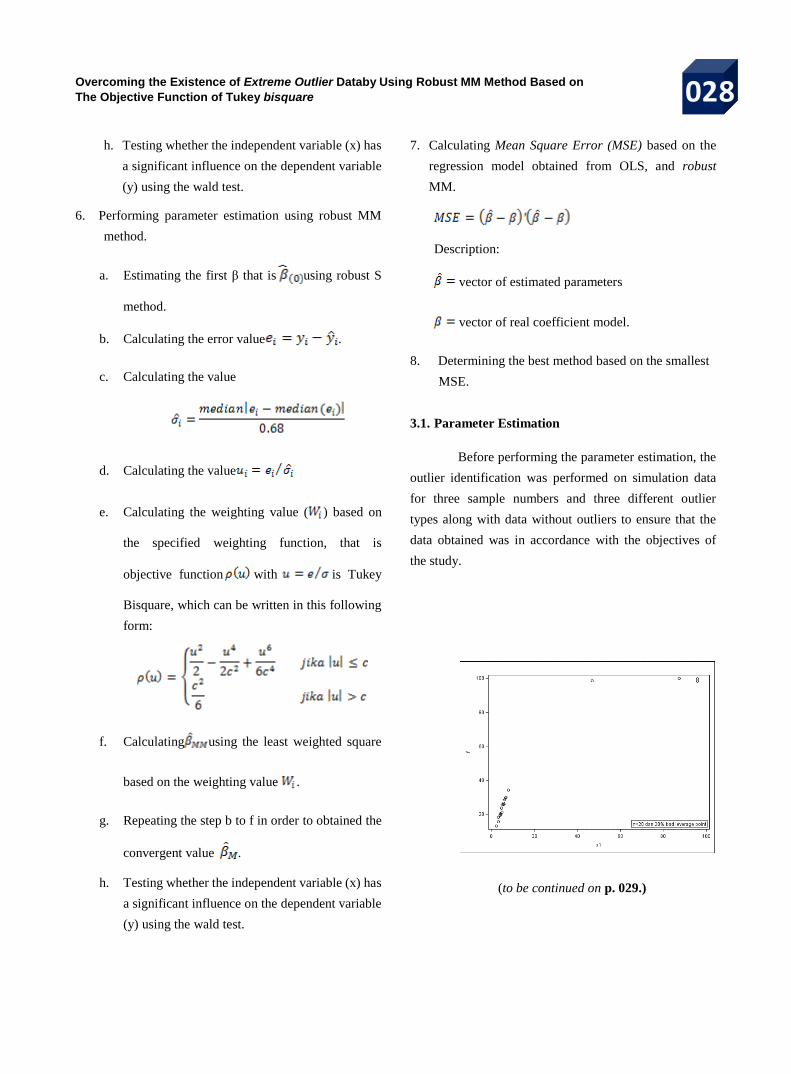
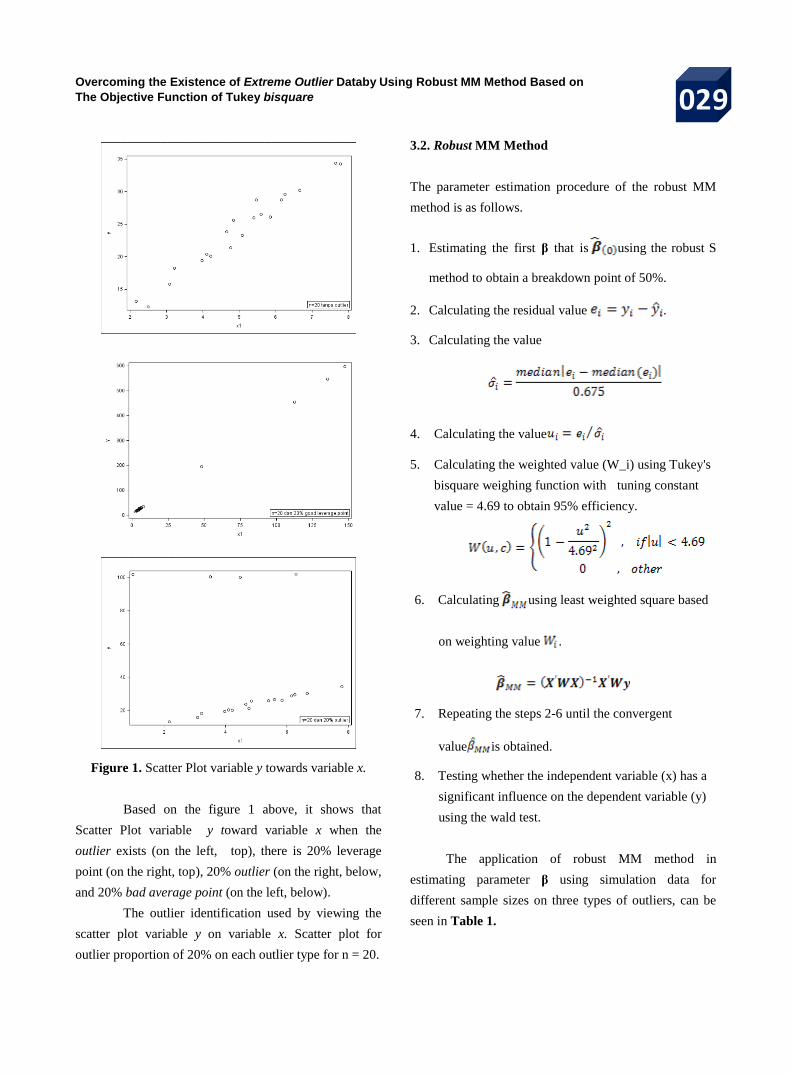
Figure 1. Scatter Plot variable y towards variable x.
Based on the figure 1 above, it shows that
Scatter Plot variable y toward variable x when the
outlier exists (on the left, top), there is 20% leverage
point (on the right, top), 20% outlier (on the right, below,
and 20% bad average point (on the left, below).
The outlier identification used by viewing the
scatter plot variable y on variable x. Scatter plot for
outlier proportion of 20% on each outlier type for n = 20.
3.2. Robust MM Method
The parameter estimation procedure of the robust MM
method is as follows.
1. Estimating the first β that is using the robust S
method to obtain a breakdown point of 50%.
2. Calculating the residual value .
3. Calculating the value
4. Calculating the value
5. Calculating the weighted value (W_i) using Tukey's
bisquare weighing function with tuning constant
value = 4.69 to obtain 95% efficiency.
6. Calculating using least weighted square based
on weighting value .
7. Repeating the steps 2-6 until the convergent
value is obtained.
8. Testing whether the independent variable (x) has a
significant influence on the dependent variable (y)
using the wald test.
The application of robust MM method in
estimating parameter β using simulation data for
different sample sizes on three types of outliers, can be
seen in Table 1.
029
Overcoming the Existence of Extreme Outlier Databy Using Robust MM Method Based on
The Objective Function of Tukey bisquare
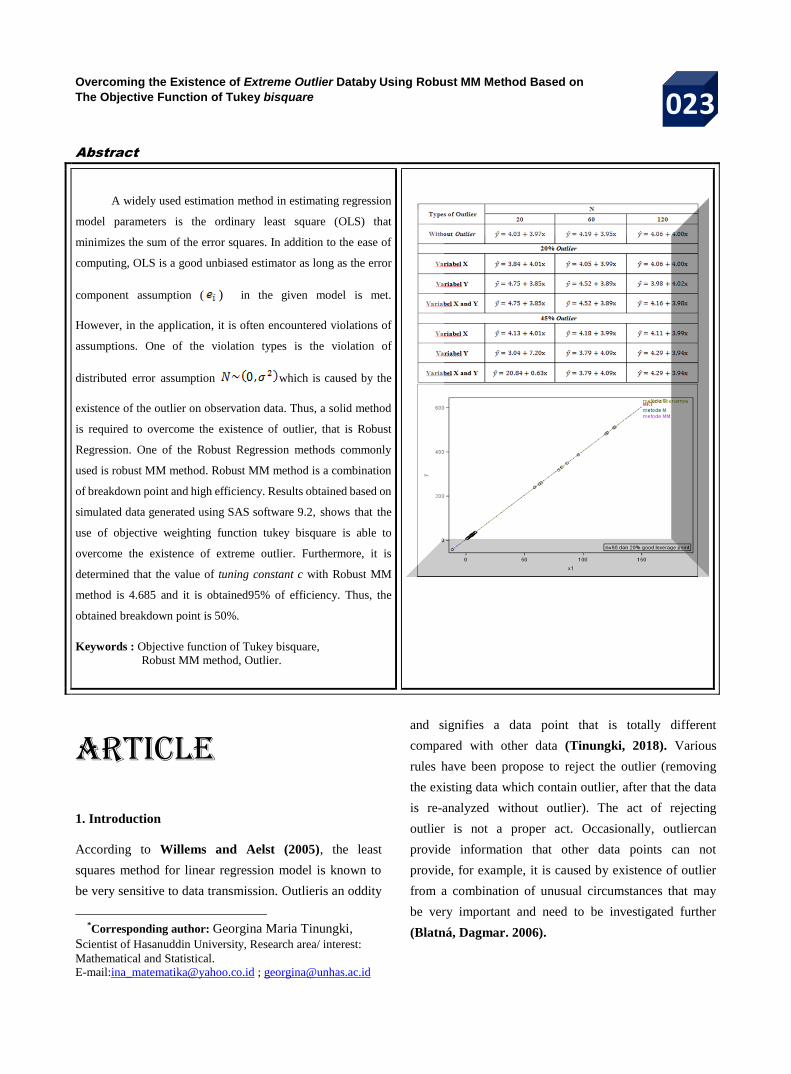
Table1. Linear Model of Robust MM Method.
Types of Outlier N
20 60 120
Without Outlier
20% Outlier
Variabel X
Variabel Y
Variabel X and Y
45% Outlier
Variabel X
Variabel Y
Variabel X and Y
From the 21 regression models obtained using the robust
MM method, the Waldchi-square test results show that
the independent variable (x) does not significantly affect
the dependent variable (y) for n = 20 when there is 45%.
Outlier in the dependent variable (y). Furthermore, the
regression model obtained, shows the influence of
independent variable (x) on the dependent variable (y) is
significant. In the observational data containing 20% and
45% outliers on the dependent variable x (good leverage
point), OLS estimation results are able to work well. This
can be viewed in Fig. 1 where the four method graphs
coincide. Overall, the least squares method is the best
method with minimum MSE values.
Good leverage points can improve the accuracy
of regression coefficients. This can be seen by comparing
the MSE and standard errors of the
regression coefficients when there is no outlier and when
there is an outlier on the x axis.
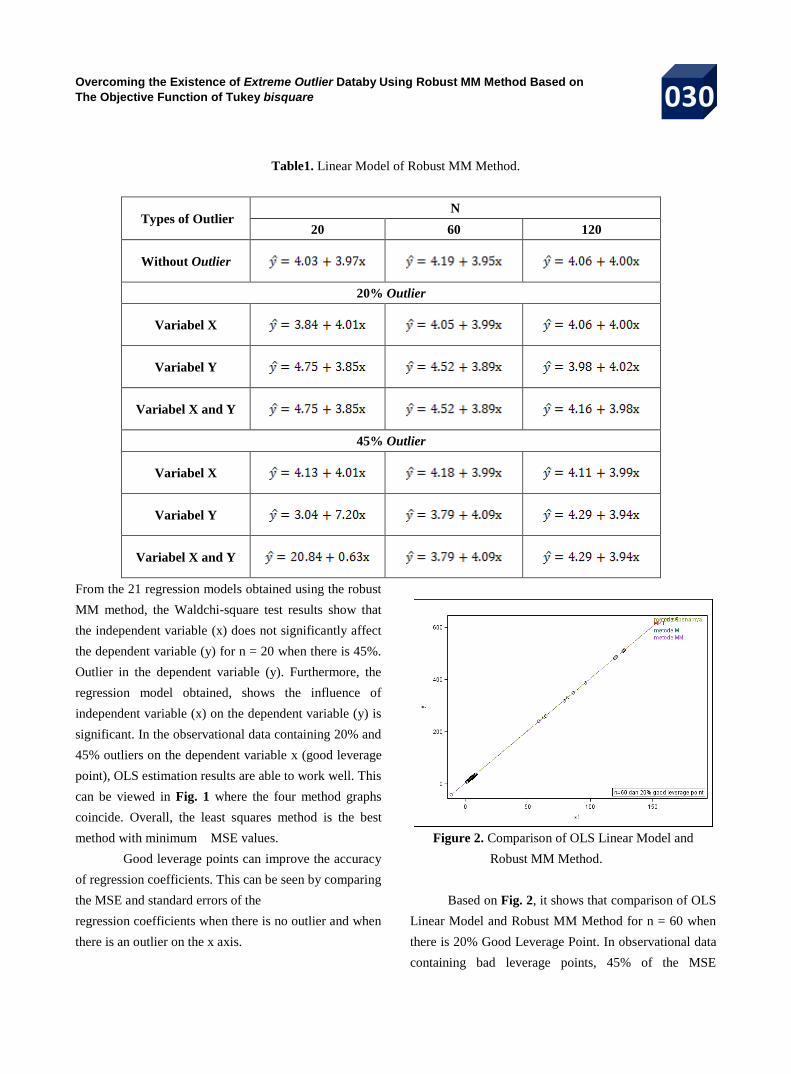
Figure 2. Comparison of OLS Linear Model and
Robust MM Method.
Based on Fig. 2, it shows that comparison of OLS
Linear Model and Robust MM Method for n = 60 when
there is 20% Good Leverage Point. In observational data
containing bad leverage points, 45% of the MSE
030
Overcoming the Existence of Extreme Outlier Databy Using Robust MM Method Based on
The Objective Function of Tukey bisquare
identified from the four methods for n = 20 are very
large. While, for n = 60 and n = 120 the result is the
same as in the case when there is 20% of bad leverage
point OLS and the robust MM methods is still able in
estimating the regression parameters and produce a
minimum MSE.
4. Summary
4.1 Conclusion
Based on the research result, the conclusion is taken as
follows:
1. In estimating the multiple linear regression
parameters containing the outlier, without
eliminating the outlier, can use robust MM
estimator regression method, using the objective
weighting function Tukey Bisquare
2. Robus MM estimator regression model can be
used for data which contain outlier on the
independent variables and dependent variables.
3. Solution from therobust MM method is:
with
where for and
completed by using iterative reweighted least
square (IRLS) method. The objective function
used is the Tukey Bisquare function, which can
overcome the extreme outlier and set the tuning
constant c value for robustM and MM method
that is 4,68. Thus, it is obtained 95% efficiency
and 1,55 for robust S method, which obtain
50% breakdown point.
4. Generally, based on standard error and the
obtained MSE, robust MM method is good
when outliers and bad leverage point are exists.
However, the weakness of robust MM method
is when the sample size is small and the
proportion of large outliers is close to the
breakdown point value. On the other hand,
when good leverage point exists, the least
squares method can still properly assess the
regression parameters, it also can improve the
accuracy of the regression coefficient.
5. Robust regression estimation is performedin the
selection of the tuning constant to make the
estimation more specific and minimize the
residual squares amount.
4.2 Suggestion
Further research can be conducted by comparing several
robust methods, both the subject discussed in this study
and other robust methods in situations where the error is
not normally distributed (uniform distribution, t
distribution, and so on).
References
[1] Arellano-Valle, R. B., &Azzalini, A. 2011.
TheCentred Parameterization and Related
Quantities of the Skew-t Distribution. Journal of
Multivariate Analsysis, 113, 73–90.
[2] Bailer, H. M., Maravina, T. A., & Martin, R. D.
2012. Robust Betas in Asset Management. In B.
Scherer, & K. Winston (Eds.), The Oxford
Handbook of Quantitative Asset Management (pp.
203-242). Oxford University Press.
[3] Blama, Dagmar, 2006 Outliers in regression Trut-
Nov, 30,2006-03.
[4] Chen Colin, 2012 Paper 265-27 Robust Regression
and Outlier Detection with the ROBUSTREG
Procedure.In Proceedings of the Proceedings of the
Twenty-Seventh Annual SAS Users Group
International Conference.
[5] Fox, John. 2002. Robust Regression. In Appendix
To R and S-Plus companion To Applied Regression.
[6] Gad, Ahmed M, Maha E. Qura.2016. Regression
Estimation in Presence of Outliers: A Comparative
031
Overcoming the Existence of Extreme Outlier Databy Using Robust MM Method Based on
The Objective Function of Tukey bisquare
Study.International Journal of Probability and
Statistics 2016, 5(3): 65-72.
[7] Koller, M., &Stahel, W. A. 2011. Sharpening
Wald-Type Inference in Robust Regression for
Small Samples. Computational Statistics and Data
Analysis, 55(8), 2504–2515.
[8] Kutner, M.H. 2004.Applied Linier Regression
Models. 4th ed. New York: McGraw-Hill
Companies, Inc..
[9] Rousseeuw, P., Croux, C., Todorov, V., Ruckstuhl,
A., Salibian-Barrera, M., Verbeke, T., Koller, M.,
&Maechler, M. 2012. robustbase: Basic Robust
Statistics. R package version 0.9-2. Available from
http://CRAN.R-project.org/package=robustbase.
[10] Salibian, Barrera, M., &Omelka, M. 2010. Uniform
Asymptotics for S- and MM-Regression Estimators.
Annals of the Institute of Statistical Mathematics,
62, 897-927
[11] SAS Institute Inc, 2009. SAS/STAT ® 9.2, User’s
Guide, Chapter 74: The ROBUSTREG Procedure,
Second Edition, Cary, NC: USA
[12] Stuart, Chaterine, 2011 . Robust regression Dept.
Of Mathemetical Sciences Durham University, 169
[13] Tiarapuspa, T Devani L.I & Wahyuni, RS. 2018.
Constructing counterproductive behavior for
supporting enviromental management system
research. The 4th International Seminar on
Sustainable Urban Development IOP Publishing
IOP conf. Series : Earth and Environmental Science
106.
[14] Tinungki G.M. 2018. The Application Law of
Large Numbers That Predicts The Amount of
Actual Loss in Insurance of Life. The 2nd
International Conference on Science (ICOS) IOP
Publishing IOP Conf. Series: Journal of Physics:
Conf. Series 979 (2018) 012088.
[15] Tinungki G.M. 2018. The Accuracy Level Of Biplot
Analysis Based On The Variance-Covariance
Matrix. American Journal of Engineering Research
(AJER). Volume-7, Issue-5, pp-264-271
www.ajer.org Research Paper Open Access.
[ [16] Williams G. J, et al., 2002. A Comparative Study of
RNN for Outlier Detection in Data Mining.In Data
Mining.
[17] Willems and Aelst.,2005., Multivariate Regression
S-Estimators For Robust Estimation And Inference,
StatisticaSinica 15(2005), 981-1001, Ghent
University and University of Antwerp.
*Corresponding Author Brief CV
Dr. Dr. Georgina maria tinungki, m.si
Faculty Member di Hasanuddin University ,
Dept Mathematics Hasanuddin University (S1),
Statisticsi Bogor Agricultural University (S2),
Coastal and Marine Resources Management
Bogor Agricultural University (S3),
Mathematics Education Indonesia University of Education (S3),
https://scholar.google.co.id/citations?user=FApc4QgAAAAJ&hl=en
032