overview | agrofresh solutions inc
TRANSCRIPT

Table of Contents
UNITED STATESSECURITIES AND EXCHANGE COMMISSION
Washington, D.C. 20549
FORM 10-Kýý ANNUAL REPORT PURSUANT TO SECTION 13 OR 15(d) OF THE SECURITIES EXCHANGE ACT OF 1934
For the fiscal year ended December 31, 2018
or
oo TRANSITION REPORT PURSUANT TO SECTION 13 OR 15(d) OF THE SECURITIES EXCHANGE ACT OF1934
For the transition period from to
Commission File Number: 001-36316
AgroFresh Solutions, Inc.(Exact Name of Registrant as Specified in Its Charter)
Delaware(State or other jurisdiction of incorporation)
46-4007249(IRS Employer Identification Number)
One Washington Square
510-530 Walnut Street, Suite 1350Philadelphia, PA 19106
(Address of principal executive offices)(267) 317-9139
(Registrant’s telephone number, including area code)Securities registered pursuant to Section 12(b) of the Act:
Title of each class Name of each exchange on which registered
Common Stock, par value $0.0001 per share The NASDAQ Global MarketWarrants to purchase shares of Common Stock The NASDAQ Global Market
Securities registered pursuant to Section 12(g) of the Act: NoneIndicate by check mark if the registrant is a well-known seasoned issuer, as defined in Rule 405 of the Securities Act. o Yes ý NoIndicate by check mark if the registrant is not required to file reports pursuant to Section 13 or Section 15(d) of the Exchange Act o Yes ý NoIndicate by check mark whether the registrant (1) has filed all reports required to be filed by Section 13 or 15(d) of the Securities Exchange Act of
1934 during the preceding 12 months (or for such shorter period that the registrant was required to file such reports), and (2) has been subject to such filingrequirements for the past 90 days. ý Yes o No
Indicate by check mark whether the registrant has submitted electronically and posted on its corporate Web site, if any, every Interactive Data Filerequired to be submitted and posted pursuant to Rule 405 of Regulation S-T (Section 232.405 of this chapter) during the preceding 12 months (or for suchshorter period that the registrant was required to submit and post such files). ý Yes o No
Indicate by check mark if disclosure of delinquent filers pursuant to Item 405 of Regulation S—K is not contained herein, and will not be contained,to the best of registrant’s knowledge, in definitive proxy or information statements incorporated by reference in Part III of this Form 10—K or any amendmentto this Form 10—K. o
Indicate by check mark whether the registrant is a large accelerated filer, an accelerated filer, a non-accelerated filer, or a smaller reporting company. See the definitions of large accelerated filer,” “accelerated filer” and “smaller reporting company” in Rule 12b-2 of the Exchange Act. (Check one):
1

Table of Contents
Large accelerated filer o Accelerated filer x Non-accelerated filer o(Do not check if asmaller reporting company)
Smaller reportingcompany x
Emerging growth company x
If an emerging growth company, indicate by check mark if the registrant has elected not to use the extended transition period for complying with anynew or revised financial accounting standards provided pursuant to Section 13(a) of the Exchange Act. o
Indicate by check mark whether the registrant is a shell company (as defined by Rule 12b-2 of the Act). o Yes ý No As of June 30, 2018, the aggregate market value of the common stock held by nonaffiliates of the registrant, based on the $7.01 closing price of theregistrant’s common stock as reported on the NASDAQ Stock Market on that date, was approximately $168 million. For purposes of this computation, allofficers, directors and 10% beneficial owners of the registrant are deemed to be affiliates. Such determination should not be deemed to be an admission thatsuch officers, directors or 10% beneficial owners are, in fact, affiliates of the registrant.
The number of shares of the registrant’s common stock outstanding as of March 4, 2019 was 51,067,072.DOCUMENTS INCORPORATED BY REFERENCE
The information required by Part III of this annual report on Form 10-K, to the extent not set forth in this Form 10-K, is incorporated herein by referencefrom the registrant’s definitive proxy statement relating to the annual meeting of stockholders to be held in 2019, to be filed with the Securities andExchange Commission within 120 days after the end of the registrant’s fiscal year ended December 31, 2018.
2
Table of Contents
TABLE OF CONTENTS
PageCAUTIONARY NOTE REGARDING FORWARD-LOOKING STATEMENTS 2
PART I 3Item 1. BUSINESS 3Item 1A. RISK FACTORS 13Item 1B. UNRESOLVED STAFF COMMENTS 28Item 2. PROPERTIES 28Item 3. LEGAL PROCEEDINGS 28Item 4. MINE SAFETY DISCLOSURES 29
PART II 29Item 5. MARKET FOR REGISTRANT’S COMMON EQUITY, RELATED STOCKHOLDER MATTERS AND ISSUER
PURCHASES OF EQUITY SECURITIES 29Item 6. SELECTED FINANCIAL DATA 29Item 7. MANAGEMENT’S DISCUSSION AND ANALYSIS OF FINANCIAL CONDITION AND RESULTS OF
OPERATIONS 30Item 7A. QUANTITATIVE AND QUALITATIVE DISCLOSURES ABOUT MARKET RISK 42Item 8. FINANCIAL STATEMENTS AND SUPPLEMENTARY DATA 43Item 9. CHANGES IN AND DISAGREEMENTS WITH ACCOUNTANTS ON ACCOUNTING AND FINANCIAL
DISCLOSURE 80Item 9A. CONTROLS AND PROCEDURES 80Item 9B. OTHER INFORMATION 80
PART III 81Item 10. DIRECTORS, EXECUTIVE OFFICERS AND CORPORATE GOVERNANCE 81Item 11. EXECUTIVE COMPENSATION 81Item 12. SECURITY OWNERSHIP OF CERTAIN BENEFICIAL OWNERS AND MANAGEMENT AND RELATED
STOCKHOLDER MATTERS 81Item 13. CERTAIN RELATIONSHIPS AND RELATED TRANSACTIONS, AND DIRECTOR INDEPENDENCE 81Item 14. PRINCIPAL ACCOUNTANT FEES AND SERVICES 81
PART IV 82Item 15. EXHIBITS AND FINANCIAL STATEMENT SCHEDULES 82
SCHEDULE I - CONDENSED FINANCIAL INFORMATION OF REGISTRANT 83SCHEDULE II - VALUATION AND QUALIFYING ACCOUNTS 87INDEX TO EXHIBITS 88SIGNATURES 90
1

Table of Contents
CAUTIONARY NOTE REGARDING FORWARD-LOOKING STATEMENTS Certain of the statements contained in this annual report on Form 10-K constitute “forward-looking statements” for purposes of federal securities laws. Ourforward-looking statements include, but are not limited to, statements regarding our or our management’s expectations, hopes, beliefs, intentions or strategiesregarding the future. In addition, any statements that refer to projections, forecasts or other characterizations of future events or circumstances, including anyunderlying assumptions, are forward-looking statements. The words “anticipate,” “believe,” “continue,” “could,” “estimate,” “expect,” “intend,” “may,”“might,” “plan,” “possible,” “potential,” “predict,” “project,” “should,” “would,” “will” and similar expressions may identify forward-looking statements, butthe absence of these words does not mean that a statement is not forward-looking. Forward-looking statements in this report may include, for example,statements relating to:
• our future financial performance;• growth plans and opportunities, including planned product and service offerings;• changes in the markets in which we compete;• our ability to increase brand loyalty and awareness;• our ability to enter into alliances and complete acquisitions of other businesses;• protection of our intellectual property rights; and• the outcome of any known and unknown litigation.
The forward-looking statements contained in this report are based on our current expectations and beliefs concerning future developments and their potentialeffects on us. Future developments affecting us may not be those that we have anticipated. These forward-looking statements involve a number of risks,uncertainties (some of which are beyond our control) or other assumptions that may cause actual results or performance to be materially different from thoseexpressed or implied by these forward-looking statements. These risks and uncertainties include, but are not limited to, those factors described under theheading “Risk Factors” elsewhere in this report. Should one or more of these risks or uncertainties materialize, or should any of our assumptions proveincorrect, actual results may vary in material respects from those projected in these forward-looking statements. We undertake no obligation to update orrevise any forward-looking statements, whether as a result of new information, future events or otherwise, except as may be required under applicablesecurities laws.
2

Table of Contents
PART I ITEM 1. BUSINESS
Overview
AgroFresh Solutions, Inc. (the “Company”, “AgroFresh”, “we”, “us” or “our”) is a global leader in delivering innovative solutions that extend the shelf life offresh produce. The Company is empowering the food industry with Smarter FreshnessTM, a range of integrated solutions designed to help growers, packersand retailers improve produce freshness and quality while preventing shrinkage and reducing waste.
AgroFresh’s market leadership is underpinned by our global footprint, extensive applied scientific expertise, customer intimacy, and a growing portfolio ofvalue-added products and mission-critical advisory services. Our key products are approved for sale in over 50 countries, support approximately 3,900 directcustomers and service over 25,000 storage rooms globally. In addition, we provide in-depth plant physiology expertise and offer a comprehensive list ofsolutions spanning from near-harvest to post-harvest, from storage through retail. More importantly, our direct market approach and high touch service modelbest positions us to address our customers’ needs. We believe this is a key differentiator compared to other companies that offer limited service levels.
The following tables present a breakdown of our revenue based on solutions, crop and geography for the year ended December 31, 2018.
Note: “EMEA” comprises Europe, the Middle East, and Africa. “Other” include revenue from pears, citrus, kiwifruit, avocados, bananas, and other crops.
AgroFresh’s core business provides solutions to extend the shelf life of fresh produce for both growers and packers. SmartFreshTM, our current principalsolution, preserves the texture, firmness, taste and appearance of produce during storage, transportation and retail display. It allows growers and packers todeliver “just harvested” freshness on a year-round basis and enables retailers to increase customer satisfaction with fresh, high quality produce. An integralpart of the SmartFresh value proposition is a direct service model providing customers with on-site applications of SmartFresh at their storage facilitiestogether with mission-critical and value-added advisory services.
AgroFresh has extended its post-harvest leadership with the acquisition in December 2017 of a controlling interest in Tecnidex Fruit Protection, S.A.U.(“Tecnidex”), a leading provider of fungicides, sanitizers, waxes, and coatings primarily focused on the citrus market. For over 35 years, Tecnidex has beenhelping fruit and vegetable producers offer clean, safe and high-quality products to customers in 18 countries. Tecnidex brought a broad catalog of solutionsthat enhanced our current offering, including fungicides that can be added to our innovative ActiMistTM delivery system of foggable fungicides. Theexpanded offerings further diversify our revenue by expanding our ability to provide more solutions and service the citrus industry.
Complementing our post-harvest solutions, AgroFresh’s HarvistaTM technology is used for near harvest management of pome fruit (apples and pears), as wellas cherries and blueberries. Just as SmartFresh revolutionized post-harvest apple storage, we believe Harvista can have a similar impact in the orchard. Inapples, Harvista slows ripening, reduces fruit drop, and holds fruit on the tree longer to promote better color and fruit size, thereby bringing new benefits tothe grower. With maximum flexibility in application timing, it extends the harvest window by allowing growers to factor in ever-changing weatherconditions and labor availability. We have found that the combination of Harvista in the orchard and SmartFresh in the storage room results in
3

Table of Contents
improved apple quality metrics compared to use of either product individually. When applied to cherries, Harvista offers an increase to yield of a minimum of10%.
AgroFresh provides freshness solutions across the supply chain, including retail where much of the shrinkage occurs for certain crops. This includes bananas,the largest retail fruit category. According to data from the Journal of Consumer Affairs and United Nation’s Food and Agriculture Organization, it isestimated that 12-16% of banana loss occurs after the fruit reaches the grocery store. Our RipeLockTM Quality System is a retail solution that addresses thisproblem and improves the quality and consumer appeal of bananas. RipeLock enables retailers to extend the consumer-preferred yellow life of bananas anadditional 4-6 days, reducing shrinkage at the store level and increasing sales.
To continue to evolve and increase the value we provide to our customers, we recently launched our FreshCloudTM platform consisting of producemonitoring and screening solutions with real time information delivered in the “cloud” to customers. FreshCloud is the culmination of our decades-longhistory of innovation and scientific know-how in the physiology of fruits and vegetables. FreshCloud consists of both enhancements to our existing serviceoffering and customer base and new solutions to reach more crops and steps in the distribution chain. FreshCloud Storage Insights combines proprietarysensor technology and data analytics in the storage room to offer customers real-time access to unique insights into the condition of their stored fruit.FreshCloud Predictive Screening predicts the risk of disorder development during storage by analyzing gene expression at commercial harvest, resulting inmore informed storage management decisions. FreshCloud Transit Insights combines sensor technology and proprietary algorithms to provide insights intothe condition and quality of fruit during transit.
History
We are a former blank check company that completed our initial public offering on February 19, 2014. On July 31, 2015 (the “Closing Date”), weconsummated a business combination (the “Business Combination”) pursuant to a Stock Purchase Agreement, dated April 30, 2015 (the “PurchaseAgreement”), with The Dow Chemical Company (“Dow”), providing for the acquisition by us of the AgroFresh business from Dow, resulting in AgroFreshInc. becoming our wholly-owned, indirect subsidiary. On the Closing Date, we changed our name from Boulevard Acquisition Corp. to AgroFreshSolutions, Inc. Prior to the closing of the Business Combination, the business that now comprises our business was operated through a combination ofwholly-owned subsidiaries and operations of Dow, including through AgroFresh Inc. in the United States.
In December 2017, AgroFresh acquired a controlling interest in Tecnidex, a leading provider of post-harvest fungicides, waxes, and biocides for the citrusmarket. With this acquisition, AgroFresh expanded its industry-leading post-harvest presence into additional crops and increased its penetration of theproduce market in southern Europe, Latin America and Africa.
For over 35 years, Tecnidex has been helping fruit and vegetable producers offer clean, safe and high-quality products to customers in 18 countries. Throughits portfolio of post-harvest products, technology, consulting, and after-sale services, Tecnidex improves the quality and value of its clients’ fruit andvegetables while respecting the environment. Tecnidex is based in Valencia, Spain, one of the largest citrus producing regions in the world.
In December of 2017, AgroFresh invested approximately $10 million for an approximate 15% ownership stake in and entered into a commercial agreementwith FFT, provider of the award-winning It’s Fresh! ethylene removal filters in North America, Europe, the Middle East and Africa (“EMEA”) and LatinAmerica. The proprietary active ingredient of It’s Fresh! has been found to be 100 times more powerful than any other ethylene-absorbing substances,providing a powerful tool to preserve food freshness. Through our commercial agreement with FFT, AgroFresh can market It’s Fresh! for high value cropssuch as berries, stone fruit, avocados, tomatoes and cherries, and open up new opportunities to address food waste in retail. As It's Fresh has recently shiftedits strategic focus away from retailers to growers and packers, AgroFresh will be reviewing the extensive R&D work it has conducted to determine how thetechnology can be adapted for the needs of these segments of the market and determine the best path forward for the commercial agreement.
On April 9, 2018, the Company acquired the assets of Comm-n-Sense Corp., d/b/a Verigo ("Verigo"). The acquisition of Verigo was important to thedevelopment of the Company's FreshCloud platform, which introduces a new level of data insights to the produce market from plant physiology to supplychain optimization, which can augment our existing portfolio of treatments and technical advisory services.
We are subject to extensive national, state and local government regulations. We have completed more than 400 comprehensive international health andenvironmental tests that have shown the AgroFresh family of products, including SmartFresh and Harvista to be safe for consumers, workers, and theenvironment. 1-MCP, the active ingredient in the AgroFresh products is metabolized by the natural processes in fruits and leaves no residue. The AgroFreshproducts have been approved by over 50 authorities including the U.S. Environmental Protection Agency and the European Commission.
4

Table of Contents
Competitive Strengths We believe that the following strengths differentiate us from our competitors and serve as the foundation for our continued growth: Leading Agricultural Innovator and Solutions Provider with Proprietary Technical Know-How. AgroFresh has been at the forefront of fresh producepreservation solutions since our inception. Our research and development team include over 40 scientists, about half with advanced degrees, who are leadersin the fields of plant physiology. Beginning with our creation of the commercial market for 1-Methylcyclopropene (“1-MCP”) applications for use in thepreservation of apples, we have produced an extensive and exclusive database of produce physiology and consumer preferences. Building on our proprietarytechnical knowledge, we have developed an intellectual property portfolio, including over 500 granted and pending patents, that has enabled us to providecomprehensive and innovative solutions to a global customer base. SmartFresh delivers a substantial improvement in storage solutions for apples, pears, andother crops, allowing for significantly less waste and greater productivity, as well as a constant supply of high-quality fruit throughout the year. In the U.S.,we estimate that 90% of stored apples are treated with 1-MCP, and our SmartFresh technology continues to enjoy a strong leadership position in thistreatment protocol. Extending our record of innovation in the post-harvest market, we entered the near-harvest market with the introduction of Harvista whichextends the ideal harvest window for apples and pears, and increases production yields for cherries and blueberries to improve harvest management andenhance fruit quality. The commercialization of Harvista was followed by our introduction of RipeLock, an innovative fruit quality management system forbananas, offering flexibility and consistency to retailers to deliver bananas at a yellow color and ripeness preferred by consumers. Building on this success,we entered the fungicide market with ActiMist and subsequently enhanced our fungicide portfolio with the acquisition of Tecnidex in 2017. Our recentlaunch of FreshCloud is the latest milestone in our new product innovation. With the FreshCloud platform, we expect to be able to provide customers realtime insights about the condition of their fruit using novel monitoring technologies.
Diversified Global Presence Across All Major Growing Regions. We have established a global footprint with key products approved in over 50 countriesthat supports approximately 3,900 direct customers and serves over 25,000 storage rooms globally. Our top ten customers represent less than 15% of theCompany's total revenue, a sign of the strength and resilience of our business. The Company's global commercial platform is unique in the post-harvestindustry, positioned across six continents, bringing a full suite of AgroFresh solutions and high-touch advisory services to customers in every key produce-growing region. Our ability to deliver an in-depth of technical service and products across every major continent is a fundamental competitive advantage inour pursuit of capturing growth opportunities. We believe our global footprint provides not only a platform for growth but also greater diversification. Ourparticipation in a wide range of markets protects the business from crop size fluctuations in any particular market. For the year ended December 31, 2018,EMEA, North America, Latin America and Asia Pacific (including China and India) represented 52%, 24%, 15% and 9% of sales, respectively. Theacquisition of Tecnidex meaningfully contributed to our global diversification.
Service-Oriented Business Model Creates Sustainable Competitive Advantages. AgroFresh’s direct service model provides better margins than the industryaverage, and comprises not only product applications but also mission-critical technical advisory services. Our sales and technical support personnelmaintain direct interaction with our customers in areas of contract negotiations and overall customer service. Furthermore, we currently have 40 dedicatedresearch and development scientists, about half with advanced degrees, working across seven global AgroFresh locations, numerous research institutes, andcustomer sites. This infrastructure has allowed us to amass a proprietary database of technical data of plant physiology collected across our 20+ year history.In 2018 alone, we made over 38,000 monitored applications of SmartFresh. Our proprietary database gives us unique insights into the causes of producespoilage for various crops varieties in different regions as well as best practices for the effective use of SmartFresh. As a result, our local sales and technicalservice teams are best positioned to provide bespoke advice and solutions, giving our customers “peace of mind” between and during harvest season.
We believe FreshCloud can further bolster our integrated offerings with the addition of data-backed solutions for the monitoring of produce quality acrossthe supply chain. FreshCloud is designed to deliver timely, predictive insights that will ultimately help our customers improve efficiency and enhanceproduce freshness. We believe that our direct service model, extensive technical know-how, and brand loyalty differentiate us from competitors and sustainour competitive strengths.
Strong Momentum and Growth Opportunities across the Produce Supply Chain. We believe there are significant growth opportunities to expand anddiversify our business, supported by our track record of new product introductions, market penetration, and mergers and acquisition (“M&A”) execution. Onekey initiative is increased penetration of existing technologies in current and new geographic markets. While many apple growers and packers in the U.S.have adopted SmartFresh, there is potential for further growth. The market penetration of apples treated with SmartFresh has been growing internationally butremains below the levels achieved in the U.S. In recent years, we have concentrated our efforts on
5

Table of Contents
accelerating penetration of SmartFresh in other crops like pears outside of the U.S. SmartFresh is also effective on crops such as plums, kiwifruit, persimmonsand avocados. Harvista is another key product where we are actively working to expand geographic adoption. As of December 31, 2018, Harvista is registeredin seven countries and we are currently working to obtain registrations in ten additional countries. Recently, we received regulatory approval to applyHarvista to cherry crops in the U.S. and to blueberries in Chile and our team is working to achieve similar registrations in other markets. The main limitationto accelerated growth of Harvista is the long regulatory approval cycle in important markets like the European Union and Brazil.
In North America, we are partnering with Del Monte to increase the adoption of RipeLock at the retail level. RipeLock is currently used in approximately1,800 grocery stores, and we believe that Del Monte’s extensive retail distribution network will prove invaluable in expanding RipeLock’s market share. Wehave further augmented our crop solutions portfolio through our 2017 acquisition of Tecnidex. Tecnidex successfully strengthened our product portfolio byadding fungicides, sanitizers, waxes, and coatings, diversified our crop exposure, reduced revenue seasonality, and provided new growth opportunities viacross-pollination of Tecnidex technologies for AgroFresh core fruit categories. As a result of all these initiatives, we have successfully diversified ourproportion of sales attributable to apples from nearly 90% in July 2015 down to approximately 70% as of December 31, 2018.
Building on these growth initiatives, we are continuously leveraging our research and development (“R&D”) capabilities to commercialize new products forcurrently unserved markets. In addition to our internally-developed R&D, M&A is another key strategy to enhance our value proposition to drive growth.Our recent acquisition of Verigo adds to the FreshCloud platform the ability to provide Transit Insights and enables us to incorporate our proprietary produceknowledge into a complementary data service offering. FreshCloud introduces a whole new level of data insights to the produce market from plantphysiology to supply chain optimization, which can augment our existing portfolio of treatments and technical advisory services. Utilizing our globalfootprint and extensive research and development capabilities, we will seek to continue to expand the business through further penetration, increasedapplicability of existing products, and the commercialization of new preservation solutions.
Long-Standing Relationships with Highly Diverse Customer Base. We believe our direct service model coupled with our proprietary solutions have helpedus develop deep, trusted and long-tenured relationships with a diverse array of global customers including packers, growers, and retailers. For more than adecade, we have operated a large team of commercial and technical experts located in key geographies around the world to provide on-site and bespokeadvisory services. This infrastructure helps us maintain intimate and consistent interaction with our customers throughout the year to understand all aspectsof harvest operations, address a variety of customer-specific issues, and ultimately improve the economics for growers, packers, and retailers across the supplychain. As a result of our unique service model and comprehensive solutions, we have cultivated over 3,900 direct customer relationships in more than 50countries with no single customer representing more than 10% of total sales. We have also started some strategic customer relationships as a way to penetratenew geographies and markets. An example is our collaboration with Pagoda, the largest fruit retailer in China, where we plan to open an innovation centertasked with developing solutions to extend freshness specifically to meet the unique needs of the Chinese supply chain.
High Profit Margins, Strong, and Consistent Cash Flow Generation. Our technical expertise, long-standing customer relationships, and asset-light businessmodel drive attractive, sustainable profit margins. For the year ended December 31, 2018, we generated gross margins and EBITDA margins of 74% and 30%,respectively1. In addition, we employ an “asset-light”, outsourced production model. We use a single third-party manufacturer for our key active ingredient,1-MCP, under a long-term contract with strict confidentiality obligations, to manufacture, and several other suppliers to formulate products and providepackaging services. For the manufacturing of waxes, sanitizers, and equipment servicing the citrus market, we have a combination of a manufacturing plantand several suppliers to formulate products and assemble equipment. As a result, our manufacturing footprint requires minimal capital investment andmanufacturing personnel. For the year ended December 31, 2018, capital expenditures were $3.3 million, or 1.9% of net sales. Our attractive margin profilecoupled with our asset-light solutions result in free cash flow generation, which will be used to reinvest in the business and repay debt.
Strong Management Team with Deep Industry Experience. Our management team has extensive food, agricultural and chemical industry experience and aproven track record of bringing innovative, value-added solutions to customers and markets around the world. The Company’s management team boasts over125 years of combined relevant industry experience and is led by Jordi Ferre, our chief executive officer, who has over 25 years of experience in global foodoperations and manufacturing.
1 EBITDA margin is a non-GAAP measure. See “Management’s Discussion and Analysis of Financial Condition and Results of Operations” in Item 7 of this Annual Report onForm 10-K for more information, and for a reconciliation of EBITDA to net income (loss).
6

Table of Contents
During the past several years, our management team has effectively launched new products, established new partnerships across the supply chain andcompleted successful acquisitions of Verigo and majority control of Tecnidex. Following a period of gradual transition from Dow's operating systems, ourmanagement team has also successfully transitioned the Company onto a fully autonomous enterprise resource planning system, completing the finalmilestone in our establishment as a fully operational, independent company. Supported by a deep bench of professionals and a track record of execution, webelieve our management team has the vision, expertise, and experience to position us for continued success and to implement our business and growthstrategies.
Industry Overview Food Preservation and Freshness According to the FAO, over 1.3 billion tons of food, or approximately one third of the total food produced worldwide, is lost to spoilage or waste each year,including food valued at an estimated $48.3 billion in the U.S. alone. An October 2013 TESCO Consumer Study found that nearly 45% of all fresh fruits andvegetables, including 40% of apples and 20% of bananas, are lost to spoilage. Loss or shrinkage along the food supply chain has a variety of causes,including degradation of fresh produce during storage and transportation.
Food waste is a major economic cost for retailers. A large percentage of food waste at the retail level is based on qualitative factors related to consumerperception of freshness. A consumer survey conducted by Oliver Wyman and Ipsos Interactive in the U.S. in 2007 indicated that freshness is the mostimportant driver of customer satisfaction with a store’s produce department. Near-Harvest Treatments Near-harvest treatments commonly used to increase the value of crops and reduce harvest losses include the use of“plant growth regulators” (“PGRs”). PGRs influence the rate of growth or development of crops or affect their reaction to stress events such as harsh weather.PGRs interact with the biochemical make-up of the plant and work by mimicking or blocking the production of naturally occurring plant hormones, likeethylene. Blocking the production of ethylene allows a grower to slow down the maturation of fruit to achieve better control over the timing of harvest. PGRshave a range of effectiveness depending on factors such as environmental conditions and the timing of application. We consider applications in the orchardas “near-harvest” since they are applied right before the fruit is harvested and have synergistic effect with our post-harvest solutions. Post-Harvest Treatments Post-harvest treatments to maximize quality and reduce loss include treatments to manage the effects of ethylene and to prevent microbial contamination.Naturally occurring ethylene triggers the acceleration of ripening in certain crops which results in a reduction of post-harvest life.
One class of post-harvest treatments enhances quality and reduces losses by controlling the environment in which produce is stored. Controlled Atmosphere("CA") and Dynamic Controlled Atmosphere (“DCA”) systems are used to keep stored crops within their optimal ranges of temperature and levels of oxygenand carbon dioxide. Specific oxygen and carbon dioxide levels can lower respiration in fresh produce and delay ripening. CA systems have been used formany decades with fruits and vegetables to preserve freshness. DCA, a more recent innovation, seeks to adjust levels of oxygen and carbon dioxidedynamically as the produce in storage breathes and matures. CA and DCA are only effective at preserving freshness while the fruit is kept in cold storage.However, 1-MCP treatments have been found to be complementary to these technologies by helping to better maintain the quality of apples and pears duringcold storage and maintaining freshness for up to 90 days after they are removed from cold storage. Our Business We are an agricultural innovator in proprietary advanced technologies that enhance the freshness, quality, and value of fresh produce. We currently offerSmartFresh applications at customer sites predominately through a direct service model utilizing third-party contractors. We also provide advisory servicesbased on our extensive knowledge on the use of 1-MCP collected through thousands of monitored applications done as a part of the service model. Ourpricing to customers is based on the service provided, not on the product sold. We operate in over 50 countries and derive the majority of our revenueworking with customers to protect the value of apples, pears and other produce during storage. We offer Harvista in the U.S., Argentina, Turkey, Israel, Chileand South Africa. LandSpring is being marketed primarily in the U.S. and RipeLock is being marketed mainly in the U.S., Europe and Australia. ActiMist waslaunched in the U.S. and is being expanded into other countries subject
7

Table of Contents
to regulatory approval. Line extensions and new services are planned for introduction to seek to strengthen our global position in post-harvest storage and tocapitalize on adjacent growth opportunities in near-harvest markets.
AgroFresh has extended its post-harvest leadership with the acquisition of Tecnidex, a leading provider of fungicides, sanitizers, waxes, and coatingsprimarily focused on the citrus market. For over 35 years, Tecnidex has been helping fruit and vegetable producers offer clean, safe and high-quality productsto customers in 18 countries with particular strength in the Mediterranean region. Tecnidex brought a broad catalogue of solutions that enhanced ourfungicide offering, ActiMist, an innovative delivery system of foggable fungicides. Our fungicide offerings further diversify our revenue by expanding ourability to provide solutions and service to the citrus industry.
1-MCP, the active ingredient in SmartFresh, LandSpring, Harvista and RipeLock, is an ethylene action inhibitor with a proven ability to maintain freshnessand extend the shelf life of certain fresh produce. The 1-MCP molecule is structurally similar to ethylene, a naturally occurring plant hormone that occurs incertain fruits and vegetables. Ethylene helps produce grow and ripen, but eventually causes over-ripening and spoilage. 1-MCP works by blocking theethylene receptors in plant cells, which temporarily delays the ripening process, enabling the produce to better maintain the qualities associated withfreshness.
Fruits and vegetables are classified as climacteric or non-climacteric, a term referring to the process of fruit maturation. The climacteric event is a stage of fruitripening associated with higher ethylene production and changes in the fruit including pigment changes and sugar release. The climacteric event marks thepeak of edible ripeness, with fruits having the best taste and texture for consumption. The role of SmartFresh is to delay the onset of the climacteric stageuntil the product is ready for consumption. Apples, pears, kiwifruit, plums, persimmon, bananas, melons, peaches, and tomatoes are examples of climactericfruit. The Company continues to evaluate the commercial value of 1-MCP with a range of other climacteric fruit.
SmartFresh Value Proposition
SmartFresh, our current principal solution, preserves the texture, firmness, taste and appearance of produce during storage, transportation and retail display. Itallows growers and packers to deliver “just harvested” freshness on a year-round basis and enables retailers to increase customer satisfaction with fresh, highquality produce. An integral part of the SmartFresh value proposition is a direct service model providing customers with on-site applications of SmartFresh attheir storage facilities together with mission-critical and value-added advisory services.
The value of SmartFresh with any crop is determined by both the biological efficacy with that crop and the utility value the application delivers to thecustomer. The biological efficacy with apples is high; apples are sensitive to ethylene and SmartFresh is effective at delaying ripening. In addition,SmartFresh brings high utility value by helping to keep apples fresh year-round despite their limited harvest window. This has resulted in the widespreadadoption of SmartFresh by apple growers and packers throughout the world. The cost of SmartFresh translates into less than one cent per pound of apples,which is small relative to both the value of the crop and the importance of maintaining the quality of that crop during storage. Retail prices of apples in theU.S. typically range from $1.30-$4.50 per pound depending on the variety. The use of SmartFresh gives growers and packers the ability to store apples fromone season to the next without losing their just picked quality characteristics.
Beneficial effects of SmartFresh have been proven across numerous apple varieties throughout the world. SmartFresh is also effective with other crops that arehighly sensitive to ethylene, including pears, kiwifruit, plums, persimmons, avocados, and flowers, the latter marketed under the EthylBloc brand namethrough two strategic partners that have a strong position in the global flower market.
AgroFresh’s business historically has been highly seasonal, driven by the timing of apple harvests in the northern and southern hemispheres. The first half ofthe year is when the southern hemisphere harvest occurs, and the second half of the year is when the northern hemisphere harvest occurs. Since the northernhemisphere harvest of our two core crops of apples and pears is typically larger, a significant portion of our sales and profits are historically generated in thesecond half of the year. In addition to this seasonality, factors such as weather patterns may impact the timing of the harvest within the two halves of theyear. Crop diversification is an important way to achieve balanced revenues across the year, and the ability to service the citrus segment provides anopportunity for the Company to increase revenue in the fourth and first quarters, which are the two strongest quarters for citrus crops. Our recent acquisitionof a controlling interest in Tecnidex and an increased presence in the citrus category should moderately reduce the current concentration of sales in thesecond half of the year. SmartFresh Service Model We believe that we have developed deep, trusted relationships with our customers by combining our effective SmartFresh product with application expertiseand trusted advisory services. Over the past decade we have amassed a valuable proprietary database of technical information on the best practices for theeffective use of SmartFresh on a wide range of apple and pear
8

Table of Contents
varieties, since each fruit and fruit variety requires a different treatment protocol. The advisory services component utilizes this information to help maximizethe profitability of our customers’ operations. Harvista Complementing our post-harvest solutions, Harvista is used for near harvest management of pome fruit, apples, pears, cherries and blueberries. Our Harvistaproduct line includes proprietary 1-MCP formulations that are specifically designed to slow ripening, reduce fruit drop, and hold fruit on the tree longer topromote better color and fruit size, thereby bringing new benefits to the grower. With maximum flexibility in application timing, it extends the harvestwindow by allowing growers to factor in ever-changing weather conditions and labor availability, providing peace of mind. We have found that thecombination of Harvista in the orchard and SmartFresh in the storage room results in improved fruit quality metrics compared to use of eitherproduct individually.
Harvista extends the “ideal harvest window,” for up to an additional 14 days. This added flexibility creates significant benefits both in terms of harvestlogistics and crop profitability. Widening the harvest window allows for better scheduling and the optimization of limited resources, such as harvest crewsand equipment. Overall, the value of the crop is enhanced by bigger average fruit size, better color, and fewer defects.
We offer Harvista for apples, pears, cherries and blueberries through a pre-scheduled application service including aerial and/or ground applications.Typically, our technical staff designs the protocol in consultation with the customer, and either a third-party service provider or the customer makes theapplication.
Harvista is currently available in the U.S., Canada, Turkey, Argentina, Israel, Chile, Australia, and South Africa, and the Company is currently compiling datafor registrations in ten more countries, which are expected to be granted on a country by country basis over the next five years. In 2017, we receivedregulatory approval to apply Harvista to cherries in the U.S. and blueberries in Chile. Additional registrations and label expansions are expected to bepursued as new formulations and/or crop concepts are validated.
RipeLock For many crops, a significant amount of shrinkage occurs at retail. This includes bananas, the largest retail fruit category. According to data from the Journalof Consumer Affairs and United Nation’s Food and Agriculture Organization, it is estimated that 12-16% of banana loss occurs after the fruit reaches thegrocery store. Our RipeLock Quality System is a retail solution to improve the quality and consumer appeal of bananas. RipeLock is an innovative fruitquality management system specifically designed for the banana industry. RipeLock enables retailers to offer consumers bananas that are in better conditionand maintain the consumer-preferred color and firmness longer, reducing waste and increasing sales. The patented RipeLock system combines a specially-engineered, micro-perforated form of Modified Atmosphere Packaging (“MAP”) and our proprietary 1-MCP formulation. The combination of MAP with 1-MCP provides greater control over the ripening progression of bananas during shipping, distribution, on and display. We believe that bananas handled withRipeLock technology retain their bright-yellow color, firm texture, fresh taste, and appealing look for approximately another 4-6 days versus untreatedbananas. As a result, RipeLock maximizes the marketable “yellow life” of the fruit, providing economic benefits to brand owners and retailers.
FreshCloud
To continue to evolve and increase the value we provide to our customers, we recently launched our FreshCloud suite of produce monitoring and screeningsolutions. FreshCloud Storage Insights combines proprietary sensor technology and data analytics in the storage room to offer customers real-time access tounique insights into the condition of their stored fruit. FreshCloud Predictive Screening predicts the risk of disorder development during storage byanalyzing gene expression at commercial harvest, resulting in more informed storage management decisions. FreshCloud Transit Insights combines sensortechnology and proprietary algorithms to provide insights as to the condition and quality of fruit during transit.
LandSpring
LandSpring technology is a PGR for use on seedlings to help them withstand transplanting and other stresses encountered in the field. LandSpring suppressesthe ethylene signals that would prompt a stress event in the seedling and reduce growth. Among the number of protective benefits, this technology makesseedlings less sensitive to stresses such as heat, cold, UV radiation, drought, flooding and salinity that often occur after planting. When applied beforetransplanting, LandSpring results in greater plant vigor and a healthier crop that is better able to withstand adverse environmental conditions and givegrowers the opportunity to increase yield.
9

Table of Contents
Marketing and Sales
Our success depends on our ability to attract and develop the talent to effectively implement our strategy. In 2018, AgroFresh changed its organizationalstructure and leadership team to support its strategic growth and diversification objectives. The goal of the organizational change was to consolidate theCompany’s core business units under a global general manager while adding leadership and focus to accelerate new business development activities. Overthe past year, we have been strengthening and deepening our management organization. In 2018, we hired a vice president and global general manager tolead our post-harvest offerings and a director of global retail solutions to lead the RipeLock commercial opportunities.
The Company's core post-harvest business includes solutions designed to improve the yields of growers and packers. These solutions include SmartFresh,ActiMist, FreshCloud Storage Insights, FreshCloud Predictive Screening and a large range of fungicides, waxes, and coatings, marketed under the brandsTextar and Teycer, respectively.
Integration of Tecnidex progressed very well in 2018, with all functional departments now aligned with AgroFresh’s global structure, includingconsolidation of all sales teams, and we are preparing to implement SAP across the Tecnidex organization in the second quarter of 2019.
The technical sales support group supports the sales team and runs customer-specific trials for local crop varieties or specialized storage and distributionconditions and conducts follow-up with customers. This team works closely with customers to provide advice on appropriate protocols for SmartFresh,Harvista and other product applications depending on crop, variety, region, and climatic conditions. The technical sales support group draws on ourextensive knowledge base of 1-MCP applications across all regions and conditions.
Marketing and communications functions are organized on a global and regional basis. The regional teams manage the core post-harvest business'smarketing needs, while the Global marketing department is responsible for corporate brand stewardship and communications, as well as serving as a center ofexcellence to support all product launches, advertising and trade shows. The teams reach out to customers to keep them up to date on the latest research andnews about AgroFresh products. Market research, including product penetration, collecting competitive intelligence and tracking other relevant market andindustry information, is managed globally in conjunction with the regional teams. No single customer accounted for more than 3% of net sales in 2018, 2017, or 2016. Competition We estimate the size of the core post-harvest market to be approximately $500 million on a global basis. The post-harvest solutions offered include 1-MCP-based solutions, fungicides and coatings, representing approximately 36%, 20% and 24% of the total market, respectively. The market for the use of 1-MCPis evolving and we have faced growing competition since the expiration of the 1-MCP use patent in 2014. We estimate that citrus applications representapproximately 60% of the total core post-harvest market, which is why we are focused on seeking to grow in this important crop segment. The market forpost-harvest solutions is fragmented with various regional suppliers. Including AgroFresh, there are three leading providers with global reach that account forabout two thirds of global post-harvest sales. Other regional players, mainly in citrus, account for approximately another 20% of post-harvest sales. Other keyplayers in the post-harvest industry include fungicide suppliers such as Syngenta and Janssen PMP who hold post-harvest registrations of fungicidespreviously approved for pre-harvest applications. In the near-harvest segment, ReTainTM is a competitive technology to Harvista that is offered by Valent inall regions except for the European Union. We believe that the principal factors of competition in our industry include reputation, product quality, customerservice and customer intimacy, product innovation, technical service and value creation. We believe that we compete favorably with competitors on the basisof these and other factors. See the subsection titled “Competitive Strengths” above.
Research and Development Research and development plays an important role at AgroFresh in supporting customers as well as developing line extensions and new products. Researchand development is a truly global function with less than half of our R&D resources are located in facilities in North America, with the remainder across theother regions. Approximately 30% of our research and development resources are third-party contractors. During fruit harvest times (August to November inthe Northern Hemisphere and late January to early May in the Southern Hemisphere), we hire additional third-party contract scientists to assist AgroFresh inthe execution of experiments involving Harvista, SmartFresh, and FreshCloud technologies. Most of the regional research and development facilities focuson business aligned research and development initiatives to develop line extensions and create new products. Research and development makes use of corecompetencies in a number of technical areas including post-harvest
10

Table of Contents
physiology, analytical chemistry, regulatory sciences, regulatory affairs, formulation science, formulation process development, organic chemistry, anddelivery systems. Initiatives focused on next generation solutions utilize expertise in material science, molecular biology, post-harvest pathology,diagnostics and sensor technology. Intellectual Property We are a technology-based solutions provider and, as such, rely on a combination of important intellectual property strengths, including licenses, patents,trademarks, copyrights and trade secret protection laws to protect our proprietary technology and intellectual property. We enter into confidentialityagreements with our employees, consultants, customers, service providers and vendors that generally provide that any confidential or proprietary informationdeveloped by us or on our behalf be kept confidential including, but not limited to, information related to our proprietary manufacturing process andSmartFresh service model. In the normal course of business, we provide our intellectual property and/or our products protected by our intellectual property tothird parties through licensing or restricted use agreements.
We obtained an exclusive license from North Carolina State University under the Sisler patent (U.S. 5,518,988) for the use of 1-MCP to delay ripening of fruitand flowers. This patent has expired in the United States and Europe and continues only in Japan until May of 2020. We also acquired the Daly patent (U.S.6,017,849) for the encapsulation complex of 1-MCP and alpha-cyclodextrin, used as the foundational component in SmartFresh and Harvista. Depending onthe country, SmartFresh is currently protected by a patent for the encapsulation complex through 2019. Today a majority of our SmartFresh applications useProTabsTM, an application method patented through 2022, and we continue to invest in application technologies as a means to continue to facilitate an evenbetter service to our customers. We have also generated an impressive portfolio of intellectual property with over 30 patents granted in at least one country(pending in other countries) covering 1-MCP and next generation technologies, most of which do not expire until 2025 or beyond. RipeLock and Harvistaformulations are patent protected through at least 2027. Regulation and Compliance We are subject to extensive national, state and local government regulation, and the Company has a regulatory team that we believe is best in class, whichleverages a global network of highly-experienced regulatory consultants. Through this network, we have successfully obtained registrations for SmartFresh,Harvista, RipeLock, and LandSpring in every country where the review process has been completed, and the registration process for Harvista continues inmany additional countries. We have completed more than 400 comprehensive international health and environmental tests that have shown the AgroFreshfamily of products, including SmartFresh and Harvista are safe for consumers, workers, and the environment. 1-MCP, the active ingredient in the AgroFreshproducts, is metabolized by the natural processes in apples and other fruits and leaves no residue. The products have been approved by over 50 authoritiesincluding the U.S. Environmental Protection Agency and the European Commission. We do not anticipate any significant problems in obtaining futurerequired licenses, permits or approvals that are necessary to expand our business. We leverage our regulatory capabilities as we expand the fungicide productlines into new countries.
For a discussion of the various risks we may face from regulation and compliance matters, see “Risk Factors” in Item 1A of this report.
Employees As of December 31, 2018, we had approximately 285 full-time employees. None of our employees in North America are members of a union or subject to theterms of a collective bargaining agreement. In certain other countries where we operate (including Brazil, France, Germany, Italy, Netherlands and Spain),employees are members of unions or are represented by works councils. In addition, certain of our activities have been performed historically by seasonal andpart-time third-party contingent staff. Geographic Information Please see Note 16 to the audited consolidated financial statements for geographic sales information.
11
Table of Contents
Available Information Our website is at http://www.agrofresh.com. We make available free of charge, on or through our website, our annual report on Form 10-K, quarterly reportson Form 10-Q, current reports on Form 8-K and amendments to those reports, if any, or other filings filed or furnished pursuant to Section 13(a) or 15(d) of theSecurities Exchange Act of 1934, as amended (the "Exchange Act"), as soon as reasonably practicable after electronically filing or furnishing these reports tothe Securities and Exchange Commission ("SEC"). Information contained on our website is not a part of this Annual Report on Form 10-K. We have adopteda code of business conduct applicable to our employees including our principal executive, financial and accounting officers, and it is available free ofcharge, on our website’s investor relations page.
The SEC maintains an Internet site at http://www.sec.gov that contains our annual report on Form 10-K, quarterly reports on Form 10-Q, current reports onForm 8-K and amendments to those reports, if any, or other filings filed or furnished pursuant to Section 13(a) or 15(d) of the Exchange Act, and our proxyand information statements. All reports that we file with the SEC may be read and copied at the SEC’s Public Reference Room at 100 F Street, N.E.,Washington, DC, 20549. Information about the operation of the Public Reference Room can be obtained by calling the SEC at 1-800-SEC-0330.
12

Table of Contents
ITEM 1A. RISK FACTORS Ownership of our securities involves a high degree of risk. Holders of our securities should carefully consider the following risk factors and theother information contained in this report, including our historical financial statements and related notes included herein. Additional risks and uncertaintiesnot presently known to us, which we currently deem immaterial or which are similar to those faced by other companies in our industry or businesses ingeneral, may also impair our business or operations. If any of the following risks or uncertainties actually occur, our business, financial condition andoperating results could be adversely affected in a material way. This could cause the trading prices of our securities to decline, perhaps significantly, and youmay lose part or all of your investment. Risks Related to Our Business and Industry Increased competition in our industry can lead to pricing pressure, reduced margins or the inability of our products and services to achieve marketacceptance. We serve established and knowledgeable customers in the business of growing, storing and handling fresh produce and flowers. Key SmartFresh patents haveexpired or will expire over the next year. Actions by new or existing competitors, including introduction of competing products or services, promotions, combinations with other products or services,or price-cutting may lower our sales or require actions to retain and attract customers which could adversely affect our profitability. Increased competitionfrom existing or new competitors could result in price reductions, increased competition for materials, reduced margins or loss of market share, any of whichcould materially and adversely affect our business and our operating results and financial condition. For example, during 2017 and 2018, we decreased ourprices to defend market share against increased competition, and may be required to take similar actions in the future. In addition, if the prices at which our customers sell their products increase or decrease, the demand for our products or services may change. If the demand forour products or services decreases, there could be a significant impact on our business in the applicable location or region and a material adverse effect on ourrevenues and results of operations. Our relationship with our employees could deteriorate, and certain key employees could leave, which could adversely affect our business, financialcondition and results of operations. Our business involves complex operations and demands a management team and workforce that is knowledgeable and expert in many areas necessary for ouroperations. As a company focused on both research and development and customer service in the highly-specialized horticultural pre- and post-harvest fields,we rely on our ability to attract and retain skilled employees, consultants and contractors, including our specialized research and development and sales andservice personnel. As of December 31, 2018, we employed approximately 285 full-time employees, of which approximately 169 were members of ourresearch and development and sales and service teams. The departure of a significant number of our highly skilled employees, consultants or contractors orone or more employees who hold key regional management positions could have an adverse impact on our operations, including as a result of customerschoosing to follow a regional manager to one of our competitors. In addition, to execute our growth plan we must attract and retain highly qualified personnel. Competition for these employees exists; new members ofmanagement must have significant industry expertise when they join us or engage in significant training which, in many cases, requires significant timebefore they achieve full productivity. If we fail to attract, train, retain, and motivate our key personnel, our business and growth prospects could be severelyharmed. In addition, certain of our key full-time employees are employed outside the United States. In certain jurisdictions where we operate, labor and employmentlaws may grant significant job protection to employees, including rights on termination of employment. In addition, in certain countries where we operate(including Brazil, France, Germany, Italy, Netherlands and Spain), our employees are members of unions or are represented by works councils as required bylaw. We are often required to consult and seek the consent or advice of these unions and/or works councils. These laws, coupled with any requirement toconsult with the relevant unions or works councils, could adversely affect our flexibility in managing costs and responding to market changes and couldlimit our ability to access the skilled employees on which our business depends. In addition, certain activities of our business have been performed historically by seasonal and part-time third-party contingent staff. Changes in market andother conditions (including changes in applicable law) affecting employees and/or contingent staff could adversely impact the cost to our business ofmaintaining our employees and third-party staffing.
13

Table of Contents
We are subject to risks relating to portfolio concentration. Our business is highly dependent on a small number of products, primarily SmartFresh, based on one active ingredient, 1-MCP, applied to a limited numberof horticultural products. In 2018, we derived approximately 80% of our revenue working with customers using SmartFresh to protect the value of apples,pears, and other produce during storage. We expect these applications, products and active ingredients to continue to account for a large percentage of ourprofits in the near term. Our ability to continue to market and sell products containing this active ingredient in existing and new crop segments is importantto our future success. Our net sales and gross profit have historically been generated from one service platform but future growth in net sales and gross profit will likely dependon the development of new product and service platforms, geographic expansion and expansion into new applications. Net sales and gross profit may varysignificantly depending on our product, service, customer, application and geographic mix for any given period, which will make it difficult to forecastfuture operating results. Our net sales and gross profit vary among our products and services, customer groups and geographic markets. This variation will increase as we attempt toincrease sales into new geographies and applications, and as we diversify into other crops and introduce new product and service platforms. Net sales andgross profit, therefore, may differ in future periods from historic or current periods. Overall gross profit margins in any given period are dependent in large parton the product, service, customer and geographic mix reflected in that period’s net sales. Market conditions, competitive pressures, increased material orapplication costs, regulatory conditions and other factors may result in reductions in revenue or create pressure on the gross profit margins of our business ina given period. Given the nature of our business and expansion plans, the impact of these factors on our business and results of operations will likely varyfrom period to period and across products, services, applications and geographies. As a result, we may be challenged in our ability to accurately forecast ourfuture operating results. Acquisitions or investments may not yield the returns expected, which, in turn, could adversely affect our business, financial condition and results ofoperations. In December 2017, we completed the acquisition of a controlling interest in Tecnidex Fruit Protection, S.A.U., aleading provider of post-harvest fungicides, waxes and biocides for the citrus market. We expect to continue to selectively pursue strategic acquisitions, aswell as investments in technologies. Acquisitions present challenges, including geographical coordination, personnel integration and retention of keymanagement personnel, systems integration, the potential disruption of each company’s respective ongoing businesses, possible inconsistencies in standards,controls, procedures, and policies, unanticipated costs of terminating or relocating facilities and operations, unanticipated expenses relating to suchintegration, contingent obligations, and the reconciliation of corporate cultures. Those operations could divert management’s attention from the business,cause a temporary interruption of or loss of momentum in the business, and adversely affect our results of operations and financial condition. Acquisitions arean important source of new products and active ingredients, technologies, services, customers, geographies and channels to market. The inability toconsummate and integrate new acquisitions on advantageous terms could adversely affect our ability to grow and compete effectively. If Tecnidex or any other acquisitions or investments we have completed or may complete do not meet our expectations for any reason, we may not achieveour forecasted results. There can be no assurance that the pre-acquisition analyses and the diligence we conducted in connection with any acquisition orinvestment will uncover all material issues that may be present in a particular target business or investment, or that factors outside of the target business orinvestment and outside of our control will not later arise. In such event, we may be required to subsequently realize restructuring, impairment or other chargesthat could have a significant adverse effect on our business, financial condition and results of operations.
Furthermore, we might not be able to identify additional suitable acquisition or investment opportunities or obtain necessaryfinancing on acceptable terms and might also spend time and money investigating and negotiating with potential acquisition orinvestment targets but not complete the transaction.
Conditions in the global economy may adversely affect our net sales, gross profit and financial condition and may result in delays or reductions in ourspending that could have a material adverse effect on our business, financial condition and results of operations. Although demand for fresh horticultural products is somewhat inelastic in developed economies, the fresh produce and flower industries that we sell to can beaffected by material changes in supply, market prices, exchange rates and general economic conditions. Delays or reductions in our customers’ purchasing orshifts to lower-cost alternatives that result from tighter
14

Table of Contents
economic market conditions would reduce demand for our products and services and could, consequently, have a material adverse effect on our business,financial condition and results of operations. Our expansion depends on further penetration in existing markets and growth into new geographic markets, products, services and applications. Our growth depends on our ability to achieve further penetration into existing markets and expand into new geographic markets where there may be little orno knowledge of our brands or service offerings. There are significant differences in fresh produce handling practices from geographic region to region. If wecannot generate further penetration in existing markets or create brand awareness and successfully adapt our sales and distribution practices to new markets,this could have an impact on our ability to generate greater revenue. Expansion into new geographic markets will require us to establish our valueproposition for local fresh produce industries and to comply with new regulatory and licensing regimes. Longer registration lead times and a relativelyfragmented post-harvest infrastructure in certain jurisdictions could have a material adverse effect on our results of operations and prospects in those markets. Our growth also depends on our ability to apply current and future technologies to an expanded range of agricultural products. If the adoption of ourproducts and services by growers, packers, and retailers of these agricultural products is slower than anticipated, or if the prices that these customers arewilling to pay for our products and services are lower than anticipated, this could negatively impact our ability to increase revenue from current levels. Failure to manage our growth effectively using our existing controls and systems could harm our business, financial condition and operating results. Our existing management systems, financial and management controls and information systems may be inadequate to support our planned expansion.Managing any such growth effectively will require us to continue to enhance these systems, procedures and controls and to hire, train and retain managementand employees and to engage new material suppliers and service providers. We may not respond quickly enough to the changing demands that ourexpansion will impose on our management and existing infrastructure, which could harm our business, financial condition and results of operations. Failureto appropriately manage safety, human health, product liability and environmental risks could adversely impact employees, communities, stakeholders, theenvironment, our reputation and our business, financial condition and results of operations. We may be unable to respond effectively to technological changes in our industry, which could reduce the demand for our products. Our future business success will depend upon our ability to maintain and enhance our technological capabilities and develop and market products, servicesand applications that meet changing customer needs and market conditions in a cost-effective and timely manner. Maintaining and enhancing technologicalcapabilities and developing new products may also require significant investments in research and development. We may not be successful in developingnew products, services and technology that successfully compete or be able to anticipate changing customer needs and preferences, and our customers maynot accept one or more of our new products or services. If we fail to keep pace with evolving technological innovations or fail to modify our products andservices in response to customers’ needs or preferences, then our business, financial condition and results of operations could be adversely affected. We currently rely on a limited number of suppliers to produce certain key components of our products. We rely on unaffiliated contract manufacturers to produce certain key components of our products. There is limited available manufacturing capacity thatmeets our quality standards and regulatory requirements, especially for the manufacturing of the active ingredient, 1-MCP. Our 1-MCP needs are currentlysourced from a single qualified supplier, although we currently have sufficient safety stock to allow us to withstand a disruption in supply from that supplier.In addition, we have qualified a second supplier to provide our active ingredient in the event of a disruption from our current supplier. However, if we areunable to arrange for sufficient production capacity among our contract manufacturers or our contract manufacturers encounter production, quality, financial,or other difficulties, including labor or geopolitical disturbances, we may encounter difficulty in meeting customer demands as we seek alternative sources ofsupply, or we may have to make financial accommodations to such contract manufacturer or otherwise take steps to avoid or minimize supply disruption. Wemay be unable to locate an additional or alternate contract manufacturer that meets our quality controls and standards and regulatory requirements in a timelymanner or on commercially reasonable terms. Any such difficulties could have an adverse effect on our business, financial condition and results ofoperations, which could be material.
15
Table of Contents
In some jurisdictions, we rely on independent distributors to distribute our products. We rely in some jurisdictions on independent distributors to distribute our products and to assist us with the marketing, sale and servicing of certain of ourproducts. For example, we have entered into long-term distribution relationships for our products in China, Russia, Israel, Greece, South Korea, and Mexico.As a result, delivery of services and products in these jurisdictions relies on the performance of a small number of contractual counterparties, and in most ofthese countries we are not directly involved in sales and service provider relationships. We cannot be certain that our distributors will focus adequateresources on selling our products and services or be successful in selling them. Some of our distributors also represent or manufacture other, potentiallycompeting, agrochemical products. If we are unable to establish or maintain successful relationships with our distributors, we will need to further develop ourown sales and distribution capabilities, which would be expensive, time-consuming and possibly not as successful in achieving market penetration, whichcould have a material adverse effect on our results of operations, cash flows or financial condition. In addition, the distribution of our products could bedisrupted by a number of factors, including labor issues, failure to meet customer standards, bankruptcy or other financial issues affecting our third-partyproviders, or other issues affecting any such third party’s ability to meet our distribution requirements. The failure to properly perform by, switch to thecompetition or loss of, one or more of our distributors could have a material adverse effect on our business, financial condition and results of operations. Our intellectual property and proprietary rights are integral to our business. Our business and results of operations could be adversely affected if we fail toprotect our intellectual property and proprietary rights. Our success depends to a significant degree upon our ability to protect and preserve our intellectual property rights, including our patent and trademarkportfolio and trade secrets related to our proprietary processes, methods, formulations and other technology. Failure to protect our intellectual property rightsmay result in the loss of valuable technologies or impair our competitive advantage. We rely on confidentiality agreements and patent, trade secret andtrademark, as well as judicial enforcement of all of the foregoing to protect such technologies and intellectual property rights. In addition, some of ourtechnologies are not or will not be covered by any patent or patent application. With respect to our pending patent applications, we may not be successful insecuring patents for these claims, which could limit our ability to protect inventions that these applications were intended to cover. In addition, theexpiration of a patent can result in increased competition with consequent erosion of profit margins. As key SmartFresh patents have expired or will expire, if we are not able to achieve further differentiation of our products and services through patentedmixtures, new formulations, new delivery systems, new application methods or other means of obtaining extended patent protection, our inability to preventcompetitors from developing and registering similar products could have an adverse effect on our sales of such product. Our patents also may not provide uswith any competitive advantage and may be challenged by third parties. Further, our competitors may attempt to design around our patents. In some cases, we rely upon unpatented proprietary manufacturing expertise, continuing technological innovation and other trade secrets to develop andmaintain our competitive position. While we generally will enter into confidentiality agreements with our employees and third parties to protect ourintellectual property, our confidentiality agreements could be breached and may not provide meaningful protection for our trade secrets or proprietarymanufacturing expertise. In addition, adequate remedies may not be available in the event of unauthorized use or disclosure of our trade secrets ormanufacturing expertise. Violations by others of our confidentiality agreements and the loss of employees who have specialized knowledge and expertisecould harm our competitive position and cause our sales and operating results to decline as a result of increased competition. In addition, we rely on both registered and unregistered trademarks to protect our name and brands. Our failure to adequately maintain the quality of ourproducts and services associated with our trademarks or any loss to the distinctiveness of our trademarks may cause us to lose certain trademark protection,which could result in the loss of goodwill and brand recognition. In addition, successful third-party challenges to the use of any of our trademarks mayrequire us to rebrand our business or certain products or services associated therewith. We may be unable to prevent third parties from using our intellectual property and other proprietary information without our authorization or fromindependently developing intellectual property and other proprietary information that is similar to ours, or that has been designed around our patents,particularly in countries other than the United States. The unauthorized use of our intellectual property and other proprietary information by others couldreduce or eliminate any competitive advantages we have developed, cause us to lose sales or otherwise harm our business. If it becomes necessary for us tolitigate to protect these rights, any proceedings could be burdensome and costly, and we may not prevail. For example, in August 2016, we filed a lawsuitagainst MirTech, Inc. (“MirTech”), Decco U.S. Post-Harvest, Inc. (“Decco”) and certain related parties in the United States District Court for the District ofDelaware. Our complaint alleges, among other things, that MirTech, a former consultant to us, appropriated our confidential information and technology, inviolation of agreements between MirTech and us, and that
16

Table of Contents
MirTech and Decco are collaborating to infringe on several of our patents. Our complaint seeks, among other relief, declarations that we are the owner of anumber of patents filed by MirTech, injunctive relief to stop the infringement of our patents, and monetary damages. Although the Court ruled in June 2017that we are the owner of the main patent(U.S. Patent No. 9,394,216) and related technology at issue in the lawsuit, other aspects of that litigation continue.If we do not ultimately prevail in that or other litigation, our business could be materially adversely affected.
We may experience claims that our products infringe the intellectual property rights of others, which may cause us to incur unexpected costs or prevent usfrom selling our products or services. We continually seek to improve our business processes and develop new products and applications in a crowded patent space that we must continuallymonitor to avoid infringement. We cannot guarantee that we will not experience claims that our processes and products infringe issued patents (whetherpresent or future) or other intellectual property rights belonging to others. From time to time, we oppose patent applications that we consider overbroad or otherwise invalid in order to maintain the ability to operate freely in ourvarious business lines without the risk of being sued for patent infringement. If, however, patents are subsequently issued on any such applications by otherparties, or if patents belonging to others already exist that cover our products, processes or technologies, we could experience claims for infringement or haveto take other remedial or curative actions to continue our manufacturing and sales activities with respect to one or more products. Likewise, our competitorsmay also already hold or have applied for patents in the United States or abroad that, if enforced or issued, could prevail over our patent rights or otherwiselimit our ability to manufacture or sell one or more of our products in the United States or abroad. Any actions asserted against us could include payment ofdamages for infringement, stopping the use, require that we obtain licenses from these parties or substantially re-engineer our products or processes in order toavoid infringement. We may not be able to obtain the necessary licenses on acceptable terms, or at all, or be able to re-engineer our products successfully.Further, intellectual property litigation is expensive and time-consuming, regardless of the merits of any claim, and could divert our management’s attentionfrom operating our business. We license patent rights from third parties. If we are not able to enter into future licenses on commercially reasonable terms, if such third parties do notproperly maintain or enforce the patents underlying such existing or future licenses, or if we fail to comply with our obligations under such licenses, ourcompetitive position and business prospects could be adversely affected. We are a party to license agreements that give us rights to third-party intellectual property that may be necessary or useful for our business, and we may enterinto additional licenses in the future. If we are unable to enter into licensing arrangements on favorable terms in the future, our business may be adverselyaffected. In addition, if the owners of the patents we license do not properly maintain or enforce the patents underlying such licenses, our competitiveposition and business prospects could be harmed. Without protection for the intellectual property we license, other companies might be able to offersubstantially similar or identical products and/or services for sale, which could adversely affect our competitive business position and harm our businessprospects. If we fail to comply with our obligations under license agreements, our counterparties may have the right to terminate these agreements, in which event wemay not be able to develop, manufacture, register, or market, or may be forced to cease developing, manufacturing, registering, or marketing, any product orservice that is covered by these agreements or may face other penalties under such agreements. Such an occurrence could materially adversely affect the valueof the applicable ingredient or formulated products and/or services provided by us and have an adverse effect on our business, financial condition and resultsof operations. Seasonality, as well as adverse weather conditions and other natural phenomena, may cause fluctuations in our revenue and operating results. Historically, our operations have been seasonal, with a greater portion of total net revenue and operating income occurring in the third and fourth calendarquarters. Our customers’ crops are vulnerable to adverse weather conditions and natural disasters such as storms, tsunamis, hail, tornadoes, freezingconditions, extreme heat, drought, and floods, which can reduce acreage planted, lead to modified crop selection by growers and affect the timing and overallyield of harvest, each of which may reduce or otherwise alter demand for our products and services and adversely affect our business and results of operations.Weather conditions and natural disasters also affect decisions of our distributors, direct customers and end-users about the types and amounts of products andservices to purchase and the timing of use of such products and services. Delays by growers in harvesting can result in deferral of orders to a future quarter ordecisions to forego orders altogether in a particular growing season, either of which would negatively affect our sales in the affected period. As a result ofseasonality, any factors that would
17
Table of Contents
negatively affect our third and fourth quarter results in any year could have an adverse impact on our business, financial condition and results of operationsfor the entire year. Our products are highly regulated by governmental agencies in the countries where we conduct business. Our failure to obtain regulatory approvals, tocomply with registration and regulatory requirements or to maintain regulatory approvals would have an adverse impact on our ability to market and sellour products. Our pre- and post-harvest products are subject to technical review and approval by government authorities in each country where we wish to sell ourproducts. While there is a general international consensus on the data needed in order to evaluate the safety of agrochemical products before they can beplaced on the market (as evidenced, for example, by the standards and guidelines issued by the Organization for Economic Co-operation and Development),each country has its own legislative process and specific requirements in order to determine if identified risks are acceptable and can be managed in the localcontext and may be subject to frequent changes as new data requirements arise in response to scientific developments. The regulatory requirements to which we are subject are complex and vary from country to country. To obtain new registrations, it is necessary to have a localregistrant, and to understand the country’s regulatory requirements, both at the time an application for registration is submitted and when the registrationdecision is made, which may be several years later. A significant investment in registration data is required (covering all aspects from manufacturingspecifications through storage and transport, use, and, finally, disposal of unwanted product and used containers) to ensure that product performance (e.g., bioefficacy), intrinsic hazards and use patterns are fully characterized. Risk assessments are conducted by government regulatory authorities, who make the finaldecision on whether the documented risk associated with a product and active ingredient is acceptable prior to granting approval for sale. This process maybe prolonged due to requirements for additional data or internal administrative processes. There is a risk that registration of a new product may not beobtained or that a product label may be severely reduced, restricting the use of the product. If these circumstances arise, there is a risk that the substantialinvestments made in product development will not lead to the projected sales that justified the investment, and our business, financial condition and resultsof operations may be adversely affected by failure to obtain new registrations. Products that are already approved are subject to periodic review by regulatory authorities in many countries. Such reviews frequently require the provisionof new data and more complex risk assessments. The outcome of reviews of existing registrations cannot be guaranteed; registrations may be modified orcanceled. Since all government regulatory authorities have the right to review existing registrations at any time, the sustainability of the existing portfoliocannot be guaranteed. Existing registrations may be lost at any time, resulting in an immediate impact on sales. Furthermore, prior to expiration, it isnecessary to renew registrations. The renewal period and processes vary by country and may require additional studies to support the renewal process. Failureto comply could result in cancellation of the registration, resulting in an impact on sales. In addition, new laws and regulations may be introduced, or existing laws and regulations may be changed or may become subject to new interpretations,which could result in additional compliance costs, seizures, confiscations, recalls, monetary fines or delays that could affect us or our customers. For example,in accordance with a regulation of the European Parliament and of the Council of the European Union, in May 2014 the EU Commission proposed a List ofCandidates for Substitution (“CfS”), which included 1-MCP. In a subsequent press release published on January 27, 2015, the Commission clarified that thelist is neither a list of banned substances nor as a ranking of CfS, and that all active substances on the list will still be available on the market and are deemedacceptable, but could be substituted in time if a viable alternative becomes available. We have conducted studies, which have been submitted to theauthorities, to support our position that 1-MCP should be removed from the CfS list. Compliance with the prevailing regulations in countries in which we conduct business is essential. If we fail to comply with government requirements, wecould have registrations withdrawn immediately (loss of sales), suffer financial penalties (fines) and suffer reputational damage that could materially andadversely affect our business and our regulatory success in the future. If the data we supply to registration authorities is used by other companies to obtain their own product registrations, “generic” copies of products in ourportfolio could enter the market, and our business position could be adversely affected. In many countries, toxicity studies, data and other information relied upon by registration authorities in support of a product registration are granted “dataprotection” for a period of up to 15 years after the date upon which the data was originally submitted. In addition to the period of data compensability, thereis in many geographies an exclusive use period of ten years during which other companies may not legally cite our data in support of registrationsubmissions without our written permission. In some countries, there is also a period of time during which companies may cite another company’s data uponpayment of data compensation. In other countries, there is no legislation at all that effectively prevents third parties from citing our proprietary regulatorydata. Furthermore, after the exclusive use period and data compensation period have expired, as was
18

Table of Contents
the case with respect to our data in Europe in 2016 and in the United States in 2017, any third party would be free to cite our data in support of its registrationsubmissions. The possibility that third parties can use our registration data to obtain their own product registrations can adversely affect our business,financial condition and results of operations by facilitating the entry of “generic” copies of products in our portfolio into the market. Negative publicity relating to our products could reduce sales. Our success depends both on our customers’ perception of our products’ effectiveness and on end-consumers’ perception of the safety of our products. Wemay, from time to time, be faced with negative publicity relating to public health concerns, customer complaints or litigation alleging illness or injury,negative employee, staffing and supplier relationships or other matters, regardless of whether the allegations are valid or whether we are found to beresponsible. Given the global nature of the business, the negative impact of adverse publicity relating to one product or in one geographic region may extendfar beyond the product or the country involved to affect other parts of our business. The risk of negative publicity is particularly great with respect to theperformance of service providers because we are limited in the manner in which we can control them, especially on a real-time basis. The considerableexpansion in the use of social media over recent years can further amplify any negative publicity that could be generated by such incidents.
Customer demand for our products and our brand’s value could diminish significantly if we receive negative publicity or if customer confidence in us or ourproducts is otherwise eroded, which would likely result in lower sales and could have a material adverse effect on our business, financial condition andresults of operations. New information or a change in consumer attitudes and preferences regarding diet and health could result in changes in regulations and consumerconsumption habits, which could have an adverse effect on our business, financial condition and results of operations. Public awareness of, and concern about, the use of chemicals in food production has been increasing. Concerns about issues such as chemical residues infoods, agricultural worker safety and environmental impacts of agrochemicals (such as impacts on groundwater or non-target species, such as fish, birds andbees) could result in additional scrutiny of, or adversely affect the market for, our products, even when these products have been approved by governmentalauthorities. For example, such concerns could result in continued pressure for more stringent regulatory intervention and potential liability relating to healthconcerns arising from the use of our products in food preparation or the impact our products may have on the environment. These concerns could alsoinfluence public and customer perceptions, including purchasing preferences, the viability of our products, our reputation and the cost to comply withregulations, all of which could have a material adverse impact on our business. Some types of products that we manufacture have been subject to suchscrutiny in the past, and some categories of products that we produce are currently under scrutiny and others may be in the future. We may not be able toeffectively respond to changes in consumer health perceptions or to modify our product offerings to reflect trends in eating habits, which could have amaterial adverse effect on our business, financial condition and results of operations. Use of our current products is not compatible with “organic” labeling standards in all jurisdictions. As such, an increase in consumer preference for organicproduce could negatively affect the demand for our products or services. Similarly, a shift in consumer preferences away from fresh produce in favor of frozenor processed food products, or towards “seasonal” or locally grown produce, could negatively affect the demand for our products or services. We may be required to pay substantial damages for product liability claims or other legal proceedings. We may become involved in lawsuits concerning crop damage and product inefficacy claims, in addition to intellectual property infringement disputes,claims by employees, former employees or contingent staff, and general commercial disputes. Our insurance may not apply to or fully cover any liabilities wemay incur as a result of these lawsuits. We may face potential product liability claims for or relating to products we have sold and products that we may sell in the future. Since our products areused in the food chain on a global basis, any such product liability claim could subject us to litigation in multiple jurisdictions. Product liability claims,regardless of their merits or their ultimate outcomes, are costly, divert management’s attention, and may adversely affect our reputation and demand for ourproducts and may result in significant damages. We cannot predict with certainty the eventual outcome of pending or future product liability claims. Any ofthese negative effects could adversely affect our results of operations, cash flows, or financial condition. These risks exist even with respect to products thathave received, or may in the future receive, regulatory approval, registration, and clearance for commercial use. Unexpected quality or efficacy concerns canarise with respect to marketed products, whether or not scientifically justified, leading to product recalls, withdrawals, or declining sales, as well as productliability, personal injury and/or other claims.
19

Table of Contents
Our results of operations are subject to exchange rate and other currency risks. A significant movement in exchange rates could adversely impact ourresults of operations and cash flows. We conduct our business in many different currencies, primarily the U.S. dollar and the Euro. Accordingly, currency exchange rates affect our operatingresults. The effects of exchange rate fluctuations on our future operating results are unpredictable because of the number of currencies in which we conductbusiness and the potential volatility of exchange rates. We are also subject to the risks of currency controls and devaluations. Currency controls may limit ourability to convert currencies into U.S. dollars or other currencies, as needed, or to pay dividends or make other payments from funds held by subsidiaries inthe countries imposing such controls, which could adversely affect our liquidity. Currency devaluations could also negatively affect our operating marginsand cash flows. For example, if the U.S. dollar were to strengthen against a local currency, our operating margin would be adversely impacted in the countryto the extent significant costs are denominated in U.S. dollars while our revenues are denominated in such local currency. We operate in countries that haveexperienced hyperinflation in recent years, which amplifies currency risk. Our substantial international operations subject us to risks, including unfavorable political, regulatory, labor, tax and economic conditions in othercountries that could adversely affect our business, financial condition and results of operations. Currently, we operate, or others operate on our behalf, in more than 50 countries, in addition to our operations in the United States. We expect sales frominternational markets to represent an increasing portion of our net sales, and our acquisition of acontrolling interest in Tecnidex increased our operations outside of the United States. Accordingly, our business is subject to risks related to the differentlegal, political, social and regulatory requirements and economic conditions of many jurisdictions. Risks inherent in our international operations include, inaddition to other risks discussed in this section, the following:
• agreements may be difficult to enforce and receivables difficult to collect through a foreign country’s legal system;
• foreign customers may have increased credit risk and different financial conditions, which may necessitate longer payment cycles or result inincreased bad debt write-offs or additions to reserves related to our foreign receivables;
• foreign countries may impose additional withholding taxes or otherwise tax our foreign income, impose tariffs or adopt other restrictions on foreigntrade or investment, including currency exchange controls;
• there may be delays and interruptions in transportation and importation of our products;
• general economic conditions in the countries in which we operate, including fluctuations in gross domestic product, interest rates, market demand,labor costs and other factors beyond our control, could have an adverse effect on our net sales in those countries;
• our results of operations could be affected by political or economic instability on a country-specific or global level from various causes, includingthe possibility of hyperinflationary conditions, natural disasters and terrorist activities and the response to such conditions and events;
• we may experience difficulties in staffing and managing multi-national operations, and face the possibility of labor disputes and unexpected adversechanges in foreign laws or regulatory requirements, including environmental, health and safety laws and laws and regulations affecting export andimport duties and quotas;
• governmental policies, including farm subsidies, tariffs, tenders, and commodity support programs, as well as other factors beyond our control, suchas the prices of fertilizers, seeds, water, energy and other inputs, and the prices at which crops may ultimately be sold, could negatively influence thenumber of acres planted, the mix of crops planted and the demand for agrochemicals;
• compliance with a variety of foreign laws and regulations may be difficult; and
• we may be subject to the risks of divergent business expectations resulting from cultural incompatibility. We generally do not have long-term contracts with our customers or service providers. Many of our relationships with our customers are based primarily upon one-year agreements or individual sales orders. As such, our customers could ceasebuying products or services from us at any time, for any reason, with little or no recourse. If multiple
20

Table of Contents
customers or a material customer elected not to purchase products or services from us, our business prospects, financial condition and results of operationscould be adversely affected. Our traditional service model relies on short-term and long-term contracts with a large number of service providers who apply our products in mostjurisdictions for our customers. Service providers’ investment in the equipment necessary to provide services to customers is also minimal. As a result, serviceproviders with short-term contracts could cease providing services for us or provide services for a competitor upon relatively short notice. If multiple serviceproviders or a material service provider elected not to provide services on our behalf, our business, financial condition and results of operations could beadversely affected. Increases in costs or reductions in the supplies of raw materials we use in our manufacturing process could materially and adversely affect our results ofoperations. Our operations depend upon our or our contract manufacturers' obtaining adequate supplies of raw materials on a timely basis. We typically purchase ourmajor raw materials on a contract or as-needed basis from outside sources. The availability and prices of raw materials may be subject to curtailment orchange due to, among other things, the financial stability of our suppliers, suppliers’ allocations to other purchasers, interruptions in production by suppliers,new laws or regulations, changes in exchange rates and worldwide price levels. Additionally, we cannot guarantee that, as our supply contracts expire, wewill be able to renew them, or if they are terminated, that we will be able to obtain replacement supply agreements on terms favorable to us. Our results ofoperations could be adversely affected if the costs of raw materials used in our manufacturing process increase significantly. Joint development, distribution, manufacturing or venture investments that we enter into could be adversely affected by our lack of sole decision-makingauthority, our reliance on partners’ operational capabilities, strategic decisions and financial condition, and disputes between us and our collaboratingpartners. We have a limited number of joint development and distribution agreements, and may enter into new ones in the future. Investments through joint research,development, registration, manufacturing, distribution, or other joint entities (collectively “collaborations”) may, under certain circumstances, involve risksnot present were a third party not involved, including the possibility that collaboration partners might be sold, become bankrupt, fail to fund their share ofrequired investments, fail to meet collaboration milestones, elect to change strategy, make poor business decisions or block or delay necessary decisions.Collaboration partners may develop economic or other business interests or goals which could conflict and become incompatible with our business interests,and may be in a position to take actions opposed to our strategy and objectives. Disputes between us and our collaboration partners may result in arbitrationor litigation that would increase our expenses and distract our management team from focusing their time and effort on the business, or subject the projects,investments or facilities owned by the partnership or collaboration to additional risk. In addition, we may in certain circumstances be liable for the actions ofour collaboration partners, which could materially and adversely affect our business, financial condition and results of operations. We might require additional capital to support business growth, and this capital might not be available. We intend to continue to make investments to support our business growth and might require additional funds to finance our planned growth, includingstrategic acquisitions. Accordingly, we might need to engage in equity or debt financings to secure additional funds. If we raise additional funds throughissuance of equity securities, our existing stockholders could suffer significant dilution, and any new equity securities that we issue could have rights,preferences and privileges superior to those of holders of our common stock. Any debt financing secured by us in the future could involve restrictivecovenants relating to our capital-raising activities and other financial and operational matters, which might make it more difficult for us to obtain additionalcapital and to pursue business opportunities. Moreover, if we issue new debt securities, the debt holders would have rights senior to common stockholders tomake claims on our assets. In addition, we might not be able to obtain additional financing on terms favorable to us, if at all. If we are unable to obtainadequate financing or financing on terms satisfactory to us when required, our ability to continue to support our business growth and to respond to businesschallenges could be significantly limited. Our substantial level of indebtedness could materially and adversely affect our business, financial condition and results of operations. Upon consummation of the Business Combination on July 31, 2015, we incurred debt obligations in the form of a $425 million term loan and a $25 millionrevolving loan. The incurrence of this debt could have a variety of negative effects, including:
21

Table of Contents
• default and foreclosure on our assets if our operating revenues are insufficient to repay our debt obligations;
• acceleration of our obligations to repay the indebtedness even if we make all principal and interest payments when due if we breach certaincovenants that require the maintenance of certain financial ratios or reserves without a waiver or renegotiation of that covenant;
• our immediate payment of all principal and accrued interest, if any, if the debt security is payable on demand;
• our inability to obtain necessary additional financing if the debt security contains covenants restricting our ability to obtain such financing whilethe debt security is outstanding;
• our inability to pay dividends on our common stock; and
• using a substantial portion of our cash flow to pay principal and interest on our debt, which will reduce the funds available for dividends on ourcommon stock if declared, our ability to pay expenses, make capital expenditures and acquisitions, and fund other general corporate activities.
We are subject to credit risks related to our accounts receivable, and failure to collect our accounts receivable could adversely affect our results ofoperations and financial condition. The failure to collect outstanding receivables could have an adverse impact on our business, financial condition and results of operations. If the financialcondition of our customers were to deteriorate, resulting in an impairment of their ability to make payments, then we might be required to make additionalallowances, which would adversely affect our results of operations in the period in which the determination or allowance was made. Bad debt write offs wereless than 0.5% of revenues in each of 2018, 2017, and 2016. While we occasionally obtain letters of credit or other security for payment from customers or distributors, enforcing that security is a lengthy and expensiveprocess, and the eventual sale of the security may not ultimately cover the underlying trade receivable balance. Accordingly, we are not protected againstaccounts receivable default or bankruptcy by these entities. The current economic climate and volatility in the price of the underlying agriculturalcommodities could increase the likelihood of such defaults and bankruptcies. If a material portion of our customers or distributors were to become insolventor otherwise were not able to satisfy their obligations to us, we would be materially harmed. No single customer accounted for more than 10% of our consolidated net sales in 2018, 2017, or 2016. At December 31, 2018, December 31, 2017, andDecember 31, 2016, no individual customer accounted for greater than 10% of our consolidated accounts receivable balance. Failure to comply with the Foreign Corrupt Practices Act, or FCPA, and other similar anti-corruption laws, could subject us to penalties and damage ourreputation. We are subject to the FCPA, which generally prohibits U.S. companies and their intermediaries from making corrupt payments to foreign officials for thepurpose of obtaining or keeping business or otherwise obtaining favorable treatment and requires companies to maintain certain policies and procedures,including maintenance of adequate record-keeping and internal accounting practices to accurately reflect transactions. Certain of the jurisdictions in whichwe conduct business are at a heightened risk for corruption, extortion, bribery, pay-offs, theft and other fraudulent practices. Under the FCPA, U.S. companiesmay be held liable for actions taken by their strategic or local partners or representatives. Other jurisdictions in which we operate have adopted similar anti-corruption, anti-bribery, and anti-kickback laws to which we are subject. Our employees, distributors, dealers and agents may not always take actions that areconsistent with our policies designed to ensure compliance, particularly when they are confronted by pressures from competitors and others to act in a mannerthat is inconsistent with such policies. If we, or our intermediaries, fail to comply with the requirements of the FCPA, or similar laws of other countries,governmental authorities in the United States or elsewhere, as applicable, could seek to impose civil and/or criminal penalties, which could damage ourreputation and have a material adverse effect on our business, financial condition and results of operations. We rely heavily on information technology, and any material failure, weakness, interruption or breach of security could prevent us from effectivelyoperating our business. Our operations rely heavily on information systems for management of our supply chain, payment of obligations, collection of cash, credit and debit cardtransactions and other processes and procedures. Our FreshCloud product offerings rely particularly heavily on information systems for monitoring, datacollection and analysis. Our operations depend upon our ability to protect
22
Table of Contents
our information systems, many of which are located outside of our physical control, from failure, other catastrophic events, security breaches and other dataloss, including cyber-attacks. The disruption or failure of these systems to operate effectively could result in delays in customer service and reduce efficiencyin our operations. Breaches of our security measures or the accidental loss, inadvertent disclosure, or unapproved dissemination of proprietary information orsensitive or confidential information about us, our employees, former employees, customers or suppliers could result in legal claims or proceedings, damageto or inaccessibility of critical systems, operational disruptions and other significant costs, which could adversely affect our reputation, financial conditionand results of operations. We use hazardous materials in our business and are subject to regulation and potential liability under environmental laws. Our business is subject to a wide range of stringent laws and regulations that relate to the raw material supply chain, environmental compliance, disposal ofhazardous waste, and the manufacture, development, production, marketing and use of our products. As with any chemical manufacturing enterprise, there areinherent hazards associated with chemical manufacturing, and the storage and transportation of raw materials and our products. Exposure to hazardousmaterials, accidents or noncompliance with laws and regulations by us, the users of our products or our contract manufacturers, could disrupt our operationsor expose us to significant losses or liabilities.
Our suppliers or contract manufacturers may use hazardous materials in connection with producing our products. We may also from time to time sendwastes to third parties for disposal.
A failure to comply with the environmental, health and safety laws and regulations to which we are subject, including any permits issued thereunder, mayresult in environmental remediation costs, loss of permits, fines, penalties or other adverse governmental or private actions, including regulatory or judicialorders enjoining or curtailing operations or requiring corrective measures, installation of pollution control equipment or remedial measures. We could also beheld liable for any and all consequences arising out of human exposure to hazardous materials or environmental damage. In the event of a lawsuit orinvestigation, we could be subject to claims for liability for any injury caused to persons or property by exposure to, or release of hazardous materials orwastes related to our products. We may also be subject to claims associated with failure to warn users of our products of risks associated with our products.Further, we may be required to indemnify our suppliers, contract manufacturers, or waste disposal contractors against damages and other liabilities arising outof the production, handling, or storage of our products or raw materials or the disposal of related wastes. Such indemnification obligations could have anadverse effect on our business, financial condition and results of operations.
Environmental laws and regulations are complex, change frequently, have tended to become more stringent and stringently enforced over time and may besubject to new interpretation. We cannot predict the adverse impact that new environmental regulations, or new interpretations of existing regulations, mighthave on the research, development, production, and marketing of our products.
We may need to recognize impairment charges related to intangible assets and fixed assets. We have recognized substantial balances of goodwill and identified intangible assets as a result of the Business Combination, and we may record additionalgoodwill and other intangible assets as a result of any acquisitions we may complete in the future. We are required to test goodwill and any other intangibleasset with an indefinite life for possible impairment on the same date each year and on an interim basis if there are indicators of a possible impairment. We arealso required to evaluate amortizable intangible assets and fixed assets for impairment if there are indicators of a possible impairment. There is significantjudgment required in the analysis of a potential impairment of goodwill, identified intangible assets and fixed assets. If, as a result of a general economicslowdown, deterioration in one or more of the markets in which we operate or impairment in our financial performance and/or future outlook, the estimatedfair value of our long-lived assets decreases, we may determine that one or more of our long-lived assets is impaired. An impairment charge would bedetermined based on the estimated fair value of the assets and any such impairment charge could have a material adverse effect on our financial conditionand results of operations. We are required to pay Dow for certain tax benefits we may claim, and these amounts are expected to be material. Pursuant to the Tax Receivables Agreement we entered into with Dow upon the consummation of the Business Combination, asamended in April 2017 (the “Tax Receivables Agreement”), we are required to pay annually to Dow 50% of the amount of tax savings, if any, in U.S. federal,state and local income tax that we actually realize as a result of the increase in tax basis of our assets resulting from a section 338(h)(10) election that we andDow made in connection with the Business Combination.
We expect that the payments that we may make under the Tax Receivables Agreement could be substantial. It is possible that future transactions or eventscould increase or decrease the actual tax benefits realized and the corresponding Tax Receivables
23

Table of Contents
Agreement payments. There may be a material negative effect on our liquidity if we do not have sufficient funds to make payments under the TaxReceivables Agreement after we have paid taxes. In certain cases, payments by us under the Tax Receivables Agreement may be accelerated by us or significantly exceed the tax benefits we realize inrespect of the tax attributes subject to the Tax Receivables Agreement. The Tax Receivables Agreement allows us, at any time, to elect an early termination of the Tax Receivables Agreement, in which case we would make animmediate payment equal to the present value of the anticipated future payments to Dow under the Tax Receivables Agreement, after the termination date.Such payment would be based on certain valuation assumptions and deemed events set forth in the Tax Receivables Agreement, including the assumptionthat we have sufficient taxable income to fully utilize such tax benefits. In addition, in the event of certain acquisition transactions by us or a change ofcontrol of us, an alternative calculation mechanism will apply to determine the amount paid to Dow under the Tax Receivables Agreement, which alternativecalculation mechanism could result in payments to Dow that are greater than the tax benefits actually realized by us in respect of the tax attributes subject tothe Tax Receivables Agreement. Accordingly, payments under the Tax Receivables Agreement may be made years in advance of the actual realization, ifany, of the anticipated future tax benefits and may be significantly greater than the benefits we realize in respect of the tax attributes subject to the TaxReceivables Agreement. In these situations, our obligations under the Tax Receivables Agreement could have a substantial negative impact on our liquidity.We may not be able to finance our obligations under the Tax Receivables Agreement and any indebtedness we incur may limit our subsidiaries’ ability tomake distributions to us to pay these obligations. In addition, our obligations under the Tax Receivables Agreement could have the effect of delaying,deferring or preventing certain mergers, asset sales, other forms of business combinations or other changes of control that could otherwise be in the bestinterests of our stockholders.
Risks Related to Our Securities Dow has significant influence over us, which could limit your ability to influence the outcome of key transactions, including a change of control. As of December 31, 2018, Dow owned approximately 42% of our outstanding common stock. In addition, Dow currently owns 3,000,000 of our outstandingwarrants. Because of the degree of concentration of voting power (and the potential for such power to increase upon the purchase of additional stock or theexercise of warrants), your ability to elect members of our board of directors and influence our business and affairs, including any determinations with respectto mergers or other business combinations, the acquisition or disposition of assets, the incurrence of indebtedness, the issuance of any additional commonstock or other equity securities, the repurchase or redemption of common stock and the payment of dividends, may be diminished. Our stock price could be extremely volatile, and, as a result, you may not be able to resell your shares at or above the price you paid for them. In recent years the stock market in general has been highly volatile. As a result, the market price and trading volume of our common stock is likely to besimilarly volatile, and investors in our common stock may experience a decrease in the value of their stock, which could be substantial, including decreasesunrelated to our results of operations or prospects, and could lose part or all of their investment. The price of our common stock could be subject to widefluctuations in response to a number of factors, including those described elsewhere in this report and others such as:
• actual or anticipated fluctuations in our quarterly financial results or the quarterly financial results of companies perceived to be similar to us;
• success of competitors;
• our operating results failing to meet the expectation of securities analysts or investors in a particular period;
• changes in financial estimates and recommendations by securities analysts concerning us or the agricultural or specialty chemicals industries ingeneral;
• our ability to market new and enhanced products on a timely basis;
• changes in laws and regulations affecting our business;
• our ability to meet compliance requirements;
24

Table of Contents
• commencement of, or involvement in, litigation involving us;
• changes in our capital structure, such as future issuances of securities or the incurrence of additional debt;
• the volume of shares of our common stock available for public sale;
• any major change in our board of directors or management;
• sales of substantial amounts of common stock by our directors, executive officers or significant stockholders or the perception that such sales couldoccur; and
• general economic and political conditions such as recessions, interest rates, fuel prices, international currency fluctuations and acts of war orterrorism.
In the past, securities class action litigation has often been initiated against companies following periods of volatility in their stock price. This type oflitigation could result in substantial costs and divert our management’s attention and resources, and could also require us to make substantial payments tosatisfy judgments or to settle litigation. Your percentage ownership in us may be diluted by future issuances of capital stock, which could reduce your influence over matters on whichstockholders vote. Our board of directors has the authority, without action or vote of our stockholders, to issue all or any part of our authorized but unissued shares of commonstock, including shares issuable upon the exercise of options, or shares of our authorized but unissued preferred stock. Issuances of common stock or votingpreferred stock would reduce your influence over matters on which our stockholders vote and, in the case of issuances of preferred stock, would likely resultin your interest in us being subject to the prior rights of holders of that preferred stock. There may be sales of a substantial amount of our common stock by our current stockholders, and these sales could cause the price of our common stock tofall. As of December 31, 2018, there were 50,410,192 shares of our common stock outstanding. Of our issued and outstanding shares that were issued prior to theBusiness Combination, all are freely transferable, except for any shares held by our “affiliates,” as that term is defined in Rule 144 under the Securities Act.Future sales of our common stock may cause the market price of our securities to drop significantly, even if our business is doing well. At the closing of the Business Combination, we entered in an Investor Rights Agreement (the “Investor Rights Agreement”), pursuant to which Dow, theSponsor and the other parties thereto are entitled to demand that we register the resale of their securities subject to certain minimum requirements.Stockholders who are party to the Investor Rights Agreement also have certain “piggyback” registration rights with respect to registration statements filedsubsequent to the Business Combination. The stockholders who are party to the Investor Rights Agreement were subject to a lockup agreement that, subjectto certain limited exceptions, precluded them from selling our securities. That lockup period expired on December 31, 2017. Upon effectiveness of any registration statement we file pursuant to the Investor Rights Agreement, these parties may sell large amounts of our stock in theopen market or in privately negotiated transactions, which could have the effect of increasing the volatility in our stock price or putting significantdownward pressure on the price of our stock. Sales of substantial amounts of our common stock in the public market, or the perception that such sales will occur, could adversely affect the market price ofour common stock and make it difficult for us to raise funds through securities offerings in the future. Warrants are exercisable for our common stock, which, if exercised, would increase the number of shares eligible for future resale in the public market andresult in dilution to our stockholders. As of December 31, 2018, outstanding warrants to purchase an aggregate of 15,983,072 shares of our common stock were exercisable in accordance with theterms of the warrant agreement governing those securities. All of these warrants will expire at 5:00 p.m., New York time, on July 31, 2020, or earlier uponredemption or liquidation. The exercise price of these warrants is $11.50 per share. To the extent such warrants are exercised, additional shares of ourcommon stock will be issued, which will result in dilution to the holders of our common stock and increase the number of shares eligible for resale in thepublic market. Sales of substantial numbers of such shares in the public market or the fact that such warrants may be exercised could adversely affect themarket price of our common stock.
25

Table of Contents
If securities or industry analysts do not publish or cease publishing research or reports about us, our business, or our market, or if they change theirrecommendations regarding our common stock adversely, the price and trading volume of our common stock could decline. The trading market for our common stock is influenced by the research and reports that industry or securities analysts may publish about us, our business, ourmarket, or our competitors. If securities or industry analysts do not provide coverage of us, our stock price and trading volume would likely be negativelyimpacted. If any of the analysts who cover or who may cover us change their recommendation regarding our stock adversely, or provide more favorablerelative recommendations about our competitors, the price of our common stock would likely decline. If any analyst who covers or who may cover us were tocease coverage of us or fail to regularly publish reports on us, we could lose visibility in the financial markets, which in turn could cause our stock price ortrading volume to decline. Anti-takeover provisions contained in our certificate of incorporation and bylaws could impair a takeover attempt. Our second amended and restated certificate of incorporation and bylaws contain provisions that could have the effect of delaying or preventing changes incontrol or changes in our management without the consent of our board of directors. These provisions include:
• no cumulative voting in the election of directors, which limits the ability of minority stockholders to elect director candidates;
• the exclusive right of our board of directors to elect a director to fill a vacancy created by the expansion of the board of directors or the resignation,death, or removal of a director, which prevents stockholders from being able to fill vacancies on our board of directors;
• the ability of our board of directors to determine whether to issue shares of preferred stock and to determine the price and other terms of those shares,including preferences and voting rights, without stockholder approval, which could be used to significantly dilute the ownership of a hostileacquirer;
• a prohibition on stockholder action by written consent, which forces stockholder action to be taken at a special meeting of our stockholders;
• the requirement that an annual meeting of stockholders may be called only by the chairman of the board of directors, the chief executive officer, orthe board of directors, which may delay the ability of our stockholders to force consideration of a proposal or to take action, including the removalof directors;
• limiting the liability of, and providing indemnification to, our directors and officers;
• controlling the procedures for the conduct and scheduling of stockholder meetings;
• providing that directors may be removed prior to the expiration of their terms by stockholders only for cause; and
• advance notice procedures that stockholders must comply with in order to nominate candidates to our board of directors or to propose matters to beacted upon at a stockholders’ meeting, which may discourage or deter a potential acquirer from conducting a solicitation of proxies to elect theacquirer’s own slate of directors or otherwise attempting to obtain control of our board of directors.
These provisions, alone or together, could delay hostile takeovers and changes in control of us or changes in our management. Any provision of our secondamended and restated certificate of incorporation or bylaws that has the effect of delaying or deterring a change in control could limit the opportunity for ourstockholders to receive a premium for their shares of our common stock, and could also affect the price that some investors are willing to pay for our commonstock. Because we have no current plans to pay cash dividends on our common stock for the foreseeable future, you may not receive any return on investmentunless you sell your common stock for a price greater than that which you paid for it. We may retain future earnings, if any, for future operations, expansion and debt repayment and have no current plans to pay any cash dividends for theforeseeable future. Any decision to declare and pay dividends as a public company in the future will be made at the discretion of our board of directors andwill depend on, among other things, our results of operations, financial condition, cash requirements, contractual restrictions and other factors that our boardof directors may deem relevant. In
26

Table of Contents
addition, our ability to pay dividends may be limited by covenants of any existing and future outstanding indebtedness we or our subsidiaries incur,including our Credit Facility. As a result, you may not receive any return on an investment in our common stock unless you sell our common stock for a pricegreater than that which you paid for it.
The JOBS Act permits “emerging growth companies” like us to take advantage of certain exemptions from various reporting requirements applicable toother public companies that are not emerging growth companies. We qualify as an “emerging growth company” as defined in Section 2(a)(19) of the Securities Act, as modified by the JOBS Act. As such, we are eligible forand intend to take advantage of certain exemptions from various reporting requirements applicable to other public companies that are not emerging growthcompanies for as long as we continue to be an emerging growth company, including (i) the exemption from the auditor attestation requirements with respectto internal control over financial reporting under Section 404 of the Sarbanes-Oxley Act, (ii) the exemptions from say-on-pay, say-on-frequency and say-on-golden parachute voting requirements and (iii) reduced disclosure obligations regarding executive compensation in our periodic reports and proxystatements. We will remain an emerging growth company until the earliest of (i) the last day of the fiscal year in which the market value of our common stockthat is held by non-affiliates exceeds $700 million as of June 30 of that fiscal year, (ii) the last day of the fiscal year in which we had total annual grossrevenue of $1.17 billion or more during such fiscal year (as indexed for inflation), (iii) the date on which we have issued more than $1 billion in non-convertible debt in the prior three-year period or (iv) the last day of the fiscal year following the fifth anniversary of the date of the first sale of our commonstock in our initial public offering. In addition, Section 107 of the JOBS Act also provides that an emerging growth company can take advantage of the exemption from complying with new orrevised accounting standards provided in Section 7(a)(2)(B) of the Securities Act as long as we are an emerging growth company. An emerging growthcompany can therefore delay the adoption of certain accounting standards until those standards would otherwise apply to private companies. The JOBS Actprovides that a company can elect to opt out of the extended transition period and comply with the requirements that apply to non-emerging growthcompanies but any such an election to opt out is irrevocable. We have elected not to opt out of such extended transition period, which means that when astandard is issued or revised and it has different application dates for public or private companies, we, as an emerging growth company, can adopt the new orrevised standard at the time private companies adopt the new or revised standard. This may make comparison of our financial statements with another publiccompany which is neither an emerging growth company nor an emerging growth company which has opted out of using the extended transition perioddifficult or impossible because of the potential differences in accounting standards used. We cannot predict if investors will find our common stock less attractive because we will rely on these exemptions. If some investors find our common stockless attractive as a result, there may be a less active trading market for our common stock and our stock price may be more volatile. If we are unable to maintain effective internal control over financial reporting or effective disclosure controls, this could have a material adverse effect onour business and stock price.
As a publicly traded company, we are required to comply with the SEC’s rules implementing Section 302 and 404 of the Sarbanes-Oxley Act, which requiremanagement to certify financial and other information in our quarterly and annual reports and provide an annual management report on the effectiveness ofcontrols over financial reporting. Pursuant to the JOBS Act, our independent registered public accounting firm will not be required to attest to theeffectiveness of our internal control over financial reporting until the later of the year following our first annual report required to be filed with the SEC or thedate we are no longer an emerging growth company, which may be up to five full fiscal years following our initial public offering.
In December 2015, we identified a material weakness in our internal control over financial reporting. Although that materialweakness was subsequently remediated, our management may be unable to conclude in future periods that our disclosure controls and procedures areeffective due to the effects of various factors, which may, in part, include unremediated material weakness in internal controls over financial reporting. Inaddition, a deficiency discovered in our recently implemented SAP accounting system with respect to foreign currency translations caused us to file ourquarterly report on Form 10-Q for the quarter ended June 30, 2018 late. The term “disclosure controls and procedures,” as defined in Rules 13a-15(e) and 15d-15(e) under the Exchange Act means controls and other procedures of a company that are designed to ensure that information required to be disclosed in thereports that it files or submits under the Exchange Act is recorded, processed, summarized and reported, within the time periods specified in the rules andforms of the SEC. Disclosure controls and procedures include, without limitation, controls and procedures designed to ensure that information required to bedisclosed by a company in the reports that it files or submits under the Exchange Act is accumulated and communicated to the company’s management,including its principal executive and principal financial officers, as appropriate to allow timely decisions regarding required disclosure.
27

Table of Contents
If we are unable to comply with the requirements of Section 404 in a timely manner or to assert that our internal control over financial reporting is effective,or if our independent registered public accounting firm is unable to express an opinion as to the effectiveness of our internal control over financial reportingonce we no longer qualify as an emerging growth company, investors may lose confidence in the accuracy and completeness of our financial reports and themarket price of our common stock could be negatively affected, and we could become subject to investigations by NASDAQ (the exchange on which oursecurities are listed), the SEC or other regulatory authorities, which could require additional financial and management resources.
ITEM 1B. UNRESOLVED STAFF COMMENTS Not applicable.
ITEM 2. PROPERTIES We lease our current headquarter facility in Philadelphia, Pennsylvania, consisting of approximately 15,887 square feet. The lease has a 90 month termcommencing in May 2016, with a five-year renewal option and an option for us to terminate the lease after 72 months. We also lease office space in Paris,France, consisting of approximately 7,100 square feet. The lease has a 108 month term commencing in October 2015. We lease a facility in Spring House,Pennsylvania consisting of 14,000 square feet. The lease has a 123 month term commencing in January 2018. We use four primary additional leasedlocations worldwide to deliver product and technical services: Yakima, Washington; Curico, Chile; Bologna, Italy; and Lerida, Spain. In addition, theYakima Service Center is our product distribution center to all geographic regions around the world. Tecnidex occupies a building of five units that make uptheir headquarters in Valencia, Spain. Tecnidex owns two of these units (consisting of approximately 24,480 square feet) and leases the three remaining units(consisting of approximately 37,245 square feet). One of the leased units has a 60 month term that commenced in October 2015 and the other two leased unitshave a 120 month lease term that commenced in July 2017.
ITEM 3. LEGAL PROCEEDINGS From time to time we are named as a defendant in legal actions arising from our normal business activities. Although we cannot predict with certainty theultimate resolution of lawsuits, investigations and claims asserted against us, we do not believe any currently pending legal proceeding to which we are aparty will have a material adverse effect on our business, prospects, financial condition, cash flows or results of operations.
As previously reported, in August 2016, we filed a lawsuit against MirTech, Inc. (“MirTech”), Decco U.S. Post-Harvest, Inc. (“Decco”) and certain relatedparties in the United States District Court for the District of Delaware. Our complaint alleges, among other things, that MirTech, a former consultant to us,appropriated our confidential information and technology, in violation of agreements between MirTech and us, and that MirTech and Decco collaborated toinfringe on several of our patents. Our complaint seeks, among other relief, declarations that we are the owner of a number of patents filed by MirTech,injunctive relief to stop the infringement of our patents, and monetary damages. The claims in this lawsuit were bifurcated anda bench trial was held in March 2017 on certain of our contract claims., after which the Court ruled in theCompany’s favor and against MirTech. Other matters at issue in the litigation are still pending and scheduled for a jury trial inthe Fall of 2019.
28

Table of Contents
PART II
ITEM 4. MINE SAFETY DISCLOSURES Not applicable.
ITEM 5. MARKET FOR REGISTRANT’S COMMON EQUITY, RELATED STOCKHOLDER MATTERS, AND ISSUER PURCHASES OF EQUITYSECURITIES Our common stock and warrants trade on the Nasdaq Global Select Market under the symbols “AGFS” and “AGFSW,” respectively. Each warrant entitles theholder to purchase one share of our common stock at a price of $11.50 per share, and only whole warrants are exercisable. The warrants will expire on July 31,2020, unless redeemed earlier. The following table shows, for the periods indicated, the high and low sales prices per share of our common stock and warrants as reported by Nasdaq:
Common Stock WarrantsHigh Low High Low
Fiscal year ended December 31, 2018First Quarter $ 8.75 $ 6.91 $ 0.77 $ 0.35 Second Quarter $ 7.67 $ 6.30 $ 0.50 $ 0.05 Third Quarter $ 7.25 $ 5.32 $ 0.38 $ 0.10 Fourth Quarter $ 6.57 $ 3.51 $ 0.25 $ 0.10
Fiscal year ended December 31, 2017First Quarter $ 4.43 $ 2.53 $ 0.31 $ 0.24 Second Quarter $ 7.68 $ 4.13 $ 1.04 $ 0.95 Third Quarter $ 9.05 $ 6.87 $ 1.25 $ 1.18 Fourth Quarter $ 7.61 $ 4.94 $ 0.63 $ 0.55
Holders of Record On March 4, 2019, there were approximately 96 holders of record of our common stock and 5 holders of record of our warrants. Such numbers do not includebeneficial owners holding securities through nominee names. Dividends We have not paid any cash dividends on our common stock to date. The payment of cash dividends in the future is within the discretion of our Board ofDirectors, and will be dependent upon our revenues and earnings, capital requirements and general financial condition. Our Board of Directors does notanticipate declaring any dividends in the foreseeable future. Further, our ability to declare dividends is limited by restrictive covenants contained in ourcredit facility, which includes an overall cap on the total amount of dividends we can pay, together with the total amount of shares and warrants we canrepurchase, of $12.0 million per fiscal year, and imposes certain other conditions on our ability to pay dividends.
ITEM 6. SELECTED FINANCIAL DATA
As a smaller reporting company, we are not required to provide the information required by this Item.
29

Table of Contents
ITEM 7. MANAGEMENT’S DISCUSSION AND ANALYSIS OF FINANCIAL CONDITION AND RESULTS OF OPERATIONS
The following discussion and analysis of the Company’s financial condition and results of operations should be read in conjunction with the auditedconsolidated financial statements and the notes thereto contained elsewhere in this Report. This Management’s Discussion and Analysis of Financial Condition and Results of Operations (“MD&A”) contains the financial measure EBITDA, which isnot presented in accordance with accounting principles generally accepted in the United States of America ("GAAP"). This non-GAAP financial measure isbeing presented because management believes that it provides readers with additional insight into the Company’s operational performance relative to earlierperiods and relative to its competitors. EBITDA is a key measure used by the Company to evaluate its performance. The Company does not intend for thisnon-GAAP financial measure to be a substitute for any GAAP financial information. Readers of this MD&A should use this non-GAAP financial measure onlyin conjunction with the comparable GAAP financial measure. A reconciliation of EBITDA to the most comparable GAAP measure is provided in this MD&A.
Business Overview AgroFresh is a global leader in delivering innovative food preservation and waste reduction solutions for fresh produce. The Company is empowering thefood industry with Smarter FreshnessTM, a range of integrated solutions designed to help growers, packers and retailers improve produce freshness and qualitywhile reducing waste. AgroFresh’s solutions range from near-harvest with HarvistaTM and LandSpringTM to its marquee SmartFreshTM Quality System, whichincludes SmartFreshTM, FreshCloudTM and ActiMistTM, working together to maintain the quality of stored produce. AgroFresh hasa controlling interest in Tecnidex, a leading provider of post-harvest fungicides, waxes and biocides for the citrus market. Additionally, the company’s initialretail solution, RipeLockTM, optimizes banana ripening for the benefit of retailers and consumers. AgroFresh has key products registered in over 50 countries,supports approximately 3,900 direct customers and services over 25,000 storage rooms globally.
In December 2017, AgroFresh acquired a controlling interest in Tecnidex. With this acquisition, AgroFresh expanded its industry-leading post-harvestpresence into additional crops, and increased its penetration of the produce market in southern Europe, Latin America and Africa. For over 35 years, Tecnidexhas been helping fruit and vegetable producers offer clean, safe and high-quality products to its regional customers in 18 countries. Through its portfolio ofpost-harvest products, technology, consulting, and after-sale services, Tecnidex improves the quality and value of its clients’ fruit and vegetables whilerespecting the environment. Tecnidex is based in Valencia, Spain. Tecnidex further diversifies AgroFresh’s revenue by expanding our ability to providesolutions and service to the citrus industry.
Freshness is the most important driver of consumer satisfaction when it comes to produce, and, at the same time, food waste is a major issue in the industry.About one third of the total food produced worldwide is lost or wasted each year. Nearly 45% of all fresh fruits and vegetables, 40% of apples and 20% ofbananas, are lost to spoilage. AgroFresh plays a key role in the value chain by offering products and services that maintain produce freshness and reducewaste. AgroFresh’s current principal product, SmartFresh, regulates the post-harvest ripening effects of ethylene, the naturally occurring plant hormone that triggersripening in certain fruits and vegetables. SmartFresh is naturally biodegradable, leaves no detectable residue, and has been approved for use by manydomestic and global regulatory organizations. Harvista extends the Company’s proprietary technology into near-harvest management of pome fruit such asapples and pears. FreshCloud Storage InsightsTM is an atmospheric monitoring system that leverages the Company's extensive understanding of fruitphysiology, fruit respiration, current controlled atmosphere technology, and new proprietary diagnostic tools to provide improved and real-time guidance toproducers and packers of fresh produce regarding storage conditions so corrective measures can be made on a more timely basis. RipeLockTM combines thetechnology behind SmartFresh with modified atmosphere packaging designed specifically to preserve quality during transportation and to extend the yellowshelf life of bananas and other potential fruits. LandSpringTM is an innovative 1-MCP technology targeted to transplanted vegetable seedlings. It is currentlyregistered for use on tomato, peppers, and 14 other crops in the US. It reduces transplant shock, resulting in less seedling mortality and faster cropestablishment, which leads to a healthier crop and improved yields. AgroFresh’s business is highly seasonal, driven by the timing of harvests in the northern and southern hemispheres. The first half of the year is when thesouthern hemisphere harvest occurs, and the second half of the year is when the northern hemisphere harvest occurs. Since the northern hemisphere harvest ofour two core crops of apples and pears is typically larger, a significant portion of our sales and profits are historically generated in the second half of the year.In addition to this seasonality, factors such as weather patterns may impact the timing of the harvest within the two halves of the year.
30
Table of Contents
AgroFresh is a former blank check company that completed its initial public offering on February 19, 2014. Upon the closing of the Business Combinationwith Dow on July 31, 2015, the Company changed its name to AgroFresh Solutions, Inc. The Company paid Dow cash consideration of $635 million andissued Dow 17.5 million shares of common stock at a deemed value of $12 per share. The transaction included a liability to Dow to deliver a variable numberof warrants between the closing and April 2016, which obligation was terminated pursuant to a letter agreement entered into on April 4, 2017. The cashconsideration was funded through our initial public offering, a term loan, and a private placement of 4.9 million shares of common stock that yielded $50million of proceeds. In addition, pursuant to a tax receivables agreement entered into in connection with the Business Combination, as amended in April2017, Dow is entitled to receive 50% of the tax savings, if any, that the Company realizes as a result of the increase in the tax basis of assets acquiredpursuant to the Business Combination. In connection with the closing of the Business Combination, AgroFresh entered into a transition services agreement with Dow. Under the agreement, Dowprovided AgroFresh a suite of services for a period of time ranging from six months to five years depending on the service. While most of the Dow-providedservices are complete as of December 31, 2018 certain services are expected to continue through 2019. The agreement also provided for a $5 millionexecution fee that was paid to Dow at the closing of the Business Combination. Factors Affecting the Company’s Results of Operations The Company’s results of operations are affected by a number of external factors. Some of the more important factors are briefly discussed below. Demand for the Company’s Offerings The Company services customers in over 50 countries and derives its revenue by assisting growers and packers to optimize the value of their crops primarilythrough the post-harvest period. Its products and services add value to customers by reducing food spoilage and extending the life of perishable fruits. TheU.S. Food and Agriculture Organization has estimated that a growing global population will require a near doubling of food production in developingcountries by 2050 to meet the expected demand of a worldwide population of 9 billion people. This global trend, among others, creates demand for the Company’s solutions. The Company’s offerings are currently protected by patent filings in 55countries. The global produce market is a function of both the size and the yield of the crop harvested; variations in either will affect total production. Given the natureof the agricultural industry, weather patterns may impact total production and the Company's resulting commercial opportunities. The Company supports adiverse customer base whose end markets vary due to the type of fruit and quality of the product demanded in their respective markets. Such variation acrossend markets also affects demand for the Company’s services. Customer Pricing The Company’s offerings are priced based on the value they provide to the Company’s customers. From time to time, the Company adjusts the pricing of itsoffering to address market trends. The Company does not typically price its products in relation to any underlying cost of materials or services; therefore, itsmargins can fluctuate with changes in these costs. The Company’s pricing may include rebate arrangements with customers in exchange for mutuallybeneficial long-term relationships and growth. Whole Product Offering The AgroFresh Whole Product offering is a direct service model for the Company’s commercially available products, including SmartFresh and Harvista.Sales and sales support personnel maintain direct face-to-face relationships with customers year round. Technical sales and support personnel work directlywith customers to provide value-added advisory services regarding the application of SmartFresh. The actual application of SmartFresh is performed byservice providers that are typically third-party contractors. The Harvista application service, through both aerial and ground application, is also administeredby third-party service providers or made by our customers directly. Most of the Company’s service providers are operating under multi-year contracts. Management believes the quality and experience of its service providersdeliver clear commercial benefits.
31

Table of Contents
Seasonality The Company’s operations are subject to seasonal variation due to the timing of the growing seasons around the world. Northern Hemisphere growers harvestfrom August through November, and Southern Hemisphere growers harvest from late January to early May. Since the majority of the Company’s sales are inNorthern Hemisphere countries, a proportionately greater share of its revenue is realized during the second half of the year. There are also variations in theseasonal demands from year to year depending on weather patterns and crop size. This seasonality and variations in seasonal demand could impact the abilityto compare results between periods. Foreign Currency Exchange Rates With a global customer base and geographic footprint, the Company generates revenue and incurs costs in a number of different currencies, with the Eurocomprising the most significant non-U.S. currency. Fluctuations in the value of these currencies relative to the U.S. dollar can increase or decrease theCompany’s overall revenue and profitability as stated in U.S. dollars, which is the Company’s reporting currency. In certain instances, if sales in a givengeography have been adversely impacted on a long-term basis due to foreign currency depreciation, the Company has been able to adjust its pricing so as tomitigate the impact on profitability. Domestic and Foreign Operations The Company has both domestic and foreign operations. Fluctuations in foreign exchange rates, regional growth-related spending in research anddevelopment (“R&D”) and marketing expenses, and changes in local selling prices, among other factors, may impact the profitability of foreign operations inthe future. Critical Accounting Policies and Use of Estimates Our discussion and analysis of results of operations and financial condition are based upon our financial statements. These financial statements have beenprepared in accordance with U.S. GAAP. The preparation of these financial statements requires us to make estimates and judgments that affect the amountsreported in the financial statements. We base our estimates and judgments on historical experiences and assumptions believed to be reasonable under thecircumstances and re-evaluate them on an ongoing basis. Actual results could differ from our estimates under different assumptions or conditions. Oursignificant accounting policies, which may be affected by our estimates and assumptions, are more fully described in Note 2 to the audited consolidatedfinancial statements.
An accounting policy is deemed to be critical if it requires an accounting estimate to be made based on assumptions about matters that are highly uncertain atthe time the estimate is made, and if different estimates that reasonably could have been used, or changes in the accounting estimates that are reasonablylikely to occur periodically, could materially impact the financial statements. Management believes the following critical accounting policies reflect its mostsignificant estimates and assumptions used in the preparation of the financial statements. Asset Impairments Factors that could result in future impairment charges, among others, include changes in worldwide economic conditions, changes in technology, changes incompetitive conditions and customer preferences, and fluctuations in foreign currency exchange rates. These risk factors are discussed in Part I, Item 1A,“Risk Factors.” Goodwill As discussed in Note 2, “Basis of Presentation and Summary of Significant Accounting Policies,” in the audited consolidated financial statements, theCompany tests goodwill and identifiable intangible assets with indefinite lives for impairment at least annually. Intangibles are tested for impairment using aquantitative impairment model. We test goodwill for impairment by either performing a qualitative evaluation or a two-step quantitative test. We considerthe Company to be two reporting units for purposes of testing goodwill for impairment. For the 2016 impairment test, we utilized the quantitative methods to assess impairment and we concluded that goodwill was fully impaired. The inputsutilized in the analysis are classified as Level 3 inputs within the fair value hierarchy as defined in ASC 820, Fair Value Measurement.
32
Table of Contents
The process of evaluating the potential impairment of goodwill is subjective because it requires the use of estimates and assumptions as to our future cashflows, discount rates commensurate with the risks involved in the assets, future economic and market conditions, as well as other key assumptions. Theamounts recorded in the financial statements related to goodwill are based on the best estimates and judgments of the Company’s management, althoughactual outcomes could differ from our estimates. Our annual test of goodwill indicated that goodwill was fully impaired as of December 31, 2016. Inconnection with the Tecnidex acquisition in 2017, we recorded approximately $9.4 million of goodwill which was based on the preliminary purchase priceallocation as of December 2017. During the year ended December 31, 2018, an adjustment was made to the consideration payable to the holders of Tecnidexbased on the payment made in 2018 which resulted in goodwill of $6.7 million as of December 31, 2018.
Other intangible assets We conduct our annual indefinite-lived intangible assets impairment assessment as of December 31 of each year unless conditions arise that would require amore frequent evaluation. In assessing the recoverability of indefinite-lived intangible assets, projections regarding estimated discounted future cash flowsand other factors are made to determine if impairment has occurred. If we conclude that there has been impairment, we will write down the carrying value ofthe asset to its fair value. Each year, we evaluate those intangible assets with indefinite lives to determine whether events and circumstances continue tosupport the indefinite useful lives. When testing indefinite-lived intangible assets for impairment, we have the option to first assess qualitative factors todetermine whether the existence of events or circumstances leads to a determination that it is more likely than not (more than 50%) that the fair value of anindefinite-lived intangible asset is less than its carrying amount. Such qualitative factors may include the following:
• Macroeconomic conditions• Industry and market considerations• Cost factors• Overall financial performance; and• Other relevant entity-specific events
Based on the results of our annual impairment reviews conducted in December, management recorded an impairment charge of $9.5 million on its AgroFreshand SmartFresh trade names for the year ended December 31, 2016, and an impairment charge of $2.6 million on its SmartFresh trade name for the year endedDecember 31, 2018. In determining the fair value of the trade names, the Company applied the relief from royalty methodology, which is based on theassumption that without ownership of the assets, the user of the trade name would have to make a stream of payments to the owner of the trade names in returnfor the rights to use the trade names. By acquiring the trade name, the user avoids those payments. The annual assessment for the year ended December 31,2017 resulted in no indicators of impairment.
Definite-lived intangible assets, such as technology, customer relationships and software are amortized over their estimated useful lives, generally for periodsranging from 4 to 24 years. The reasonableness of the useful lives of these assets is regularly evaluated. Once these assets are fully amortized, they areremoved from the balance sheet. Revenue Recognition
The majority of our revenues are generated from the application of our products to fruits and vegetables either before or after harvesting. Revenue isrecognized at the time the product is applied to the fruits or vegetables as this represents the point at which our performance obligation to the customer hasbeen completed. On January 1, 2018, the Company began to account for revenue in accordance with ASU 2014-09, Revenue from Contracts with Customers (Topic606), which requires revenue recognized to represent the transfer of promised goods or services to customers at an amount that reflects the considerationwhich is expected to be received in exchange for those goods or services. To determine revenue recognition for the arrangements that the Companydetermines are within the scope of Topic 606, the Company performs the following 5 steps: (1) Identify the contracts with a customer, (2) Identify theperformance obligations in the contract, (3) Determine the transaction price, (4) Allocate the transaction price to the performance obligations in the contractand (5) Recognize revenue when (or as) the entity satisfies a performance obligation. Revenue is presented in our consolidated statements of (loss) income,net of estimated rebates and discounts.
In periods prior to the adoption of Topic 606, revenue was recognized when (1) persuasive evidence of an arrangement exists, (2) delivery has occurred orservices have been rendered, (3) the sales price is fixed or determinable, and (4) collectability is reasonably assured.
33

Table of Contents
See Note 2 to the audited consolidated financial statements for further information. Accounting for Business Combinations We account for business combinations under the acquisition method of accounting. This method requires the recording of acquired assets, includingseparately identifiable intangible assets, and assumed liabilities at their acquisition date fair values. The excess of the purchase price over the fair value ofassets acquired and liabilities assumed is recorded as goodwill. Determining the fair value of assets acquired and liabilities assumed requires management’sjudgment and often involves the use of significant estimates and assumptions, including assumptions with respect to future cash inflows and outflows,discount rates, royalty rates and asset lives, among other items. The fair values of intangible assets were estimated using an income approach, either the excess earnings method (customer relationships) or the relief fromroyalty method (technology and trademarks). Under the excess earnings method, an intangible asset’s fair value is equal to the present value of theincremental after-tax cash flows attributable solely to the intangible asset over its remaining useful life. Under the relief from royalty method, fair value ismeasured by estimating future revenue associated with the intangible asset over its useful life and applying a royalty rate to the revenue estimate. Theseintangible assets enable us to secure markets for our products, develop new products to meet evolving business needs and competitively produce our existingproducts. The fair values of property, plant, and equipment, other than real properties, were based on the consideration that unless otherwise identified, they willcontinue to be used “as is” and as part of the ongoing business. The determination of the fair value of assets acquired and liabilities assumed involvesassessing factors such as the expected future cash flows associated with individual assets and liabilities and appropriate discount rates at the date of theacquisition. The fair values of the various contingent consideration components were measured using the following valuation models. The fair value of the taxamortization benefit contingency was measured using an income approach based on the Company’s best estimate of the undiscounted cash payments to bemade, tax effected and discounted to present value utilizing an appropriate market discount rate. The fair value of the deferred acquisition payment wasmeasured using a Black-Scholes option pricing model and based on the Company’s best projection of the Company’s average adjusted EBITDA level overthe two-year period from January 1, 2016 to December 31, 2017. The warrant consideration was measured using directly observable quoted prices foridentical assets in an inactive market. The working capital settlement was measured pursuant to the terms of the Purchase Agreement based upon the workingcapital of the AgroFresh Business as of the Closing Date being greater or less than a target level of working capital determined in accordance with thePurchase Agreement. See Note 3 to the audited consolidated financial statements for further information. Stock-Based Compensation
We recognize stock-based compensation expense for all share-based payment awards on a straight-line basis over the requisite service period of the award.Determining the fair value of share-based payment awards requires the input of highly subjective assumptions, including the expected life of the share-basedpayment awards and stock price volatility. The assumptions used in calculating the fair value of share-based payment awards represent management’s bestestimates, but these estimates involve inherent uncertainties and the application of management judgment. As a result, if factors change and we use differentassumptions, our share-based compensation expense could be materially different in the future. See Note 13 to the audited consolidated financial statementscontained in this report for further detail on stock-based compensation.
Income taxes The provision for income taxes was determined using the asset and liability approach of accounting for income taxes. Under this approach, deferred taxesrepresent the future tax consequences expected to occur when the reported amounts of assets and liabilities are recovered or paid. The provision for incometaxes represents income taxes paid or payable for the current year plus the change in deferred taxes during the period. Deferred taxes result from differencesbetween the financial and tax basis of our assets and liabilities and are adjusted for changes in tax rates and tax laws when changes are enacted. Valuationallowances are recorded to reduce deferred tax assets when it is more likely than not that a tax benefit will not be realized. Deferred tax assets and liabilitiesare measured using enacted tax rates applicable in the years in which they are expected to be recovered or settled. The effect on deferred tax assets andliabilities of a change in tax law is recognized in income in the period that includes the enactment date.
34

Table of Contents
Income tax related penalties are included in the provision for income taxes. In evaluating the ability to realize deferred tax assets, the Company relies ontaxable income in prior carryback years, the future reversals of existing taxable temporary differences, future taxable income, and tax planning strategies.
The breadth of our operations and the global complexity of tax regulations require assessments of uncertainties and judgments in estimating taxes we willultimately pay. The final taxes paid are dependent upon many factors, including negotiations with taxing authorities in various jurisdictions, outcomes of taxlitigation and resolution of disputes arising from federal, state and international tax audits in the normal course of business. A liability for unrecognized taxbenefits is recorded when management concludes that the likelihood of sustaining such positions upon examination by taxing authorities is less than "morelikely than not."
Recently Issued Accounting Standards and Pronouncements
See Note 2 to the accompanying audited consolidated financial statements for a full description of recent accounting pronouncements and our expectationsof their impact, if any, on our results of operations and financial condition.
35

Table of Contents
Results of Operations The following table summarizes the results of operations:
(in thousands)Year Ended Year Ended
December 31, 2018Year Ended
December 31, 2017Year Ended
December 31, 2016
Net sales $ 178,786 $ 164,026 $ 159,669 Cost of sales (excluding amortization, shown separately below) 46,271 32,655 59,977 Gross profit 132,515 131,371 99,692
Research and development expenses 13,873 13,779 14,767 Selling, general, and administrative expenses 65,770 61,847 61,892 Amortization of intangibles 45,946 41,910 40,327 Impairment of long lived assets 2,600 — 10,795 Goodwill impairment — — 62,373 Change in fair value of contingent consideration (3,018) (26,948) (53,608)
Operating income (loss) 7,344 40,783 (36,854)Other income (expense) 429 611 (173)(Loss) gain on foreign currency exchange (1,722) 13,344 (3,274)Interest expense, net (34,451) (35,755) (58,239)
(Loss) income before income taxes (28,400) 18,983 (98,540)Provision (benefit) for income taxes 1,840 (4,579) 13,020
Net (loss) income $ (30,240) $ 23,562 $ (111,560)Less: Net loss (income) attributable to non-controlling interests $ 180 $ (91) $ —
Net (loss) income attributable to AgroFresh Solutions, Inc $ (30,060) $ 23,471 $ (111,560)
Comparison of Results of Operations for the year ended December 31, 2018 and the year ended December 31, 2017. Net Sales Net sales were $178.8 million for the year ended December 31, 2018, as compared to net sales of $164.0 million for the year ended December 31, 2017.The increase in net sales in fiscal year 2018 from fiscal year 2017 was driven by the addition of Tecnidex which contributed $20.8 million, andSmartFresh growth in Europe, partially offset by SmartFresh declines in the Pacific Northwest region of the United States where the business was negativelyimpacted by a smaller than normal apple harvest. As the Company continues to diversify, and with the addition of Tecnidex, SmartFresh sales in the PacificNorthwest represented less than 10 percent of the Company's overall revenue in 2018.
Additionally, foreign currency negatively impacted revenue in 2018 by $1.4 million, mostly driven by the Euro, and ASC-606 deferred revenue negativelyimpacted sales in 2018 by $1.1 million. Excluding these items along with the impact of Tecnidex, organic sales were essentially flat compared to 2017. Cost of Sales Cost of sales was $46.3 million for the year ended December 31, 2018, as compared to $32.7 million for the year ended December 31, 2017. Gross profitmargin was 74.1% in 2018 versus 80.1% in 2017. The decrease in margin was primarily driven by the addition of Tecnidex, strategic pricing initiatives in thecore business and the impact of ASC 606 deferred revenue. Research and Development Expenses Research and development expenses were $13.9 million for the year ended December 31, 2018, as compared to $13.8 million for the yearended December 31, 2017. Tecnidex added $1.2 million of cost. Excluding these costs, research and development costs were down reflecting our resourceallocation strategy that supports initiatives which drive continued diversification beyond apples.
36

Table of Contents
Selling, General and Administrative Expenses Selling, general and administrative expenses were $65.8 million for the year ended December 31, 2018, as compared to $61.8 million for the yearended December 31, 2017. The increase was primarily driven by the addition of Tecnidex which contributed $5.2 million in costs. Excluding Tecnidex,selling general and administrative expenses were $60.6 million, down 1% for the year, reflecting the impact of cost optimization initiatives. Amortization of Intangibles Amortization of intangibles was $45.9 million for the year ended December 31, 2018, as compared to $41.9 million for the year ended December 31, 2017.The increase in amortization of intangibles is primarily due to the addition of Tecnidex amortization of $1.6 million.
Impairment of Long-lived Assets
During the year ended December 31, 2018, the Company recorded an impairment charge of $2.6 million related to the estimated decline in the fair value ofthe SmartFresh trade name. There were no indicators of impairment during the 2017 impairment assessment.
Goodwill impairment
As a result of the Tecnidex acquisition $9.4 million was recorded to goodwill for the year ended December 31, 2017. During 2018, a measurement periodadjustment was recorded to payments due to the owners of Tecnidex which resulted in $6.7 million of goodwill at December 31, 2018. The goodwill will beassessed annually for impairment. During the years ended December 31, 2018 and 2017, the Company did not record an impairment charge as a result of ourannual impairment test.
Change in fair value of contingent consideration The Company recorded a $3.0 million gain in the year ended December 31, 2018 related to the change in the fair value of contingent consideration, ascompared to a $26.9 million gain for the year ended December 31, 2017. As discussed in Note 3 to the audited consolidated financial statements, pursuant tothe Business Combination, the Company entered into various forms of contingent consideration, including the warrant consideration, the deferred payment,and the tax amortization benefit contingency. These liabilities are measured at fair value each reporting date and any mark-to-market fluctuations arerecognized in earnings. For 2018, the warrant consideration, the deferred payment, and the tax amortization benefit contingency mark-to-market (gains)losses were $0.0 million, $(0.3) million, and $(2.8) million, respectively. For 2017, the warrant consideration, the deferred payment, and the tax amortizationbenefit contingency and other incurred mark-to-market losses (gains) were $0.5 million, $(2.5) million, and $(24.9) million, respectively. Other Income (Expense) Other income was $0.4 million for the year ended December 31, 2018, as compared to $0.6 million of income for the year ended December 31, 2017. (Loss) gain on foreign currency
Loss on foreign currency was $(1.7) million for the year ended December 31, 2018 as compared to a gain of $13.3 million for the year ended December 31,2017. The loss was due to the strengthening of the U.S. dollar against the euro, Canadian dollar, Australian dollar, Chilean peso and Turkish lira during2018 as compared to 2017. This was partially offset by the change to highly inflationary accounting in Argentina.
Interest Expense, Net Interest expense, net was $34.5 million for the year ended December 31, 2018, as compared to $35.8 million for the year ended December 31, 2017. Thedecrease was primarily driven by lower accretion on the Tax Receivables Agreement of $5.0 million which was partially offset by higher interest on theCredit Facility of $3.5 million. Cash interest expense was up $15.8 million in 2018 as compared to 2017 due to timing of quarterly interest payments.
Income Tax Provision
37

Table of Contents
Our effective tax rate was (6.5)% for the year ended December 31, 2018, as compared to (24.1)% for the year ended December 31, 2017. Our tax rate isaffected by recurring items, such as tax rates in foreign jurisdictions and the relative amounts of income we earn in those jurisdictions. It is also affected bydiscrete items that may occur in any given year. On December 22, 2017 the Tax Cuts and Jobs Act ("TCJA") was enacted in the U.S. The TCJA significantlyrevised the U.S. federal corporate income tax by, among other things, lowering the corporate income tax rate to 21%, implementing a territorial tax system,imposing a limitation on tax deductibility of U.S. interest expense, and the inclusion of “global intangible low-taxed income” (“GILTI”).
During the year ended December 31, 2018, certain losses occurred that did not receive a tax benefit including the unbenefited losses related to theelimination of intercompany profit in inventory. In addition to these unbenefited losses, there was a valuation allowance increase in the U.S., Japan,Netherlands, and Turkey. For the year ended December 31, 2018, the impact of the unbenefited losses and valuation allowance increase resulted in a taxexpense in the amount of $6.0 million (21.2)%.
Comparison of Results of Operations for the year ended December 31, 2017 and the year ended December 31, 2016. Net Sales Net sales were $164.0 million for the year ended December 31, 2017, as compared to net sales of $159.7 million for the year ended December 31, 2016. Theoverall increase in net sales in fiscal year 2017 from fiscal year 2016 was primarily related to the addition of Tecnidex and double-digit growth in Harvista.
Net sales in North America decreased to $53.6 million for 2017, down 4.7% from $56.2 million in 2016. The decrease in net sales is primarily due to lowersales of SmartFresh in North America driven by competitive price pressure, somewhat offset by an 18% increase in Harvista sales. Net sales in EMEAincreased by $5.5 million to $70.2 million in 2017. Excluding currency impact of $2.9 million, EMEA net sales increased by $2.6 million, primarily due tothe addition of Tecnidex along with increased penetration in persimmon and pears. Net sales in Latin America increased 9.6%, mainly due to larger applecrop in Brazil compared to 2016, along with growth in Harvista sales in Argentina. Net sales in the Asia Pacific region decreased by $0.9 million driven bydeclines in China compared to 2016. Cost of Sales Cost of sales was $32.7 million for the year ended December 31, 2017, as compared to $60.0 million for the year ended December 31, 2016. Included inthe 2016 amount was $30.4 million of amortization of inventory step up. Gross profit margin was 80.1% in 2017 and would have been 81.5% in 2016 if theamortization of the inventory step-up had been excluded. The decrease in margin was primarily driven by an unfavorable product and geographic mix. Research and Development Expenses Research and development expenses were $13.8 million for the year ended December 31, 2017, as compared to $14.8 million for the year ended December31, 2016, reflecting more targeted research activities in 2017. Selling, General and Administrative Expenses Selling, general and administrative expenses were $61.8 million for the year ended December 31, 2017, as compared to $61.9 million for the year endedDecember 31, 2016. Savings achieved in selling, general, and administrative expenses were mostly offset by a number of one-time charges, including legaland professional fees associated with the Tecnidex and Food Freshness Technologies transactions, and costs associated with the MirTech litigation.Additionally, there were costs unique to 2017 associated with our migration off of the Dow transition services agreement and the creation of our owntechnology infrastructure. Amortization of Intangibles Amortization of intangibles was $41.9 million for the year ended December 31, 2017, as compared to $40.3 million for the year ended December 31, 2016.The increase in amortization of intangibles is primarily due to the amortization of in-process research and development for our LandSpring product line,which started in September 2016.
Impairment of Long-lived Assets
38

Table of Contents
During the year ended December 31, 2016, the Company recorded a $9.5 million impairment charge related to a decline in the estimated value of theAgroFresh and SmartFresh trade names and a $1.3 million charge for the write-off of assets resulting from the decision to change the product delivery systemfor Harvista. There were no indicators of impairment during the 2017 impairment assessment.
Goodwill Impairment
As a result of the Tecnidex acquisition $9.4 million was recorded to goodwill. The goodwill will be assessed annually for impairment. During the year endedDecember 31, 2016, the Company recorded an impairment charge of $62.4 million as a result of our annual impairment test.
Change in Fair Value of Contingent Consideration The Company recorded a $26.9 million gain in the year ended December 31, 2017 related to a change in the fair value of contingent consideration, ascompared to $53.6 million gain for the year ended December 31, 2016. As discussed in Note 3 to the audited consolidated financial statements, pursuant tothe Business Combination, the Company entered into various forms of contingent consideration, including the warrant consideration, the deferred payment,and the tax amortization benefit contingency. These liabilities are measured at fair value each reporting date and any mark-to-market fluctuations arerecognized in earnings. For 2017, the warrant consideration, the deferred payment, and the tax amortization benefit contingency mark-to-market (gains)losses were $0.5 million, $(2.5) million and $(24.9) million. respectively. For 2016, the warrant consideration, the deferred payment and the tax amortizationbenefit contingency and other incurred mark-to-market (gains) losses were $(4.9) million, $(32.5) million, $(17.4) million and $1.2 million, respectively. Other Income (Expense) Other income was $0.6 million for the year ended December 31, 2017, as compared to $(0.2) million expense for the year ended December 31, 2016. Gain (loss) on Foreign Currency
Gain on foreign currency was $13.3 million for the year ended December 31, 2017 as compared to $(3.3) million loss for the year ended December 31,2016. The gain was due to the weakening of the U.S. dollar against the euro, Canadian dollar, Australian dollar, and Chilean peso during 2017 as comparedto 2016.
Interest Expense, Net Interest expense, net was $35.8 million for the year ended December 31, 2017, as compared to $58.2 million for the year ended December 31, 2016. Thedecrease was primarily driven by lower accretion on the deferred payment to Dow of $14.3 million, lower accretion on the Tax Receivables Agreement of$7.2 million, and lower amortization of debt discount and other of $1.8 million. Cash interest expense was up $0.9 million in 2017 as compared to 2016. Income Tax Provision Our effective tax rate was (24.1)% for the year ended December 31, 2017, as compared to (13.2)% for the year ended December 31, 2016. Our tax rate isaffected by recurring items, such as tax rates in foreign jurisdictions and the relative amounts of income we earn in those jurisdictions. It is also affected bydiscrete items that may occur in any given year. On December 22, 2017 the Tax Cuts and Jobs Act ("TCJA") was enacted in the U.S. The TCJA significantlyrevised the U.S. federal corporate income tax by, among other things, lowering the corporate income tax rate to 21%, implementing a territorial tax system,and imposing a repatriation tax on earnings of foreign subsidiaries that are deemed to be repatriated to the U.S.
During the year ended December 31, 2017, there was a tax impact in the amount of $17.3 million (91.1%) for the re-measurement of the Company’s deferredtax assets and liabilities in the U.S. and other foreign jurisdictions as a result of 2017 tax legislation enactments (TCJA), and tax expense impact in theamount of $3.1 million net (16.1%) resulting from a valuation allowance release in the U. S., an increase in the valuation allowance in South Korea, and thenon-recognition of the tax impact of the intercompany profit in inventory elimination (unbenefited losses).
39

Table of Contents
Non-GAAP Measures The following table set forth the non-GAAP financial measure of EBITDA. The Company believes this non-GAAP financial measure provides meaningfulsupplemental information as it is used by the Company’s management to evaluate the Company’s performance, is more indicative of future operatingperformance of the Company, and facilitates a better comparison among fiscal periods, as the non-GAAP measure excludes items that are not considered coreto the Company’s operations. These non-GAAP results are presented for supplemental informational purposes only and should not be considered a substitutefor the financial information presented in accordance with GAAP. The following is reconciliation between the non-GAAP financial measure of EBITDA to its most directly comparable GAAP financial measure, net (loss)income:
(in thousands)Year Ended
December 31, 2018Year Ended
December 31, 2017Year Ended
December 31, 2016
GAAP net (loss) income including non-controllinginterests $ (30,240) $ 23,562 $ (111,560)
Provision (benefit) for income taxes 1,840 (4,579) 13,020 Amortization of inventory step-up(1) — — 30,377 Interest expense(2) 34,451 35,755 58,239 Depreciation and amortization 47,593 44,356 42,850
Non-GAAP EBITDA $ 53,644 $ 99,094 $ 32,926 EBITDA Margin(3) 30% 60% 21%
———————————————————————————————(1) The amortization of inventory step-up related to the acquisition of AgroFresh was charged to income based on the pace of inventory usage.(2) Interest on the term loan and accretion for debt discounts, debt issuance costs and contingent consideration.(3) EBITDA margin is calculated by dividing total Non-GAAP EBITDA by net sales.
40
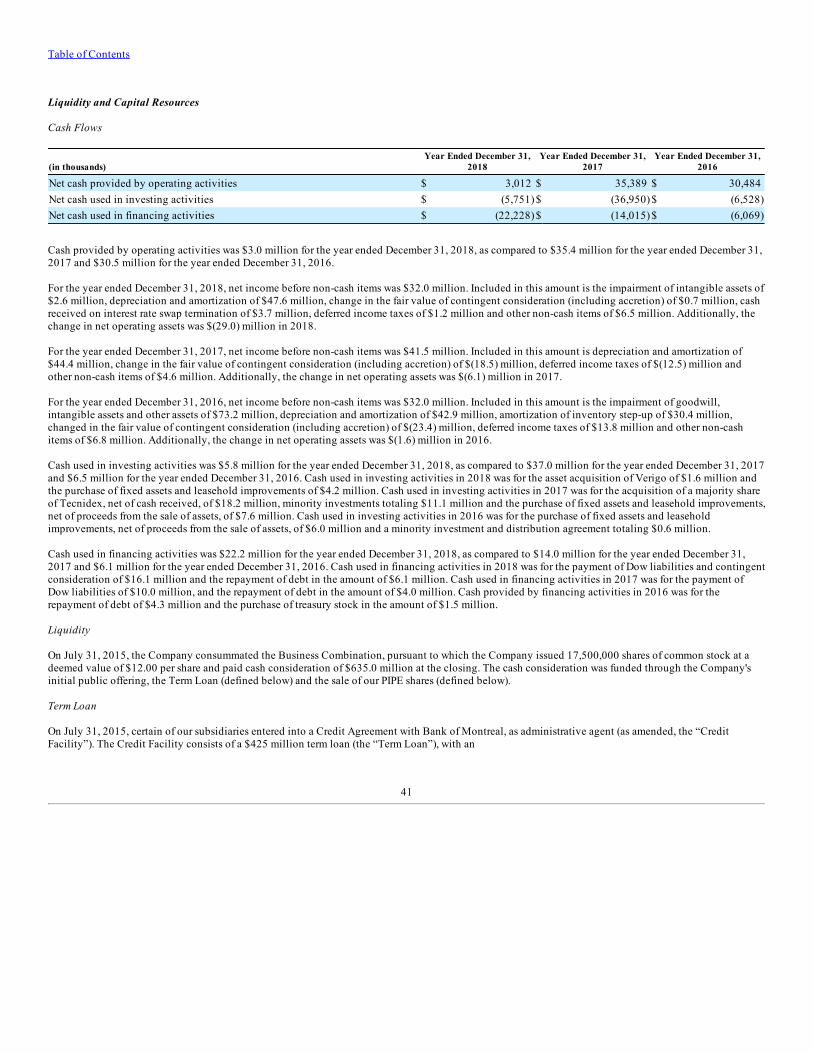
Table of Contents
Liquidity and Capital Resources Cash Flows
(in thousands)Year Ended December 31,
2018Year Ended December 31,
2017Year Ended December 31,
2016
Net cash provided by operating activities $ 3,012 $ 35,389 $ 30,484 Net cash used in investing activities $ (5,751) $ (36,950) $ (6,528)Net cash used in financing activities $ (22,228) $ (14,015) $ (6,069)
Cash provided by operating activities was $3.0 million for the year ended December 31, 2018, as compared to $35.4 million for the year ended December 31,2017 and $30.5 million for the year ended December 31, 2016.
For the year ended December 31, 2018, net income before non-cash items was $32.0 million. Included in this amount is the impairment of intangible assets of$2.6 million, depreciation and amortization of $47.6 million, change in the fair value of contingent consideration (including accretion) of $0.7 million, cashreceived on interest rate swap termination of $3.7 million, deferred income taxes of $1.2 million and other non-cash items of $6.5 million. Additionally, thechange in net operating assets was $(29.0) million in 2018.
For the year ended December 31, 2017, net income before non-cash items was $41.5 million. Included in this amount is depreciation and amortization of$44.4 million, change in the fair value of contingent consideration (including accretion) of $(18.5) million, deferred income taxes of $(12.5) million andother non-cash items of $4.6 million. Additionally, the change in net operating assets was $(6.1) million in 2017.
For the year ended December 31, 2016, net income before non-cash items was $32.0 million. Included in this amount is the impairment of goodwill,intangible assets and other assets of $73.2 million, depreciation and amortization of $42.9 million, amortization of inventory step-up of $30.4 million,changed in the fair value of contingent consideration (including accretion) of $(23.4) million, deferred income taxes of $13.8 million and other non-cashitems of $6.8 million. Additionally, the change in net operating assets was $(1.6) million in 2016. Cash used in investing activities was $5.8 million for the year ended December 31, 2018, as compared to $37.0 million for the year ended December 31, 2017and $6.5 million for the year ended December 31, 2016. Cash used in investing activities in 2018 was for the asset acquisition of Verigo of $1.6 million andthe purchase of fixed assets and leasehold improvements of $4.2 million. Cash used in investing activities in 2017 was for the acquisition of a majority shareof Tecnidex, net of cash received, of $18.2 million, minority investments totaling $11.1 million and the purchase of fixed assets and leasehold improvements,net of proceeds from the sale of assets, of $7.6 million. Cash used in investing activities in 2016 was for the purchase of fixed assets and leaseholdimprovements, net of proceeds from the sale of assets, of $6.0 million and a minority investment and distribution agreement totaling $0.6 million. Cash used in financing activities was $22.2 million for the year ended December 31, 2018, as compared to $14.0 million for the year ended December 31,2017 and $6.1 million for the year ended December 31, 2016. Cash used in financing activities in 2018 was for the payment of Dow liabilities and contingentconsideration of $16.1 million and the repayment of debt in the amount of $6.1 million. Cash used in financing activities in 2017 was for the payment ofDow liabilities of $10.0 million, and the repayment of debt in the amount of $4.0 million. Cash provided by financing activities in 2016 was for therepayment of debt of $4.3 million and the purchase of treasury stock in the amount of $1.5 million. Liquidity
On July 31, 2015, the Company consummated the Business Combination, pursuant to which the Company issued 17,500,000 shares of common stock at adeemed value of $12.00 per share and paid cash consideration of $635.0 million at the closing. The cash consideration was funded through the Company'sinitial public offering, the Term Loan (defined below) and the sale of our PIPE shares (defined below).
Term Loan On July 31, 2015, certain of our subsidiaries entered into a Credit Agreement with Bank of Montreal, as administrative agent (as amended, the “CreditFacility”). The Credit Facility consists of a $425 million term loan (the “Term Loan”), with an
41

Table of Contents
amortization equal to 1.00% per year, and a $25 million revolving loan facility (the “Revolving Loan”). The Revolving Loan includes a $10 million letter-of-credit sub-facility, issuances against which reduce the available capacity for borrowing. As of December 31, 2018, the Company has issued $0.6 million ofletters of credit, against which no funds have been drawn. The Term Loan has a scheduled maturity date of July 31, 2021, and the Revolving Loan, asamended on January 31, 2019, has a scheduled maturity date of December 31, 2020. The interest rates on borrowings under the facilities are either thealternate base rate plus 3.75% or LIBOR plus 4.75% per annum, with a 1.00% LIBOR floor (with step-downs in respect of borrowings under the RevolvingLoan dependent upon the achievement of certain financial ratios). The obligations under the Credit Facility are secured by liens on substantially all of theassets of (a) AgroFresh Inc. and its direct wholly-owned domestic subsidiaries, and (b) AF Solutions Holdings, including the common stock of AgroFresh Inc. The net proceeds of the Term Loan were used to fund a portion of the purchase price payable to Rohm and Haas Company ("R&H"), a subsidiary of Dow, inconnection with the Business Combination. Amounts available under the Revolving Loan may also be used for working capital, general corporate purposes,and other uses, all as more fully set forth in the Credit Agreement.
As of December 31, 2018, the Company was in compliance with the senior secured net leverage covenant and the other covenants in the facility, other thancovenants that apply only to the Company’s ability to borrow under the Revolving Loan(excluding letters of credit). Subsequently, on January 31, 2019, the Credit Facility was amended to decrease the total availability from $25.0 million to$12.5 million and extend the maturity of the Revolving Loan from July 31, 2019 to December 31, 2020. An existing covenant in the credit agreement wasalso amended to allow the Company to have access to the Revolving Loan. As of the Closing Date, the Company incurred approximately $12.9 million in debt issuance costs related to the Term Loan and $1.3 million in costs relatedto the Revolving Loan. The debt issuance costs associated with the Term Loan were capitalized against the principal balance of the debt, and the RevolvingLoan costs were capitalized in Other Assets. All issuance costs will be accredited through interest expense for the duration of each respective debt facility.The accretion in interest expense during the year ended December 31, 2018, and 2017 was approximately $2.5 million and $2.4 million, respectively. PIPE Shares In connection with the closing of the Business Combination, we issued an aggregate of 4,878,048 shares of our common stock, for an aggregate purchaseprice of $50.0 million, in a private placement (“PIPE”). Stock Repurchase Program In November 2015, the Company’s Board of Directors approved a Stock Repurchase Program totaling $10 million of the Company’s publicly-traded sharesof common stock. The Repurchase Program was to remain in effect for a period of one year, until November 17, 2016. During the year ended December 31,2016, the Company repurchased 249,047 shares of common stock at an average market price of $5.95. Off-Balance Sheet Arrangements As of December 31, 2018, we did not have any off-balance sheet arrangements as defined in Item 303(a)(4)(ii) of Regulation S-K and did not have anycommitments or contractual obligations. We have not guaranteed any debt or commitments of other entities or entered into any options on non-financialassets.
ITEM 7A. QUANTITATIVE AND QUALITATIVE DISCLOSURES ABOUT MARKET RISK
As a smaller reporting company, we are not required to provide the information required by this Item.
42

Table of Contents
ITEM 8 - FINANCIAL INFORMATION
INDEX TO CONSOLIDATED FINANCIAL STATEMENTSPage
Report of Independent Registered Public Accounting Firm 44Consolidated Balance Sheets 45Consolidated Statements of (Loss) Income 46Consolidated Statements of Comprehensive (Loss) Income 47Consolidated Statements of Stockholders' Equity 48Consolidated Statements of Cash Flows 49Notes to Consolidated Financial Statements 51
43

Table of Contents
REPORT OF INDEPENDENT REGISTERED PUBLIC ACCOUNTING FIRM
To the Board of Directors and Stockholders ofAgroFresh Solutions, Inc.Philadelphia, Pennsylvania Opinion on the Financial StatementsWe have audited the accompanying consolidated balance sheets of AgroFresh Solutions, Inc. and subsidiaries (the "Company") as of December 31, 2018 and2017, the related consolidated statements of (loss) income, comprehensive (loss) income, stockholders' equity, and cash flows for each of the three years inthe period ended December 31, 2018, and the related notes and the schedules listed in the Index at Item 15 (collectively referred to as the “consolidatedfinancial statements"). In our opinion, the consolidated financial statements present fairly, in all material respects, the financial position of the Company as ofDecember 31, 2018, and 2017, and the results of its operations and its cash flows for each of the three years in the period ended December 31, 2018, inconformity with the accounting principles generally accepted in the United States of America.
Basis for OpinionThese consolidated financial statements are the responsibility of the Company's management. Our responsibility is to express an opinion on the Company'sconsolidated financial statements based on our audits. We are a public accounting firm registered with the Public Company Accounting Oversight Board(United States) (PCAOB) and are required to be independent with respect to the Company in accordance with the U.S. federal securities laws and theapplicable rules and regulations of the Securities and Exchange Commission and the PCAOB.
We conducted our audits in accordance with the standards of the PCAOB. Those standards require that we plan and perform the audit to obtain reasonableassurance about whether the financial statements are free of material misstatement, whether due to error or fraud. The Company is not required to have, norwere we engaged to perform, an audit of its internal control over financial reporting. As part of our audits, we are required to obtain an understanding ofinternal control over financial reporting but not for the purpose of expressing an opinion on the effectiveness of the Company’s internal control overfinancial reporting. Accordingly, we express no such opinion. Our audits included performing procedures to assess the risks of material misstatement of the consolidated financial statements, whether due to error or fraud,and performing procedures that respond to those risks. Such procedures included examining, on a test basis, evidence regarding the amounts and disclosuresin the consolidated financial statements. Our audits also included evaluating the accounting principles used and significant estimates made by management,as well as evaluating the overall presentation of the consolidated financial statements. We believe that our audits provide a reasonable basis for our opinion.
/s/ DELOITTE & TOUCHE LLP
Philadelphia, PennsylvaniaMarch 11, 2019
We have served as the Company's auditor since 2014.
44

Table of Contents
AgroFresh Solutions, Inc.CONSOLIDATED BALANCE SHEETS
(In thousands, except share and per share data)
December 31,2018
December 31,2017
ASSETSCurrent Assets:
Cash and cash equivalents $ 34,852 $ 64,533 Accounts receivable, net of allowance for doubtful accounts of $2,336 and $1,550, respectively 67,942 71,509 Inventories 24,807 24,109 Other current assets 15,608 18,684 Total current assets 143,209 178,835
Property and equipment, net 13,289 12,200 Goodwill 6,670 9,402 Intangible assets, net 711,967 757,882 Deferred income tax assets 7,332 8,198 Other assets 16,820 16,746 TOTAL ASSETS $ 899,287 $ 983,263
LIABILITIES AND STOCKHOLDERS’ EQUITYCurrent Liabilities:
Accounts payable $ 7,530 $ 15,014 Current portion of long-term debt 6,419 7,926 Income taxes payable 4,815 5,931 Accrued expenses and other current liabilities 45,340 65,809 Total current liabilities 64,104 94,680
Long-term debt 400,309 402,868 Other non-current liabilities 32,066 38,505 Deferred income tax liabilities 30,232 31,130 Total liabilities 526,711 567,183
Commitments and Contingencies (Note 17)Stockholders’ equity:
Common stock, par value $0.0001; 400,000,000 shares authorized, 51,071,573 and 51,002,234 shares issuedand 50,410,192 and 50,340,853 outstanding at December 31, 2018 and December 31, 2017, respectively 5 5 Preferred stock; par value $0.0001, 1 share authorized and outstanding at December 31, 2018 and December 31,2017 — — Treasury stock; par value $0.0001, 661,381 shares at December 31, 2018 and December 31, 2017, respectively (3,885) (3,885)Additional paid-in capital 535,819 533,015 Accumulated deficit (138,789) (108,729)Accumulated other comprehensive loss (28,837) (12,769)Total AgroFresh stockholders’ equity 364,313 407,637 Non-controlling interest 8,263 8,443
Total stockholders' equity 372,576 416,080 TOTAL LIABILITIES AND STOCKHOLDERS' EQUITY $ 899,287 $ 983,263
See accompanying notes to consolidated financial statements.
45
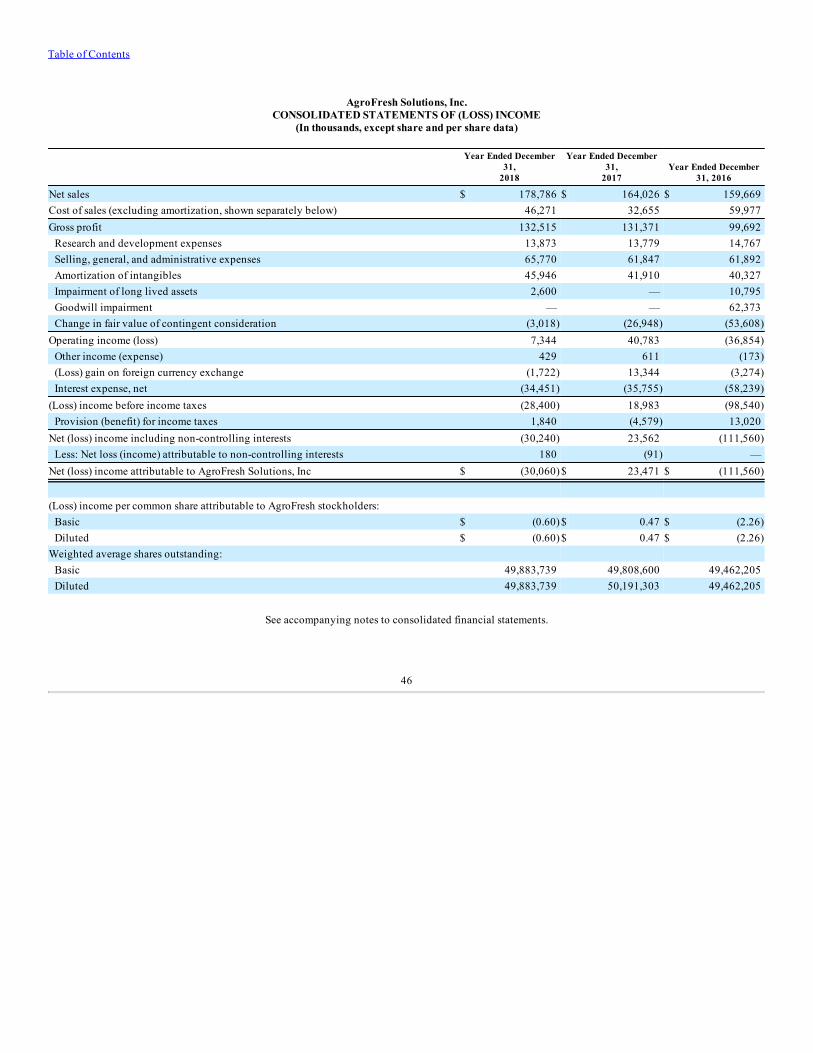
Table of Contents
AgroFresh Solutions, Inc.CONSOLIDATED STATEMENTS OF (LOSS) INCOME
(In thousands, except share and per share data)
Year Ended December31,
2018
Year Ended December31,
2017Year Ended December
31, 2016
Net sales $ 178,786 $ 164,026 $ 159,669 Cost of sales (excluding amortization, shown separately below) 46,271 32,655 59,977 Gross profit 132,515 131,371 99,692
Research and development expenses 13,873 13,779 14,767 Selling, general, and administrative expenses 65,770 61,847 61,892 Amortization of intangibles 45,946 41,910 40,327 Impairment of long lived assets 2,600 — 10,795 Goodwill impairment — — 62,373 Change in fair value of contingent consideration (3,018) (26,948) (53,608)
Operating income (loss) 7,344 40,783 (36,854)Other income (expense) 429 611 (173)(Loss) gain on foreign currency exchange (1,722) 13,344 (3,274)Interest expense, net (34,451) (35,755) (58,239)
(Loss) income before income taxes (28,400) 18,983 (98,540)Provision (benefit) for income taxes 1,840 (4,579) 13,020
Net (loss) income including non-controlling interests (30,240) 23,562 (111,560)Less: Net loss (income) attributable to non-controlling interests 180 (91) —
Net (loss) income attributable to AgroFresh Solutions, Inc $ (30,060) $ 23,471 $ (111,560)
(Loss) income per common share attributable to AgroFresh stockholders:Basic $ (0.60) $ 0.47 $ (2.26)Diluted $ (0.60) $ 0.47 $ (2.26)
Weighted average shares outstanding:Basic 49,883,739 49,808,600 49,462,205 Diluted 49,883,739 50,191,303 49,462,205
See accompanying notes to consolidated financial statements.
46

Table of Contents
AgroFresh Solutions, Inc.CONSOLIDATED STATEMENTS OF COMPREHENSIVE (LOSS) INCOME
(In thousands)
Year Ended December 31,2018
Year Ended December31,
2017Year Ended December 31,
2016
Net (loss) income $ (30,240) $ 23,562 $ (111,560)Other comprehensive (loss) income:
Foreign currency translation adjustments (19,340) (8,038) 1,263 Unrealized gain (loss) on hedging activity, net of tax $944, $98 and $0,respectively 3,553 (358) — Realized gain on hedging activity reclassified to net income, net of tax $75, $0 and$0, respectively (281) — — Pension and other postretirement benefit plans adjustment, net of tax of $0, $0, and$11, respectively — — (77)
Comprehensive (loss) income, net of tax $ (46,308) $ 15,166 $ (110,374)
See accompanying notes to consolidated financial statements.
47

Table of Contents
AgroFresh Solutions, Inc.CONSOLIDATED STATEMENTS OF STOCKHOLDERS’ EQUITY
(In thousands, except share and per share data)
Preferred Stock Common StockTreasury
Stock AdditionalPaid-inCapital
AccumulatedDeficit
AccumulatedOther
Comprehensive(Loss) Income
Non-ControllingInterest
TotalStockholders’
EquityShares Amount Shares Amount Amount
Balance at December 31, 2015 1 $ — 49,940,548 $ 5 $ (2,397) $ 472,494 $ (20,640) $ (5,559) $ — $ 443,903 Stock-based compensation — — — — — 3,250 — — — 3,250 Transfer of director compensationfrom liability to equity — — — — — 185 — — — 185 Issuance of stock, net of forfeitures — — 813,073 — — — — — — — Shares withheld for taxes — — (55,034) — — (331) — — — (331)Repurchase of stock for treasury — — — — (1,488) — — — — (1,488)Comprehensive loss — — — — — — (111,560) 1,186 — (110,374)Balance at December 31, 2016 1 $ — 50,698,587 $ 5 $ (3,885) $ 475,598 $ (132,200) $ (4,373) $ — $ 335,145 Stock-based compensation — — — — — 1,886 — — — 1,886 Transfer of director compensationfrom liability to equity — — — — — 442 — — — 442 Issuance of stock, net of forfeitures — — 303,647 — — — — — — — Settlement of Dow liabilities — — — — — 55,089 — — — 55,089 Purchase of Non-controlling interest — — — — — — — — 8,352 8,352 Comprehensive income — — — — — — 23,471 (8,396) 91 15,166 Balance at December 31, 2017 1 — 51,002,234 $ 5 (3,885) $ 533,015 $ (108,729) $ (12,769) $ 8,443 $ 416,080 Stock-based compensation — — — — — 2,804 — — — 2,804 Issuance of stock, net of forfeitures — — 69,339 — — — — — — — Comprehensive loss — — — — — — (30,060) (16,068) (180) (46,308)Balance at December 31, 2018 1 $ — 51,071,573 $ 5 $ (3,885) $ 535,819 $ (138,789) $ (28,837) $ 8,263 $ 372,576
See accompanying notes to consolidated financial statements.
48
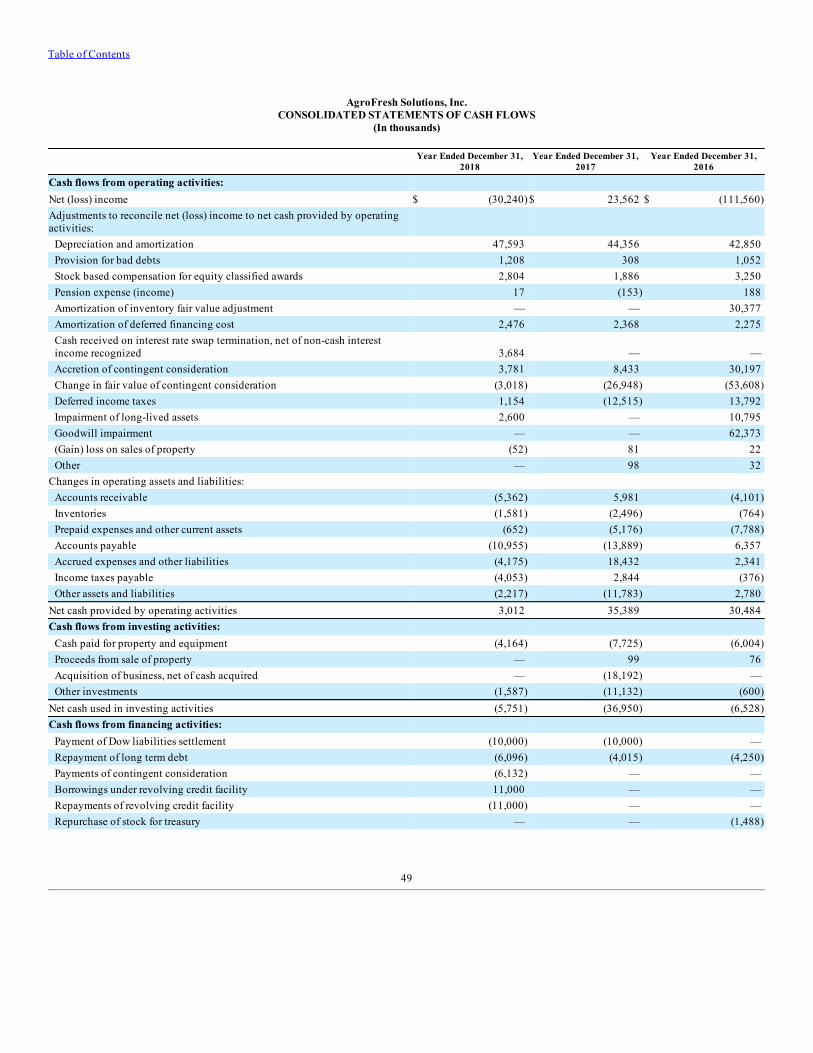
Table of Contents
AgroFresh Solutions, Inc.CONSOLIDATED STATEMENTS OF CASH FLOWS
(In thousands)
Year Ended December 31,
2018Year Ended December 31,
2017Year Ended December 31,
2016
Cash flows from operating activities: Net (loss) income $ (30,240) $ 23,562 $ (111,560)Adjustments to reconcile net (loss) income to net cash provided by operatingactivities:
Depreciation and amortization 47,593 44,356 42,850 Provision for bad debts 1,208 308 1,052 Stock based compensation for equity classified awards 2,804 1,886 3,250 Pension expense (income) 17 (153) 188 Amortization of inventory fair value adjustment — — 30,377 Amortization of deferred financing cost 2,476 2,368 2,275 Cash received on interest rate swap termination, net of non-cash interestincome recognized 3,684 — — Accretion of contingent consideration 3,781 8,433 30,197 Change in fair value of contingent consideration (3,018) (26,948) (53,608)Deferred income taxes 1,154 (12,515) 13,792 Impairment of long-lived assets 2,600 — 10,795 Goodwill impairment — — 62,373 (Gain) loss on sales of property (52) 81 22 Other — 98 32
Changes in operating assets and liabilities:Accounts receivable (5,362) 5,981 (4,101)Inventories (1,581) (2,496) (764)Prepaid expenses and other current assets (652) (5,176) (7,788)Accounts payable (10,955) (13,889) 6,357 Accrued expenses and other liabilities (4,175) 18,432 2,341 Income taxes payable (4,053) 2,844 (376)Other assets and liabilities (2,217) (11,783) 2,780
Net cash provided by operating activities 3,012 35,389 30,484 Cash flows from investing activities:
Cash paid for property and equipment (4,164) (7,725) (6,004)Proceeds from sale of property — 99 76 Acquisition of business, net of cash acquired — (18,192) — Other investments (1,587) (11,132) (600)
Net cash used in investing activities (5,751) (36,950) (6,528)Cash flows from financing activities:
Payment of Dow liabilities settlement (10,000) (10,000) — Repayment of long term debt (6,096) (4,015) (4,250)Payments of contingent consideration (6,132) — — Borrowings under revolving credit facility 11,000 — — Repayments of revolving credit facility (11,000) — — Repurchase of stock for treasury — — (1,488)
49

Table of Contents
Payment of withholding taxes related to stock-based compensation toemployees — — (331)
Net cash used in financing activities (22,228) (14,015) (6,069)Effect of exchange rate changes on cash and cash equivalents (4,714) 2,797 1,660 Net (decrease) increase in cash and cash equivalents (29,681) (12,779) 19,547
Cash and cash equivalents, beginning of period 64,533 77,312 57,765 Cash and cash equivalents, end of period $ 34,852 $ 64,533 $ 77,312
Supplemental disclosures of cash flow information: Cash paid for:
Interest $ 34,712 $ 18,884 $ 24,560 Income taxes $ 6,949 $ 3,257 $ 3,095
Supplemental schedule of non-cash investing and financing activities: Accrued purchases of property and equipment $ 607 $ 1,422 $ 815 Acquisition-related contingent consideration $ — $ 691 $ — Settlement of Dow liabilities not resulting from a cash payment $ — $ 55,089 $ —
See accompanying notes to consolidated financial statements.
50

Table of Contents
AgroFresh Solutions, Inc.NOTES TO CONSOLIDATED FINANCIAL STATEMENTS 1. Description of Business
AgroFresh Solutions, Inc. (the “Company”) is a global leader in delivering innovative food preservation and waste reduction solutions for fresh produce. TheCompany is empowering the food industry with Smarter FreshnessTM, a range of integrated solutions designed to help growers, packers and retailers improveproduce freshness and quality while reducing waste. The Company’s solutions range from near-harvest with HarvistaTM and LandSpringTM to itsmarquee SmartFreshTM Quality System, which includes SmartFreshTM, FreshCloud and ActiMistTM, working together to maintain the quality of storedproduce. The Company has a controlling interest in Tecnidex Fruit Protection, S.A.U. (“Tecnidex”), a leading provider of post-harvest fungicides, waxes andbiocides for the citrus market. Additionally, the Company’s initial retail solution, RipeLockTM, optimizes banana ripening for the benefit of retailers andconsumers. The Company has key products registered in over 50 countries, supports approximately 3,900 direct customers and services over 25,000 storagerooms globally. The end markets that the Company serves are seasonal and are generally aligned with the seasonal growing patterns of the Company’s customers. For thosecustomers growing, harvesting or storing apples, the Company’s primary target market, the peak season in the southern hemisphere is the first and secondquarters of each year, while the peak season in the northern hemisphere is the third and fourth quarters of each year. Within each half-year period (i.e., Januarythrough June for the southern hemisphere, and July through December for the northern hemisphere) the apple growing season has historically occurred duringboth quarters. A variety of factors, including weather, may affect the timing of the growing, harvesting and storing patterns of the Company’s customers andtherefore shift the consumption of the Company’s services and products between the first and second quarters primarily in the southern hemisphere orbetween the third and fourth quarters primarily in the northern hemisphere.
The Company was originally incorporated as Boulevard Acquisition Corp. (“Boulevard”), a blank check company, in Delaware on October 24, 2013, and wasformed for the purpose of effecting a merger, capital stock exchange, asset acquisition, stock purchase, reorganization or similar business combination. OnJuly 31, 2015, the Company completed a Business Combination (refer to Note 3) and changed its name to AgroFresh Solutions, Inc. Prior to consummation ofthe Business Combination, the Company’s efforts were limited to organizational activities, its initial public offering and related financings, and the search forsuitable business acquisition transactions.
2. Basis of Presentation and Summary of Significant Accounting Policies Section 107 of the JOBS Act provides that an “emerging growth company” can take advantage of the extended transition period provided in Section 7(a)(2)(B) of the Securities Act for complying with new or revised accounting standards. An “emerging growth company” can therefore delay the adoption of certainaccounting standards until those standards would otherwise apply to private companies.
The Company is an emerging growth company, and can adopt the new or revised standard at the time private companies adopt the new or revised standard.The Company has elected not to opt out of such extended transition period which means that when a standard is issued or revised and it has differentapplication dates for public or private companies, the Company, as an emerging growth company, can adopt the new or revised standard at the time privatecompanies adopt the new or revised standard. This may make comparison of the Company’s financial statements with another public company, which isneither an emerging growth company nor an emerging growth company which has opted out of using the extended transition period, difficult or impossiblebecause of the potential differences in accounting standards used. Principles of Consolidation The accompanying consolidated financial statements include the accounts of the Company and entities in which the Company has a controlling votinginterest. All intercompany balances and transactions have been eliminated in consolidation. Use of Estimates The preparation of the consolidated financial statements in conformity with accounting principles generally accepted in the United States of America (“U.S.GAAP”) requires management to make estimates and assumptions that affect the amounts reported in the consolidated financial statements andaccompanying notes. Management believes that such estimates have been based on reasonable and supportable assumptions and the resulting estimates arereasonable for use in the preparation of the consolidated financial statements. Actual results could differ from these estimates. The Company’s significantestimates include
51

Table of Contents
the allocation of the purchase price to the fair value of assets acquired and liabilities assumed, impairment of goodwill and identifiable intangible assets,stock-based compensation, contingent liabilities and income tax valuation allowances.
SUMMARY OF SIGNIFICANT ACCOUNTING POLICIES Adoption of Highly Inflationary Accounting in Argentina
GAAP requires the use of highly inflationary accounting for countries whose cumulative three-year inflation rate exceeds 100%. The Company has beenclosely monitoring the inflation data and currency volatility in Argentina, where there are multiple data sources for measuring and reporting inflation. In thesecond quarter of 2018, the Argentine peso rapidly devalued relative to the U.S. dollar, which along with increased inflation, indicated that the three-yearcumulative inflation rate in that country exceeded 100% as of June 30, 2018. As a result, the Company has elected to adopt highly inflationary accounting asof July 1, 2018 for subsidiaries in Argentina. Under highly inflationary accounting, the functional currency of subsidiaries in Argentina became the U.S.dollar, and their income statement and balance sheet will be measured in U.S. dollars using both current and historical rates of exchange. The effect ofchanges in exchange rates on Argentine peso-denominated monetary assets and liabilities will be reflected in earnings. As December 31, 2018, theCompany’s subsidiaries in Argentina had a net asset position of $18.3 million. Net sales attributable to Argentina were approximately 3.2% and 3.6% of theCompany’s consolidated net sales for the years ended December 31, 2018 and 2017, respectively.
Revenue Recognition
On January 1, 2018, the Company began to account for revenue in accordance with Accounting Standards Codification ("ASC") 606, which requires revenuerecognized to represent the transfer of promised goods or services to customers at an amount that reflects the consideration which is expected to be receivedin exchange for those goods or services. The Company utilized the modified retrospective method of adoption to all contracts that were not completed as ofJanuary 1, 2018. Prior period results were not adjusted and continue to be reported under the accounting standards in effect for the prior period. TheCompany has not made any significant changes to judgments in applying ASC 606 during the year ended December 31, 2018.
Performance Obligations
The Company derives revenue from the sale of products created with proprietary technology to regulate the ripening of produce and through performing postapplication technical services for its customers. A performance obligation is a promise in a contract to transfer a distinct good or service to the customer, andis the unit of account in ASC 606. A contract’s transaction price is allocated to each distinct performance obligation and recognized as revenue when, or as,the performance obligation is satisfied. The majority of the Company’s contracts have multiple performance obligations primarily related to productapplication and post application services, which the Company provides. For contracts with multiple performance obligations, the Company allocates thecontract’s transaction price to each performance obligation using the best estimate of the standalone selling price of each distinct good or service in thecontract. The method used to estimate standalone selling price is the expected cost plus a margin approach, under which the Company calculates the costs ofsatisfying a performance obligation and factors in an appropriate margin for that distinct good or service. The transaction price is primarily fixed, as prices are governed by the terms and conditions of the Company's contracts with customers, and payment istypically made under standard terms. The Company has certain transactions that provide for variable consideration through rebate and customer loyaltyprograms. Depending on the program, the customer may elect to receive either a credit against its account or a cash payment. The Company recognizes anaccrued provision for estimated rebates and customer loyalty program payouts at the time services are provided. The primary factors considered whenestimating the provision for rebates and customer loyalty programs are the average historical experience of aggregate credits issued, the historicalrelationship of rebates as a percentage of total gross product sales, and the contract terms and conditions of the various rebate programs in effect at the timeservices are performed. The Company provides standard warranty provisions.Performance obligations related to product application are typically satisfied at a point in time when the customer obtains control upon application.Performance obligations related to post-application services are satisfied over time and revenue is recognized using the output method, as control of theservice transfers to the customer over time during and after storage of the produce. The Company believes that this method provides a faithful depiction ofthe transfer of value over the term of the performance obligation because the level of effort in providing these services is consistent during the service period.Performance obligations related to Tecnidex sales-type leases are satisfied at the point in time that equipment is installed at the customer site.
52

Table of Contents
Disaggregation of Revenue
The Company disaggregates revenue from contracts with customers into geographic region, product and timing of transfer of goods and services. TheCompany determined that disaggregating revenue into these categories achieves the disclosure objective of depicting how the nature, amount, timing anduncertainty of revenue and cash flows are affected by economic factors.
Revenues for the year ended December 31, 2018(in thousands)
Region North America EMEA Latin America Asia Pacific Total Revenue
Product 1-MCP based $ 40,597 $ 71,960 $ 26,820 $ 15,082 $ 154,459 Fungicides, waxes, coatings, biocides 651 20,766 — — 21,417 Other* 2,022 530 358 — 2,910 Total $ 43,270 $ 93,256 $ 27,178 $ 15,082 $ 178,786
Pattern of Revenue Recognition Products transferred at a point in time $ 42,555 $ 92,555 $ 27,101 $ 14,602 $ 176,813 Services transferred over time 715 701 77 480 1,973 Total $ 43,270 $ 93,256 $ 27,178 $ 15,082 $ 178,786
*Other includes RipeLock, FreshCloud, LandSpring, Verigo (as defined in Note 3), technical services and sales-type leases related to Tecnidex.
Contract Assets and Liabilities
ASC 606 requires an entity to present a revenue contract as a contract asset when the entity performs its obligations under the contract by transferring goodsor services to a customer before the customer pays consideration or before payment is due. ASC 606 also requires an entity to present a revenue contract as acontract liability in instances when a customer pays consideration, or an entity has a right to an amount of consideration that is unconditional (e.g.receivable), before the entity transfers a good or service to the customer. The following table presents changes in the Company’s contract assets and liabilitiesduring the twelve months ended December 31, 2018:
(in thousands) Balance at January 1, 2018 Additions Deductions Balance at December 31, 2018
Contract assets: Unbilled revenue 739 7,117 (5,900) 1,956 Contract liabilities: Deferred revenue 100 4,428 (3,248) 1,280
The Company recognizes contract assets in the form of unbilled revenue in instances where services are performed by the Company but not billed by periodend. The Company recognizes contract liabilities in the form of deferred revenue in instances where a customer pays in advance for future services to beperformed by the Company. The Company generally receives payments from its customers based on standard terms and conditions. No significant changes orimpairment losses occurred to contract balances during the year ended December 31, 2018. Amounts reclassified from unbilled revenue to accountsreceivable for the year ended December 31, 2018 were $5.9 million. Amounts reclassified from deferred revenue to revenue were $3.2 million for the yearended December 31, 2018.
Practical Expedients Elected
The Company has elected the following practical expedients in applying ASC 606 across all reportable segments:
53

Table of Contents
Unsatisfied Performance Obligations. Because all of its performance obligations relate to contracts with a duration of less than one year, the Company haselected to apply the optional exemption provided in ASC 606 and, therefore, is not required to disclose the aggregate amount of the transaction priceallocated to performance obligations that are unsatisfied or partially unsatisfied at the end of the reporting period.
Contract Costs. All incremental customer contract acquisition costs are expensed as they are incurred as the amortization period of the asset that theCompany otherwise would have recognized is one year or less in duration.
Significant Financing Component. The Company does not adjust the promised amount of consideration for the effects of a significant financing componentas the Company expects, at contract inception, that the period between when the entity transfers a promised good or service to a customer and when thecustomer pays for that good or service will be one year or less. Sales Tax Exclusion from the Transaction Price. The Company excludes from the measurement of the transaction price all taxes assessed by a governmentalauthority that are both imposed on and concurrent with a specific revenue-producing transaction and collected by the Company from the customer.
Shipping and Handling Activities. The Company accounts for shipping and handling activities it performs after a customer obtains control of the good asactivities to fulfill the promise to transfer the good, which are recognized in cost of goods sold.
Modified Retrospective Method. The Company adopted ASC 606 on January 1, 2018 utilizing the modified retrospective method, which meant the Companydid not retrospectively adjust prior periods. The Company applied the modified retrospective method only to contracts that were not completed at January 1,2018 and accounted for the aggregate effect of any contract modifications upon adoption. No cumulative adjustment to retained earnings was recorded uponadoption. The following table summarizes the amounts by which the consolidated financial statements are affected in the current reporting period by ASC606 as compared with the guidance that was in effect before the change.
Balance at December 31, 2018(in thousands) As reported ASC 606 Adjustments
Balances without adoption of ASC606
Consolidated Balance Sheet Liabilities: Accrued expenses and other current liabilities $ 45,340 $ (1,093) $ 44,247 Equity: Accumulated deficit $ (138,789) $ 1,093 $ (137,696)
Year ended December 31, 2018(in thousands) As reported ASC 606 Adjustments
Balances without adoption of ASC606
Consolidated Statement of Operations Revenue Net sales 178,786 1,093 179,879 Net loss attributable to AgroFresh Solutions, Inc. (30,060) 853 (29,207)
For additional information, these condensed consolidated financial statements should be read in conjunction with the consolidated financial statements andnotes included in the Company's Annual Report on Form 10-K for the year ended December 31, 2018.
Cost of Sales The Company offers SmartFresh and Harvista applications at customer sites through a direct service model primarily utilizing third-party service providers.Amounts recorded as cost of sales relate to direct costs incurred in connection with the purchase, delivery and application of the product. Such costs arerecorded as the related revenue is recognized. Our cost of sales consists primarily of cost of materials, application costs and certain supply chain costs.
54

Table of Contents
Cash and Cash Equivalents The Company considers short-term, highly liquid investments with original maturities of three months or less when purchased to be cash equivalents. Accounts Receivable, Net Accounts receivable, net consists primarily of (i) outstanding amounts invoiced to end-users, re-sellers and third-party contractors and (ii) unbilled revenue inarrangements where the earnings process has been completed but invoices have not been issued as of the reporting date.
The allowance for doubtful accounts is based on historical experience and a review on a specific identification basis of the collectability of outstandingreceivables. Inventories Inventories, consisting primarily of chemical products and packing, are valued at the lower of cost (under the first-in, first-out method) or net realizable value.Raw materials are valued using the weighted average moving cost method. In connection with the Business Combination, the Company recognized a step-upin fair value of inventory of $103.5 million, which was amortized into cost of sales in the consolidated statements of (loss) income over a periodapproximating the Company’s estimated inventory turnover cycle and was fully amortized during fiscal year 2016. Property and Equipment Property and equipment includes leasehold improvements, machinery and equipment, and furniture. Property and equipment acquired in businesscombinations are initially recorded at their estimated fair value. Property and equipment acquired or constructed in the normal course of business are initiallyrecorded at cost. The Company provides for depreciation and amortization based on the estimated useful lives of assets using the straight-line method. Estimated useful lives are as follows:
Leasehold improvements Shorter of useful life or lease termMachinery & Equipment 1—12 yearsFurniture 1—12 years
Leasehold improvements are amortized on a straight-line basis over the shorter of the estimated useful lives of the assets or the related lease term, whichgenerally includes reasonably assured option periods expected to be exercised by the Company when the Company would suffer an economic penalty if notexercised. Gains and losses on the disposal of assets are recorded as the difference between the net proceeds received and net carrying values of the assets disposed.
Impairment of Long-Lived Assets
Company management continually evaluates whether events or changes in circumstances might indicate that the remaining estimated useful life of long-lived assets may warrant revision, or that the remaining balance may not be recoverable. When factors indicate that long-lived assets should be evaluated forpossible impairment, the Company uses an estimate of the related undiscounted cash flows in measuring whether the long-lived asset should be written downto fair value. Measurement of the amount of impairment would be based on generally accepted valuation methodologies, as deemed appropriate. As ofDecember 31, 2018, Company management believed that no revision to the remaining useful lives or write-down of the Company’s long-lived assets wasrequired. For the fiscal year ended December 31, 2017, the Company management believed that no revision to the remaining useful lives or write-down of theCompany's long-lived assets were necessary.
Leases Leases in which the risk of ownership is retained by the lessor are classified as operating leases. Leases which substantially transfer to the lessee all of thebenefits and risks inherent in ownership are classified as capital leases. Assets, if any, acquired under capital leases are depreciated on the same basis asproperty, plant and equipment. Rental payments and incentives are
55

Table of Contents
expensed on a straight-line basis. The Company conducts a portion of its operations from leased facilities and leases certain equipment through agreementsthat are all treated as operating leases. Selling, General and Administrative Expenses The Company expenses selling, general and administrative costs as incurred. Selling, general and administrative expense consists primarily of compensation,benefits and other employee-related expenses for personnel in the Company’s administrative, finance, legal, business development, commercial, sales,marketing and human resource functions. Other expenses include professional fees from outside service providers and costs incurred in connection withservices provided by Dow under a Transition Services Agreement entered into upon consummation of the Business Combination. Debt Issuance Costs The debt issuance costs associated with the Term Loan (defined in Note 10 below) were capitalized and are presented as a reduction of the principal balanceof the debt, and the Revolving Loan costs (defined in Note 10 below) were capitalized in Other Assets. All issuance costs will be accredited through interestexpense for the duration of the respective debt facilities. Goodwill and Indefinite-lived Intangible Assets The Company’s goodwill and trade names are not amortized, but tested annually for impairment and more frequently if events and circumstances indicatethat the asset might be impaired. The Company conducts annual impairment tests on goodwill and trade names on the last day of each fiscal year or wheneveran indicator of impairment exists. In assessing goodwill impairment, the Company has the option to first assess the qualitative factors to determine whether events or circumstances indicatethat it is more likely than not that the fair value of the reporting unit is less than its carrying amount. If the qualitative factors indicate that it is more likelythan not that the fair value of a reporting unit is less than its carrying amount, the Company performs a two-step impairment test of goodwill. In the first step,the Company estimates the fair value of the reporting unit and compares it to the carrying value of the reporting unit. If the carrying value exceeds theestimated fair value of the reporting unit, the second step is performed to measure the amount of the impairment loss, if any. In the second step, the amount ofthe impairment loss is the excess of the carrying amount of the goodwill over its estimated implied fair value. At December 31, 2016, the Companycompleted its annual evaluation of goodwill impairment and fully impaired its goodwill balance of $62.4 million. In connection with the Tecnidexacquisition in 2017, the Company recorded approximately $9.4 million of goodwill which was based on the preliminary purchase price allocation as ofDecember 31, 2017. During the year ended December 31, 2018, there was an adjustment made to consideration payable to holders of Tecnidex which resultedin a measurement period adjustment of $2.8 million to the purchase price allocation.
The Company’s indefinite-lived intangible assets other than goodwill, which primarily relate to trade names, are not amortized, but are tested at leastannually for impairment using a quantitative or qualitative impairment analysis, and more frequently if events and circumstances indicate that the assetmight be impaired. The quantitative impairment analysis compares the fair value of each indefinite-lived intangible asset, based on discounted future cashflows using a relief-from-royalty methodology with the carrying value of the asset. If the carrying amount of an indefinite-lived intangible asset exceeds itsfair value, an impairment loss is recognized equal to the difference between the estimated fair value of the indefinite-lived intangible asset and its carryingamount. During the year ended December 31, 2016, the Company recorded a $9.5 million impairment charge related to a decline in the estimated value of theAgroFresh and SmartFresh trade names. During the year ended December 31, 2018, the Company recorded a $2.6 million impairment charge related to adecline in the estimated value of the SmartFresh trade name. Definite-Lived Intangible Assets Intangible assets subject to amortization primarily consist of acquired technology and customer relationships and are amortized on a straight-line basis overtheir estimated useful lives. Stock-Based Compensation The Company grants various stock-based compensation awards to its officers, employees and Board of Directors with service (time) and/or performancevesting conditions. Awards without cash settlement conditions are equity-classified. The Company measures and recognizes compensation expense over thevesting period based on their estimated grant date fair values.
56

Table of Contents
Phantom stock awards and stock appreciation rights either require or provide the holder of the award with the option to settle in cash. The Company's awardswith cash settlement conditions are accounted for as liabilities and the Company measures and recognizes compensation expense over the vesting periodbased on their estimated fair values as of the most recent reporting date. Fair values for options and stock appreciation rights are estimated using an option pricing model. Fair values for restricted stock and phantom stock awardsare based on the closing price of the Company’s common stock on the measurement date. Compensation expense for the Company’s stock-based compensation awards is generally recognized on a straight-line basis over the vesting period of theaward. For awards with performance conditions, compensation expense is recognized only if satisfaction of the performance condition is considered probableof being achieved.
Research and Development
Expenditures for research and development costs, which primarily relate to internal compensation costs and professional service fees, are charged to expenseas incurred.
Income Taxes The Company accounts for income taxes under the asset and liability method, which requires the recognition of deferred tax assets and liabilities for theexpected future tax consequences of events that have been included in the financial statements. Under this method, the Company determines deferred taxassets and liabilities on the basis of the differences between the financial statement and tax bases of assets and liabilities by using enacted tax rates in effectfor the year in which the differences are expected to reverse. The effect of a change in tax rates on deferred tax assets and liabilities is recognized in income inthe period that includes the enactment date.
The Company recognizes deferred tax assets to the extent that we believe that these assets are more likely than not to be realized. In making such adetermination, the Company considers all available positive and negative evidence, including future reversals of existing taxable temporary differences,projected future taxable income, tax-planning strategies, and results of recent operations. If the Company determines that it would be able to realize ourdeferred tax assets in the future in excess of their net recorded amount, it would make an adjustment to the deferred tax asset valuation allowance, whichwould reduce the provision for income taxes.
The Company records uncertain tax positions in accordance with ASC 740 on the basis of a two-step process in which (1) we determine whether it is morelikely than not that the tax positions will be sustained on the basis of the technical merits of the position and (2) for those tax positions that meet the more-likely-than-not recognition threshold, we recognize the largest amount of tax benefit that is more than 50% likely to be realized upon ultimate settlementwith the related tax authority.
Contingencies The Company recognizes liabilities for loss contingencies when it is probable that an asset has been impaired or that a liability has been incurred and theamount of impairment or loss can be reasonably estimated. The Company’s ultimate legal and financial liability with respect to such matters cannot beestimated with certainty and requires the use of estimates. When the reasonable estimate is a range, the recorded loss will be the best estimate within therange. The Company records legal settlement costs when those costs are probable and reasonably estimable. Credit Concentration Risk Financial instruments, which potentially subject the Company to a concentration of credit risk, consist principally of cash deposits. The Company maintainscash balances at financial institutions with strong credit ratings. Generally, amounts invested with financial institutions are in excess of FDIC insurancelimits. Fair Value of Financial Instruments The Company measures fair value using the exchange price that would be received for an asset or paid to transfer a liability (an exit price) in the principal ormost advantageous market for the asset or liability in an orderly transaction between market participants on the measurement date. The Company usesvaluation techniques that maximize the use of observable inputs and minimize the use of unobservable inputs. Based on the underlying inputs, each fairvalue measurement in its entirety is reported in one of the three tiers in the fair value hierarchy, which prioritizes the inputs used in measuring fair value.These tiers include:
57
Table of Contents
• Level 1, defined as observable inputs such as quoted prices in active markets;
• Level 2, defined as inputs other than quoted prices in active markets that are either directly or indirectly observable; and
• Level 3, defined as unobservable inputs which reflect the Company’s own estimates of assumptions that market participants would use in pricing theasset or liability. Valuation techniques may include the use of third-party pricing services, option pricing models, discounted cash flow models andsimilar techniques.
Foreign Currency An entity’s functional currency is the currency of the primary economic environment in which the entity operates; normally, that is the currency of theenvironment in which an entity primarily generates and expends cash. Assets and liabilities are translated at period-end rates; income statement amounts aretranslated at average rates during the course of the period. Translation gains and losses of those operations that use local currency as the functional currency,are included in accumulated other comprehensive (loss) income in the consolidated balance sheets.
Foreign currency exchange transaction gain (loss) is the result of remeasuring transactions denominated in a currency other than our primary currency and isreported in the consolidated statement of operations as a separate line within other income (expense).
Warrants Public Warrants On February 19, 2014, the Company sold 21,000,000 units at a price of $10.00 per unit (the “Units”) in its initial public offering (the “Public Offering”).Each unit consisted of one share of the Company’s common stock and one-half of one warrant (“Warrant”). On March 13, 2014, the Company sold anadditional 1,050,000 units pursuant to the partial exercise by the underwriters for the Public Offering of their over-allotment option. Each such additionalunit consisted of one share of the Company’s common stock and one-half of one warrant. Each whole warrant entitles the holder thereof to purchase one shareof the Company’s common stock at a price of $11.50 per share. These warrants are classified in Stockholders' Equity. Private Placement Warrants Simultaneous with the Public Offering, the Company issued 5,950,000 warrants, and upon the underwriters’ partial exercise of their over-allotment option onMarch 13, 2014, the Company issued an additional 210,000 warrants (collectively, the “Private Placement Warrants”). On December 17, 2015, the Companyamended the Warrant Purchase Agreement (see Note 3) resulting in a reclassification of the Private Placement Warrants into Stockholders' Equity as ofDecember 31, 2015. Recently Issued Accounting Standards and Pronouncements
In August 2017, the Financial Accounting Standards Board ("FASB") issued Accounting Standards Update ("ASU") 2017-12 Targeted Improvements toAccounting for Hedging Activities. This update makes more financial and nonfinancial hedging strategies eligible for hedge accounting. It also amends thepresentation and disclosure requirements and changes how companies assess effectiveness. This update will be effective for the Company for fiscal yearsbeginning after December 15, 2018, and interim periods within those fiscal years. Early adoption is permitted upon its issuance. The Company is currentlyassessing the impact of the future adoption of this standard on its financial statements.
In May 2017, the FASB issued ASU 2017-09, Compensation-Stock Compensation (Topic 718) Scope of Modification Accounting. ASU 2017-09 addressesthe changes to the terms and conditions of share-based awards. The ASU is effective for periods beginning after December 15, 2017 and interim periodstherein on a modified retrospective basis. The Company adopted the new ASU as of January 1, 2018, and it did not have a material impact on the financialstatements.
In January 2017, the FASB issued ASU 2017-01, Business Combinations, Clarifying the Definition of a Business. The new accounting guidance clarifies thedefinition of a business and provides additional guidance to assist entities with evaluating whether transactions should be accounted for as asset acquisitions(or asset disposals) or business combinations (or disposals of a business). Under the new guidance, an entity first determines whether substantially all of thefair value of the assets acquired is concentrated in a single identifiable asset or a group of similar identifiable assets. If this criterion is met, the transaction
58

Table of Contents
should be accounted for as an asset acquisition as opposed to a business combination. This distinction is important because the accounting for an assetacquisition significantly differs from the accounting for a business combination. The new guidance is effective for fiscal years and interim periods withinthose years beginning after December 15, 2017, with early adoption permitted. During the second quarter of 2018, the Company adopted this standard inconnection with the acquisition of Verigo (refer to Note 3).
In May 2014, the FASB issued ASU 2014-09, Revenue from Contracts with Customers (“ASU 2014-09”), which has been updated through several revisionsand clarifications since its original issuance. The core principle of the new standard is that a company should recognize revenue to depict the transfer ofpromised goods or services to customers in accordance with the transfer of control over those goods and services. The new standard also requires additionaldisclosures intended to enable users of financial statements to understand the nature, amount, timing and uncertainty of revenue, and the related cash flows.The standard is effective for interim and annual reporting periods beginning after December 15, 2017. The Company adopted the new revenue standard in thefirst quarter of 2018 using the modified retrospective adoption method.
In March 2017, the FASB issued ASU 2017-07, “Compensation - Retirement Benefits (Topic 715): Improving the Presentation of Net Periodic Pension Costand Net Periodic Postretirement Benefit Cost.” ASU No. 2017-07 requires employers to separate the service cost component from other components of netperiodic benefit costs and to disclose the amounts of net periodic benefit costs that are included in each income statement line item. The amendments of thisASU are effective for fiscal years beginning after December 15, 2017, and interim periods within those fiscal years. The Company adopted the new ASU as ofJanuary 1, 2018, and it did not have a material impact on the financial statements.
In January 2017, the FASB issued ASU No. 2017-04, Intangibles - Goodwill and Other, which simplifies the test for goodwill impairment. The guidance iseffective for the Company beginning in the first quarter of fiscal year 2020. Early adoption is permitted for interim or annual goodwill impairments tests afterJanuary 1, 2017. This standard will impact future financial statements when adopted if the Company has impairment to its goodwill.
In February 2016, the FASB issued ASU 2016-02, “Leases”. The main objective of this update is to increase transparency and comparability amongorganizations by recognizing lease assets and lease liabilities on the balance sheet and disclosing key information about leasing arrangements. This ASU iseffective for fiscal years beginning after December 15, 2018, including interim periods within those fiscal years. The Company will adopt ASU 2016-02 on amodified retrospective basis, applying the transition requirements as of January 1, 2019.
While the Company is continuing to assess the impacts of ASU 2016-02, the Company estimates that the adoption of ASU 2016-02 will result in therecognition of right-of-use assets and lease liabilities for operating leases of approximately $11.0 million on its consolidated balance sheets, with no materialimpact to its consolidated statements of (loss) income. The Company expects to complete its assessment of the full financial impact shortly after December31, 2018, and will include all required presentation and disclosures under ASU 2016-02 in its Form 10-Q for the three months ending March 31, 2019.
3. Business Combination On the Closing Date, the Company consummated a business combination (the “Business Combination”) pursuant to the Stock Purchase Agreement, datedApril 30, 2015 (the “Purchase Agreement”), by and between the Company and Dow providing for the acquisition by the Company of the AgroFresh Businessfrom Dow, resulting in AgroFresh Inc. becoming a wholly-owned, indirect subsidiary of the Company. Pursuant to the Purchase Agreement, the Companypaid the following consideration to Rohm and Haas Company (“R&H”), a subsidiary of Dow: (i) 17.5 million shares of common stock (the “StockConsideration”) and (ii) $635 million in cash (the “Cash Consideration”). On April 4, 2017, the Company entered into an agreement (the “Amendment Agreement”) with Dow, R&H, Boulevard Acquisition Sponsor, LLC (the“Sponsor”), AgroFresh Inc., Avenue Capital Management II, L.P. (“Avenue”) and, solely as to certain sections of the Amendment Agreement, Joel Citron,Darren Thompson and Robert J. Campbell (collectively, the “Founding Holders”), Marc Lasry and Stephen Trevor. Pursuant to the Amendment Agreementand certain related agreements entered into on the same date (as described below), among other things, the Company and Dow agreed to modify certainobligations of the Company pursuant to (i) the Purchase Agreement, (ii) the Tax Receivables Agreement, dated July 31, 2015 (the “Tax ReceivablesAgreement”), among the Company, Dow, R&H and AgroFresh Inc., and (iii) the Warrant Purchase Agreement, dated July 31, 2015 (the “Warrant PurchaseAgreement”), among the Company, Dow, R&H and the Sponsor. Mr. Campbell is a member of the Company's board of directors, each of Mr. Lasry and Mr.Trevor was a member of the Company’s board of directors at the time the Amendment Agreement was entered into, and each of Dow and the Sponsor is asignificant stockholder of the Company.
59

Table of Contents
Amendment Agreement
Pursuant to the Amendment Agreement, the Company agreed to pay Dow the aggregate amount of $20.0 million, of which $10.0 million was paid on April 4,2017 and the remaining $10.0 million was paid on January 31, 2018, in full satisfaction of the Company’s obligations with respect to (i) the working capitaladjustment under the Purchase Agreement, (ii) certain transfer and value added tax reimbursement obligations under the Purchase Agreement, and (iii) theamount payable to Dow pursuant to the Tax Receivables Agreement on account of the 2015 tax year. As of December 31, 2017, these liabilities, inclusive ofaccrued interest, were approximately $17.0 million, $9.3 million, and $12.0 million, respectively. During the year ended December 31, 2017, the liabilitieswere reduced by approximately $18.2 million. During the year ended December 31, 2018, the liabilities were extinguished.
First Amendment to Tax Receivables Agreement
The Company, Dow, R&H and AgroFresh Inc. entered into a First Amendment to the Tax Receivables Agreement (the “TRA Amendment”). The TRAAmendment reduced, from 85% to 50%, the percentage that the Company is required to pay to Dow pursuant to the Tax Receivables Agreement of the annualtax savings, if any, in U.S. Federal, state and local income tax or franchise tax that the Company actually realizes as a result of the increase in tax basis of theAgroFresh assets resulting from a Section 338(h)(10) election that the Company and Dow made in connection with the transactions contemplated by thePurchase Agreement. During the year ended December 31, 2017 the liability to Dow was reduced by approximately $75.3 million as a result of the TRAAmendment.
Stock Buyback Agreement
The Company and Dow entered into a letter agreement (the “Stock Buyback Agreement”), pursuant to which Dow agreed to use its reasonable best efforts topurchase up to 5,070,358 shares of the Company’s common stock in the open market (representing approximately 10% of the total number of shares of theCompany’s common stock then outstanding), over a period of up to 18 months.
Termination of Warrant Purchase Agreement
The Company, Dow, R&H and the Sponsor entered into a letter agreement, pursuant to which the Warrant Purchase Agreement was terminated effectiveimmediately.
As a result of the Amendment Agreement, the TRA Amendment and the termination of the Warrant Purchase Agreement, the Company recorded a reductionof liabilities of $95.1 million net of deferred income taxes of $40.0 million during the year ended December 31, 2017. The net impact of $55.1 million wasrecorded to additional paid-in capital as the agreements were with related parties and the transaction has been treated as a capital transaction.
Acquisition of Tecnidex
On November 7, 2017, the Company entered into a definitive agreement to acquire a controlling-interest in Tecnidex Fruit Protection, S.A.U.("Tecnidex"). The transaction was closed on December 1, 2017. Tecnidex, a privately-held international company, is a leading provider of post-harvestfungicides, waxes, coatings, and biocides for the citrus market, with clients in 18 countries. For over 35 years, Tecnidex has been helping fruit and vegetableproducers offer clean, safe and high-quality products to their regional clients. The acquisition was accounted for as a purchase in accordance with FASBAccounting Standard Codification 805 Business Combination.
At the effective date of the acquisition, the Company agreed to pay holders of Tecnidex $25.0 million in cash for 75% of the outstanding capital stock, ofwhich $20.0 million was paid on December 1, 2017. During 2018, the purchase price was finalized as $22.3 million after giving effect to working capital, netdebt, and other adjustments. The remaining $2.3 million was paid during 2018.
In accordance with the acquisition method of accounting, the Company allocated the purchase price to the estimated fair values of the identifiable assetsacquired and liabilities assumed, with any excess allocated to goodwill.
The preliminary assessment of fair value of the contingent consideration payments on the acquisition date was approximately $0.7 million and was estimatedby applying a probability-based income approach utilizing an appropriate discount rate. This estimation was based on significant inputs that are notobservable in the market, referred to as Level 3 inputs. During the year ended December 31, 2018, there was an adjustment made to the fair value of $0.3million.
60

Table of Contents
Acquisition of Verigo
On April 9, 2018, the Company acquired the assets of Comm-n-Sense Corp., d/b/a Verigo ("Verigo"), pursuant to the terms of an Asset Purchase Agreement,for approximately $1.8 million. Verigo, a privately-held company, provided hardware in the form of wireless data receptors along with cloud-based softwareto synchronize data pulled from the hardware to support and provide tools for monitoring environmental and quality factors, such as temperature and relativehumidity. The transaction was accounted for as an asset acquisition because substantially all of the fair value of the gross assets acquired was concentrated ina singular asset, the acquired software. Asset acquisitions are accounted for using a cost accumulation approach, whereby the total consideration paid isallocated to the individual assets acquired and liabilities assumed on a relative fair value basis.
4. Related Party Transactions The Company is a party to ongoing agreements with Dow, a related party, including, but not limited to, operating-related agreements for certain transitionservices. In connection with the Transition Services Agreement, the Company paid Dow a $5.0 million set-up fee which was amortized over the period duringwhich the services were expected to be provided. In addition, the Company paid Dow $0.6 million on the Business Combination Closing Date to importinventory into Argentina through September 30, 2016.
The Company incurred expenses for such services for the year ended December 31, 2018, December 31, 2017, and December 31, 2016 as follows:
(amounts in thousands)
Year Ended YearEnded
December 31, 2018
Year Ended YearEnded
December 31, 2017
Year Ended YearEnded
December 31, 2016
Amortization of prepayment related to set-up of transition services $ — $ 827 $ 1,526 Ongoing costs of transition services agreement 335 2,970 4,346 Rent expense — 902 1,198 Amortization of prepayment related to Dow importation services — — 397 Other expenses 1,484 439 894 Total incurred expenses $ 1,819 $ 5,138 $ 8,361
As of December 31, 2018 and December 31, 2017, the Company had an outstanding payable to Dow of $0.0 million and $1.2 million, respectively.
Refer to Note 3 regarding the contingent consideration owed to Dow as part of the Business Combination.
In addition, during 2016, the Company made a minority investment in RipeLocker, LLC ("RipeLocker"), a company led by George Lobisser, a director ofAgroFresh. On November 29, 2016, the Company entered into a Mutual Services Agreement (the “Services Agreement”) with George Lobisser andRipeLocker, LLC. Pursuant to the Services Agreement, (i) the Company agreed to provide RipeLocker with technical support, in the form of access to theCompany’s research and development personnel for a specified number of hours for purposes of providing advice and input relating to RipeLocker’sproducts and services, and (ii) Mr. Lobisser agreed to provide consulting services to the Company as may be reasonably requested by the Company from timeto time. The Services Agreement provides for Mr. Lobisser to receive a consulting fee of $5,000 per full day for time spent performing consulting servicesunder the Services Agreement (pro-rated for any partial day), plus reimbursement for out-of-pocket expenses, provided that for each hour of technical supportprovided by the Company to RipeLocker, Mr. Lobisser agreed to provide one-half hour of consulting services for no consideration. In February 2017, theCompany and Mr. Lobisser agreed to substantially curtail any mutual consulting services to be provided under the ServicesAgreement, and that any further services would be provided at no charge. For the year ended December 31, 2018 and December 31, 2017, there were noamounts paid and as of December 31, 2018 and December 31, 2017, there were no material amounts owed to RipeLocker for consulting services.
5. Inventories Inventories at December 31, 2018 and December 31, 2017, consisted of the following:
61

Table of Contents
(in thousands) December 31, 2018 December 31, 2017
Raw material $ 1,286 $ 2,148 Work-in-process 4,749 6,585 Finished goods 17,535 14,647 Supplies 1,237 729 Total inventories $ 24,807 $ 24,109
6. Other Current Assets
The Company’s other current assets at December 31, 2018 and December 31, 2017 consisted of the following:
(in thousands) December 31, 2018 December 31, 2017
VAT receivable $ 7,854 $ 14,088 Prepaid income tax asset 5,090 2,314 Other 2,664 2,282 Total other current assets $ 15,608 $ 18,684
7. Property and Equipment Property and equipment at December 31, 2018 and December 31, 2017 consisted of the following:
(in thousands, except for useful life data)Useful life
(years) December 31, 2018 December 31, 2017
Leasehold improvements 7-20 $ 4,647 $ 2,976 Machinery & equipment 1-12 8,193 7,853 Furniture 1-12 2,712 1,698 Construction in progress 1,744 2,075
17,296 14,602 Less: accumulated depreciation (4,007) (2,402)Total property and equipment, net $ 13,289 $ 12,200
Depreciation expense for the year ended December 31, 2018 and 2017 was $1.6 million and $1.3 million respectively. Depreciation expense is recorded incost of sales, selling, general and administrative expense and research and development expense in the consolidated statements of (loss) income. 8. Goodwill and Intangible Assets Changes in the carrying amount of goodwill for the year ended December 31, 2018 and December 31, 2017 are as follows: (in thousands) Amount
Balance as of December 31, 2016 $ — Goodwill as a result of the Business Combination 9,402
Balance as of December 31, 2017 9,402 Measurement period adjustment (2,807)Foreign Currency translation 75
Balance as of December 31, 2018 $ 6,670
During the year ended December 31, 2018, there was an adjustment made to the consideration payable to holders of Tecnidex which resulted in ameasurement period adjustment of $2.8 million to the purchase price allocation.
The Company’s other intangible assets at December 31, 2018 and December 31, 2017 consisted of the following:
62

Table of Contents
December 31, 2018 December 31, 2017
(in thousands)
GrossCarryingAmount
AccumulatedAmortization Impairment Net
GrossCarryingAmount
AccumulatedAmortization Impairment Net
Other intangible assets:Developed technology $ 759,290 $ (134,151) $ — $ 625,139 $ 759,374 $ (94,886) $ — $ 664,488 In-process research anddevelopment 39,000 (5,055) — 33,945 39,000 (2,889) — 36,111 Trade name 28,507 — (2,600) 25,907 29,816 — — 29,816 Service provider network 2,000 — — 2,000 2,000 — — 2,000 Customer relationships 19,872 (2,198) — 17,674 20,306 (806) — 19,500 Software 9,405 (2,161) — 7,244 1,274 (404) — 870 Software not yet placed inservice — — — — 5,022 — — 5,022 Other 100 (42) — 58 100 (25) — 75
Total intangible assets $ 858,174 $ (143,607) $ (2,600) $ 711,967 $ 856,892 $ (99,010) $ — $ 757,882
During the Company's annual impairment testing conducted for the year ended December 31, 2016, the Company recorded an impairment charge of $9.5million on its AgroFresh and SmartFresh trade names. The annual impairment testing for the year ended December 31, 2017 resulted in no indicators ofimpairment. During the Company's annual impairment testing conducted for the year ended December 31, 2018, the Company recorded an impairmentcharge of $2.6 million on its SmartFresh trade name.
The weighted-average amortization period remaining for the finite-lived intangible assets is 15.16 years. The weighted-average amortization periodremaining for developed technology, customer relationships, in-process R&D, software, and other is 16.3, 13.5, 15.8, 2.2, and 3.5 years, respectively. Amortization expense was $45.9 million, $41.9 million and $40.3 million for the years ended December 31, 2018, 2017 and 2016, respectively. Estimated annual amortization expense for finite-lived intangible assets, excluding amounts in Work in Progress, subsequent to December 31, 2018 is asfollows: (in thousands) Amount
2019 $ 46,679 2020 46,491 2021 43,962 2022 43,326 2023 43,326 Thereafter 460,276 Total $ 684,060
9. Accrued and Other Current Liabilities The Company’s accrued and other current liabilities at December 31, 2018 and December 31, 2017 consisted of the following:
63
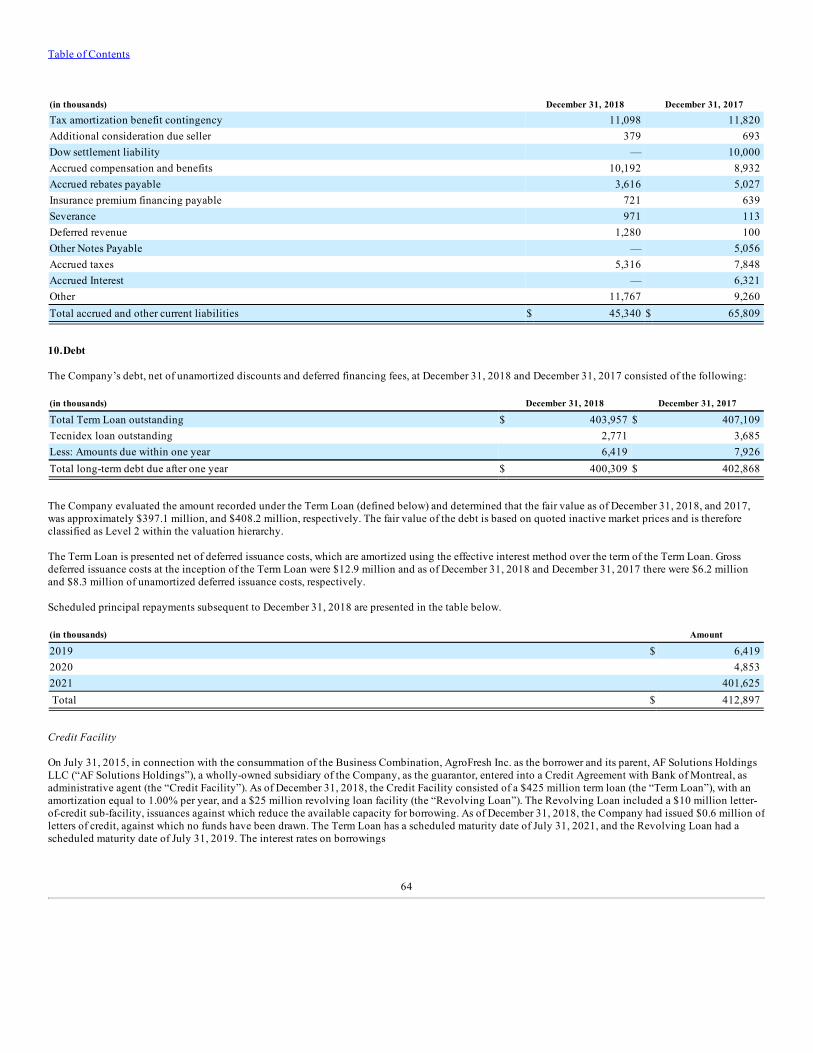
Table of Contents
(in thousands) December 31, 2018 December 31, 2017
Tax amortization benefit contingency 11,098 11,820 Additional consideration due seller 379 693 Dow settlement liability — 10,000 Accrued compensation and benefits 10,192 8,932 Accrued rebates payable 3,616 5,027 Insurance premium financing payable 721 639 Severance 971 113 Deferred revenue 1,280 100 Other Notes Payable — 5,056 Accrued taxes 5,316 7,848 Accrued Interest — 6,321 Other 11,767 9,260 Total accrued and other current liabilities $ 45,340 $ 65,809
10. Debt The Company’s debt, net of unamortized discounts and deferred financing fees, at December 31, 2018 and December 31, 2017 consisted of the following: (in thousands) December 31, 2018 December 31, 2017
Total Term Loan outstanding $ 403,957 $ 407,109 Tecnidex loan outstanding 2,771 3,685 Less: Amounts due within one year 6,419 7,926 Total long-term debt due after one year $ 400,309 $ 402,868
The Company evaluated the amount recorded under the Term Loan (defined below) and determined that the fair value as of December 31, 2018, and 2017,was approximately $397.1 million, and $408.2 million, respectively. The fair value of the debt is based on quoted inactive market prices and is thereforeclassified as Level 2 within the valuation hierarchy. The Term Loan is presented net of deferred issuance costs, which are amortized using the effective interest method over the term of the Term Loan. Grossdeferred issuance costs at the inception of the Term Loan were $12.9 million and as of December 31, 2018 and December 31, 2017 there were $6.2 millionand $8.3 million of unamortized deferred issuance costs, respectively. Scheduled principal repayments subsequent to December 31, 2018 are presented in the table below. (in thousands) Amount
2019 $ 6,419 2020 4,853 2021 401,625 Total $ 412,897
Credit Facility
On July 31, 2015, in connection with the consummation of the Business Combination, AgroFresh Inc. as the borrower and its parent, AF Solutions HoldingsLLC (“AF Solutions Holdings”), a wholly-owned subsidiary of the Company, as the guarantor, entered into a Credit Agreement with Bank of Montreal, asadministrative agent (the “Credit Facility”). As of December 31, 2018, the Credit Facility consisted of a $425 million term loan (the “Term Loan”), with anamortization equal to 1.00% per year, and a $25 million revolving loan facility (the “Revolving Loan”). The Revolving Loan included a $10 million letter-of-credit sub-facility, issuances against which reduce the available capacity for borrowing. As of December 31, 2018, the Company had issued $0.6 million ofletters of credit, against which no funds have been drawn. The Term Loan has a scheduled maturity date of July 31, 2021, and the Revolving Loan had ascheduled maturity date of July 31, 2019. The interest rates on borrowings
64

Table of Contents
under the facilities are either the alternate base rate plus 3.75% or LIBOR plus 4.75% per annum, with a 1.00% LIBOR floor (with step-downs in respect ofborrowings under the Revolving Loan dependent upon the achievement of certain financial ratios). The obligations under the Credit Facility are secured byliens on substantially all of the assets of (a) AgroFresh Inc. and its direct wholly-owned domestic subsidiaries, and (b) AF Solutions Holdings, including thecommon stock of AgroFresh Inc. The net proceeds of the Term Loan were used to fund a portion of the purchase price payable to Rohm and Haas Company ("R&H"), a subsidiary of Dow, inconnection with the Business Combination. Amounts available under the Revolving Loan may also be used for working capital, general corporate purposes,and other uses, all as more fully set forth in the Credit Agreement. At December 31, 2018, there was $410.1 million outstanding under the Term Loan and nobalance outstanding under the Revolving Loan. As of the Closing Date, the Company incurred approximately $12.9 million in debt issuance costs related to the Term Loan and $1.3 million in costs relatedto the Revolving Loan. The debt issuance costs associated with the Term Loan were capitalized against the principal balance of the debt, and the RevolvingLoan costs were capitalized in Other Assets. All issuance costs will be accredited through interest expense for the duration of each respective debt facility.The interest expense related to the amortization of the debt issuance costs during the year ended December 31, 2018 and December 31, 2017 wasapproximately $2.5 million and $2.4 million, respectively.
Certain restrictive covenants are contained in the Credit Facility, which the Company was in compliance with as of December 31, 2018, other than certaincovenants that apply only to the Company’s ability to borrow under the RevolvingLoan (excluding letters of credit). The Credit Facility imposes an overall cap on the total amount of dividends the Company can pay, together with the totalamount of shares and warrants the Company can repurchase, of $12 million per fiscal year, and imposes certain other conditions on the Company’s ability topay dividends.
Beginning with the year ended December 31, 2017, the Company is required to prepay Term Loan Borrowings and Incremental Term Loan Borrowings in anaggregate amount equal to 50% of the Excess Cash Flow for the fiscal year; provided that such amount of the Excess Cash Flow in any fiscal year shall bereduced by (i) the aggregate amount of prepayments of Term Loans and Incremental Term Loans made, (ii) to the extent accompanied by permanentreductions of Revolving Commitments, the aggregate amount of prepayments of Revolving Loans (other than prepayments financed with the proceeds ofIndebtedness), (iii) repaid borrowings of Revolving Loans made on the Effective Date to account for any additional original issue discount or upfront feesthat are implemented pursuant to the Fee Letter and (iv) the aggregate amount of cash dividends paid by the Company or Holdings to Holdings or Boulevardfor the payment of the Seller Earnout; provided further that, prepayments of Term Loan Borrowings and Incremental Term Loan Borrowings shall only berequired if 50% of the Excess Cash Flow for such fiscal year exceeds $5,000,000. There are no amounts due under this provision for the year endedDecember 31, 2018.
On January 31, 2019, The Revolving Loan was amended to extend the revolver from July 31, 2019 to December 31, 2020. The amended $12.5 millionrevolving credit facility also amended certain financial covenants.
11. Other Noncurrent Liabilities The Company’s other noncurrent liabilities at December 31, 2018 and December 31, 2017 consisted of the following: (in thousands) December 31, 2018 December 31, 2017
Tax amortization benefit contingency $ 29,369 $ 31,562 Other 2,697 6,943 Total other noncurrent liabilities $ 32,066 $ 38,505
Other noncurrent liabilities include long-term rebates and deferred rent.
12. Stockholders’ Equity The authorized common stock of the Company consists of 400,000,000 shares with a par value of $0.0001 per share. Holders of the Company’s commonstock are entitled to one vote for each share of common stock. As of December 31, 2018, there were 50,410,192 shares of common stock outstanding. As ofDecember 31, 2018, there were warrants to purchase 15,983,072 shares of the Company’s common stock outstanding at a strike price of $11.50. Of the15,983,072 warrants, 9,823,072 were issued as part of the units sold in the Company's initial public offering in February 2014 (1,201,928 warrants weresubsequently repurchased during 2015) and 6,160,000 warrants were sold in a private placement at the time of such public offering.
65

Table of Contents
On November 18, 2015, the Company announced that its board of directors had authorized a stock repurchase program (the “Repurchase Program”). TheRepurchase Program authorized the Company to repurchase in the aggregate up to $10 million of the Company’s publicly-traded shares of common stock.The Repurchase Program was in effect for a period of one year, until November 17, 2016. Under the Repurchase Program, the Company repurchased 661,381shares of its common stock for $3.9 million, which shares are classified as treasury stock on the Consolidated Balance Sheet. In connection with and as a condition to the consummation of the Business Combination, the Company issued R&H one share of Series A Preferred Stock.R&H, voting as a separate class, is entitled to appoint one director to the Company’s board of directors for so long as R&H beneficially holds 10% or more ofthe aggregate amount of the outstanding shares of common stock and non-voting common stock of the Company. The Series A Preferred Stock has no otherrights. Simultaneously with the Closing, the Company issued 4,878,048 shares of common stock at a price of $10.25 per share in a private placement to raise anaggregate of $50 million of additional equity.
Accumulated Other Comprehensive Loss(in thousands) December 31, 2018 December 31, 2017
Foreign currency translation adjustments $ (31,695) $ (12,355)Unrealized gain (loss) on hedging activity 2,914 (358)Pension and other postretirement benefit plans (56) (56)
Total $ (28,837) $ (12,769)
13. Stock Compensation The Company’s stock-based compensation is in accordance with the amended 2015 Incentive Compensation Plan (the “Plan”), pursuant to which theCompensation Committee of the Company is authorized to grant up to 5,150,000 shares to officers and employees of the Company, in the form of equity-based awards, including time or performance based options and restricted stock. In addition, the Company may grant cash-settled awards, including stock-appreciation rights (SARs) and phantom stock awards. As of December 31, 2018, there were 2,647,990 shares available for grant under the Plan. Total stock-based compensation recorded by the Company for the year ended December 31, 2018, 2017, and 2016 for both equity and liability-classifiedawards was $2.9 million, $2.6 million, and $3.7 million respectively. The following table summarizes the components of stock-based compensation expense in the consolidated statements of (loss) income for the yearended December 31, 2018, 2017, and 2016 were as follows:
Year Ended YearEnded
December 31, 2018
Year Ended YearEnded
December 31, 2017
Year Ended YearEnded
December 31, 2016(in thousands) Amount Amount Amount
Cost of sales $ 191 $ 191 $ — Selling, general, and administrative expenses $ 2,413 $ 2,127 $ 3,423 Research and development expenses 293 299 261 Total $ 2,897 $ 2,617 $ 3,684
Time-Based Stock Options
During the year ended December 31, 2018 and December 31, 2017, the Company’s compensation committee approved time-based stock options to begranted to officers and employees of the Company, which vest ratably over three years. A summary of the status of the Company’s time-based stock options(“Options”) for the years ended December 31, 2018 and 2017 were as follows:
66
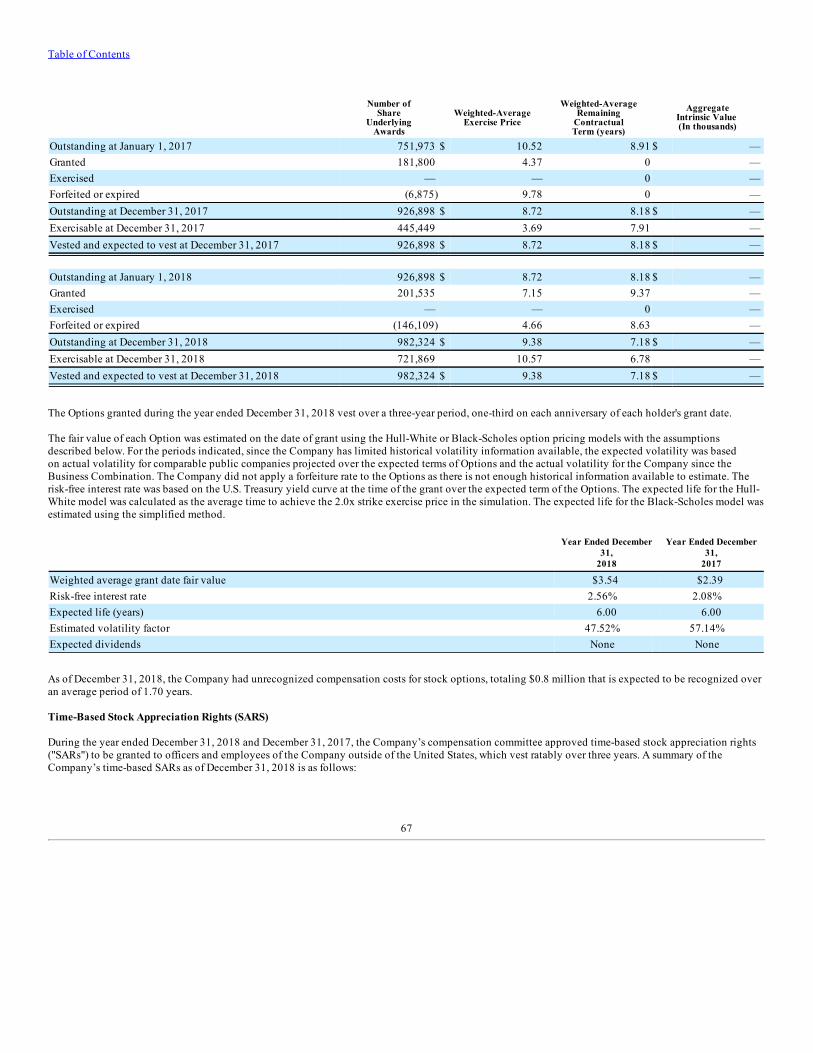
Table of Contents
Number ofShare
UnderlyingAwards
Weighted-AverageExercise Price
Weighted-AverageRemaining
ContractualTerm (years)
AggregateIntrinsic Value (In thousands)
Outstanding at January 1, 2017 751,973 $ 10.52 8.91 $ — Granted 181,800 4.37 0 — Exercised — — 0 — Forfeited or expired (6,875) 9.78 0 — Outstanding at December 31, 2017 926,898 $ 8.72 8.18 $ — Exercisable at December 31, 2017 445,449 3.69 7.91 — Vested and expected to vest at December 31, 2017 926,898 $ 8.72 8.18 $ —
Outstanding at January 1, 2018 926,898 $ 8.72 8.18 $ — Granted 201,535 7.15 9.37 — Exercised — — 0 — Forfeited or expired (146,109) 4.66 8.63 — Outstanding at December 31, 2018 982,324 $ 9.38 7.18 $ — Exercisable at December 31, 2018 721,869 10.57 6.78 — Vested and expected to vest at December 31, 2018 982,324 $ 9.38 7.18 $ —
The Options granted during the year ended December 31, 2018 vest over a three-year period, one-third on each anniversary of each holder's grant date.
The fair value of each Option was estimated on the date of grant using the Hull-White or Black-Scholes option pricing models with the assumptionsdescribed below. For the periods indicated, since the Company has limited historical volatility information available, the expected volatility was basedon actual volatility for comparable public companies projected over the expected terms of Options and the actual volatility for the Company since theBusiness Combination. The Company did not apply a forfeiture rate to the Options as there is not enough historical information available to estimate. Therisk-free interest rate was based on the U.S. Treasury yield curve at the time of the grant over the expected term of the Options. The expected life for the Hull-White model was calculated as the average time to achieve the 2.0x strike exercise price in the simulation. The expected life for the Black-Scholes model wasestimated using the simplified method.
Year Ended December31,
2018
Year Ended December31,
2017
Weighted average grant date fair value $3.54 $2.39 Risk-free interest rate 2.56% 2.08% Expected life (years) 6.00 6.00Estimated volatility factor 47.52% 57.14% Expected dividends None None
As of December 31, 2018, the Company had unrecognized compensation costs for stock options, totaling $0.8 million that is expected to be recognized overan average period of 1.70 years.
Time-Based Stock Appreciation Rights (SARS) During the year ended December 31, 2018 and December 31, 2017, the Company’s compensation committee approved time-based stock appreciation rights("SARs") to be granted to officers and employees of the Company outside of the United States, which vest ratably over three years. A summary of theCompany’s time-based SARs as of December 31, 2018 is as follows:
67

Table of Contents
Numberof
AwardsWeighted-Average
Exercise Price
Weighted-AverageRemaining
ContractualTerm (years)
AggregateIntrinsic Value(In thousands)
Outstanding at January 1, 2017 158,125 $ 12.00 8.71 $ — Granted 9,350 2.39 0 — Exercised — — 0 — Forfeited or expired (91,850) 10.88 0 — Outstanding at December 31, 2017 75,625 9.83 7.75 — Exercisable at December 31, 2017 — — 0 — Vested and expected to vest at December 31, 2017 75,625 $ 9.83 7.75 $ —
Outstanding at January 1, 2018 75,625 $ 9.83 7.75 $ — Granted 30,300 7.35 9.24 — Exercised — — 0 — Forfeited or expired — — 0 — Outstanding at December 31, 2018 105,925 $ 9.12 6.75 $ — Exercisable at December 31, 2018 103,125 8.92 6.68 — Vested and expected to vest at December 31, 2018 105,925 $ 9.12 6.75 $ —
Holders of these SARs are entitled under the terms of the Plan to receive cash payments calculated based on the excess of the Company’s stock price over thetarget price in their award; consequently, these awards are accounted for as liability-type awards and the Company measures compensation cost based ontheir estimated fair value at each reporting date and the number of options expected to vest, net of estimated forfeitures, if any. Upon issuance, the fair value of each SAR award was estimated using the Hull-White option pricing model with the assumptions described below. For theperiods indicated, since the Company has limited historical volatility information available, the expected volatility was based on actual volatility forcomparable public companies projected over the expected terms of SAR awards. The Company did not apply a forfeiture rate to the SAR awards as there isnot enough historical information available to estimate. The risk-free interest rate was based on the U.S. Treasury yield curve at the time of the grant over theexpected term of the SAR awards. The expected life was calculated as the average time to achieve the 2.0x strike exercise price in the simulation. Because theSARs are liability classified, they are revalued at each reporting date. The assumptions used to value the SARs as of their issuance dates and as ofDecember 31, 2018 are presented below:
As of December 31,2018
As of December 31,2017
Fair value of awards $ 0.29 $ 2.21 Risk-free interest rate 2.47 % 2.22 %Expected life (years) 3.34 3.95Estimated volatility factor 48.22 % 54.5 %Expected dividends None None
As of December 31, 2018, the Company had unrecognized compensation costs for SARs, totaling $5.9 thousand that is expected to be recognized over anaverage period of 1.1 years.
Restricted Stock During the year ended December 31, 2018 and December 31, 2017, the Company’s compensation committee approved equity-classified performance-basedrestricted stock units (RSUs) and time based restricted stock to be granted to officers and employees of the Company, which vest ratably over three years. Asummary of the Company’s restricted stock awards as of December 31, 2018 is as follows:
68

Table of Contents
Number ofShares
Weighted-AverageGrant Date Fair
Value
Non-vested Restricted Stock & RSUs at January 1, 2017 296,983 $ 5.66 Granted 513,851 4.32 Vested (63,744) 5.46 Forfeited or expired (302,283) 6.26 Non-vested Restricted Stock & RSUs at December 31, 2017 444,807 $ 5.35
Non-vested Restricted Stock & RSUs at January 1, 2018 444,807 $ 5.35 Granted 554,699 7.06 Vested (152,538) 5.30 Forfeited or expired (178,272) 5.43 Non-vested Restricted Stock and RSUs at December 31, 2018 668,696 $ 6.76
As of December 31, 2018, Management has concluded that it is not probable that the performance condition for the RSUs granted in 2015 and 2017 will bemet and therefore no compensation is expected to be recognized for those RSUs; however, if it becomes probable that those performance conditions will bemet, the Company could recognize up to $1.0 million. Unrecognized compensation expense for the unvested time-based restricted stock is $2.3 million,which is expected to be recognized over a weighted average period of 1.6 years. Phantom Stock Awards During the year ended December 31, 2018 and December 31, 2017, the Company’s compensation committee approved phantom stock awards to be awardedto officers and employees of the Company located outside of the United States, which vest ratably over three years. These awards will be settled in cash uponvesting and are therefore liability-classified, requiring remeasurement at each balance sheet date. A summary of the Company’s Phantom Stock Awards as ofDecember 31, 2018 is as follows:
Number ofAwards
Weighted-AverageGrant Date Fair
Value
Non-vested phantom stock awards at January 1, 2017 109,809 $ 6.32 Granted 90,000 4.35 Vested — — Forfeited or expired (121,009) 6.34 Non-vested phantom stock awards at December 31, 2017 78,800 $ 5.91
Non-vested phantom stock awards at January 1, 2018 78,800 $ 5.91 Granted 65,450 7.35 Vested (17,519) 4.70 Forfeited or expired (14,548) 7.68 Non-vested phantom stock awards at December 31, 2018 112,183 $ 6.71
As of December 31, 2018, Management concluded that it is not probable that the performance condition for the phantom shares issued in 2015 and 2016 willbe met and therefore no compensation is expected to be recognized for those phantom shares; however, if it becomes probable that those performanceconditions will be met, the Company could recognize up to $0.3 million of additional compensation expense. Unrecognized compensation expense for theunvested time-based phantom shares is $0.3 million, which is expected to be recognized over a weighted average period of 1.5 years.
Director Shares On January 31, 2014, 20,125 founder shares were transferred to each of Boulevard’s three independent directors (“Director Shares”), adjusted for the effect ofstock dividends in February 2014 (for a total of 60,375 founder shares). On March 13, 2014, the underwriters exercised a portion of the over-allotment optionfrom the Public Offering, resulting in a portion of the Director
69

Table of Contents
Shares being forfeited. As a result, the Director Shares were adjusted ratably resulting in each director holding 18,375 Director Shares (for a total of 55,125Director Shares) at December 31, 2018. The Director Shares were effectively subject to achievement of two performance conditions — the Company completing its initial public offering (IPO) and abusiness combination within 21 months of the IPO. Additionally, 25% (13,781 shares in the aggregate) are subject to forfeiture if the Company’s stock pricedoes not trade at or above $13 for any 20 trading days within a 30 day period commencing on the Closing Date through July 31, 2020. The grant date fair value of the Director Shares with performance conditions was estimated as of their deemed grant date of January 31, 2014. The aggregatefair value of the Director Shares of $0.4 million was recognized as an expense upon consummation of the Business Combination, at which point theperformance conditions had been achieved. The fair value of the Director Shares was estimated using a Monte Carlo Simulation Model that used the following assumptions: Risk-free interest rate 1.96% Expected life (years) 6.47Estimated volatility factor 31.16% Expected dividends None
As of December 31, 2018, the Company had unrecognized compensation costs for the Director Shares of $0 thousand that is expected to be recognized overan average period of 0.0 years. Board of Director Grants Certain directors receive shares of restricted stock subject to the terms, provisions and restrictions of the 2015 Incentive Compensation Plan. The sharesgranted during the year ended December 31, 2018, and 2017, vest over a one year period on the one year anniversary of each holder's grant date, provided theDirector is still serving as a director of the Company. Upon termination of directorship for any reason, the Director immediately forfeits any unvested shareswithout payment. A summary of the Company’s time-based restricted stock awarded to the Board of Directors for the year ended December 31, 2018 is asfollows:
Number ofShares
Weighted-AverageGrant Date Fair
Value
Non-vested time-based restricted stock at January 1, 2017 14,524 $ 6.22 Granted 96,853 5.42 Vested (104,115) 5.40 Forfeited or expired — — Non-vested time-based restricted stock at December 31, 2017 7,262 $ 5.48
Non-vested time-based restricted stock at January 1, 2018 7,262 $ 5.48 Granted 85,890 6.75 Vested (28,783) 5.40 Forfeited or expired — — Non-vested time-based restricted stock at December 31, 2018 64,369 $ 7.21
As of December 31, 2018, the Company had unrecognized compensation costs for the Director shares of $0.2 million that is expected to be recognized overan average period of 0.1 years.
70

Table of Contents
14. Earnings Per Share Basic (loss) income per share is calculated by dividing net (loss) income by the weighted average number of common shares outstanding for the period. Incomputing dilutive (loss) income per share, basic (loss) income per share is adjusted for the assumed issuance of all potentially dilutive share-based awards,including stock options, restricted stock and warrants. The following is a reconciliation of the weighted-average common shares outstanding used for the computation of basic and diluted net (loss) income percommon share:
Year Ended December 31,2018
Year Ended December 31,2017
Basic weighted-average common shares outstanding 49,883,739 49,808,600 Effect of dilutive options, performance stock units and restricted stock — 382,703
Dilute weighted-average shares outstanding 49,883,739 50,191,303
Securities that could potentially be dilutive are excluded from the computation of diluted earnings per share when a loss from continuing operations exists orwhen the exercise price exceeds the average closing price of the Company's common stock during the period, because their inclusion would result in an anti-dilutive effect on per share amounts.
The following represents amounts that could potentially dilute basic EPS in the future: Stock-based compensation awards(1):
Stock options 982,324 Restricted Stock Units 295,882
Warrants:Private placement warrants 6,160,000 Public warrants 9,823,072
———————————————————————————————(1) SARs and Phantom Options are payable in cash so will therefore have no impact on number of shares
Warrants and options are considered anti-dilutive and excluded when the exercise price exceeds the average market value of the Company’s common stockprice during the applicable period. Performance share units are considered anti-dilutive if the performance targets upon which the issuance of the shares iscontingent have not been achieved and the respective performance period has not been completed as of the end of the current period. 15. Income Taxes (Loss) income before income taxes consists of the following components:
(amounts in thousands)
Year Ended December31,
2018
Year Ended December31,
2017
Year Ended December 31,2016
Domestic $ (32,982) $ (1,118) $ (111,056)Foreign 4,582 20,101 12,516 Total $ (28,400) $ 18,983 $ (98,540)
Significant components of income taxes are as follows:
71

Table of Contents
(amounts in thousands)
Year Ended December31,
2018
Year Ended December31,
2017
Year Ended December31,
2016
Currently payable:Federal $ (631) $ 1,323 $ — State and Local 36 $ 32 (1)Foreign 1,281 $ 6,581 (771)
Total currently payable 686 $ 7,936 (772)
Deferred:Federal (2,404) (14,801) 10,073 State and Local (66) 256 (482)Foreign 3,624 2,030 4,201
Total deferred 1,154 (12,515) 13,792 Provision (benefit) for income taxes $ 1,840 $ (4,579) $ 13,020
A reconciliation of income tax expense at the U.S. Federal statutory income tax rate to actual income tax provision is as follows:
(amounts in thousands)
Year Ended December31,
2018
Year Ended December31,
2017Year Ended December 31,
2016
Tax at Statutory Rate $ (5,962) $ 6,654 $ (34,490)State income taxes, net of federal tax benefit (54) 166 (313)Effect of Foreign Items 834 2,101 (788)Goodwill impairment — — 21,831 Valuation Allowance and unbenefited losses 6,018 18,452 28,466
U.S. valuation allowance release — (15,388) — Deferred Tax Rate Changes 240 (17,312) — Transaction Costs 531 470 — Tax Incentives (91) (68) (82)Warrants — 168 (1,722)Other 324 178 118 Provision (benefit) for income taxes $ 1,840 $ (4,579) $ 13,020
Income tax expense for the year ended December 31, 2018, year ended December 31, 2017, and year ended December 31, 2016 include certain discrete taxitems for changes in valuation allowances, non-deductible U.S. goodwill impairment, foreign effective rate items and other rate modifying items.
On December 22, 2017, the Tax Cuts and Jobs Act (“TCJA”) was enacted in the U.S. The TCJA represents sweeping changes in U.S. tax law. Among otherchanges in tax law, the TCJA permanently reduced the U.S. corporate income tax rate to 21% beginning in 2018, imposed a one-time repatriation tax ondeferred foreign earnings, established a participation exemption system by allowing a 100% dividends received deduction on qualifying dividends paid byforeign subsidiaries, limited deductions for net interest expense, and expanded the U.S. taxation of foreign earned income to include “global intangible low-taxed income” (“GILTI”).
As permitted by Staff Accounting Bulletin No. 118 (“SAB 118”), the net tax benefit recorded in the fourth quarter of 2017 due to the enactment of the TCJAwas considered “provisional”, based on reasonable estimates. SAB 118 provides a measurement period that should not extend beyond one year from theTCJA enactment date for companies to complete the accounting under ASC 740. The measurement period ended on December 22, 2018. The Companyrecorded provisional estimates and have subsequently finalized our accounting analysis based on the guidance, interpretations, and data available as ofDecember 31, 2018. Adjustments made in the fourth quarter of 2018 upon finalization of our accounting analysis were not material to our ConsolidatedFinancial Statements.
72

Table of Contents
The TCJA subjects a U.S. corporation to tax on its GILTI. U.S. GAAP allows companies to make an accounting policy election to either (1) treat taxes due onfuture GILTI inclusions in U.S. taxable income as a current-period expense when incurred (“period cost method”) or (2) factor such amounts into themeasurement of its deferred taxes (“deferred method”). The Company elected to use the period cost method and estimated impacts of the GILTI inclusion tobe a $0.1 million tax expense. The Company provided no provisional deferred tax liability related to “BEAT” base erosion and anti-abuse tax (“BEAT”)provisions of the TCJA, as the Company’s average gross receipts are under $500 million. In addition, the Company is not eligible for a benefit for foreignderived intangible income (“FDII”) due to Company’s U.S. net operating loss position in tax year 2018.
For the year ended December 31, 2018, the Company recorded a tax expense of $6.0 million for the increase in valuation allowances related to deferred taxassets that will no longer be able to be realized and other unbenefited losses. The unbenefited losses relate to the elimination of intercompany profit ininventory, resulting in tax expense of $1.0 million. The Company increased the valuation allowance in the U.S. tax jurisdiction $2.8 million as the Companydoes not have sufficient evidence to support future taxable income to realize the deferred tax asset related to non-deductible net interest expense limitedunder the TCJA. In addition to the U.S. valuation allowance increase, there was tax expense of $2.2 million recorded due to an increase in foreign valuationallowance in Japan, Netherlands, and Turkey as a result of insufficient sources of future taxable income to support certain deferred tax assets. There was also areduction of $1.7 million in the valuation allowance recorded due to changes in certain temporary differences and foreign currency translation rates whichdid not have an impact on tax expense.
For the year ended December 31, 2017, the Company recorded a tax benefit of $17.3 million for the remeasurement of deferred income tax assets andliabilities related to tax legislation enactments like the TCJA in the U.S. and other foreign tax legislation enactments. In addition, the Company recorded anincome tax expense of $18.5 million for the increase in net valuation allowances for certain tax attributes and other unbenefited losses. The unbenefitedlosses related to the elimination of intercompany profit in inventory. In addition the company released the valuation allowance in the U.S. tax jurisdiction of$15.4 million as sufficient deferred income tax liabilities exist such that the deferred tax assets are more likely than not to be realized. The tax rate for the year ended December 31, 2016, the Company recorded a tax benefit of $1.7 million for the non-taxable marked to market gains fromPrivate Placement Warrants. In addition, the Company recorded an income tax expense of $28.5 million for the increase in valuation allowances for certaintax attributes, including net operating losses. The increase in valuation allowance occurred in the quarter ended December 31, 2016, following theCompany's assessment that it will not be able to realize its deferred tax assets in the U.S. in the time horizon required by U.S. GAAP to carry them as assets.During the quarter ended December 31, 2016, the Company impaired its goodwill asset resulting in a permanent item of $21.8 million, as the impairment isnot deductible for tax purposes.
Deferred income taxes reflect the net tax effects of temporary differences between the carrying amounts of assets and liabilities for financial reportingpurposes and the amounts for income tax purposes. Significant components of the Company’s deferred tax assets and liabilities at December 31, 2018 andDecember 31, 2017 are as follows:
(amounts in thousands)December 31,
2018December 31,
2017
Deferred tax assets:Pension and other retiree obligations 32 209 Inventory 507 89 Other accruals and reserves 2,856 2,370 Loss and credit carryforwards 14,535 10,932 Interest expense deduction limitation carryforward 2,769 — Other — 886 Valuation allowance (16,367) (13,061)
Deferred tax assets 4,332 1,425
Deferred tax liabilities:Intangible assets other than goodwill (22,443) (21,753)Property, plant and equipment (2,582) (1,548)Unrealized foreign currency gains (2,155) (1,056)Other (52) —
Deferred tax liabilities (27,232) (24,357)Net deferred tax assets / (liabilities) $ (22,900) $ (22,932)
73

Table of Contents
The Company makes significant judgments regarding the realizability of its deferred tax assets (principally net operating losses). The carrying value ofdeferred tax assets is based on the Company’s assessment that it is more likely than not that the Company will realize these assets after consideration of allavailable positive and negative evidence. Gross operating loss carryforwards amounted to $12.5 million for foreign jurisdictions, $53.2 million for U.S. federal, and $7.6 million for U.S. States atDecember 31, 2018. These operating loss carryforwards related to the 2015, 2016, 2017 and current 2018 tax periods. At December 31, 2018, none of theoperating loss carryforwards were subject to expiration in 2019 through 2022. The operating loss carryforwards expiring in years 2023 through 2028 make up$2.5 million of the recorded deferred tax asset. The operating loss carryforwards expiring in years 2029 through 2038 make up $9.1 million of the recordeddeferred tax asset. The remaining deferred tax asset relating to operating loss carryforwards of $2.9 million have an indefinite expiration. Managementassesses the available positive and negative evidence to estimate if sufficient future taxable income will be generated to use the existing deferred tax assets. As of December 31, 2018, management determined that sufficient negative evidence exists to conclude that it is more-likely-than-not that the certain incometax assets in the U.S., Japan, Netherlands, and Turkey are not realizable, and therefore, increased the valuation allowance accordingly.
The Company has recorded tax credits in the U.S. for research and development expenditures that were generated in 2015, 2016, 2017, and 2018 for a totalamount of $0.3 million. These credits will expire beginning in 2035.
U.S. income and foreign withholding taxes have not been recognized for the difference between the financial reporting and tax basis of the investments inforeign subsidiaries that are indefinitely reinvested outside the U.S. This amount may be recognized upon a sale or liquidation of the subsidiary. There is nota gross temporary difference as of December 31, 2018, since the tax basis of investments in foreign subsidiaries is in excess of the financial reporting basis.
Uncertain Tax Positions
(amounts in thousands)Year Ended
December 31, 2018
Year Ended December31,
2017
Year Ended YearEnded
December 31, 2016
Beginning Balance $ 2,884 $ — $ — Additions of tax positions of the current year 393 — — Additions to tax positions of the prior years — 2,884 — Reductions of tax positions of the prior years (872) — — Reductions related to prior tax positions due to foreign currency (525) — — Expiration of statutes of limitations (1) — — Ending Balance $ 1,879 $ 2,884 $ —
The Company and its subsidiaries file income tax returns in the U.S. federal jurisdiction and various states and foreign jurisdictions. As of December 31,2018 and 2017, the Company had unrecognized tax benefits, defined as the aggregate tax effect of differences between tax return positions and the benefitsrecognized in the Company's financial statements, of $1.9 million and $2.9 million, respectively. If recognized in the fiscal years ended December 31, 2018and 2017, $1.9 million and $2.9 million, respectively, of these benefits would have reduced income tax expense and the effective tax rate. Of these amounts,approximately $0.2 million and $0.2 million of the Company's unrecognized tax benefits at December 31, 2018 and 2017, respectively, are indemnified andthe release of the indemnification asset will have an offsetting impact to the effective tax rate of the Company. Of the $1.9 million and $2.9 million benefitsat December 31, 2018 and 2017, respectively, approximately $0.9 million and $1.1 million have been recorded as a reduction to the related deferred tax assetfor the net operating loss in accordance with Accounting Standards Update 2013-11, Presentation of an Unrecognized Tax Benefit When a Net OperatingLoss Carryforward, a Similar Tax Loss, or a Tax Credit Carryforward Exists for all periods. The total amount of unrecognized tax benefits is not expected tochange within 12 months of the reporting date. The Company's policy is to recognize interest and penalties accrued on any unrecognized tax benefit withinthe provision for income taxes in the Consolidated Statements of (Loss) Income. The Company recorded an increase of $0.2 million of interest and penaltiesas part of "Provision for income taxes" in the Company's Consolidated Statements of (Loss) Income during the period ending December 31, 2018. Cumulativeinterest and penalties of $0.6 million and $0.5 million are recorded as part of "Income taxes payable" for December 31, 2018 and 2017, respectively.
74
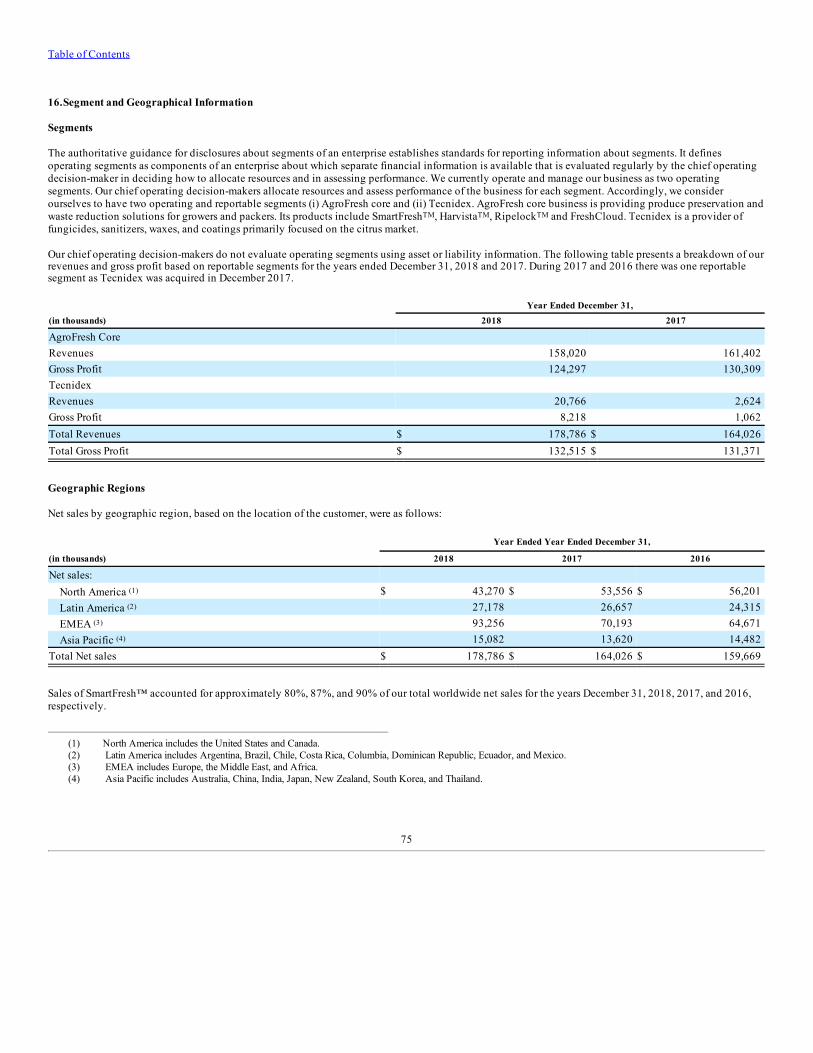
Table of Contents
16. Segment and Geographical Information Segments The authoritative guidance for disclosures about segments of an enterprise establishes standards for reporting information about segments. It definesoperating segments as components of an enterprise about which separate financial information is available that is evaluated regularly by the chief operatingdecision-maker in deciding how to allocate resources and in assessing performance. We currently operate and manage our business as two operatingsegments. Our chief operating decision-makers allocate resources and assess performance of the business for each segment. Accordingly, we considerourselves to have two operating and reportable segments (i) AgroFresh core and (ii) Tecnidex. AgroFresh core business is providing produce preservation andwaste reduction solutions for growers and packers. Its products include SmartFreshTM, HarvistaTM, RipelockTM and FreshCloud. Tecnidex is a provider offungicides, sanitizers, waxes, and coatings primarily focused on the citrus market.
Our chief operating decision-makers do not evaluate operating segments using asset or liability information. The following table presents a breakdown of ourrevenues and gross profit based on reportable segments for the years ended December 31, 2018 and 2017. During 2017 and 2016 there was one reportablesegment as Tecnidex was acquired in December 2017.
Year Ended December 31,(in thousands) 2018 2017
AgroFresh Core Revenues 158,020 161,402 Gross Profit 124,297 130,309 Tecnidex Revenues 20,766 2,624 Gross Profit 8,218 1,062 Total Revenues $ 178,786 $ 164,026 Total Gross Profit $ 132,515 $ 131,371
Geographic Regions Net sales by geographic region, based on the location of the customer, were as follows:
Year Ended Year Ended December 31,
(in thousands) 2018 2017 2016
Net sales:North America (1) $ 43,270 $ 53,556 $ 56,201 Latin America (2) 27,178 26,657 24,315 EMEA (3) 93,256 70,193 64,671 Asia Pacific (4) 15,082 13,620 14,482
Total Net sales $ 178,786 $ 164,026 $ 159,669
Sales of SmartFresh™ accounted for approximately 80%, 87%, and 90% of our total worldwide net sales for the years December 31, 2018, 2017, and 2016,respectively.
———————————————————————————————(1) North America includes the United States and Canada.(2) Latin America includes Argentina, Brazil, Chile, Costa Rica, Columbia, Dominican Republic, Ecuador, and Mexico.(3) EMEA includes Europe, the Middle East, and Africa.(4) Asia Pacific includes Australia, China, India, Japan, New Zealand, South Korea, and Thailand.
75

Table of Contents
Net property, plant and equipment by geographic region at the end of each period was as follows:
(in thousands)December 31,
2018December 31,
2017
Net property, plant and equipment:North America $ 8,651 $ 7,306 All other 4,638 4,894
Total property, plant and equipment $ 13,289 $ 12,200
17. Commitments and Contingencies The Company is currently involved in various claims and legal actions that arise in the ordinary course of business. The Company has recorded reserves forloss contingencies based on the specific circumstances of each case. Such reserves are recorded when it is probable that a loss has been incurred as of thebalance sheet date and can be reasonably estimated. Although the results of litigation and claims can never be predicted with certainty, the Company doesnot believe that the ultimate resolution of these actions will have any material adverse effect on the Company’s business, financial condition or results ofoperations. Purchase Commitments The Company has various purchasing contracts for contract manufacturing and research and development services which are based on the requirements of thebusiness. Generally, the contracts are at prices not in excess of current market price and do not commit the business to obligations outside the normalcustomary terms for similar contracts. Operating Leases The Company uses various leased facilities and equipment in its operations. The lease terms for these leased assets vary depending on the terms of theapplicable lease agreement. Rental expense for all operating leases totaled $2.2 million, $3.2 million, and $3.3 million for the year ended December 31,2018, December 31, 2017, and December 31, 2016, respectively. At December 31, 2018, the Company had no residual value guarantees related to itsoperating leases. Future minimum lease payments as of December 31, 2018 under noncancellable operating leases are as follows:
(in thousands)Future Lease
Payments
2019 $ 3,413 2020 2,058 2021 1,790 2022 1,640 2023 1242 Thereafter 2,396 Total $ 12,539
18. Fair Value Measurements Liabilities Measured at Fair Value on a Recurring Basis The following table presents the fair value of the Company’s financial instruments that are measured at fair value on a recurring basis as of December 31,2018:
76
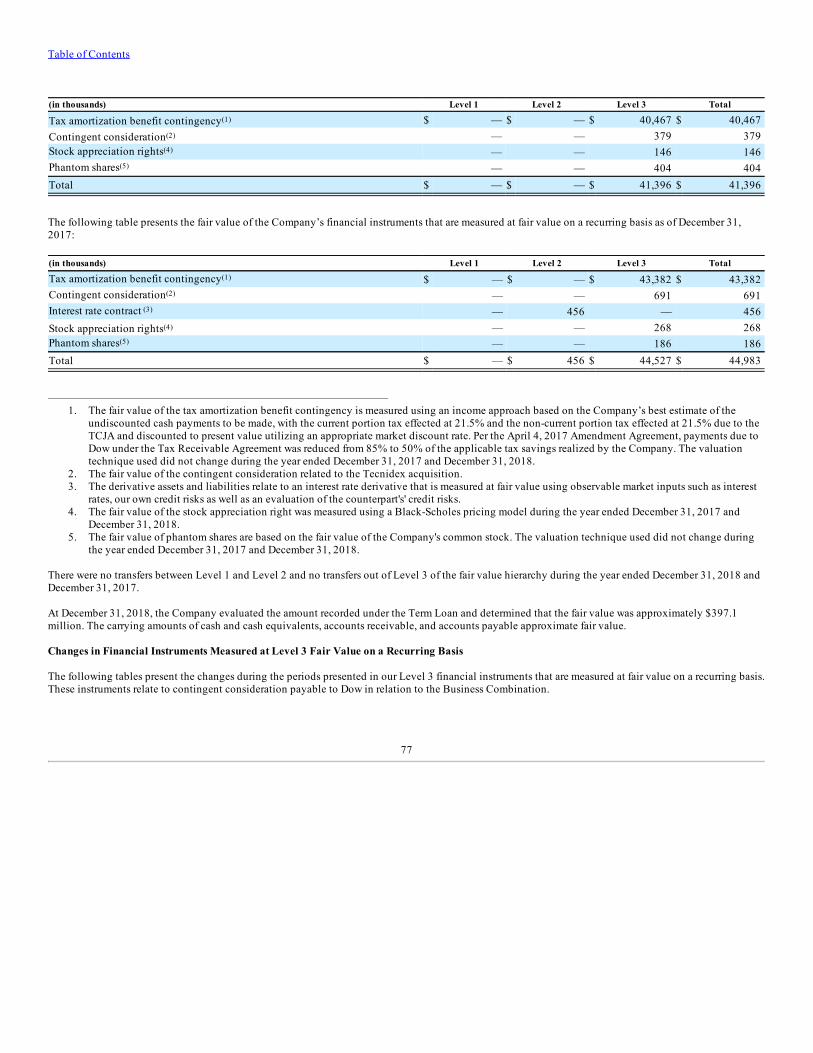
Table of Contents
(in thousands) Level 1 Level 2 Level 3 Total
Tax amortization benefit contingency(1) $ — $ — $ 40,467 $ 40,467 Contingent consideration(2) — — 379 379 Stock appreciation rights(4) — — 146 146 Phantom shares(5) — — 404 404 Total $ — $ — $ 41,396 $ 41,396
The following table presents the fair value of the Company’s financial instruments that are measured at fair value on a recurring basis as of December 31,2017:
(in thousands) Level 1 Level 2 Level 3 Total
Tax amortization benefit contingency(1) $ — $ — $ 43,382 $ 43,382 Contingent consideration(2) — — 691 691 Interest rate contract (3) — 456 — 456 Stock appreciation rights(4) — — 268 268 Phantom shares(5) — — 186 186 Total $ — $ 456 $ 44,527 $ 44,983
———————————————————————————————1. The fair value of the tax amortization benefit contingency is measured using an income approach based on the Company’s best estimate of the
undiscounted cash payments to be made, with the current portion tax effected at 21.5% and the non-current portion tax effected at 21.5% due to theTCJA and discounted to present value utilizing an appropriate market discount rate. Per the April 4, 2017 Amendment Agreement, payments due toDow under the Tax Receivable Agreement was reduced from 85% to 50% of the applicable tax savings realized by the Company. The valuationtechnique used did not change during the year ended December 31, 2017 and December 31, 2018.
2. The fair value of the contingent consideration related to the Tecnidex acquisition.3. The derivative assets and liabilities relate to an interest rate derivative that is measured at fair value using observable market inputs such as interest
rates, our own credit risks as well as an evaluation of the counterpart's' credit risks.4. The fair value of the stock appreciation right was measured using a Black-Scholes pricing model during the year ended December 31, 2017 and
December 31, 2018.5. The fair value of phantom shares are based on the fair value of the Company's common stock. The valuation technique used did not change during
the year ended December 31, 2017 and December 31, 2018.
There were no transfers between Level 1 and Level 2 and no transfers out of Level 3 of the fair value hierarchy during the year ended December 31, 2018 andDecember 31, 2017. At December 31, 2018, the Company evaluated the amount recorded under the Term Loan and determined that the fair value was approximately $397.1million. The carrying amounts of cash and cash equivalents, accounts receivable, and accounts payable approximate fair value. Changes in Financial Instruments Measured at Level 3 Fair Value on a Recurring Basis The following tables present the changes during the periods presented in our Level 3 financial instruments that are measured at fair value on a recurring basis.These instruments relate to contingent consideration payable to Dow in relation to the Business Combination.
77

Table of Contents
(in thousands)
Tax amortizationbenefit
contingency
Contingentconsideration
related toacquisition
Interest ratecontract
Stockappreciation
rights Phantom shares Total
Balance, December 31, 2017 43,382 691 456 268 186 44,983 Accretion 3,781 — — — — 3,781 TRA payment to Dow (3,900) — — — — (3,900)Tecnidex acquisition — (312) — — — (312)Interest rate contract — — (456) — — (456)Stock compensation expense — — — (122) 218 96 Mark-to-market adjustment (2,796) — — — — (2,796)
Balance, December 31, 2018 $ 40,467 $ 379 $ — $ 146 $ 404 $ 41,396
19. Severance
There was $0.7 million of severance expense for the year ended December 31, 2018. For the year ended December 31, 2017, there was $0.3 million ofseverance expense. This amount, which does not include stock compensation expense, was recorded in selling, general and administrative expense in thecondensed consolidated statements of (loss) income. As of December 31, 2018, the Company had $1.0 million of severance liability which will be paid outover the next year.
78

Table of Contents
20. Quarterly Financial Data (Unaudited) (in thousands, except per share data) First Quarter Second Quarter Third Quarter Fourth Quarter
2018Net sales $ 38,351 $ 18,420 $ 68,698 $ 53,317 Cost of sales $ 10,846 $ 5,402 $ 16,662 $ 13,361 Gross profit $ 27,505 $ 13,018 $ 52,036 $ 39,956 (Loss) income before taxes $ (9,306) $ (22,777) $ 3,972 $ (289)Net (loss) income $ (12,876) $ (18,402) $ 2,954 $ (1,916)Net (loss) income per common share:
Basic $ (0.26) $ (0.37) $ 0.06 $ (0.04)Diluted $ (0.26) $ (0.37) $ 0.06 $ (0.04)
(in thousands, except per share data) First Quarter Second Quarter Third Quarter Fourth Quarter
2017Net sales $ 32,730 $ 16,389 $ 60,772 $ 54,135 Cost of sales $ 5,839 $ 3,906 $ 11,620 $ 11,290 Gross profit $ 26,891 $ 12,483 $ 49,152 $ 42,845 (Loss) income before taxes $ (10,647) $ (14,302) $ 13,178 $ 30,754 Net (loss) income $ (12,029) $ 2,607 $ 9,546 $ 23,438 Net (loss) income per common share:
Basic $ (0.24) $ 0.05 $ 0.19 $ 0.47 Diluted $ (0.24) $ 0.05 $ 0.19 $ 0.47
———————————————————————————————
79

Table of Contents
ITEM 9. CHANGES IN AND DISAGREEMENTS WITH ACCOUNTANTS ON ACCOUNTING AND FINANCIAL DISCLOSURE None.
ITEM 9A. CONTROLS AND PROCEDURES Disclosure Controls and Procedures As of December 31, 2018, our management, with the participation of our Chief Executive Officer (“CEO”) and Chief Financial Officer (“CFO”), hasconducted an evaluation of our disclosure controls and procedures. Based on that evaluation, our CEO and CFO concluded that our disclosure controls andprocedures were effective as of December 31, 2018.
Management’s Report on Internal Controls over Financial Reporting The Company’s management is responsible for establishing and maintaining adequate internal control over financial reporting, as such term is defined inRule 13a-15(f) of the Exchange Act. The Company’s internal control over financial reporting is designed to provide reasonable assurance regarding thereliability of financial reporting and the preparation of published financial statements in accordance with generally accepted accounting principles.
Our internal controls over financial reporting include those policies and procedures that:
• pertain to the maintenance of records that, in reasonable detail, accurately and fairly reflect the transactions and dispositions of the assets of theCompany;
• provide reasonable assurance that transactions are recorded as necessary to permit preparation of financial statements in accordance with U.S.generally accepted accounting principles, and that our receipts and expenditures are being made only in accordance with authorizations of theCompany’s management and directors; and
• provide reasonable assurance regarding prevention or timely detection of unauthorized acquisition, use or disposition of our assets that could have amaterial effect on the financial statements.
Management assessed the effectiveness of our internal controls over financial reporting as of December 31, 2018. In making this assessment, managementused the criteria in Internal Control-Integrated Framework (2013) set forth by the Committee of Sponsoring Organizations of the Treadway Commission(COSO). Based on our assessment using those criteria, management concluded that our internal control over financial reporting as of December 31, 2018 waseffective.
Because of its inherent limitations, internal controls over financial reporting may not prevent or detect misstatements. Projections of any evaluation ofeffectiveness to future periods are subject to the risk that controls may become inadequate because of changes in conditions, or that the degree of compliancewith the policies or procedures may deteriorate.
We have concluded that the financial statements and other financial information included in this Annual Report on Form 10-K fairly present in all materialrespects our financial condition, results of operations and cash flows as of, and for, the periods presented.
Changes in Internal Control over Financial Reporting
There were no changes in our internal control over financial reporting identified in connection with the evaluation required by paragraph (d) of Rule 13a-15or Rule 15d-15 under the Exchange Act that occurred during the Company’s most recently completed fiscal quarter, and there has been no change in ourinternal control over financial reporting that has materially affected, or is reasonably likely to materially affect, our internal control over financial reporting.
ITEM 9B. OTHER INFORMATION None.
80

Table of Contents
PART III ITEM 10. DIRECTORS, EXECUTIVE OFFICERS AND CORPORATE GOVERNANCE The information required by this Item is incorporated herein by reference to the Company's Definitive Proxy Statement to be filed pursuant toRegulation 14A of the Exchange Act for its 2019 Annual Meeting of Stockholders, which will be filed no later than 120 days after December 31, 2018.
ITEM 11. EXECUTIVE COMPENSATION The information required by this Item is incorporated herein by reference to the Company's Definitive Proxy Statement to be filed pursuant toRegulation 14A of the Exchange Act for its 2019 Annual Meeting of Stockholders, which will be filed no later than 120 days after December 31, 2018.
ITEM 12. SECURITY OWNERSHIP OF CERTAIN BENEFICIAL OWNERS AND MANAGEMENT AND RELATED STOCKHOLDER MATTERS The information required by this Item is incorporated herein by reference to the Company's Definitive Proxy Statement to be filed pursuant toRegulation 14A of the Exchange Act for its 2019 Annual Meeting of Stockholders, which will be filed no later than 120 days after December 31, 2018.
ITEM 13. CERTAIN RELATIONSHIPS AND RELATED TRANSACTIONS, AND DIRECTOR INDEPENDENCE The information required by this Item is incorporated herein by reference to the Company's Definitive Proxy Statement to be filed pursuant toRegulation 14A of the Exchange Act for its 2019 Annual Meeting of Stockholders, which will be filed no later than 120 days after December 31, 2018.
ITEM 14. PRINCIPAL ACCOUNTING FEES AND SERVICES The information required by this Item is incorporated herein by reference to the Company's Definitive Proxy Statement to be filed pursuant toRegulation 14A of the Exchange Act for its 2019 Annual Meeting of Stockholders, which will be filed no later than 120 days after December 31, 2018.
81

Table of Contents
PART IV ITEM 15. EXHIBITS, FINANCIAL STATEMENT SCHEDULES All other schedules are omitted either because they are not applicable, not required, or because the required information is included in the consolidatedfinancial statements or the notes thereto. The following documents are filed as part of this report:
Page(1) Consolidated Financial Statements
Report of Independent Registered Public Accounting Firm 44Consolidated Balance Sheets 45Consolidated Statements of (Loss) Income 46Consolidated Statements of Comprehensive (Loss) Income 47Consolidated Statements of Stockholders’ Equity 48Consolidated Statements of Cash Flows 49Notes to Consolidated Financial Statements 51
(2) Financial Statement Schedules
Schedule I—Condensed Financial Information of Registrant 83Schedule II—Valuation and Qualifying Accounts 87
(3) ExhibitsThe Exhibits required to be filed are set forth on the Index to Exhibits immediately preceding the signature page to this Report and
are incorporated herein by reference. 88
82

Table of Contents
SCHEDULE I - CONDENSED FINANCIAL INFORMATION
AgroFresh Solutions, Inc.Parent Company Information
Condensed Balance Sheets(In thousands)
December 31,
2018December 31,
2017
ASSETSAccounts receivable from subsidiary $ 104,244 $ 101,504 Investment in subsidiaries 309,591 342,810 Claims for income tax refunds 196 (16)Deferred income tax asset (24) (24)
TOTAL ASSETS $ 414,007 $ 444,274
LIABILITIES AND STOCKHOLDERS' EQUITY
Accounts payable to subsidiaries $ 1,909 $ 1,909 Other current liabilities 39,522 26,285
Total stockholders’ equity $ 372,576 $ 416,080 TOTAL LIABILITIES AND STOCKHOLDERS' EQUITY 414,007 444,274
See accompanying notes to condensed financial statements.
83

Table of Contents
SCHEDULE I - CONDENSED FINANCIAL INFORMATION
AgroFresh Solutions, Inc.Parent Company Information
Condensed Statements of Operations and Comprehensive Income (Loss)(In thousands)
Year Ended December
31,2018
Year Ended December31,
2017
Year Ended December31,
2016
Net sales $ — $ — $ — Selling, general and administrative expenses — 27 27 (Loss) Income in earnings of subsidiaries (33,219) 10,005 (93,132)(Loss) Income before taxes (33,219) 9,978 (93,159)(Benefit) provision for income taxes (2,979) (13,584) 18,401 Net (loss) Income $ (30,240) $ 23,562 $ (111,560)
See accompanying notes to condensed financial statements.
84
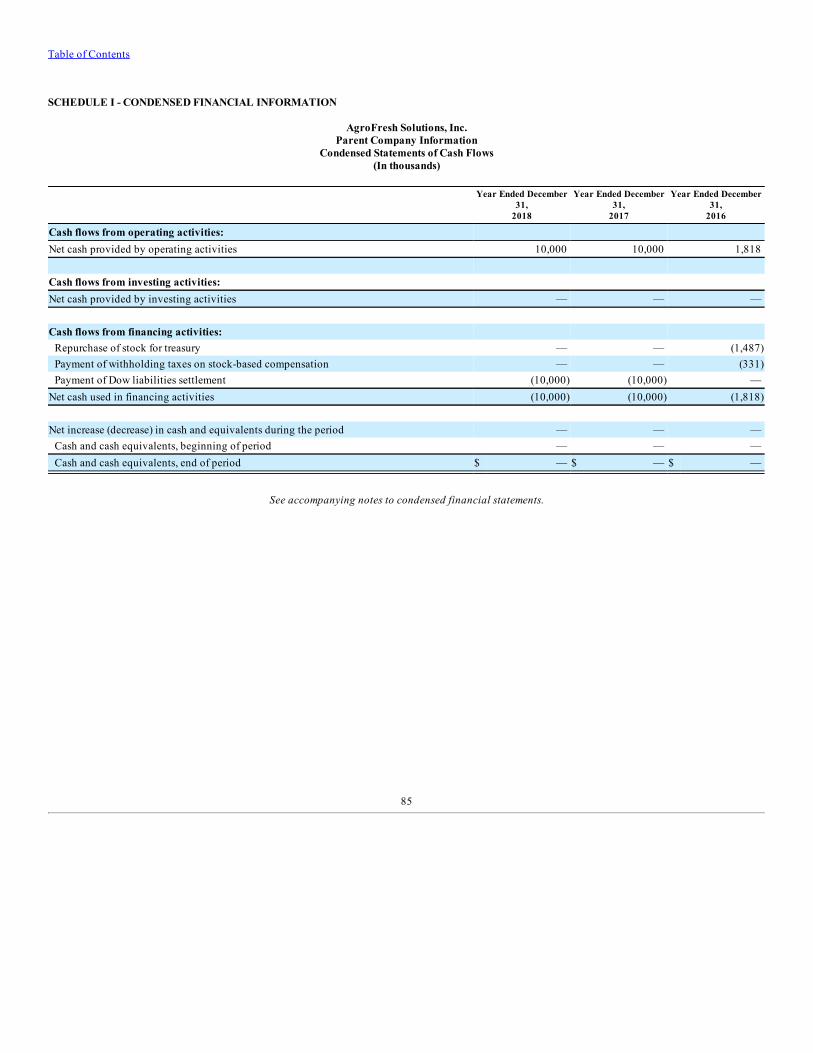
Table of Contents
SCHEDULE I - CONDENSED FINANCIAL INFORMATION
AgroFresh Solutions, Inc.Parent Company Information
Condensed Statements of Cash Flows(In thousands)
Year Ended December
31,2018
Year Ended December31,
2017
Year Ended December31,
2016
Cash flows from operating activities: Net cash provided by operating activities 10,000 10,000 1,818
Cash flows from investing activities:Net cash provided by investing activities — — —
Cash flows from financing activities: Repurchase of stock for treasury — — (1,487)Payment of withholding taxes on stock-based compensation — — (331)Payment of Dow liabilities settlement (10,000) (10,000) —
Net cash used in financing activities (10,000) (10,000) (1,818)
Net increase (decrease) in cash and equivalents during the period — — — Cash and cash equivalents, beginning of period — — — Cash and cash equivalents, end of period $ — $ — $ —
See accompanying notes to condensed financial statements.
85

Table of Contents
SCHEDULE I - CONDENSED FINANCIAL INFORMATION
AgroFresh Solutions, Inc.Parent Company Information
Notes to Condensed Financial Statements
1. Basis of Presentation AgroFresh Solutions, Inc. (the “Parent Company”), formerly known as Boulevard Acquisition Corp., was formed to effect the acquisition of the AgroFreshbusiness from Dow, resulting in AgroFresh Inc. becoming a wholly-owned, indirect subsidiary. The Parent Company had no material activities prior to theacquisition of AgroFresh Inc. on July 31, 2015. The accompanying Condensed Financial Statements include the accounts of the Parent Company and, on an equity basis, its direct and indirect subsidiariesand affiliates. Accordingly, these condensed financial statements have been presented on a “parent-only” basis. Under a parent-only presentation, the ParentCompany’s investments in subsidiaries are presented under the equity method of accounting. These parent-only financial statements should be read inconjunction with the consolidated financial statements of AgroFresh Solutions, Inc. The condensed parent-only financial statements have been prepared in accordance with Rule 12-04, Schedule I of Regulation S-X, as the restricted net assetsof the subsidiaries of the Company exceed 25% of the consolidated net assets of the Company.
2. Commitments and Contingencies As discussed in Note 10 to the consolidated financial statements, in connection with the consummation of the Business Combination, AgroFresh Inc. as theborrower and its parent, AF Solutions Holdings LLC, a wholly-owned subsidiary of the Parent Company, as the guarantor, entered into the Credit Facilitywith Bank of Montreal. The Credit Facility consists of a $425.0 million Term Loan and a $25.0 million Revolving Loan. The Revolving Loan includes a$10.0 million letter-of-credit sub-facility, issuances against which reduce the available capacity for borrowing. The obligations under the Credit Facility aresecured by liens on substantially all of the assets of (a) AgroFresh Inc. and its direct wholly-owned domestic subsidiaries and (b) AF Solutions Holdings LLC,including the common stock of AgroFresh Inc.
The Term Loan has a scheduled maturity date of July 31, 2021, and the Revolving Loan had a scheduled maturity date of July 31, 2019. Subsequently, onJanuary 31, 2019, the Credit Facility was amended to decrease the total availability from $25.0 million to $12.5 million and extend the maturity of theRevolving Loan from July 31, 2019 to December 31, 2020. An existing covenant in the credit agreement was also amended to allow the Company to haveaccess to the Revolving Loan. Maturities of long-term debt for the five years following December 31, 2018 are $6.4 million in 2019, $4.9 million in 2020,$401.6 million in 2021, $0.0 million in 2022, and $0.0 million in 2023. The Credit Facility imposes an overall cap on the total amount of dividends the Parent Company can pay, together with the total amount of shares andwarrants the Parent Company can repurchase, of $12.0 million per fiscal year, and imposes certain other conditions on the Parent Company’s ability to paydividends. 3. Dividends The ability of the Parent Company’s operating subsidiaries to pay dividends may be restricted due to the terms of the subsidiaries’ financing arrangements(see Note 10 to the consolidated financial statements).
86

Table of Contents
SCHEDULE II - CONSOLIDATED VALUATION AND QUALIFYING ACCOUNTS
Allowance for Doubtful Accounts
(amounts in thousands)
Balance atBeginning of
PeriodCharged to
Expense Deductions
Balance atEnd ofPeriod
Year Ended Year Ended December 31, 2018 1,550 1,208 (422) 2,336 Year Ended Year Ended December 31, 2017 1,242 1,395 (1,087) 1,550
87

Table of Contents
INDEX TO EXHIBITSExhibit No. Description
2.1 (13) Stock Purchase Agreement, dated as of April 30, 2015, by and between Boulevard Acquisition Corp. and The Dow ChemicalCompany.
3.1 (2) Second Amended and Restated Certificate of Incorporation, filed with the Secretary of State of the State of Delaware onJuly 31, 2015.
3.2 (2) Series A Certificate of Designation.3.3 (3) Amended and Restated Bylaws.3.4 (4) Amendment to the Amended and Restated Bylaws of AgroFresh Solutions, Inc., effective as of September 3, 2015.3.5 (16) Certificate of Amendment to the Second Amended and Restated Certificate of Incorporation4.1 (2) Specimen Common Stock Certificate.4.2 (2) Specimen Warrant Certificate.4.3 (5) Warrant Agreement, dated as of February 12, 2014, by and between AgroFresh Solutions, Inc. and Continental Stock
Transfer & Trust Company.10.1 (6) Form of Indemnification Agreement.10.2 (5) Securities Escrow Agreement, dated February 12, 2014, among AgroFresh Solutions, Inc. , Boulevard Acquisition
Sponsor, LLC, the Initial Holders party thereto and Continental Stock Transfer & Trust Company.10.3 (2) Credit Agreement, dated July 31, 2015, by and among AgroFresh Inc., as the borrower and AF Solutions Holdings LLC, acting
as guarantor, Bank of Montreal, as administrative agent, BMO Capital Markets Corp., Credit Suisse Securities (USA) LLC, andSumitomo Mitsui Banking Corporation (“Sumitomo”) as joint lead arrangers and joint bookrunners, BMO Capital MarketsCorp. and Credit Suisse, as joint physical bookrunners. Credit Suisse as syndication agent, Sumitomo as documentation agent,and the lenders party thereto.
10.4 (7) Amendment No. 1 to Credit Agreement, dated as of November 18, 2015.10.5 (2) Investor Rights Agreement, dated July 31, 2015, by and among AgroFresh Solutions, Inc., The Dow Chemical Company, Rohm
and Haas Company, Boulevard Acquisition Sponsor, LLC, Robert J. Campbell, Joel Citron and Darren Thompson.10.6 (2) Tax Receivables Agreement, dated July 31, 2015, by and among AgroFresh Solutions, Inc., AgroFresh Inc., The Dow Chemical
Company and Rohm and Haas Company.10.7 (9) AgroFresh Solutions, Inc. Incentive Compensation Plan.10.8 (11) Employment Agreement, dated July 14, 2016, between AgroFresh Solutions, Inc. and Jordi Ferre.10.9 (12) Services Agreement, dated November 29, 2016, among AgroFresh Solutions, Inc., RipeLocker LLC and George Lobisser.
10.10 (14) Form of Stock Option Agreement used in connection with the AgroFresh Solutions, Inc. 2015 Incentive Compensation Plan10.11 (14) Form of Restricted Stock Agreement used in connection with the AgroFresh Solutions, Inc. 2015 Incentive Compensation Plan10.12 (15) Agreement dated April 4, 2017, among the registrant, The Dow Chemical Company, Rohm and Haas10.13 (15) First Amendment to Tax Receivables Agreement, dated April 4, 2017, among the registrant, The Dow Chemical Company,
Rohm and Haas Company and AgroFresh Inc.10.14 (15) Letter Agreement, dated April 4, 2017, between the registrant and The Dow Chemical Company.10.15 (15) Letter Agreement, dated April 4, 2017, among the registrant, The Dow Chemical Company, Rohm and Haas Company and
Boulevard Acquisition Sponsor, LLC.10.16 (16) First Amendment to 2015 Incentive Compensation Plan10.17 (1) Employment Agreement, dated as of September 15, 2015, between AgroFresh Solutions, Inc. and Thomas Ermi.10.18 (8) Offer Letter, dated August 20, 2018 between the Company and Graham Miao.14.1 (10) AgroFresh Solutions, Inc. Code of Business Conduct.21.1 * List of subsidiaries.23.1 * Consent of Deloitte & Touche LLP.
88

Table of Contents
24.1 * Power of Attorney (included on the signature page to this report).31.1 * Certification of Chief Executive Officer required by Rule 13a-14(a) or Rule 15d-14(a).31.2 * Certification of the Chief Financial Officer required by Rule 13a-14(a) or Rule 15d-14(a).32.1 ** Certification of Chief Executive Officer and Chief Financial Officer required by Rule 13a-14(b) or Rule 15d-14(b) and 18
U.S.C. 1350.101.INS * XBRL Instance Document101.SCH * XBRL Taxonomy Extension Schema101.CAL * XBRL Taxonomy Calculation Linkbase101.LAB * XBRL Taxonomy Label Document101.PRE * XBRL Presentation Linkbase Document101.DEF * XBRL Definition Linkbase Document
———————————————————————————————* Filed herewith.** Furnished herewith.(1) Incorporated by reference to an exhibit to the Annual Report on Form 10-K of the Company filed with the Securities and Exchange Commission on
March 22, 2018.(2) Incorporated by reference to an exhibit to the Current Report on Form 8-K of the Company filed with the Securities and Exchange Commission on
August 6, 2015.(3) Incorporated by reference to Annex A to the Company’s definitive proxy statement (File No. 001-36197) filed with the Securities and Exchange
Commission on July 16, 2015.(4) Incorporated by reference to an exhibit to the Current Report on Form 8-K of the Company filed with the Securities and Exchange Commission on
September 10, 2015.(5) Incorporated by reference to an exhibit to the Current Report on Form 8-K of the Company filed with the Securities and Exchange Commission on
February 19, 2014.(6) Incorporated by reference to an exhibit to Amendment No. 2 to the Company’s Registration Statement on Form S-1 (File No. 333-193320) filed with
the Securities and Exchange Commission on February 11, 2014.(7) Incorporated by reference to an exhibit to the Current Report on Form 8-K of the Company filed with the Securities and Exchange Commission on
November 18, 2015.(8) Incorporated by reference to an exhibit to the Current Report on Form 8-K of the Company filed with the Securities and Exchange Commission on
August 30, 2018.(9) Incorporated by reference to Annex C to the Company’s definitive proxy statement (File No. 001-36197) filed with the Securities and Exchange
Commission on July 16, 2015.(10) Incorporated by reference to an exhibit to the Current Report on Form 8-K of the Company filed with the Securities and Exchange Commission on
August 19, 2015.(11) Incorporated by reference to an exhibit to the Current Report on Form 8-K of the Company filed with the Securities and Exchange Commission on
July 19, 2016.(12) Incorporated by reference to an exhibit to the Current Report on Form 8-K of the Company filed with the Securities and Exchange Commission on
December 5, 2016.(13) Incorporated by reference to an exhibit to the Current Report on Form 8-K of the Company filed with the Securities and Exchange Commission on
May 4, 2015. Certain of the exhibits and schedules to this Exhibit have been omitted in accordance with Regulation S-K Item 601(b)(2). TheCompany agrees to furnish supplementally a copy of all omitted exhibits and schedules to the Securities and Exchange Commission upon itsrequest.
(14) Incorporated by reference to an exhibit to the Annual Report on Form 10-K of the Company filed with the Securities and Exchange Commission onMarch 16, 2017.
(15) Incorporated by reference to an exhibit to the Current Report on Form 8-K of the Company filed with the Securities and Exchange Commission onApril 6, 2017.
(16) Incorporated by reference to an exhibit to the Current Report on Form 8-K of the Company filed with the Securities and Exchange Commission onJune 7, 2017.
89

Table of Contents
SIGNATURES Pursuant to the requirements of the Securities Exchange Act of 1934, the Registrant has duly caused this report to be signed on its behalf by the undersigned,thereunto duly authorized.
AgroFresh Solutions, Inc.Date: March 11, 2019
/s/ Jordi Ferre By: Jordi Ferre Title: Chief Executive Officer
/s/ Graham MiaoBy: Graham Miao Title: Chief Financial Officer
POWER OF ATTORNEY
KNOW ALL PERSONS BY THESE PRESENTS, that each person whose signature appears below constitutes and appoints Jordi Ferre and Graham Miao,jointly and severally, his or her attorney—in—fact, each with the full power of substitution, for such person, in any and all capacities, to sign any and allamendments to this Annual Report on Form 10-K, and to file the same, with all exhibits thereto and other documents in connection therewith, with theSecurities and Exchange Commission, granting unto said attorney—in—fact and agent full power and authority to do and perform each and every act andthing requisite and necessary to be done in connection therewith, as fully to all intents and purposes as he or she might do or could do in person herebyratifying and confirming all that each of said attorneys—in—fact and agents, or his substitute, may do or cause to be done by virtue hereof.
Pursuant to the requirements of the Securities Exchange Act of 1934, this report has been signed below by the following persons on behalf of the registrantand in the capacities and on the date indicated.
90

Table of Contents
Signature Title Date /s/ Jordi Ferre Chief Executive Officer and Director March 11, 2019Jordi Ferre (Principal Executive Officer)
/s/ Graham Miao Executive Vice President and Chief Financial Officer March 11, 2019Graham Miao (Principal Financial and Accounting Officer)
/s/ Nance K. Dicciani Chair of the Board March 11, 2019Nance K. Dicciani /s/ Robert J. Campbell Director March 11, 2019Robert J. Campbell /s/ Gregory M. Freiwald Director March 11, 2019Gregory M. Freiwald /s/ Torsten Kraef Director March 11, 2019Torsten Kraef /s/ Denise L. Devine Director March 11, 2019Denise L. Devine /s/ Macauley Whiting, Jr. Director March 11, 2019Macauley Whiting, Jr.
/s/ George Lobisser Director March 11, 2019George Lobisser
91

Exhibit 21.1
LIST OF SUBSIDIARIES
Entity Name Jurisdiction of OrganizationAF Solutions Holdings LLC DelawareAgroFresh Inc. IllinoisAgroFresh Solutions Singapore Pte. Ltd. SingaporeAgroFresh Chile Comercial Limitada ChileAgroFresh Canada ULC CanadaAgroFresh Japan LLC JapanAgroFresh Netherlands B.V. NetherlandsAgroFresh Argentina S.R.L. ArgentinaAgroFresh Agriculture Technology Consulting (Shanghai) Co., Ltd. ChinaAgroFresh Australia Pty Ltd AustraliaAgroFresh South Africa (Pty) Ltd South AfricaAgroFresh Holding France SAS FranceAgroFresh Italia srl ItalyAgroFresh Brasil Ltda. BrazilAgroFresh New Zealand Limited New ZealandAgroFresh Korea Ltd. KoreaAgroFresh Polska Sp. Z.o.o. PolandAgroFresh Spain, S.L. SpainAgroFresh Turkey Tarim Ürünlerì Lìmìted Sìrketì TurkeyAgroFresh Belgium B.V.B.A. BelgiumAgroFresh Deutschland GmbH GermanyAGFS Switzerland GmbH SwitzerlandAGFS Mexico, S. de R.L. de C.V. MexicoTecnidex Fruit Protection, S.A.U. SpainTecnidex Gre Fruit S.U.R.L. GreeceTecnidex Per Fruit, S.A.C. PeruTecnidex Mar Fruit, S.A.R.L. MoroccoTecnidex Tur Fruit Tarim Urzum Hiz. San. Tic. Ltd. Sti. TurkeyTecnidex Sud Fruit (Pty) Ltd. South Africa
Exhibit 23.1
CONSENT OF INDEPENDENT REGISTERED PUBLIC ACCOUNTING FIRM We consent to the incorporation by reference in Registration Statements No. 333-207105 on Form S-8 and Nos. 333-229002 and 333-207106 on Form S-3 ofour report dated March 11, 2019, relating to the financial statements and financial statement schedules of AgroFresh Solutions, Inc. and subsidiariesappearing in this Annual Report on Form 10-K of AgroFresh Solutions, Inc. for the year ended December 31, 2018.
/s/ DELOITTE & TOUCHE LLP Philadelphia, PennsylvaniaMarch 11, 2019

Exhibit 31.1
CERTIFICATION OF CHIEF EXECUTIVE OFFICERPURSUANT TO SECTION 302 OF THE SARBANES-OXLEY ACT OF 2002
I, Jordi Ferre, certify that:
1. I have reviewed this annual report on Form 10-K of AgroFresh Solutions, Inc.;
2. Based on my knowledge, this report does not contain any untrue statement of a material fact or omit to state a material fact necessary to make thestatements made, in light of the circumstances under which such statements were made, not misleading with respect to the period covered by this report;
3. Based on my knowledge, the financial statements, and other financial information included in this report, fairly present in all material respects the financialcondition, results of operations and cash flows of the registrant as of, and for, the periods presented in this report;
4. The registrant’s other certifying officer and I are responsible for establishing and maintaining disclosure controls and procedures (as defined in ExchangeAct Rules 13a-15(e) and 15d-15(e)) and internal control over financial reporting (as defined in Exchange Act Rules 13a-15(f) and 15d-15(f)) for the registrantand have:
a) designed such disclosure controls and procedures, or caused such disclosure controls and procedures to be designed under our supervision, to ensure thatmaterial information relating to the registrant, including its consolidated subsidiaries, is made known to us by others within those entities,particularly during the period in which this report is being prepared;
b) designed such internal control over financial reporting, or caused such internal control over financial reporting to be designed under our supervision, toprovide reasonable assurance regarding the reliability of financial reporting and the preparation of financial statements for external purposes inaccordance with generally accepted accounting principles;
c) evaluated the effectiveness of the registrant’s disclosure controls and procedures and presented in this report our conclusions about the effectiveness ofthe disclosure controls and procedures, as of the end of the period covered by this report based on such evaluation; and
d) disclosed in this report any change in the registrant’s internal control over financial reporting that occurred during the registrant’s fourth fiscal quarterthat has materially affected, or is reasonably likely to materially affect, the registrant’s internal control over financial reporting; and
5. The registrant’s other certifying officer and I have disclosed, based on our most recent evaluation of internal control over financial reporting, to theregistrant’s auditors and the audit committee of the registrant’s board of directors (or persons performing the equivalent functions):
a) designed such disclosure controls and procedures, or caused such disclosure controls and procedures to be designed under our supervision, to ensure thatmaterial information relating to the registrant, including its consolidated subsidiaries, is made known to us by others within those entities,particularly during the period in which this report is being prepared;
b) any fraud, whether or not material, that involves management or other employees who have a significant role in the registrant's internal control overfinancial reporting.
Date: March 11, 2019
/s/ Jordi FerreJordi FerreChief Executive Officer
Exhibit 31.2
CERTIFICATION OF CHIEF FINANCIAL OFFICERPURSUANT TO SECTION 302 OF THE SARBANES-OXLEY ACT OF 2002
I, Graham Miao, certify that:
1. I have reviewed this annual report on Form 10-K of AgroFresh Solutions, Inc.;
2. Based on my knowledge, this report does not contain any untrue statement of a material fact or omit to state a material fact necessary to make thestatements made, in light of the circumstances under which such statements were made, not misleading with respect to the period covered by this report;
3. Based on my knowledge, the financial statements, and other financial information included in this report, fairly present in all material respects the financialcondition, results of operations and cash flows of the registrant as of, and for, the periods presented in this report;
4. The registrant’s other certifying officer and I are responsible for establishing and maintaining disclosure controls and procedures (as defined in ExchangeAct Rules 13a-15(e) and 15d-15(e)) and internal control over financial reporting (as defined in Exchange Act Rules 13a-15(f) and 15d-15(f)) for the registrantand have:
a) designed such disclosure controls and procedures, or caused such disclosure controls and procedures to be designed under our supervision, to ensure thatmaterial information relating to the registrant, including its consolidated subsidiaries, is made known to us by others within those entities,particularly during the period in which this report is being prepared;
b) designed such internal control over financial reporting, or caused such internal control over financial reporting to be designed under our supervision, toprovide reasonable assurance regarding the reliability of financial reporting and the preparation of financial statements for external purposes inaccordance with generally accepted accounting principles;
c) evaluated the effectiveness of the registrant’s disclosure controls and procedures and presented in this report our conclusions about the effectiveness ofthe disclosure controls and procedures, as of the end of the period covered by this report based on such evaluation; and
d) disclosed in this report any change in the registrant’s internal control over financial reporting that occurred during the registrant’s fourth fiscal quarterthat has materially affected, or is reasonably likely to materially affect, the registrant’s internal control over financial reporting; and
5. The registrant’s other certifying officer and I have disclosed, based on our most recent evaluation of internal control over financial reporting, to theregistrant’s auditors and the audit committee of the registrant’s board of directors (or persons performing the equivalent functions):
a) designed such disclosure controls and procedures, or caused such disclosure controls and procedures to be designed under our supervision, to ensure thatmaterial information relating to the registrant, including its consolidated subsidiaries, is made known to us by others within those entities,particularly during the period in which this report is being prepared;
b) any fraud, whether or not material, that involves management or other employees who have a significant role in the registrant's internal control overfinancial reporting.
Date: March 11, 2019
/s/ Graham Miao Graham Miao Chief Financial Officer

Exhibit 32.1
CERTIFICATION OFCHIEF EXECUTIVE OFFICER AND CHIEF FINANCIAL OFFICER
PURSUANT TO 18 U.S.C. SECTION 1350,AS ADOPTED PURSUANT TO
SECTION 906 OF THE SARBANES-OXLEY ACT OF 2002
In connection with the Annual Report of AgroFresh Solutions, Inc. (the “Company”) on Form 10-K for the year ended December 31, 2017 as filed with theSecurities and Exchange Commission on the date hereof (the “Report”), Jordi Ferre, Chief Executive Officer of the Company, and Graham Miao, ChiefFinancial Officer of the Company, certify, pursuant to 18 U.S.C. Section 1350, as adopted pursuant to Section 906 of the Sarbanes-Oxley Act of 2002, that toour best knowledge:
1. The Report fully complies with the requirements of Section 13(a) or 15(d) of the Securities Exchange Act of 1934; and
2. The information contained in the Report fairly presents, in all material respects, the financial condition and results of operations of the Company.
Date: March 11, 2019
/s/ Jordi Ferre Jordi Ferre Chief Executive Officer
/s/ Graham Miao Graham Miao Chief Financial Officer