overview of eskom’s system operator€¦ · small hydro ipp 2 stations 14 mw landfill ipp 3...
TRANSCRIPT
Overview of Eskom’s System Operator
Presented by: Mr Bernard Magoro
Date: 7 June 2018
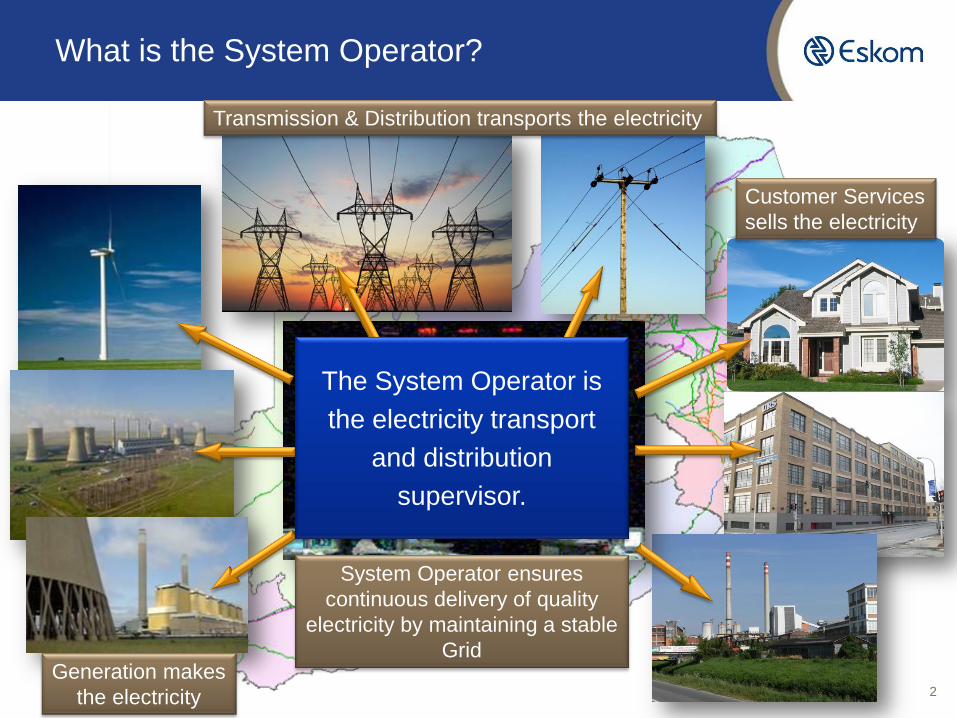
What is the System Operator?
Generation makes
the electricity
Transmission & Distribution transports the electricity
Customer Services
sells the electricity
System Operator ensures
continuous delivery of quality
electricity by maintaining a stable
Grid
The System Operator is
the electricity transport
and distribution
supervisor.
2
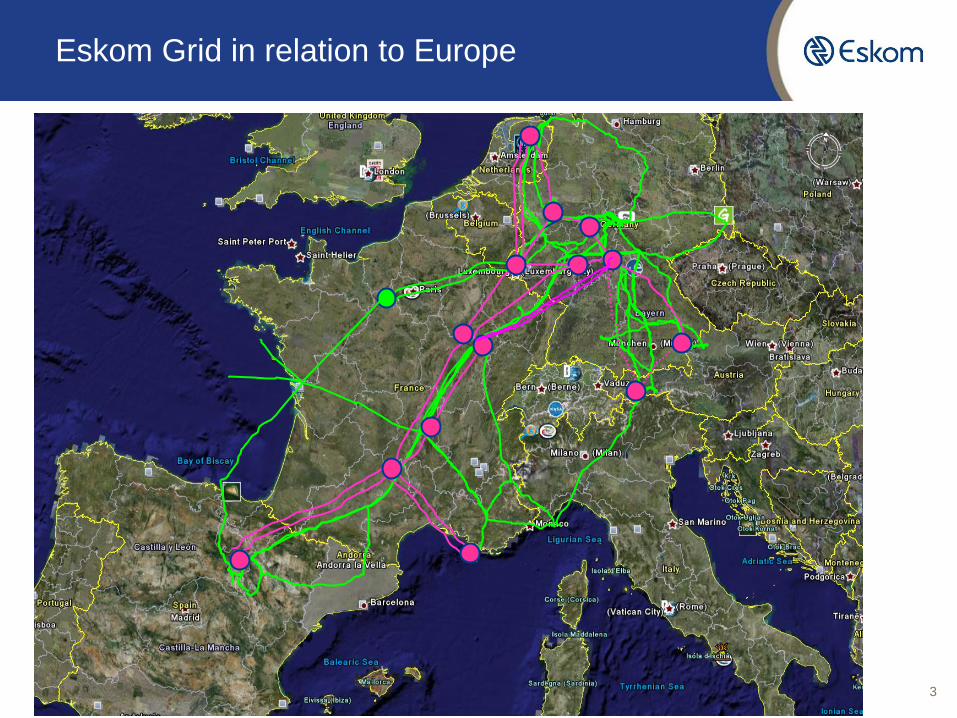
Eskom Grid in relation to Europe
3
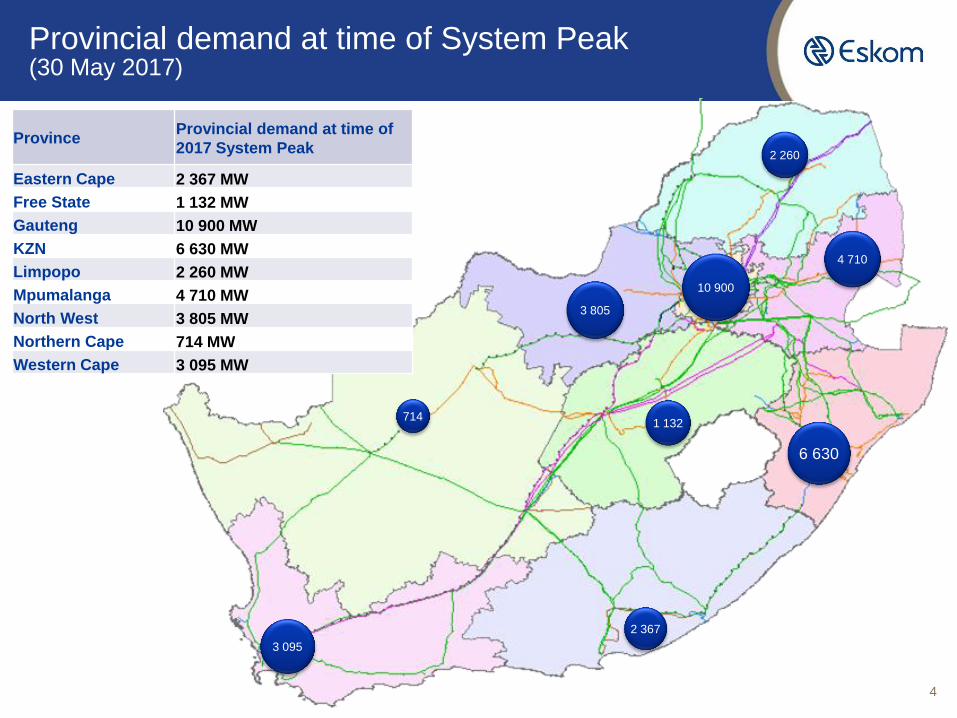
Provincial demand at time of System Peak (30 May 2017)
Province Provincial demand at time of
2017 System Peak
Eastern Cape 2 367 MW
Free State 1 132 MW
Gauteng 10 900 MW
KZN 6 630 MW
Limpopo 2 260 MW
Mpumalanga 4 710 MW
North West 3 805 MW
Northern Cape 714 MW
Western Cape 3 095 MW
10 900
1 132
2 367
6 630
2 260
4 710
3 805
714
3 095
4
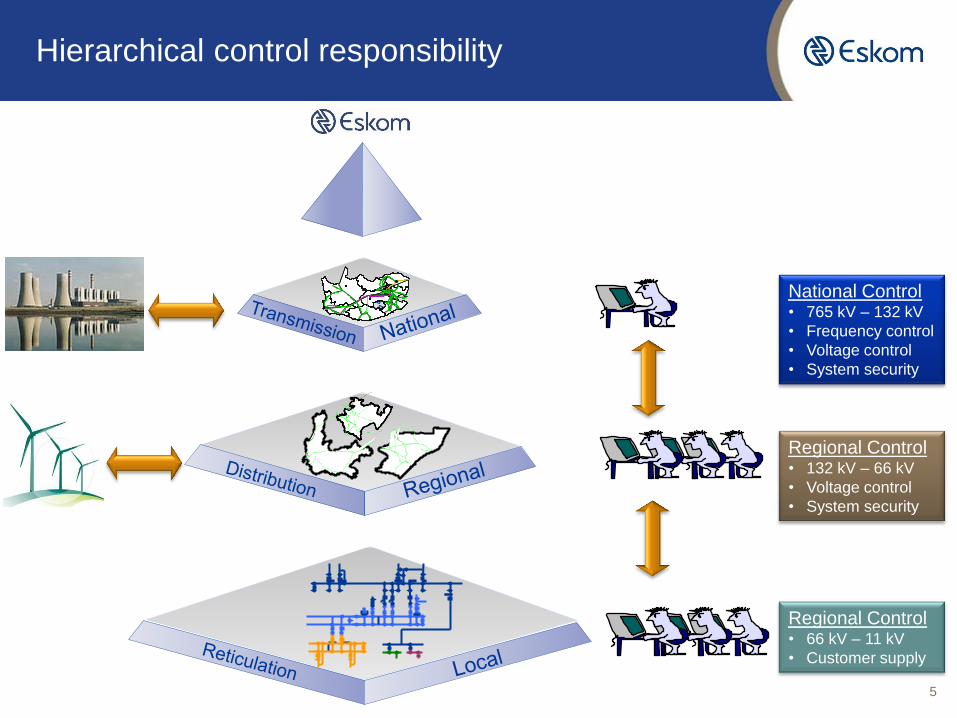
National Control • 765 kV – 132 kV
• Frequency control
• Voltage control
• System security
Regional Control • 132 kV – 66 kV
• Voltage control
• System security
Regional Control • 66 kV – 11 kV
• Customer supply
Hierarchical control responsibility
5
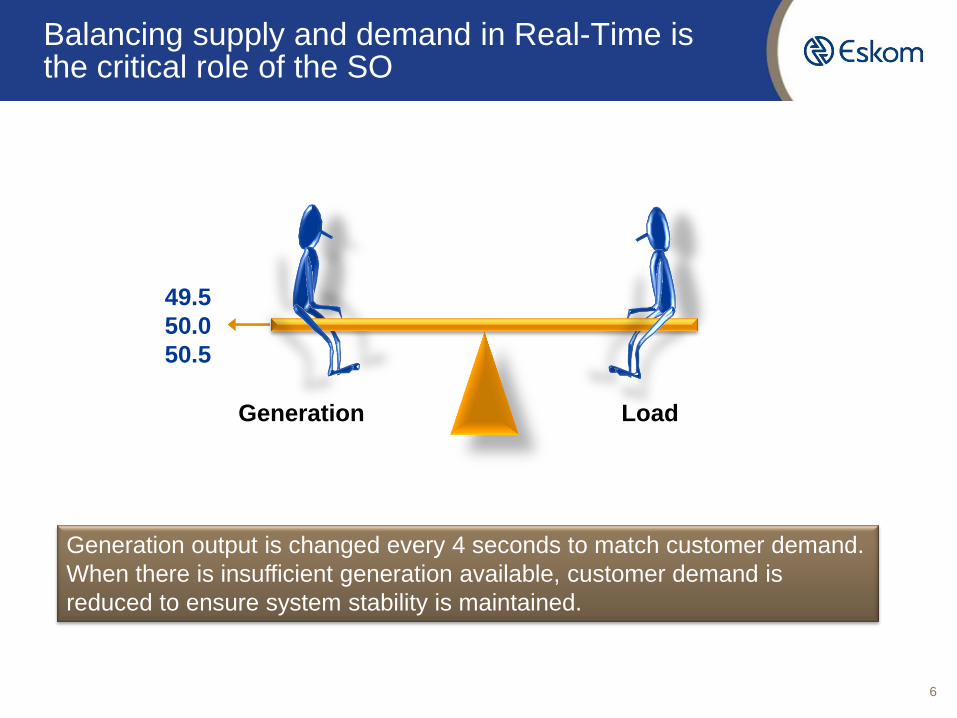
49.5
50.0
50.5
Generation Load
Generation output is changed every 4 seconds to match customer demand.
When there is insufficient generation available, customer demand is
reduced to ensure system stability is maintained.
Balancing supply and demand in Real-Time is the critical role of the SO
6
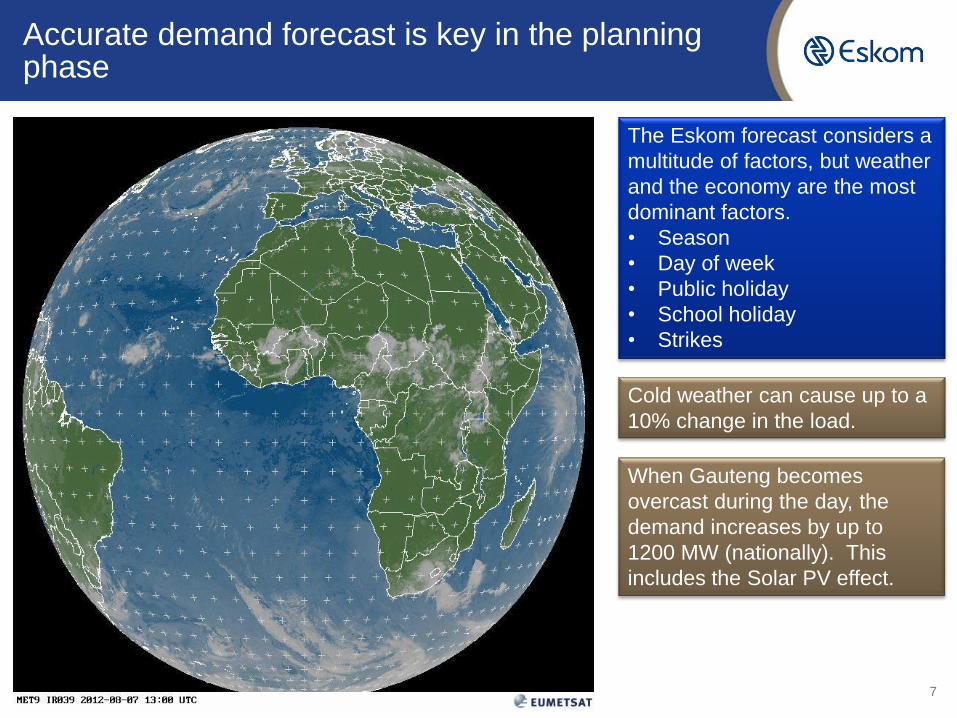
Cold weather can cause up to a
10% change in the load.
Accurate demand forecast is key in the planning phase
When Gauteng becomes
overcast during the day, the
demand increases by up to
1200 MW (nationally). This
includes the Solar PV effect.
The Eskom forecast considers a
multitude of factors, but weather
and the economy are the most
dominant factors.
• Season
• Day of week
• Public holiday
• School holiday
• Strikes
7
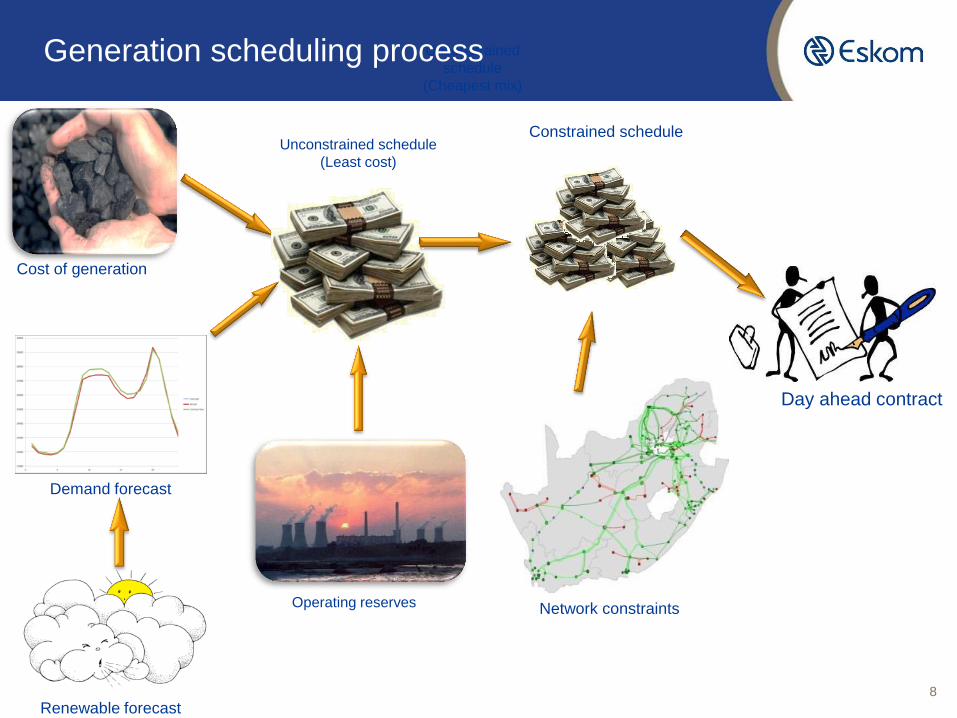
Cost of generation
Demand forecast
Unconstrained
schedule
(Cheapest mix)
Network constraints
Day ahead contract
Generation scheduling process
Operating reserves
Renewable forecast
Unconstrained schedule
(Least cost)
Constrained schedule
8
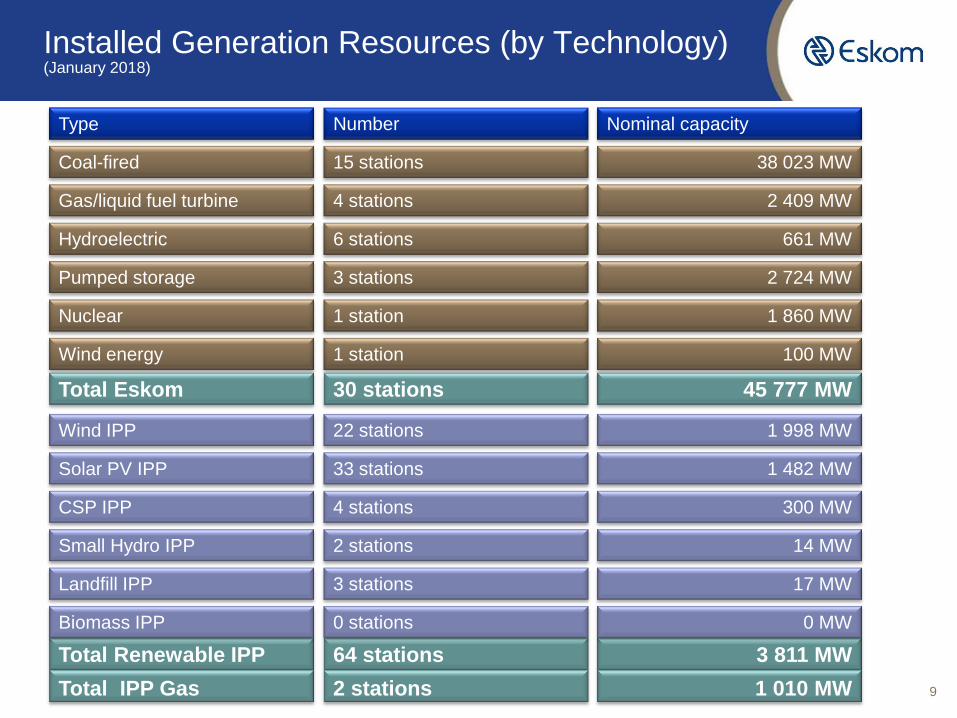
Installed Generation Resources (by Technology) (January 2018)
Type Number Nominal capacity
Coal-fired 15 stations 38 023 MW
Gas/liquid fuel turbine 4 stations 2 409 MW
Hydroelectric 6 stations 661 MW
Pumped storage 3 stations 2 724 MW
Nuclear 1 station 1 860 MW
Wind energy 1 station 100 MW
Total Renewable IPP 64 stations 3 811 MW
Total IPP Gas 2 stations 1 010 MW
Wind IPP 22 stations 1 998 MW
Solar PV IPP 33 stations 1 482 MW
CSP IPP 4 stations 300 MW
Total Eskom 30 stations 45 777 MW
Small Hydro IPP 2 stations 14 MW
Landfill IPP 3 stations 17 MW
Biomass IPP 0 stations 0 MW
9
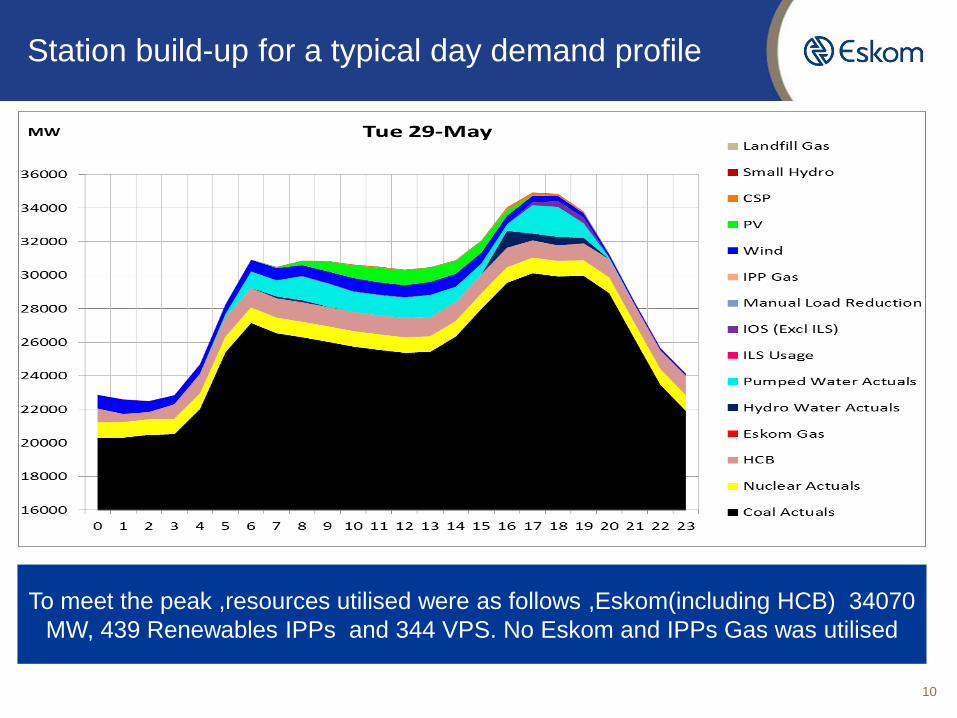
Station build-up for a typical day demand profile
To meet the peak ,resources utilised were as follows ,Eskom(including HCB) 34070
MW, 439 Renewables IPPs and 344 VPS. No Eskom and IPPs Gas was utilised
10
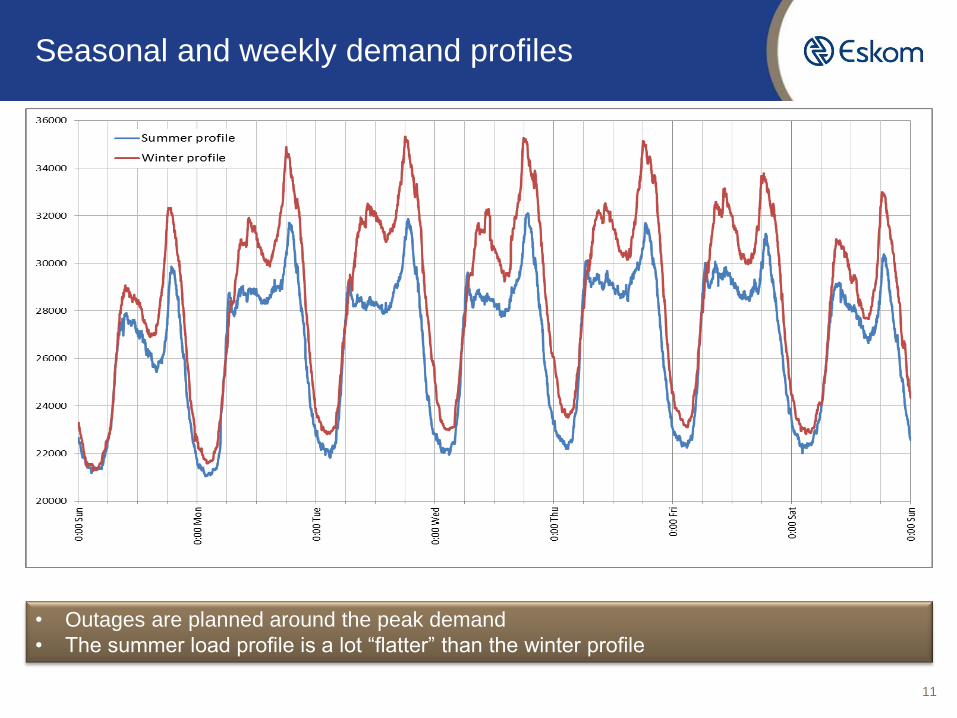
Seasonal and weekly demand profiles
• Outages are planned around the peak demand
• The summer load profile is a lot “flatter” than the winter profile
11

Annual Demand Profile
12
25000
27000
29000
31000
33000
35000
37000
1 3 5 7 9 11 13 15 17 19 21 23 25 27 29 31 33 35 37 39 41 43 45 47 49 51 53
Website Demonstration: Eskom weekly system status report
13
14

Enquiries:
+27 011 800 6050 / 3343 / 6103
15