overweight and obesity - centers for disease control and ......national center for chronic disease...
TRANSCRIPT

CS233917-AL
National Center for Chronic Disease Prevention and Health Promotion Division of Nutrition, Physical Activity and Obesity
Overweight and Obesity September 2012
West Virginia State Nutrition, Physical Activity, and Obesity ProfileObesity has important consequences on our nation’s health and economy. It is linked to a number of chronic diseases, including coronary heart disease, stroke, diabetes, and some cancers (NIH Clinical Guidelines, 1998). Among adults, the medical costs associated with obesity are estimated at 147 billion dollars (Finkelstein, 2009). Many American communities are characterized by unhealthy options when it comes to diet and physical activity. We need public health approaches that make healthy options available, accessible, and affordable for all Americans.

West Virginia - State Nutrition, Physical Activity, and Obesity Profile
Page 2 of 4
CDC’s Division of Nutrition and Physical, and Obesity (DNPAO) supports the nation’s capacity to address public health in all policies and establish successful and sustainable interventions to support healthy eating and active living. The Division provides support (i.e., implementation and evaluation guidance, technical assistance, training, surveillance and applied research, translation and dissemination, and partnership development) to states, communities and national partners to implement policy, system, and environmental strategies. The goal is to improve dietary quality, increase physical activity and reduce obesity across multiple settings—such as child care facilities, workplaces, hospitals and medical care facilities, schools, and communities.
State Population of West Virginia• Estimated Total Population 2010(1)
= 1,852,994
• Adults age 18 and over(2) = 79.1% of the total population in 2010
• Youth under 18 years of age(1) = 20.9% of the total population in 2010
(1) U.S. Census Bureau. State and County QuickFacts. 2011. Available online at http://quickfacts.census.gov/qfd/ index.html
(2) Calculated estimated = 100% minus percent of the total population under 18 years old, using State and County QuickFacts, 2010 data from the U.S. Census.
Adult Overweight and ObesityOverweight and Obesity(3)
• 67.4% were overweight, with a Body Mass Index of 25 or greater.
• 32.5% were obese, with a Body Mass Index of 30 or greater.
Dietary Behaviors(4) • 25.3% of adults reported having consumed
fruits at the recommended level of 2 or more times per day.
• 22.1% of adults reported having consumed vegetables at the recommended level of 3 or more times per day.
Physical Activity(5)
• 30.6% of adults achieved at least 300 minutes a week of moderate-intensity aerobic physical activity or 150 minutes a week of vigorous-intensity aerobic activity (or an equivalent combination).
• 33.2% of West Virginia’s adults reported that during the past month, they had not participated in any physical activity.
Source of Adult Obesity Data:(3) CDC. Behavioral Risk Factor Surveillance System: Prevalence
and Trend Data–Overweight and Obesity, U.S. Obesity Trends, Trends by State 2010. Available online at http://nccd.cdc.gov/NPAO_DTM/
Source of Adult Fruit and Vegetable Data: (4) CDC. MMWR September 2010 State–Specific Trends in Fruit
and Vegetable Consumption Among Adults United States, 2000–2009. Available online at http://www.cdc.gov/mmwr/pdf/wk/mm5935.pdf
Source of Adult Physical Activity Data:(5) CDC. BRFSS Behavioral Risk Factor Surveillance System:
Prevalence and Trend Data–Physical Activity, U.S. Physical Activity Trends by State 2009–2010. Available online at http://nccd.cdc.gov/NPAO_DTM/
Adolescent Overweight and ObesityOverweight and Obesity(6)
• 14.4% were overweight (≥ 85th and < 95th percentiles for BMI by age and sex, based on reference data)
• 14.2% were obese (≥95th percentile BMI by age and sex, based on reference data)
Unhealthy Dietary Behaviors(6)
• Fruit consumption: 71.9% ate fruits or drank 100% fruit juice less than 2 times per day during the 7 days before the survey (100% fruit juice or fruit).
• Vegetable consumption: 85.5% ate vegetables less than 3 times per day during the 7 days before the survey (green salad; potatoes, excluding French fries, fried potatoes, or potato chips; carrots; or other vegetables).
• Sugar-sweetened beverage consumption: 34.5% drank a can, bottle, or glass of soda or pop (not including diet soda or diet pop) at least one time per day during the 7 days before the survey.
West Virginia - State Nutrition, Physical Activity, and Obesity Profile
Page 3 of 4
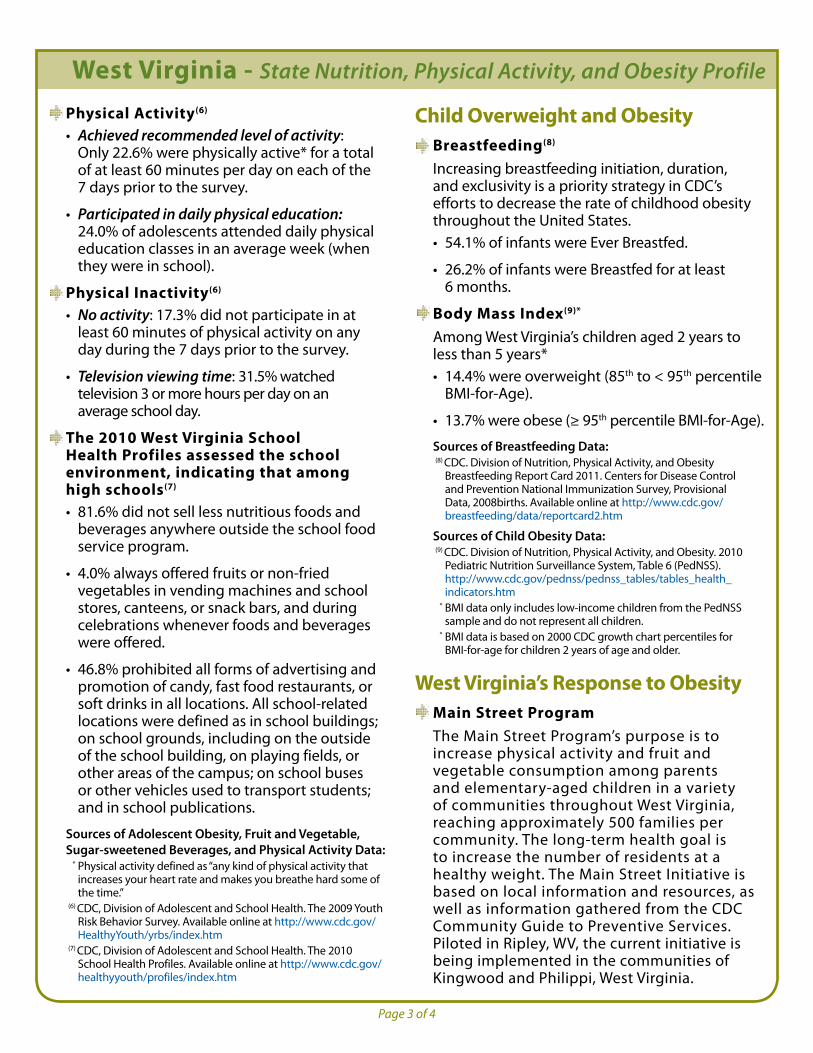
Physical Activity(6)
• Achieved recommended level of activity: Only 22.6% were physically active* for a total of at least 60 minutes per day on each of the 7 days prior to the survey.
• Participated in daily physical education: 24.0% of adolescents attended daily physical education classes in an average week (when they were in school).
Physical Inactivity(6)
• No activity: 17.3% did not participate in at least 60 minutes of physical activity on any day during the 7 days prior to the survey.
• Television viewing time: 31.5% watched television 3 or more hours per day on an average school day.
The 2010 West Virginia School Health Profiles assessed the school environment, indicating that among high schools(7)
• 81.6% did not sell less nutritious foods and beverages anywhere outside the school food service program.
• 4.0% always offered fruits or non-fried vegetables in vending machines and school stores, canteens, or snack bars, and during celebrations whenever foods and beverages were offered.
• 46.8% prohibited all forms of advertising and promotion of candy, fast food restaurants, or soft drinks in all locations. All school-related locations were defined as in school buildings; on school grounds, including on the outside of the school building, on playing fields, or other areas of the campus; on school buses or other vehicles used to transport students; and in school publications.
Sources of Adolescent Obesity, Fruit and Vegetable, Sugar-sweetened Beverages, and Physical Activity Data:
* Physical activity defined as “any kind of physical activity that increases your heart rate and makes you breathe hard some of the time.”
(6) CDC, Division of Adolescent and School Health. The 2009 Youth Risk Behavior Survey. Available online at http://www.cdc.gov/HealthyYouth/yrbs/index.htm
(7) CDC, Division of Adolescent and School Health. The 2010 School Health Profiles. Available online at http://www.cdc.gov/healthyyouth/profiles/index.htm
Child Overweight and ObesityBreastfeeding(8)
Increasing breastfeeding initiation, duration, and exclusivity is a priority strategy in CDC’s efforts to decrease the rate of childhood obesity throughout the United States. • 54.1% of infants were Ever Breastfed.
• 26.2% of infants were Breastfed for at least 6 months.
Body Mass Index(9)*
Among West Virginia’s children aged 2 years to less than 5 years*• 14.4% were overweight (85th to < 95th percentile
BMI-for-Age).
• 13.7% were obese (≥ 95th percentile BMI-for-Age).
Sources of Breastfeeding Data:(8) CDC. Division of Nutrition, Physical Activity, and Obesity
Breastfeeding Report Card 2011. Centers for Disease Control and Prevention National Immunization Survey, Provisional Data, 2008births. Available online at http://www.cdc.gov/breastfeeding/data/reportcard2.htm
Sources of Child Obesity Data:(9) CDC. Division of Nutrition, Physical Activity, and Obesity. 2010
Pediatric Nutrition Surveillance System, Table 6 (PedNSS). http://www.cdc.gov/pednss/pednss_tables/tables_health_indicators.htm
* BMI data only includes low-income children from the PedNSS sample and do not represent all children.
* BMI data is based on 2000 CDC growth chart percentiles for BMI-for-age for children 2 years of age and older.
West Virginia’s Response to ObesityMain Street ProgramThe Main Street Program’s purpose is to increase physical activity and fruit and vegetable consumption among parents and elementary-aged children in a variety of communities throughout West Virginia, reaching approximately 500 families per community. The long-term health goal is to increase the number of residents at a healthy weight. The Main Street Initiative is based on local information and resources, as well as information gathered from the CDC Community Guide to Preventive Services. Piloted in Ripley, WV, the current initiative is being implemented in the communities of Kingwood and Philippi, West Virginia.

West Virginia - State Nutrition, Physical Activity, and Obesity Profile
Page 4 of 4
Breastfeeding Policy - Hospitals and WorksitesIn partnership with the West Virginia Breastfeeding Alliance, the West Virginia Office of Healthy Lifestyles is promoting hospital maternity care practices that support breastfeeding in terms complementary to the Baby Friendly Hospital Initiative, and providing assistance to businesses to implement worksite lactation accommodations.
Guidelines for School Nutrition and Physical Activity West Virginia continues to work on implementation and evaluation of physical activity and nutrition changes in schools. In 2005, the governor signed House Bill 2816 - the Healthy Lifestyles Act - into law. This legislation provided the momentum for the Healthy Start Initiative by returning physical education to the K-12 curriculum and by requiring school systems that enter into soft drink vending contracts to make an equal number of healthy items available to students. In 2008, additional legislation was passed that established nutrition standards for foods sold, served, or distributed on school premises.
In June 2010, the WV Department of Education, Office of Child Nutrition that governs USDA’s Child and Adult Feeding Program (CACFP) in West Virginia institutions, introduced new child care standards modeled after similar guidelines developed in New York City. The University of West Virginia (UWVA conducted a series of focus groups and interviews to assess what challenges child care providers anticipate when implementing the new standards. The new standards were implemented in 2011. Resources provided to help with implementation of standards included training on the standards, regional cooking schools, and toolkits for child care staff.
Contact InformationStephen FrameHealthy Lifestyles Program ManagerDivision of Health Promotion and Chronic DiseaseWest Virginia Bureau for Public Health 350 Capitol Street, Room 514Charleston, WV 25301-3715Ph: 304-356-4256 Fax: 304-558-1553E-mail: [email protected]: http://www.wvohl.com/
ReferencesNIH. Clinical Guidelines Clinical Guidelines on the Identification, Evaluation, and Treatment of Overweight and Obesity in Adults: The Evidence Report. 1998. Available online at http://www.nhlbi.nih.gov/guidelines/obesity/ob_gdlns.htm
Finkelstein, EA, Trogdon, JG, Cohen, JW, and Dietz, W. Annual medical spending attributable to obesity: Payer- and service-specific estimates. Health Affairs 2009; 28(5): w822-w831.