pa load pull error limits using delta gt...
TRANSCRIPT
© GlobespanVirata Inc. 2003
“PA Load Pull Error Limits using Delta Gt Contours”
by Jim Paviol, Eric Kueckels*, Ravi Varanasi** & Larry Dunleavy**
Presented by Jim Paviol, Sr. Principal Systems Engineer, GlobespanVirata - PRISM Wireless 2401 Palm Bay Rd. NE, MS62B-017; Palm Bay, FL 32905 (321)-724-7081
*Maury Microwave; Ontario, CA 91764-4804(518)-857-6224; Maury: (919)-987-4715
**University of South Florida (USF); EE-WAMI Center, Tampa, FL 33620 (813)-974-2574

© GlobespanVirata Inc. 2003
Delta Gt Contours Introduction
• Load Pull tuners sweep all reflection coefficient space.– Maury Load Pull Tuner Systems are used for this presentation.
• Tuners characterizations are used in gain contour calculations:– Accuracy of S-Parameter characterization is critical.– Repeatability of connectors and cables are important.– The Power Block Diagram needs to be set up properly.
• Delta Gt can be used to confirm the system accuracy.– Insert a characterized low loss through between tuners.– Sweep out the reflection coefficients for the tuner.
• Initially the outside ring with 45° points and the center.• Over-night sweeps of all reflection space and frequencies.
– Both Source and Load tuners should be verified.– Start with a simple coax system and then progress to more
complex on-wafer and diplexer or triplexes setups.
© GlobespanVirata Inc. 2003
Delta Gt Contours: Formula’s
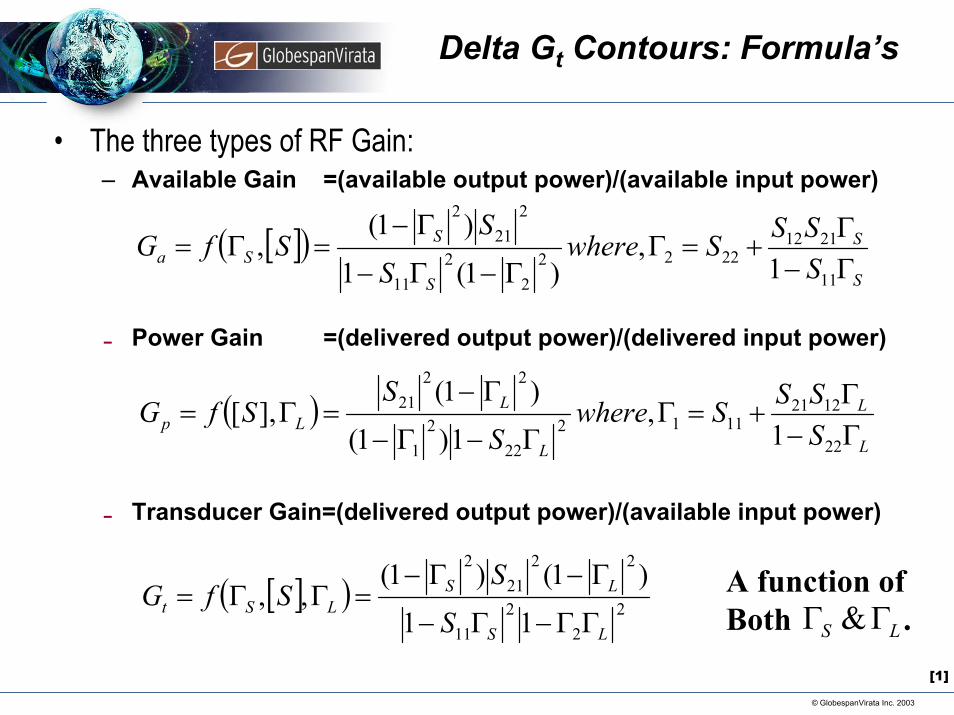
• The three types of RF Gain: – Available Gain =(available output power)/(available input power)
[ ]( )S
S
S
SSa S
SSSwhereS
SSfG
Γ−Γ
+=ΓΓ−Γ−
Γ−=Γ=
11
21122222
22
11
221
2
1,
)1(1
)1(,
0 Power Gain =(delivered output power)/(delivered input power)
( )L
L
L
LLp S
SSSwhereS
SSfG
Γ−Γ
+=ΓΓ−Γ−
Γ−=Γ=
22
12211112
222
1
2221
1,
1)1(
)1(],[
0 Transducer Gain=(delivered output power)/(available input power)
[ ]( ) 22
211
2221
2
11
)1()1(,,
LS
LSLSt
SS
SfGΓΓ−Γ−
Γ−Γ−=ΓΓ= A function of
Both . LS ΓΓ &[1]
© GlobespanVirata Inc. 2003
Delta Gt Minimum Configuration
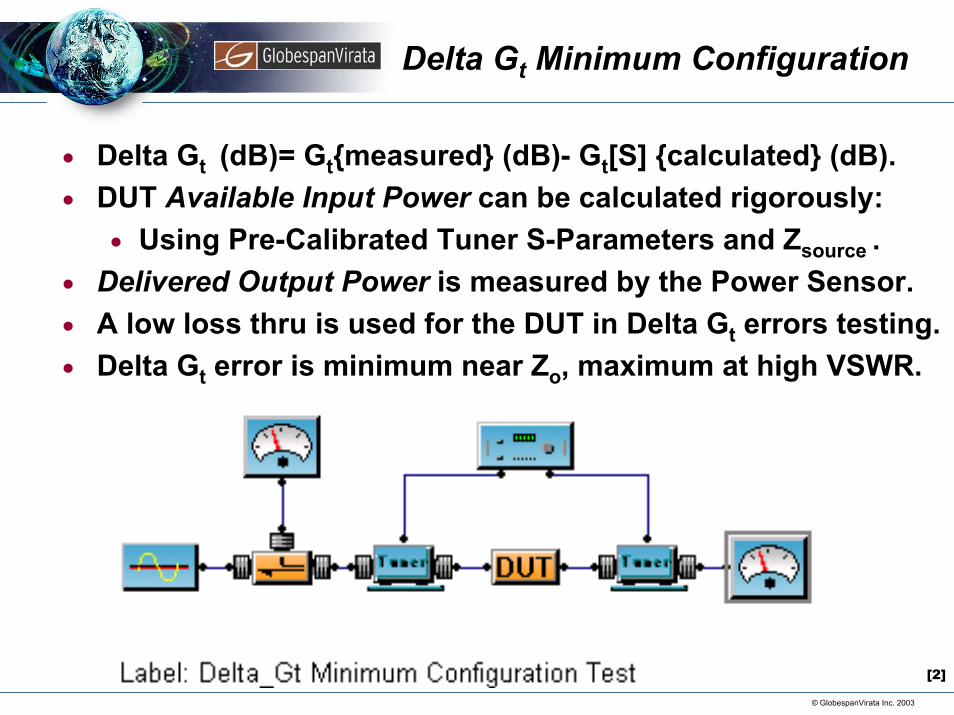
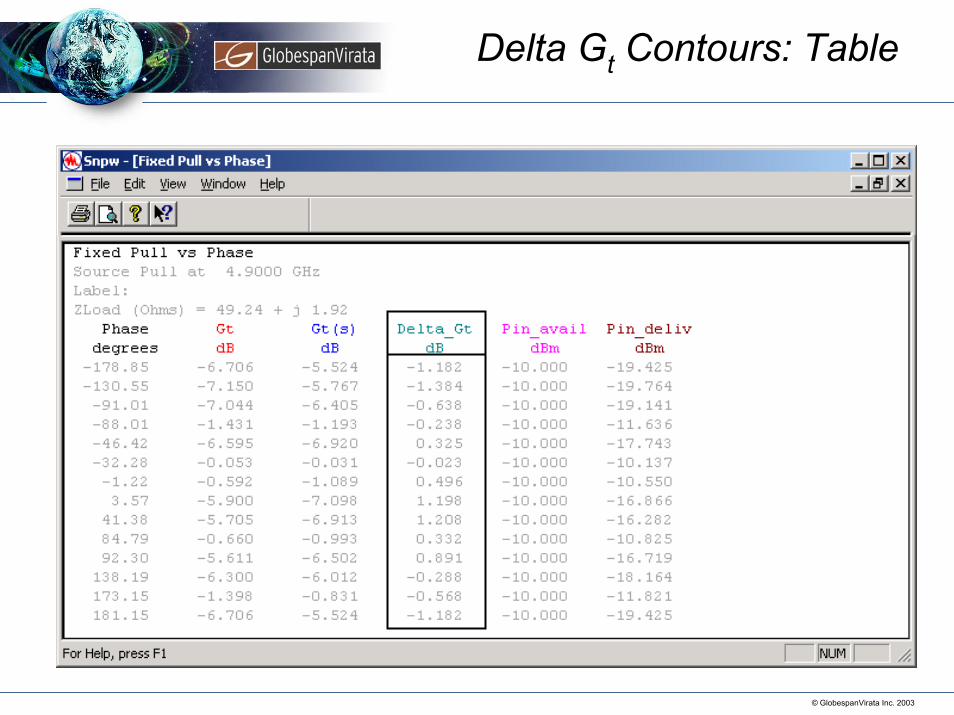
n Delta Gt (dB)= Gt{measured} (dB)- Gt[S] {calculated} (dB).n DUT Available Input Power can be calculated rigorously:
n Using Pre-Calibrated Tuner S-Parameters and Zsource .n Delivered Output Power is measured by the Power Sensor.n A low loss thru is used for the DUT in Delta Gt errors testing.n Delta Gt error is minimum near Zo, maximum at high VSWR.
[2]
© GlobespanVirata Inc. 2003
Delta Gt‘Setup Options
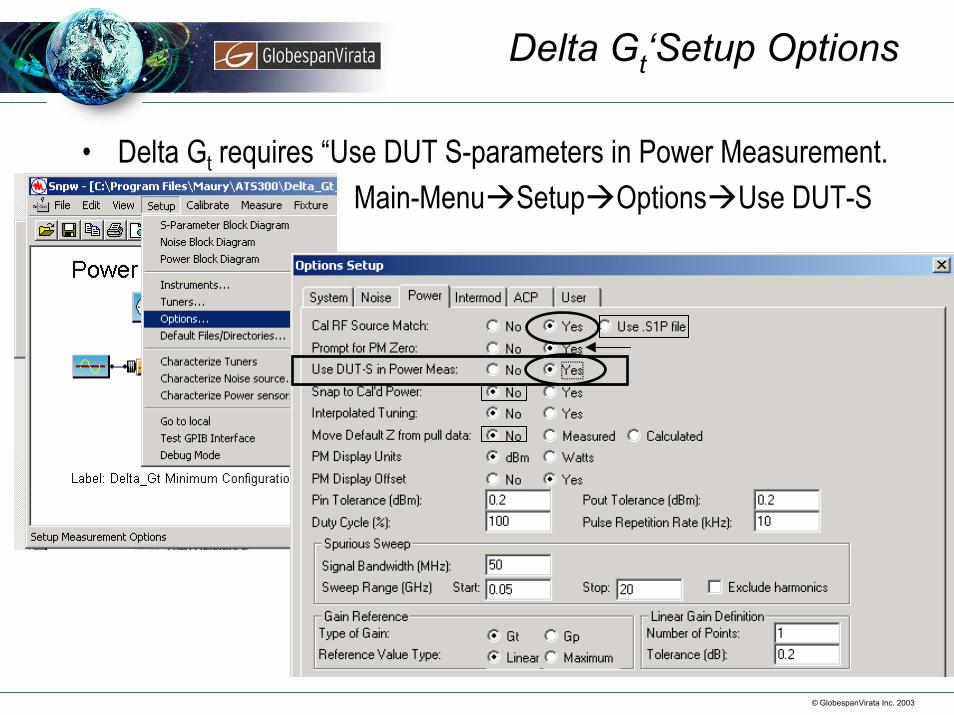
• Delta Gt requires “Use DUT S-parameters in Power Measurement.Main-Menu Setup Options Use DUT-S
© GlobespanVirata Inc. 2003
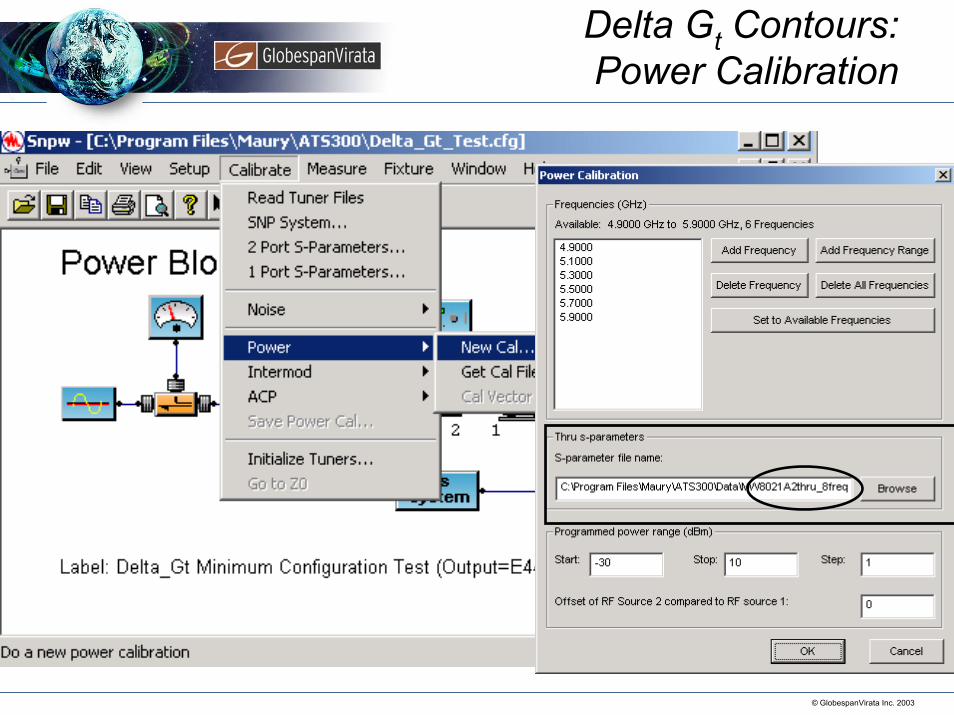
Delta Gt Contours:Power Calibration
© GlobespanVirata Inc. 2003
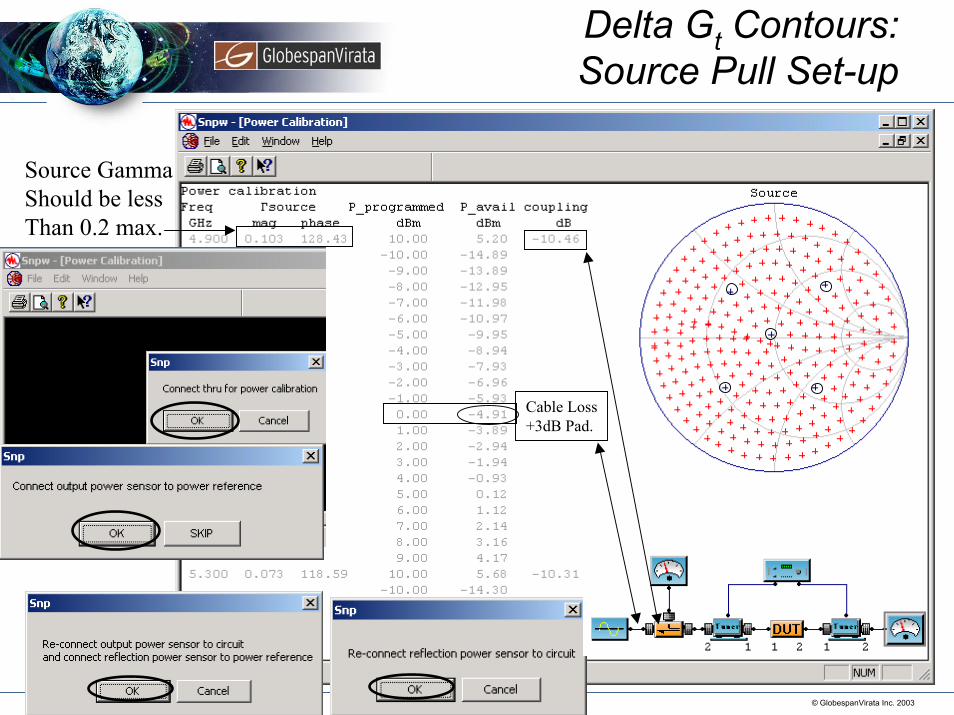
Delta Gt Contours: Source Pull Set-up
Source Gamma Should be lessThan 0.2 max.
Cable Loss+3dB Pad.
© GlobespanVirata Inc. 2003
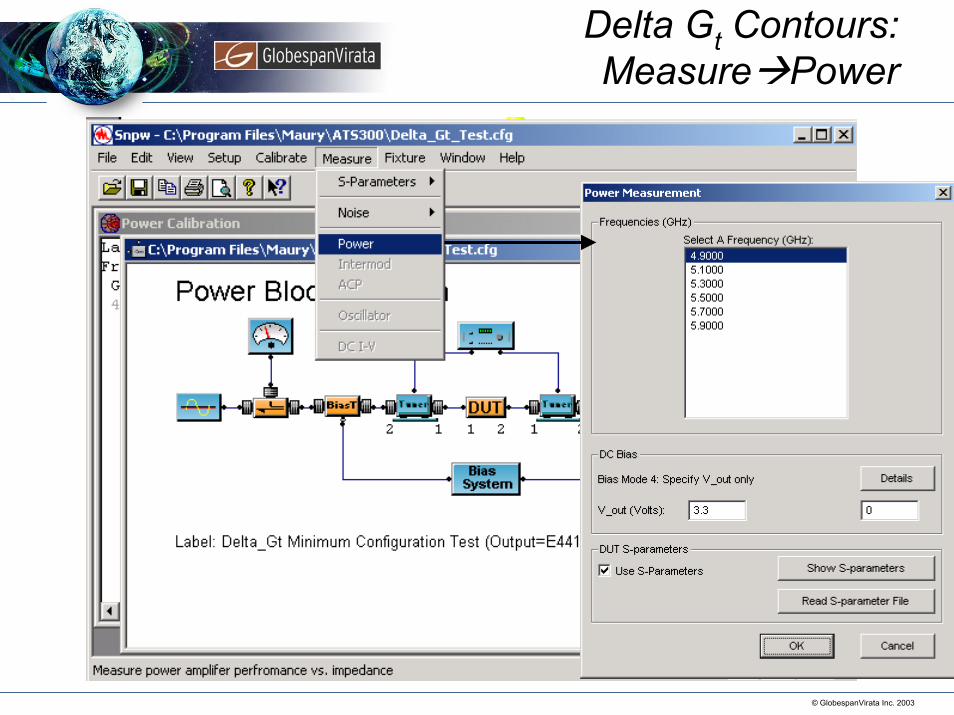
Delta Gt Contours: Measure Power
© GlobespanVirata Inc. 2003
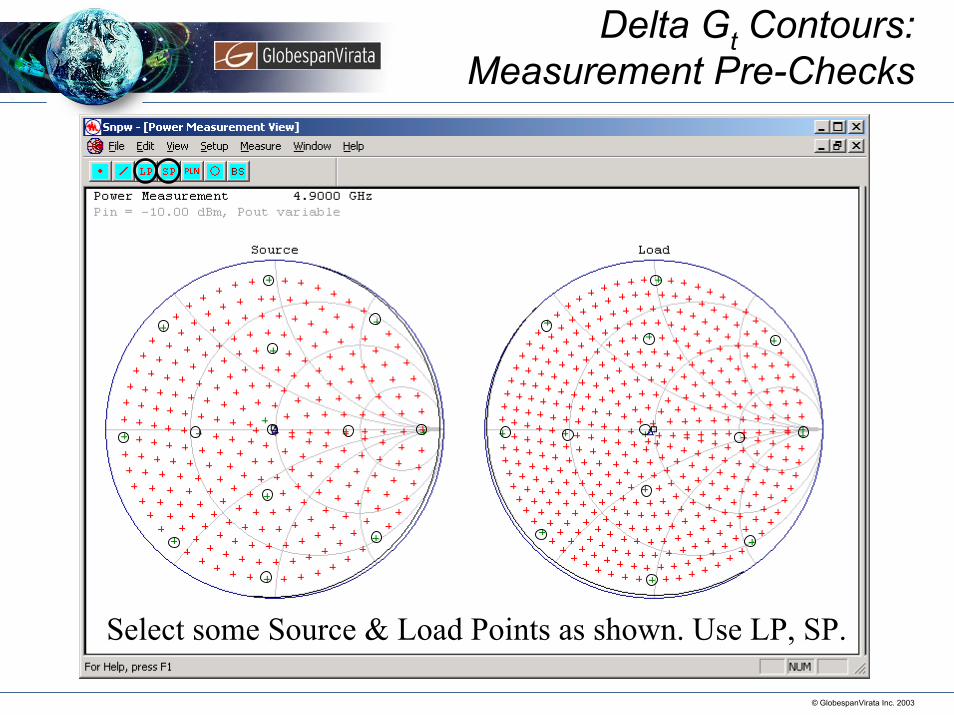
Delta Gt Contours: Measurement Pre-Checks
Select some Source & Load Points as shown. Use LP, SP.
© GlobespanVirata Inc. 2003
Delta Gt Contours: Table
© GlobespanVirata Inc. 2003
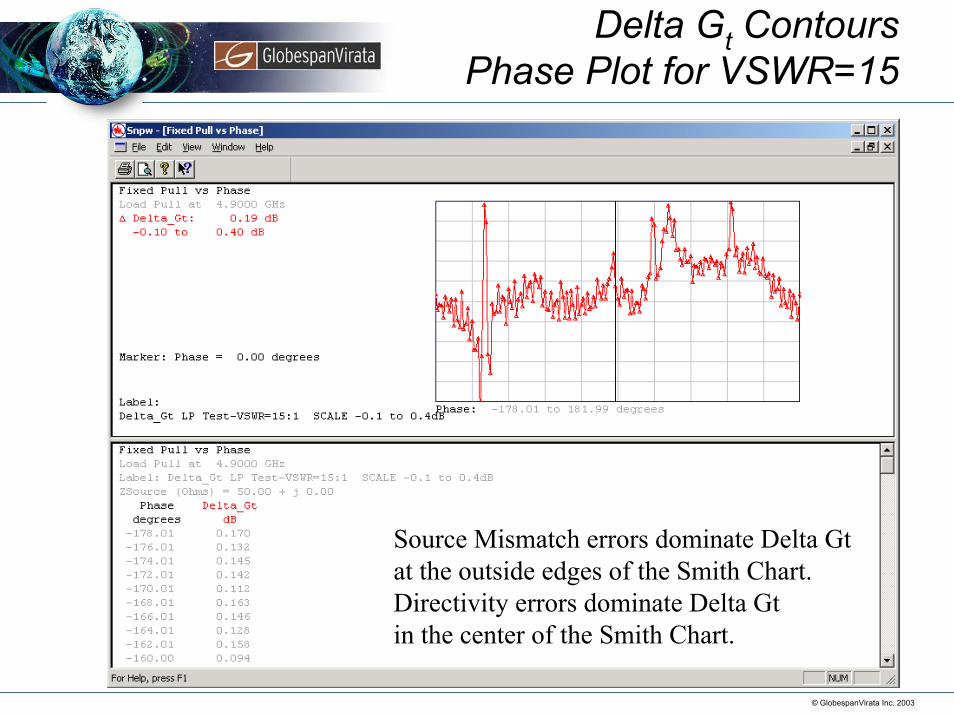
Delta Gt ContoursPhase Plot for VSWR=15
Source Mismatch errors dominate Delta Gtat the outside edges of the Smith Chart.Directivity errors dominate Delta Gt in the center of the Smith Chart.
© GlobespanVirata Inc. 2003
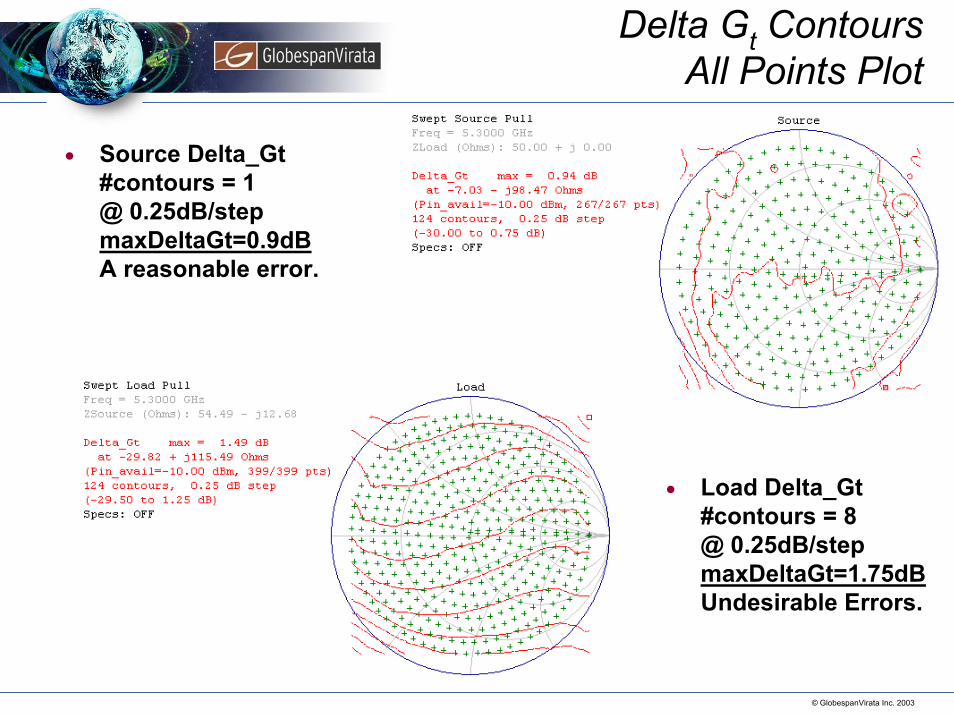
Delta Gt ContoursAll Points Plot
n Source Delta_Gt #contours = 1 @ 0.25dB/step maxDeltaGt=0.9dB A reasonable error.
n Load Delta_Gt #contours = 8 @ 0.25dB/step maxDeltaGt=1.75dB Undesirable Errors.
© GlobespanVirata Inc. 2003
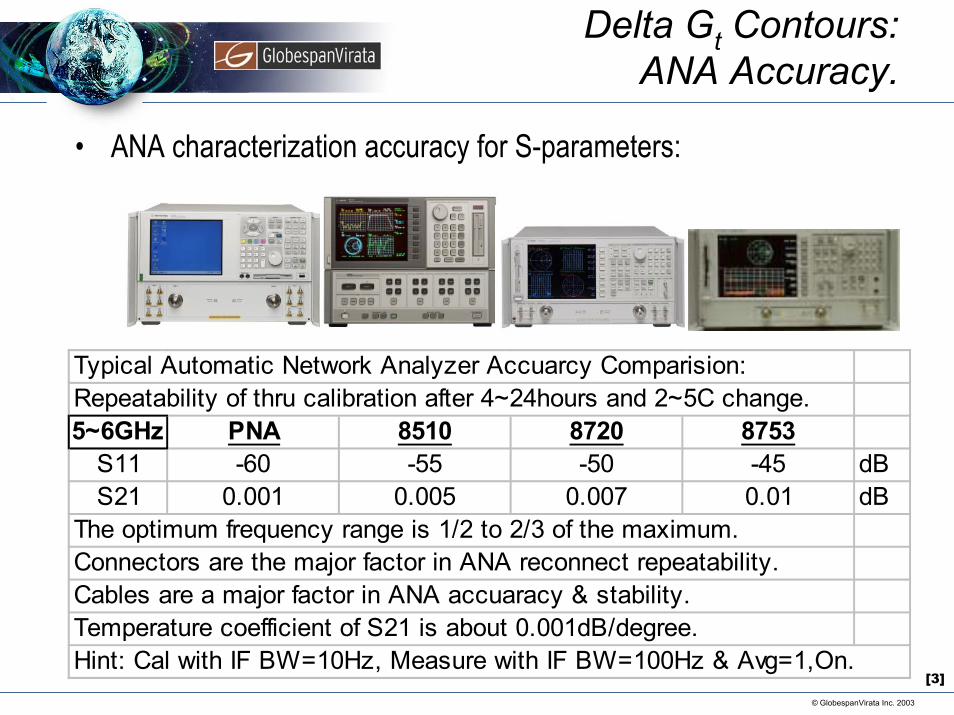
Delta Gt Contours: ANA Accuracy.
• ANA characterization accuracy for S-parameters:
Typical Automatic Network Analyzer Accuarcy Comparision:Repeatability of thru calibration after 4~24hours and 2~5C change.5~6GHz PNA 8510 8720 8753
S11 -60 -55 -50 -45 dBS21 0.001 0.005 0.007 0.01 dB
The optimum frequency range is 1/2 to 2/3 of the maximum.Connectors are the major factor in ANA reconnect repeatability.Cables are a major factor in ANA accuaracy & stability.Temperature coefficient of S21 is about 0.001dB/degree.Hint: Cal with IF BW=10Hz, Measure with IF BW=100Hz & Avg=1,On.
[3]
© GlobespanVirata Inc. 2003
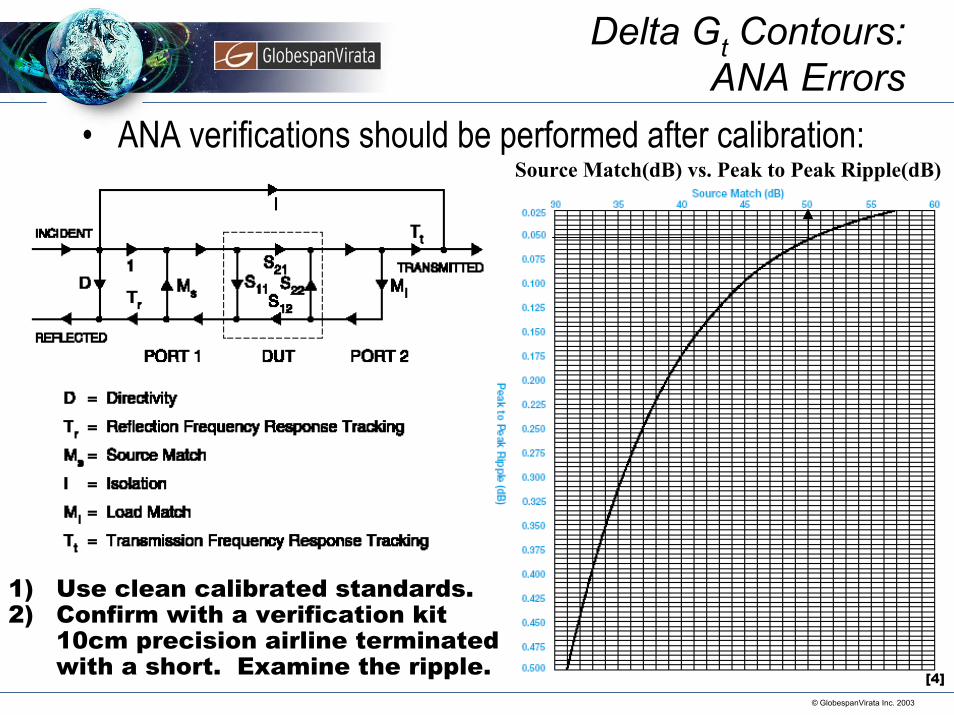
Delta Gt Contours: ANA Errors
• ANA verifications should be performed after calibration:
1) Use clean calibrated standards.2) Confirm with a verification kit
10cm precision airline terminatedwith a short. Examine the ripple.
Source Match(dB) vs. Peak to Peak Ripple(dB)
[4]
© GlobespanVirata Inc. 2003
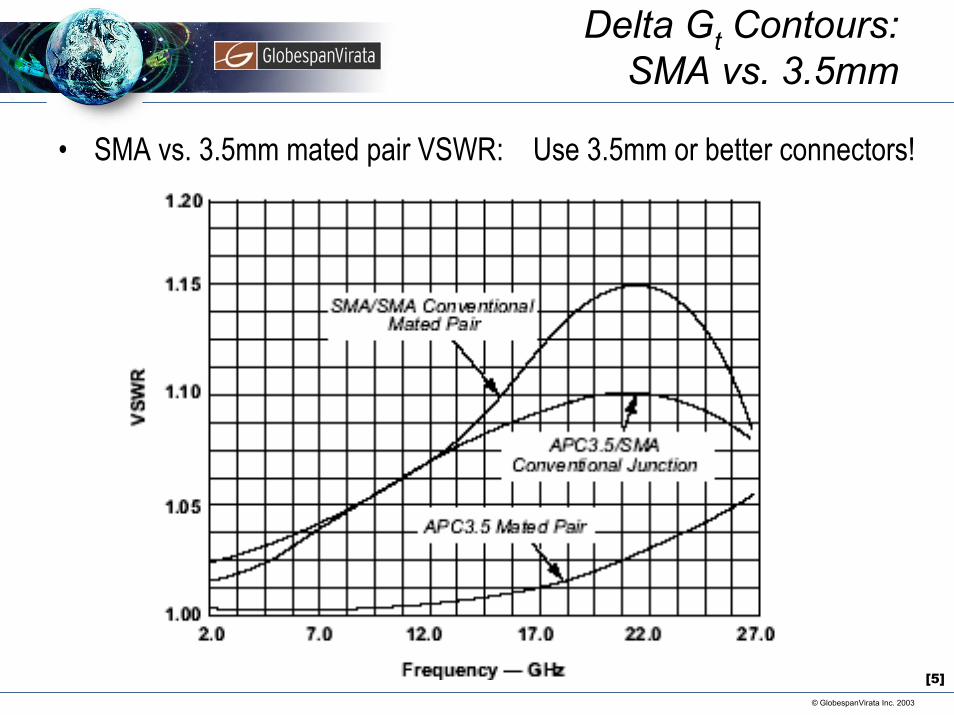
Delta Gt Contours: SMA vs. 3.5mm
• SMA vs. 3.5mm mated pair VSWR: Use 3.5mm or better connectors!
[5]
© GlobespanVirata Inc. 2003
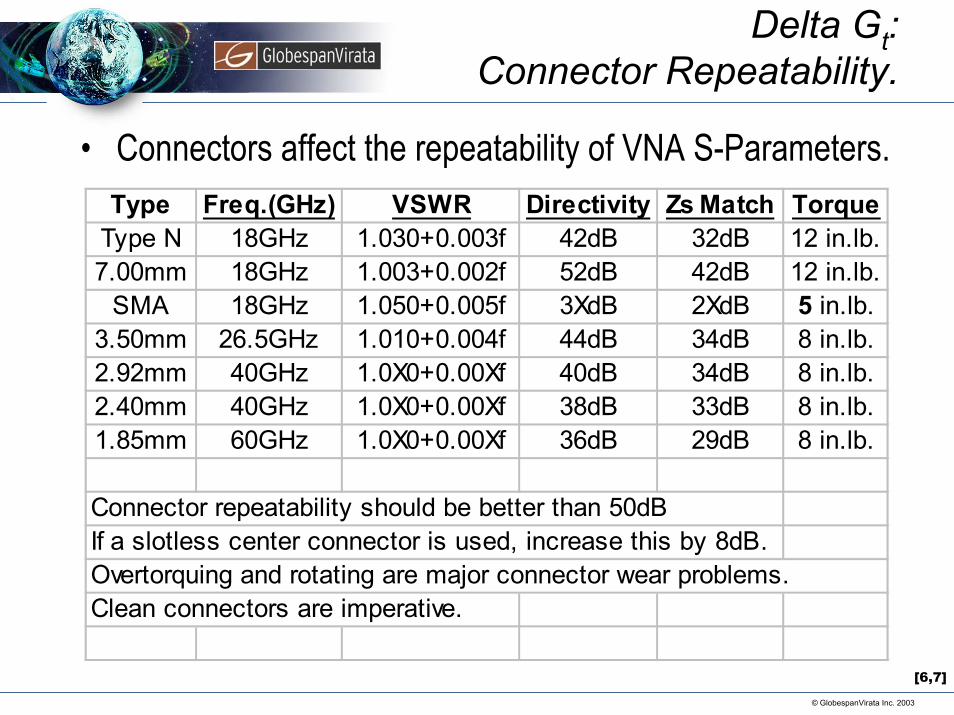
Delta Gt: Connector Repeatability.
• Connectors affect the repeatability of VNA S-Parameters.Type Freq.(GHz) VSWR Directivity Zs Match Torque
Type N 18GHz 1.030+0.003f 42dB 32dB 12 in.lb.7.00mm 18GHz 1.003+0.002f 52dB 42dB 12 in.lb.
SMA 18GHz 1.050+0.005f 3XdB 2XdB 5 in.lb.3.50mm 26.5GHz 1.010+0.004f 44dB 34dB 8 in.lb.2.92mm 40GHz 1.0X0+0.00Xf 40dB 34dB 8 in.lb.2.40mm 40GHz 1.0X0+0.00Xf 38dB 33dB 8 in.lb.1.85mm 60GHz 1.0X0+0.00Xf 36dB 29dB 8 in.lb.
Connector repeatability should be better than 50dBIf a slotless center connector is used, increase this by 8dB.Overtorquing and rotating are major connector wear problems.Clean connectors are imperative.
[6,7]
© GlobespanVirata Inc. 2003
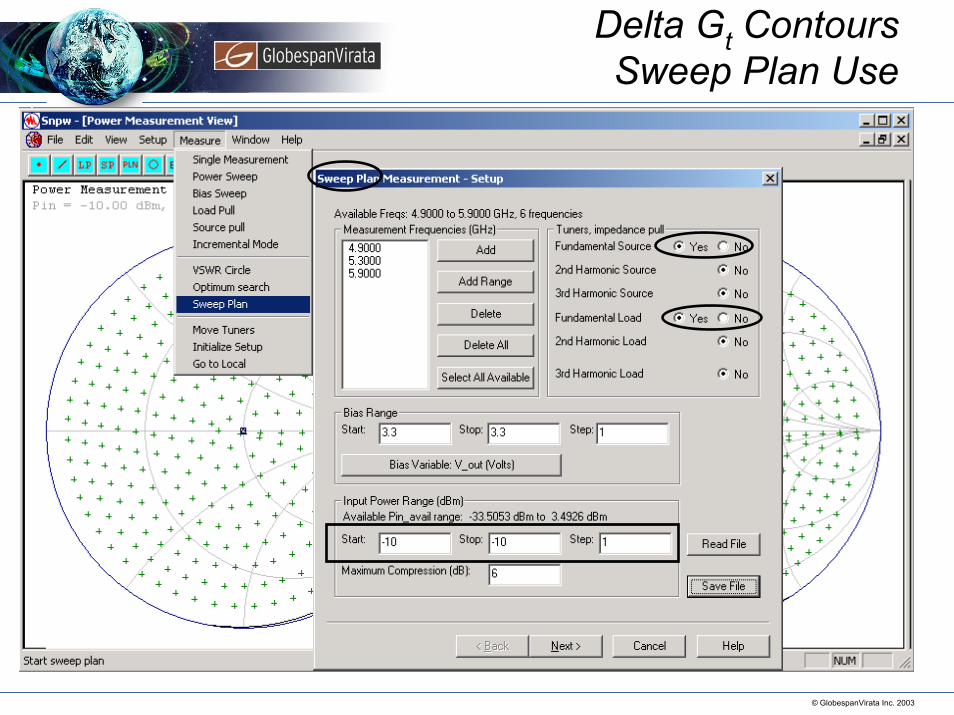
Delta Gt ContoursSweep Plan Use
© GlobespanVirata Inc. 2003
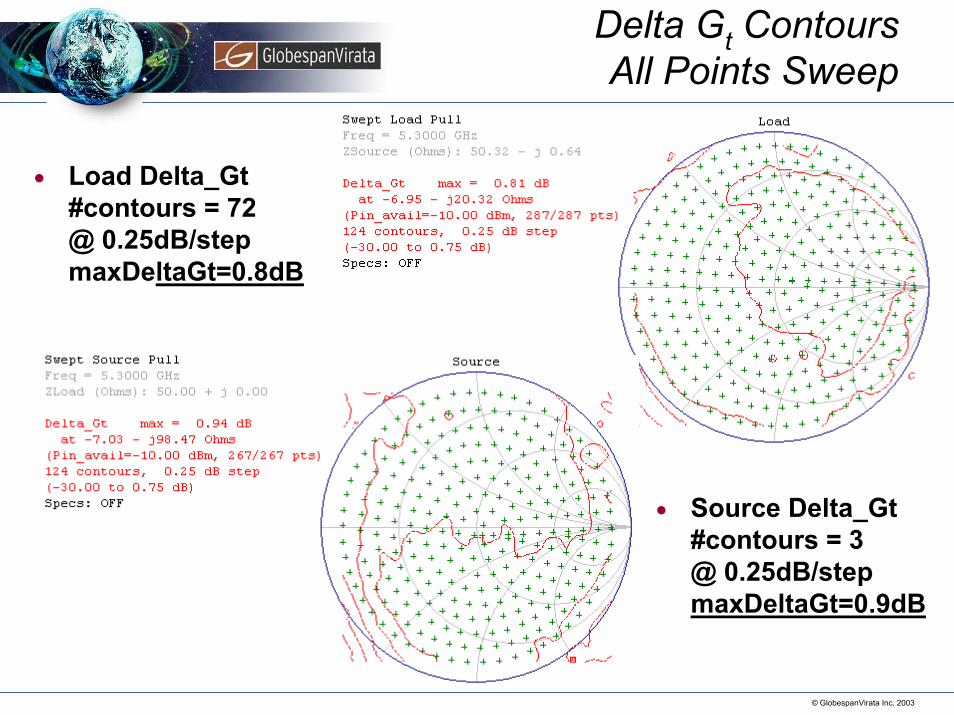
Delta Gt ContoursAll Points Sweep
n Source Delta_Gt #contours = 3 @ 0.25dB/step maxDeltaGt=0.9dB
n Load Delta_Gt #contours = 72 @ 0.25dB/step maxDeltaGt=0.8dB
© GlobespanVirata Inc. 2003
Summary & Conclusions
• Delta Gt verification tests should be run prior to any Load Pull.• Gt is the most appropriate gain parameter since it contains
both source and load matching terms.• S-Parameter characterizations are a major source of
uncertainty in the Delta Gt Load Pull system test.– Calibrations, connectors, and cables are very important.– Upgrading to new cables and connectors may be required.
• Contours are an easy way to view Delta Gt data.– Increase the number of contours to the 128 maximum– Select the Max or Min value to best display results.– Count the number of contours to get an estimate.– Select points at min & max area’s to determine values.
• Re-calibrate & Re-characterize to reduce errors <0.5dB.
© GlobespanVirata Inc. 2003
Delta Gt Contours
• References:1. Guillermo Gonzalez, "Microwave Transistor Amplifiers: Analysis and Design", pp183
Prentice Hall 1997 2. “Measurement of Large Signal Device Input Impedance During Load Pull
Applications”, Maury Microwave Application Note 5C-029 [www.MauryMW.com]3. Joel Dunsmore & Dennis Poulin, Personal Communications, Aug.~Sept. 2003.4. “Verifying the Performance of Vector Network Analyzers”,
Maury Microwave Application Note 5C-026 [www.MauryMW.com]5. “Improving SMA Tests with APC3.5 Hardware”,
Maury Microwave Application Note 5A-011 [www.MauryMW.com]6. “Microwave Coaxial Connector Technology: A Continuing Evolution”, Mario Maury
Microwave Journal, 1990 State of the Art Reference pg. 39~597. Connectors: www.amphenolrf.com, www.agilent.com, www.us.anritsu.com