page 1 trade demand forecast q3 2006 prepared by: group research & development (grd) september...
TRANSCRIPT
Page Page 11
Trade Demand Forecast
Q3 2006
Prepared by: Group Research & Development (GRD)
September 2006

Page Page 22
0.0 : Global Trade Index
1.0 : Transpacific Trade
2.0 : Asia Europe Trade
3.0 : Transatlantic Trade
4.0 : Latin America-North America Trade
5.0 : Intra Asia Trade
Table of Contents
Page Page 33
0.0 :Global Trade Index

Page Page 44
Global Trade Index
In line with the world economic growth, global trade growth is expected to be broadly unchanged at 10.3% in 2006, and moderate going into 2007.
Trade Route Weight (2005) 2003 2004 2005 2006f 2007f 2008F
Far East-Mideast 2.5% 19.6% 28.2% 11.9% 10.5% 9.2% 9.0%Mideast-Far East 1.1% 5.6% 21.7% 19.2% 17.3% 15.2% 13.0%Intra Far East and Australia 18.0% 11.5% 13.2% 9.9% 9.3% 9.1% 9.1%Far East-Ind Subcon 1.1% 16.4% 13.8% 9.7% 9.5% 9.4% 9.4%Ind Subcon-Far East 0.6% 4.4% 13.2% 9.7% 7.5% 7.5% 8.0%Asia Europe 12.8% 21.4% 16.5% 12.4% 12.3% 10.2% 9.5%TPEB 14.7% 8.7% 14.7% 13.4% 11.2% 8.7% 7.6%Europe Asia 4.0% 5.9% 14.1% 5.1% 5.7% 5.8% 5.0%TAWB 3.1% -0.1% 4.4% 2.7% 4.5% 3.9% 3.6%TPWB 5.0% 12.2% 5.8% 9.1% 5.3% 5.6% 4.8%TAEB 1.8% 8.4% 5.4% 4.1% 1.3% 3.0% 3.0%LTSB 1.7% 2.1% 11.4% 3.8% 0.4% 0.0% 2.0%LTNB 2.8% 16.5% 12.0% -0.2% -0.7% 2.2% 2.9%Global Trade Index 11.2% 13.5% 10.3% 10.6% 9.6% 8.9%Drewry Global Trade Growth (Jun 2006) 14.6% 14.7% 10.2% 10.5% 9.5% naClarkson Global Trade Growth (Sep 2006) 11.6% 13.4% 10.1% 10.5% 10.0% na

Page Page 55
1.0 : TRANSPACIFIC TRADE ROUTE
Page Page 66
TPEB
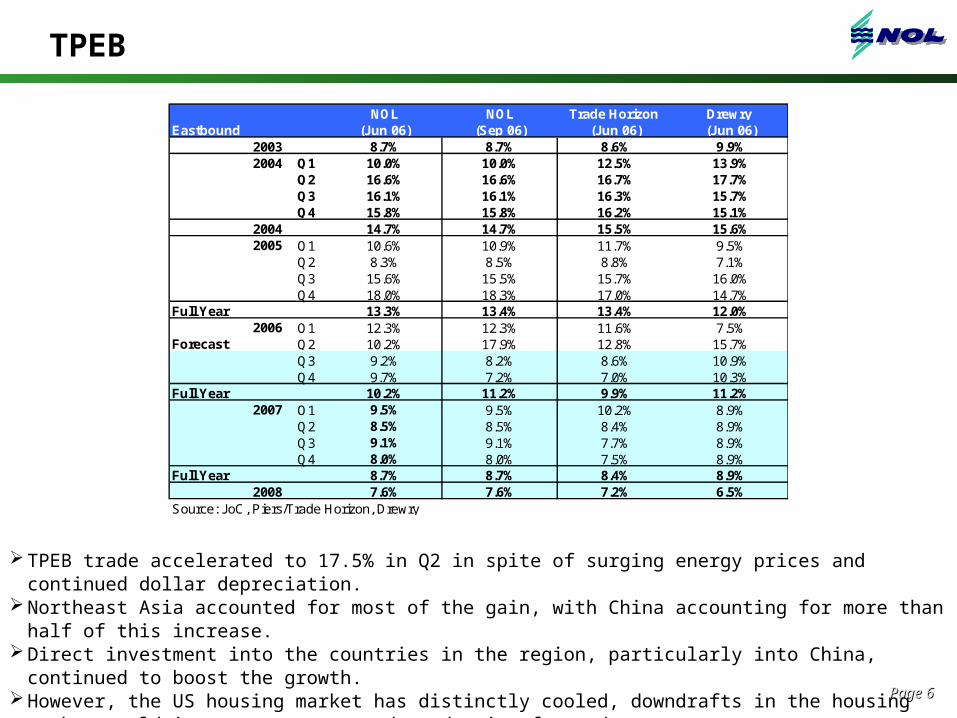
TPEB trade accelerated to 17.5% in Q2 in spite of surging energy prices and continued dollar depreciation.Northeast Asia accounted for most of the gain, with China accounting for more than half of this increase. Direct investment into the countries in the region, particularly into China, continued to boost the growth. However, the US housing market has distinctly cooled, downdrafts in the housing market could impact on
consumer demand going forward.
NOL NOL Trade Horizon Drewry Eastbound (Jun 06) (Sep 06) (Jun 06) (Jun 06)
2003 8.7% 8.7% 8.6% 9.9%2004 Q1 10.0% 10.0% 12.5% 13.9%
Q2 16.6% 16.6% 16.7% 17.7%Q3 16.1% 16.1% 16.3% 15.7%Q4 15.8% 15.8% 16.2% 15.1%
2004 14.7% 14.7% 15.5% 15.6%2005 Q1 10.6% 10.9% 11.7% 9.5%
Q2 8.3% 8.5% 8.8% 7.1%Q3 15.6% 15.5% 15.7% 16.0%Q4 18.0% 18.3% 17.0% 14.7%
Full Year 13.3% 13.4% 13.4% 12.0%2006 Q1 12.3% 12.3% 11.6% 7.5%
Forecast Q2 10.2% 17.9% 12.8% 15.7%Q3 9.2% 8.2% 8.6% 10.9%Q4 9.7% 7.2% 7.0% 10.3%
Full Year 10.2% 11.2% 9.9% 11.2%2007 Q1 9.5% 9.5% 10.2% 8.9%
Q2 8.5% 8.5% 8.4% 8.9%Q3 9.1% 9.1% 7.7% 8.9%Q4 8.0% 8.0% 7.5% 8.9%
Full Year 8.7% 8.7% 8.4% 8.9%2008 7.6% 7.6% 7.2% 6.5%
Source: JoC, Piers/Trade Horizon, Drewry
Page Page 77
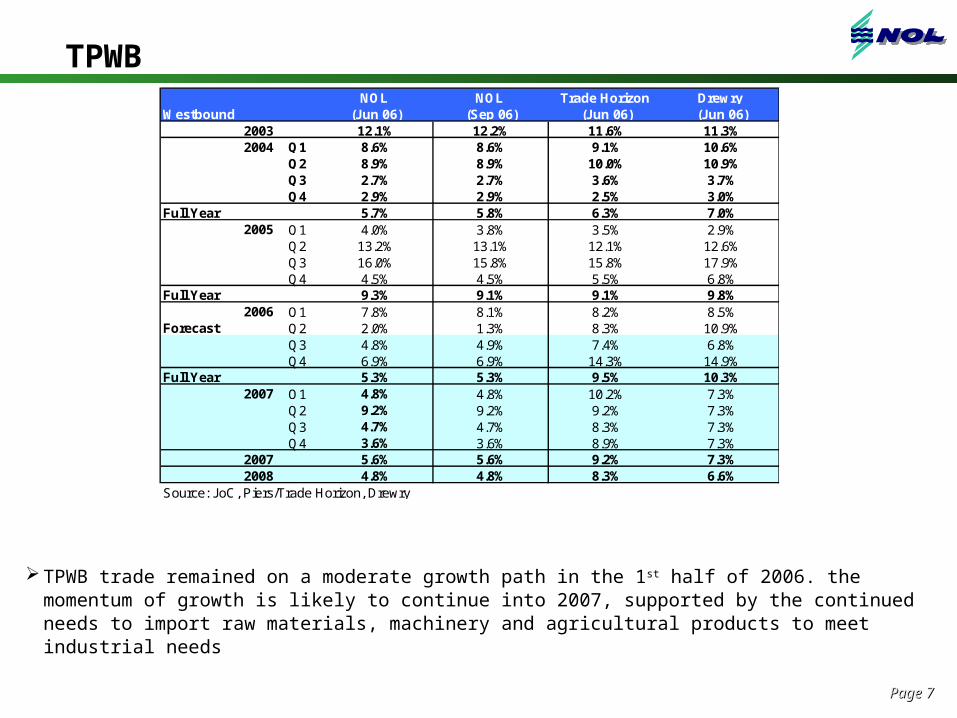
TPWB NOL NOL Trade Horizon Drewry
Westbound (Jun 06) (Sep 06) (Jun 06) (Jun 06)2003 12.1% 12.2% 11.6% 11.3%2004 Q1 8.6% 8.6% 9.1% 10.6%
Q2 8.9% 8.9% 10.0% 10.9%Q3 2.7% 2.7% 3.6% 3.7%Q4 2.9% 2.9% 2.5% 3.0%
Full Year 5.7% 5.8% 6.3% 7.0%2005 Q1 4.0% 3.8% 3.5% 2.9%
Q2 13.2% 13.1% 12.1% 12.6%Q3 16.0% 15.8% 15.8% 17.9%Q4 4.5% 4.5% 5.5% 6.8%
Full Year 9.3% 9.1% 9.1% 9.8%2006 Q1 7.8% 8.1% 8.2% 8.5%
Forecast Q2 2.0% 1.3% 8.3% 10.9%Q3 4.8% 4.9% 7.4% 6.8%Q4 6.9% 6.9% 14.3% 14.9%
Full Year 5.3% 5.3% 9.5% 10.3%2007 Q1 4.8% 4.8% 10.2% 7.3%
Q2 9.2% 9.2% 9.2% 7.3%Q3 4.7% 4.7% 8.3% 7.3%Q4 3.6% 3.6% 8.9% 7.3%
2007 5.6% 5.6% 9.2% 7.3%2008 4.8% 4.8% 8.3% 6.6%
Source: JoC, Piers/Trade Horizon, Drewry
TPWB trade remained on a moderate growth path in the 1st half of 2006. the momentum of growth is likely to continue into 2007, supported by the continued needs to import raw materials, machinery and agricultural products to meet industrial needs
Page Page 88
1.0 : ASIA EUROPE TRADE
Page Page 99
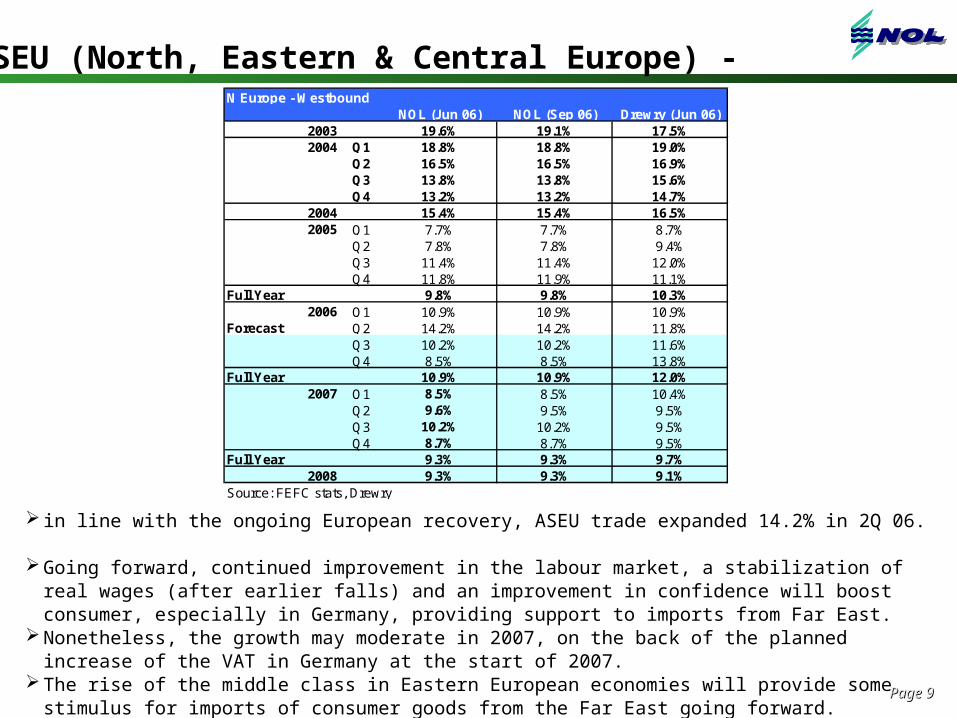
ASEU (North, Eastern & Central Europe) -
in line with the ongoing European recovery, ASEU trade expanded 14.2% in 2Q 06. Going forward, continued improvement in the labour market, a stabilization of real wages (after earlier falls)
and an improvement in confidence will boost consumer, especially in Germany, providing support to imports from Far East.
Nonetheless, the growth may moderate in 2007, on the back of the planned increase of the VAT in Germany at the start of 2007.
The rise of the middle class in Eastern European economies will provide some stimulus for imports of consumer goods from the Far East going forward.
N Europe - WestboundNOL (Jun 06) NOL (Sep 06) Drewry (Jun 06)
2003 19.6% 19.1% 17.5%2004 Q1 18.8% 18.8% 19.0%
Q2 16.5% 16.5% 16.9%Q3 13.8% 13.8% 15.6%Q4 13.2% 13.2% 14.7%
2004 15.4% 15.4% 16.5%2005 Q1 7.7% 7.7% 8.7%
Q2 7.8% 7.8% 9.4%Q3 11.4% 11.4% 12.0%Q4 11.8% 11.9% 11.1%
Full Year 9.8% 9.8% 10.3%2006 Q1 10.9% 10.9% 10.9%
Forecast Q2 14.2% 14.2% 11.8%Q3 10.2% 10.2% 11.6%Q4 8.5% 8.5% 13.8%
Full Year 10.9% 10.9% 12.0%2007 Q1 8.5% 8.5% 10.4%
Q2 9.6% 9.5% 9.5%Q3 10.2% 10.2% 9.5%Q4 8.7% 8.7% 9.5%
Full Year 9.3% 9.3% 9.7%2008 9.3% 9.3% 9.1%
Source: FEFC stats, Drewry

Page Page 1010
ASEU (Med)
Demand from Med Europe remained strong, propelled by strong double digit growth of France Med and emerging economies of Turkey and Ukraine while the 2 largest importers Italy and Spain Med grew only modestly.
In particular, Turkey is increasingly an important driving force of imports from Asia. GDP growth has been strong in Turkey since the 2001 crisis, fuelled by falling interest rates, strong consumer credit growth and investor confidence. In addition, improvements in productivity and lower unit labour costs have helped to bolster several of Turkey's export-oriented manufacturing sectors, hence also indirectly creating the demand for imported manufacturing inputs.
Med Europe - WestboundNOL (Mar 06) NOL (Sep 06) Drewry (Jun 06)
2003 29.3% 29.1% 19.4%2004 Q1 19.3% 19.3% na
Q2 25.7% 25.7% naQ3 16.0% 16.0% naQ4 18.4% 18.4% na
2004 19.8% 19.8% 20.0%2005 Q1 19.5% 19.5% 19.5%
Q2 23.5% 23.5% 26.2%Q3 19.4% 19.4% 19.7%Q4 18.8% 18.8% 20.6%
Full Year 20.3% 20.3% 21.6%2006 Q1 15.8% 15.8% 15.7%
Forecast Q2 17.5% 20.2% 19.7%Q3 15.3% 14.8% 19.7%Q4 16.2% 13.8% 19.6%
Full Year 16.2% 16.2% 18.8%2007 Q1 12.8% 12.8% -
Q2 10.0% 10.0% -Q3 15.2% 15.2% -Q4 13.1% 13.1% -
Full Year 12.7% 12.7% 15.6%2008 10.0% 10.0% 9.5%
Source: FEFC stats, Drewry
Page Page 1111
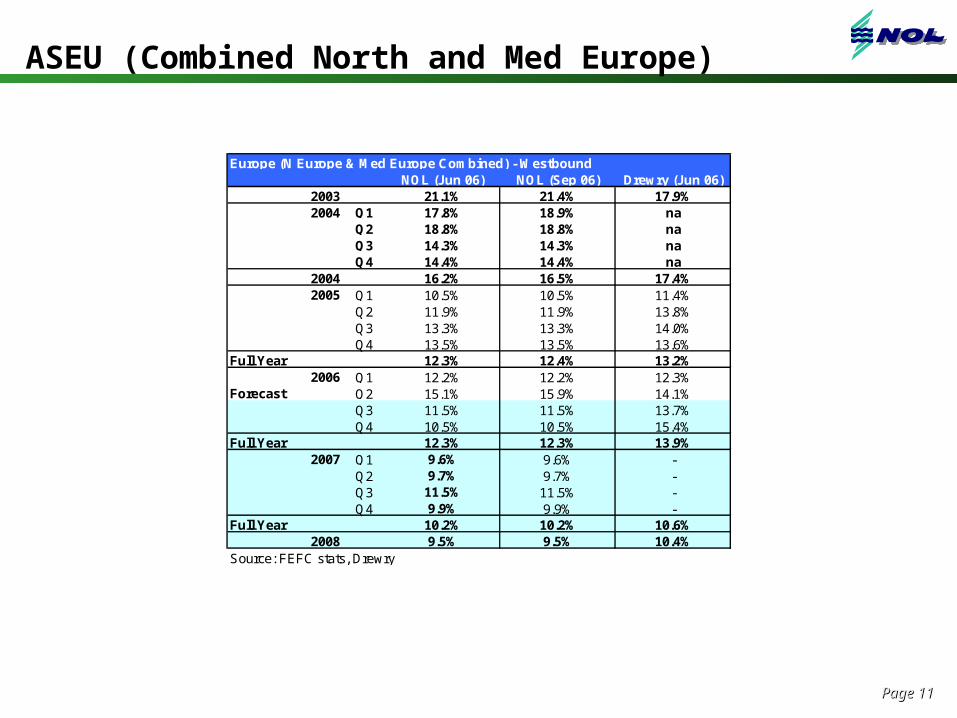
ASEU (Combined North and Med Europe)
Europe (N Europe & Med Europe Combined) - WestboundNOL (Jun 06) NOL (Sep 06) Drewry (Jun 06)
2003 21.1% 21.4% 17.9%2004 Q1 17.8% 18.9% na
Q2 18.8% 18.8% naQ3 14.3% 14.3% naQ4 14.4% 14.4% na
2004 16.2% 16.5% 17.4%2005 Q1 10.5% 10.5% 11.4%
Q2 11.9% 11.9% 13.8%Q3 13.3% 13.3% 14.0%Q4 13.5% 13.5% 13.6%
Full Year 12.3% 12.4% 13.2%2006 Q1 12.2% 12.2% 12.3%
Forecast Q2 15.1% 15.9% 14.1%Q3 11.5% 11.5% 13.7%Q4 10.5% 10.5% 15.4%
Full Year 12.3% 12.3% 13.9%2007 Q1 9.6% 9.6% -
Q2 9.7% 9.7% -Q3 11.5% 11.5% -Q4 9.9% 9.9% -
Full Year 10.2% 10.2% 10.6%2008 9.5% 9.5% 10.4%
Source: FEFC stats, Drewry
Page Page 1212
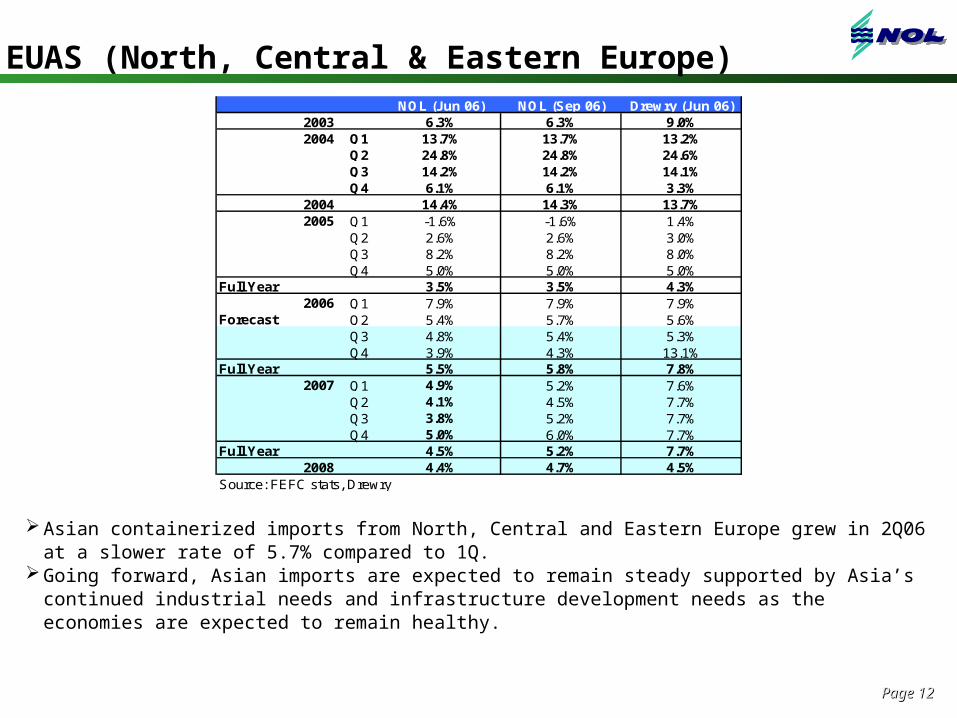
EUAS (North, Central & Eastern Europe)
Asian containerized imports from North, Central and Eastern Europe grew in 2Q06 at a slower rate of 5.7% compared to 1Q.
Going forward, Asian imports are expected to remain steady supported by Asia’s continued industrial needs and infrastructure development needs as the economies are expected to remain healthy.
NOL (Jun 06) NOL (Sep 06) Drewry (Jun 06)2003 6.3% 6.3% 9.0%2004 Q1 13.7% 13.7% 13.2%
Q2 24.8% 24.8% 24.6%Q3 14.2% 14.2% 14.1%Q4 6.1% 6.1% 3.3%
2004 14.4% 14.3% 13.7%2005 Q1 -1.6% -1.6% 1.4%
Q2 2.6% 2.6% 3.0%Q3 8.2% 8.2% 8.0%Q4 5.0% 5.0% 5.0%
Full Year 3.5% 3.5% 4.3%2006 Q1 7.9% 7.9% 7.9%
Forecast Q2 5.4% 5.7% 5.6%Q3 4.8% 5.4% 5.3%Q4 3.9% 4.3% 13.1%
Full Year 5.5% 5.8% 7.8%2007 Q1 4.9% 5.2% 7.6%
Q2 4.1% 4.5% 7.7%Q3 3.8% 5.2% 7.7%Q4 5.0% 6.0% 7.7%
Full Year 4.5% 5.2% 7.7%2008 4.4% 4.7% 4.5%
Source: FEFC stats, Drewry
Page Page 1313
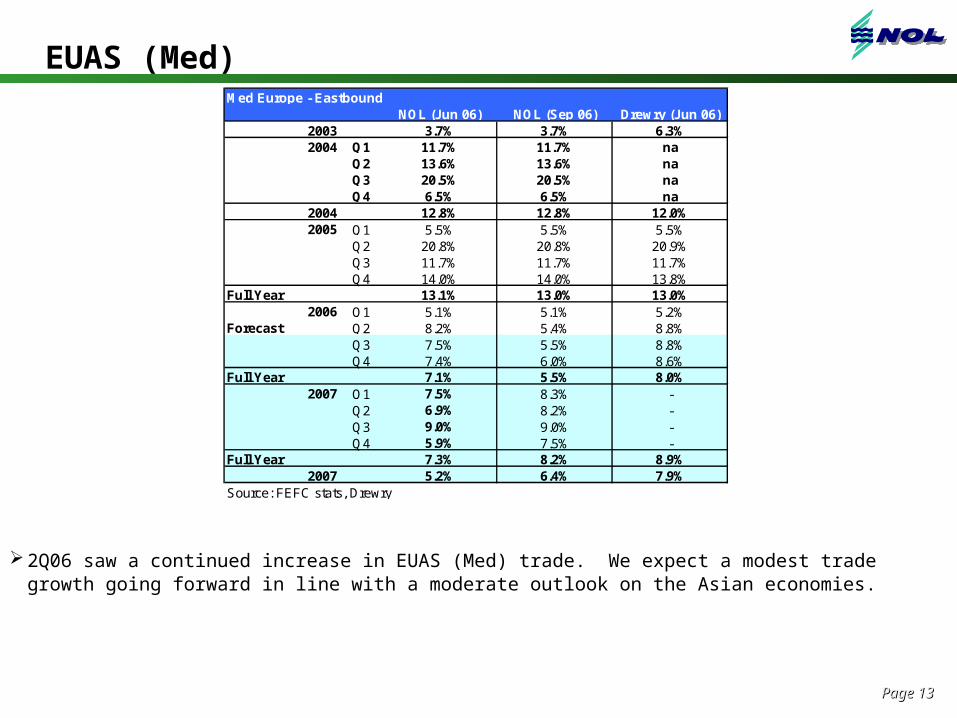
EUAS (Med)
2Q06 saw a continued increase in EUAS (Med) trade. We expect a modest trade growth going forward in line with a moderate outlook on the Asian economies.
Med Europe - EastboundNOL (Jun 06) NOL (Sep 06) Drewry (Jun 06)
2003 3.7% 3.7% 6.3%2004 Q1 11.7% 11.7% na
Q2 13.6% 13.6% naQ3 20.5% 20.5% naQ4 6.5% 6.5% na
2004 12.8% 12.8% 12.0%2005 Q1 5.5% 5.5% 5.5%
Q2 20.8% 20.8% 20.9%Q3 11.7% 11.7% 11.7%Q4 14.0% 14.0% 13.8%
Full Year 13.1% 13.0% 13.0%2006 Q1 5.1% 5.1% 5.2%
Forecast Q2 8.2% 5.4% 8.8%Q3 7.5% 5.5% 8.8%Q4 7.4% 6.0% 8.6%
Full Year 7.1% 5.5% 8.0%2007 Q1 7.5% 8.3% -
Q2 6.9% 8.2% -Q3 9.0% 9.0% -Q4 5.9% 7.5% -
Full Year 7.3% 8.2% 8.9%2007 5.2% 6.4% 7.9%
Source: FEFC stats, Drewry
Page Page 1414
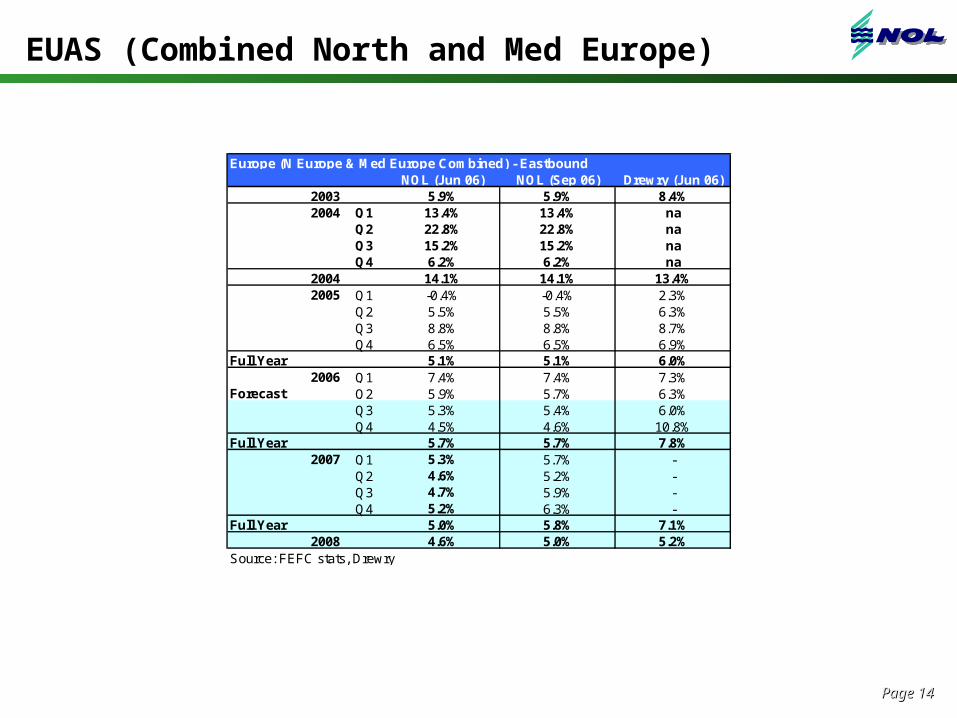
EUAS (Combined North and Med Europe)
Europe (N Europe & Med Europe Combined) - EastboundNOL (Jun 06) NOL (Sep 06) Drewry (Jun 06)
2003 5.9% 5.9% 8.4%2004 Q1 13.4% 13.4% na
Q2 22.8% 22.8% naQ3 15.2% 15.2% naQ4 6.2% 6.2% na
2004 14.1% 14.1% 13.4%2005 Q1 -0.4% -0.4% 2.3%
Q2 5.5% 5.5% 6.3%Q3 8.8% 8.8% 8.7%Q4 6.5% 6.5% 6.9%
Full Year 5.1% 5.1% 6.0%2006 Q1 7.4% 7.4% 7.3%
Forecast Q2 5.9% 5.7% 6.3%Q3 5.3% 5.4% 6.0%Q4 4.5% 4.6% 10.8%
Full Year 5.7% 5.7% 7.8%2007 Q1 5.3% 5.7% -
Q2 4.6% 5.2% -Q3 4.7% 5.9% -Q4 5.2% 6.3% -
Full Year 5.0% 5.8% 7.1%2008 4.6% 5.0% 5.2%
Source: FEFC stats, Drewry
Page Page 1515
3.0 : TRANSATLANTIC TRADE
Page Page 1616
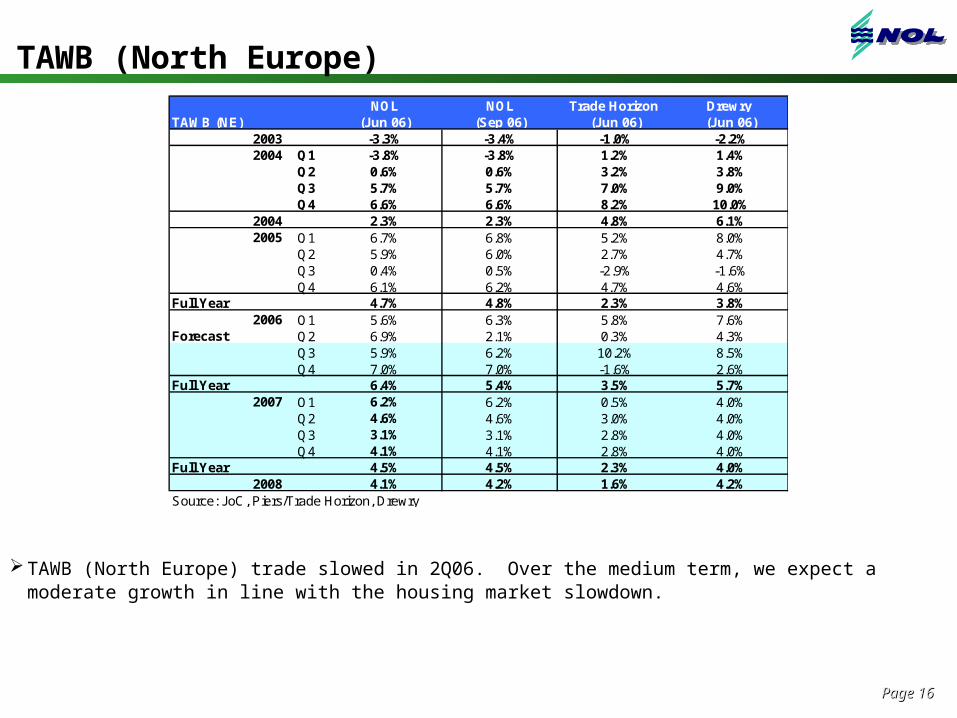
TAWB (North Europe)
TAWB (North Europe) trade slowed in 2Q06. Over the medium term, we expect a moderate growth in line with the housing market slowdown.
NOL NOL Trade Horizon Drewry TAWB (NE) (Jun 06) (Sep 06) (Jun 06) (Jun 06)
2003 -3.3% -3.4% -1.0% -2.2%2004 Q1 -3.8% -3.8% 1.2% 1.4%
Q2 0.6% 0.6% 3.2% 3.8%Q3 5.7% 5.7% 7.0% 9.0%Q4 6.6% 6.6% 8.2% 10.0%
2004 2.3% 2.3% 4.8% 6.1%2005 Q1 6.7% 6.8% 5.2% 8.0%
Q2 5.9% 6.0% 2.7% 4.7%Q3 0.4% 0.5% -2.9% -1.6%Q4 6.1% 6.2% 4.7% 4.6%
Full Year 4.7% 4.8% 2.3% 3.8%2006 Q1 5.6% 6.3% 5.8% 7.6%
Forecast Q2 6.9% 2.1% 0.3% 4.3%Q3 5.9% 6.2% 10.2% 8.5%Q4 7.0% 7.0% -1.6% 2.6%
Full Year 6.4% 5.4% 3.5% 5.7%2007 Q1 6.2% 6.2% 0.5% 4.0%
Q2 4.6% 4.6% 3.0% 4.0%Q3 3.1% 3.1% 2.8% 4.0%Q4 4.1% 4.1% 2.8% 4.0%
Full Year 4.5% 4.5% 2.3% 4.0%2008 4.1% 4.2% 1.6% 4.2%
Source: JoC, Piers/Trade Horizon, Drewry
Page Page 1717
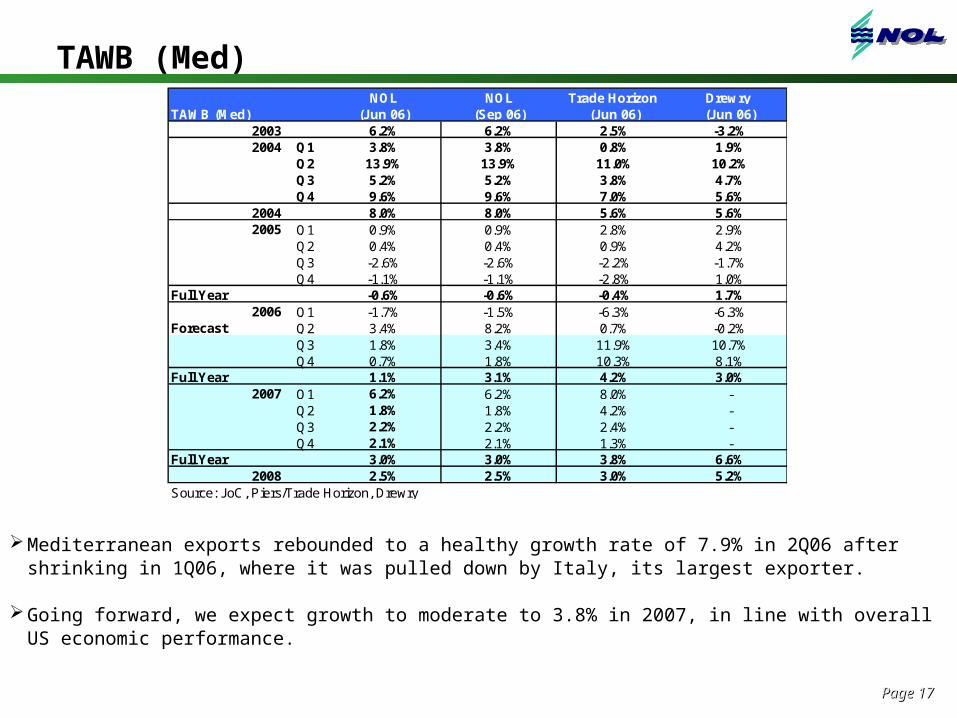
TAWB (Med)
Mediterranean exports rebounded to a healthy growth rate of 7.9% in 2Q06 after shrinking in 1Q06, where it was pulled down by Italy, its largest exporter.
Going forward, we expect growth to moderate to 3.8% in 2007, in line with overall US economic performance.
NOL NOL Trade Horizon Drewry TAWB (Med) (Jun 06) (Sep 06) (Jun 06) (Jun 06)
2003 6.2% 6.2% 2.5% -3.2%2004 Q1 3.8% 3.8% 0.8% 1.9%
Q2 13.9% 13.9% 11.0% 10.2%Q3 5.2% 5.2% 3.8% 4.7%Q4 9.6% 9.6% 7.0% 5.6%
2004 8.0% 8.0% 5.6% 5.6%2005 Q1 0.9% 0.9% 2.8% 2.9%
Q2 0.4% 0.4% 0.9% 4.2%Q3 -2.6% -2.6% -2.2% -1.7%Q4 -1.1% -1.1% -2.8% 1.0%
Full Year -0.6% -0.6% -0.4% 1.7%2006 Q1 -1.7% -1.5% -6.3% -6.3%
Forecast Q2 3.4% 8.2% 0.7% -0.2%Q3 1.8% 3.4% 11.9% 10.7%Q4 0.7% 1.8% 10.3% 8.1%
Full Year 1.1% 3.1% 4.2% 3.0%2007 Q1 6.2% 6.2% 8.0% -
Q2 1.8% 1.8% 4.2% -Q3 2.2% 2.2% 2.4% -Q4 2.1% 2.1% 1.3% -
Full Year 3.0% 3.0% 3.8% 6.6%2008 2.5% 2.5% 3.0% 5.2%
Source: JoC, Piers/Trade Horizon, Drewry
Page Page 1818
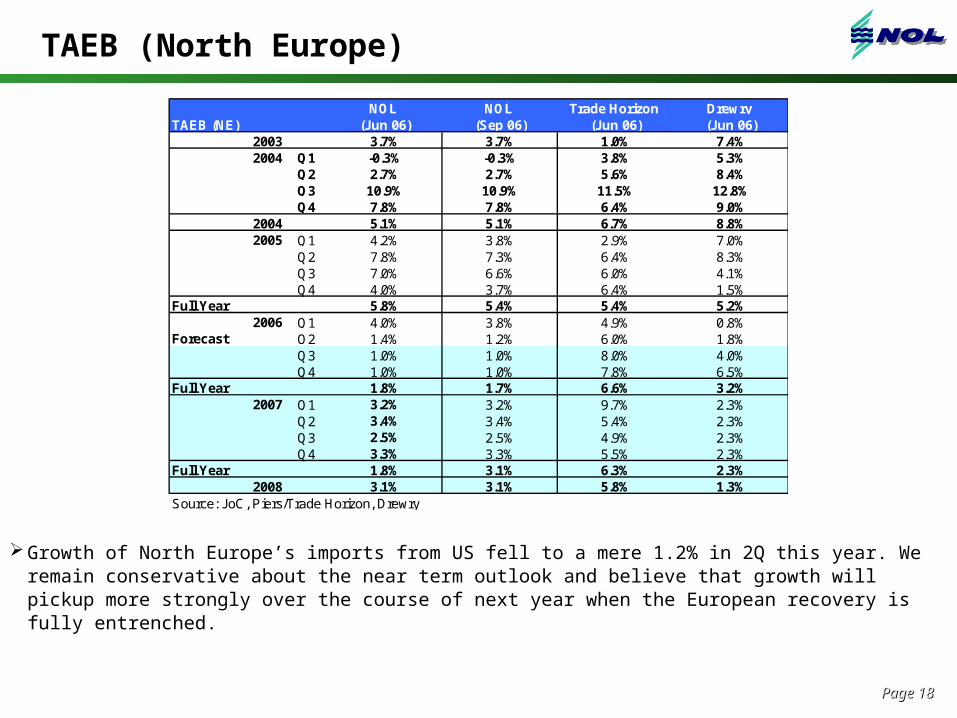
TAEB (North Europe)
Growth of North Europe’s imports from US fell to a mere 1.2% in 2Q this year. We remain conservative about the near term outlook and believe that growth will pickup more strongly over the course of next year when the European recovery is fully entrenched.
NOL NOL Trade Horizon Drewry TAEB (NE) (Jun 06) (Sep 06) (Jun 06) (Jun 06)
2003 3.7% 3.7% 1.0% 7.4%2004 Q1 -0.3% -0.3% 3.8% 5.3%
Q2 2.7% 2.7% 5.6% 8.4%Q3 10.9% 10.9% 11.5% 12.8%Q4 7.8% 7.8% 6.4% 9.0%
2004 5.1% 5.1% 6.7% 8.8%2005 Q1 4.2% 3.8% 2.9% 7.0%
Q2 7.8% 7.3% 6.4% 8.3%Q3 7.0% 6.6% 6.0% 4.1%Q4 4.0% 3.7% 6.4% 1.5%
Full Year 5.8% 5.4% 5.4% 5.2%2006 Q1 4.0% 3.8% 4.9% 0.8%
Forecast Q2 1.4% 1.2% 6.0% 1.8%Q3 1.0% 1.0% 8.0% 4.0%Q4 1.0% 1.0% 7.8% 6.5%
Full Year 1.8% 1.7% 6.6% 3.2%2007 Q1 3.2% 3.2% 9.7% 2.3%
Q2 3.4% 3.4% 5.4% 2.3%Q3 2.5% 2.5% 4.9% 2.3%Q4 3.3% 3.3% 5.5% 2.3%
Full Year 1.8% 3.1% 6.3% 2.3%2008 3.1% 3.1% 5.8% 1.3%
Source: JoC, Piers/Trade Horizon, Drewry
Page Page 1919
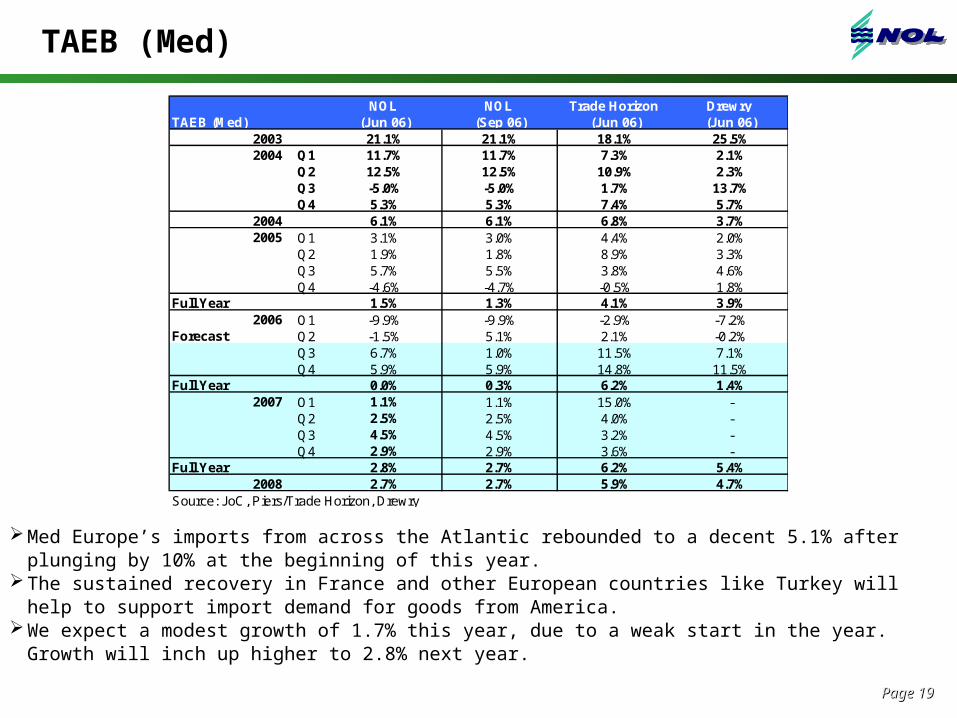
TAEB (Med)
Med Europe’s imports from across the Atlantic rebounded to a decent 5.1% after plunging by 10% at the beginning of this year.
The sustained recovery in France and other European countries like Turkey will help to support import demand for goods from America.
We expect a modest growth of 1.7% this year, due to a weak start in the year. Growth will inch up higher to 2.8% next year.
NOL NOL Trade Horizon Drewry TAEB (Med) (Jun 06) (Sep 06) (Jun 06) (Jun 06)
2003 21.1% 21.1% 18.1% 25.5%2004 Q1 11.7% 11.7% 7.3% 2.1%
Q2 12.5% 12.5% 10.9% 2.3%Q3 -5.0% -5.0% 1.7% 13.7%Q4 5.3% 5.3% 7.4% 5.7%
2004 6.1% 6.1% 6.8% 3.7%2005 Q1 3.1% 3.0% 4.4% 2.0%
Q2 1.9% 1.8% 8.9% 3.3%Q3 5.7% 5.5% 3.8% 4.6%Q4 -4.6% -4.7% -0.5% 1.8%
Full Year 1.5% 1.3% 4.1% 3.9%2006 Q1 -9.9% -9.9% -2.9% -7.2%
Forecast Q2 -1.5% 5.1% 2.1% -0.2%Q3 6.7% 1.0% 11.5% 7.1%Q4 5.9% 5.9% 14.8% 11.5%
Full Year 0.0% 0.3% 6.2% 1.4%2007 Q1 1.1% 1.1% 15.0% -
Q2 2.5% 2.5% 4.0% -Q3 4.5% 4.5% 3.2% -Q4 2.9% 2.9% 3.6% -
Full Year 2.8% 2.7% 6.2% 5.4%2008 2.7% 2.7% 5.9% 4.7%
Source: JoC, Piers/Trade Horizon, Drewry
Page Page 2020
4.0 : LATIN AMERICA-NORTH AMERICA TRADE
Page Page 2121
LTAM - done
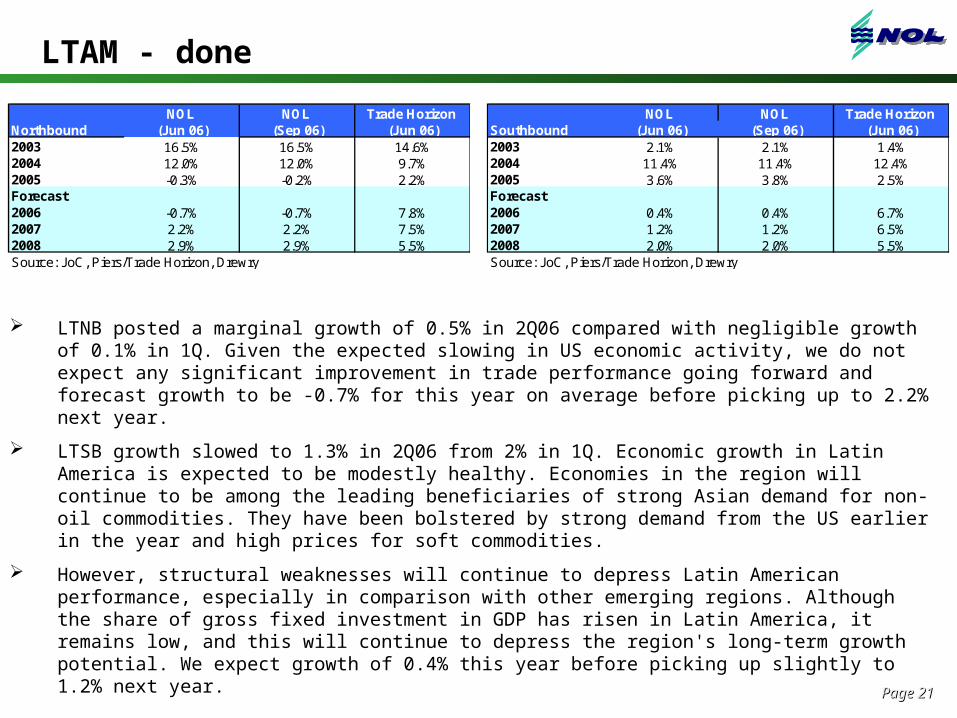
LTNB posted a marginal growth of 0.5% in 2Q06 compared with negligible growth of 0.1% in 1Q. Given the expected slowing in US economic activity, we do not expect any significant improvement in trade performance going forward and forecast growth to be -0.7% for this year on average before picking up to 2.2% next year.
LTSB growth slowed to 1.3% in 2Q06 from 2% in 1Q. Economic growth in Latin America is expected to be modestly healthy. Economies in the region will continue to be among the leading beneficiaries of strong Asian demand for non-oil commodities. They have been bolstered by strong demand from the US earlier in the year and high prices for soft commodities.
However, structural weaknesses will continue to depress Latin American performance, especially in comparison with other emerging regions. Although the share of gross fixed investment in GDP has risen in Latin America, it remains low, and this will continue to depress the region's long-term growth potential. We expect growth of 0.4% this year before picking up slightly to 1.2% next year.
NOL NOL Trade Horizon Southbound (Jun 06) (Sep 06) (Jun 06)2003 2.1% 2.1% 1.4%2004 11.4% 11.4% 12.4%2005 3.6% 3.8% 2.5%Forecast2006 0.4% 0.4% 6.7%2007 1.2% 1.2% 6.5%2008 2.0% 2.0% 5.5%Source: JoC, Piers/Trade Horizon, Drewry
NOL NOL Trade Horizon Northbound (Jun 06) (Sep 06) (Jun 06)2003 16.5% 16.5% 14.6%2004 12.0% 12.0% 9.7%2005 -0.3% -0.2% 2.2%Forecast2006 -0.7% -0.7% 7.8%2007 2.2% 2.2% 7.5%2008 2.9% 2.9% 5.5%Source: JoC, Piers/Trade Horizon, Drewry
Page Page 2222
5.0 : INTRA ASIA TRADE
Page Page 2323
INTRA-ASIA
Source: Far East/Mid East are based on Conf Stats, Intra Far East and Far East/Indian Subcon based on Global Insight
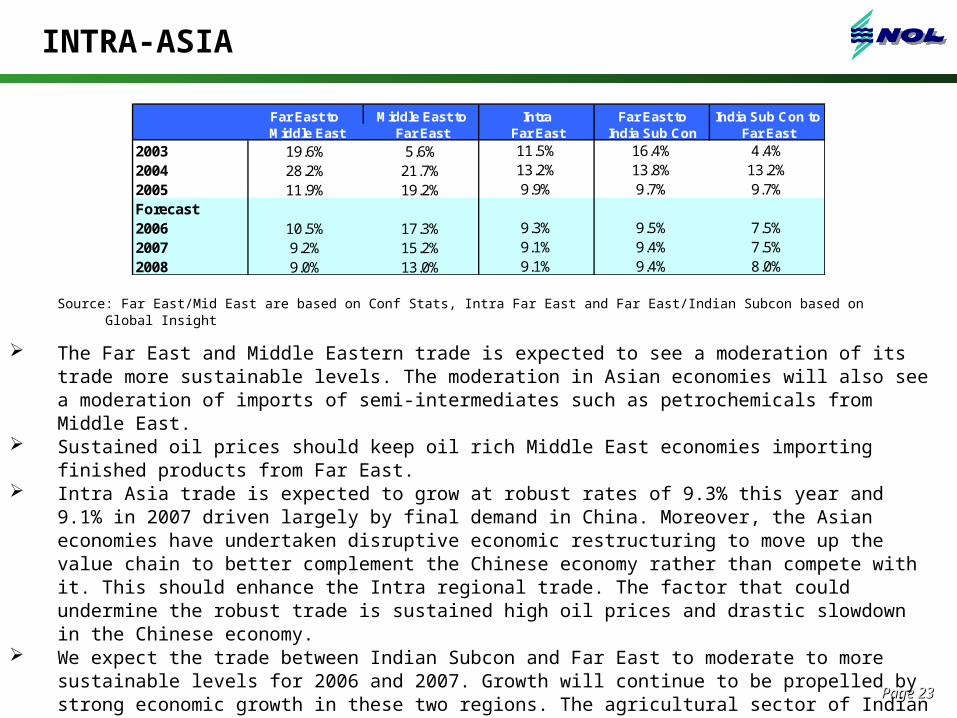
The Far East and Middle Eastern trade is expected to see a moderation of its trade more sustainable levels. The moderation in Asian economies will also see a moderation of imports of semi-intermediates such as petrochemicals from Middle East.
Sustained oil prices should keep oil rich Middle East economies importing finished products from Far East.
Intra Asia trade is expected to grow at robust rates of 9.3% this year and 9.1% in 2007 driven largely by final demand in China. Moreover, the Asian economies have undertaken disruptive economic restructuring to move up the value chain to better complement the Chinese economy rather than compete with it. This should enhance the Intra regional trade. The factor that could undermine the robust trade is sustained high oil prices and drastic slowdown in the Chinese economy.
We expect the trade between Indian Subcon and Far East to moderate to more sustainable levels for 2006 and 2007. Growth will continue to be propelled by strong economic growth in these two regions. The agricultural sector of Indian Subcon should do well and would support private consumption.
Far East to Middle East to Intra Far East to India Sub Con toMiddle East Far East Far East India Sub Con Far East
2003 19.6% 5.6% 11.5% 16.4% 4.4%2004 28.2% 21.7% 13.2% 13.8% 13.2%2005 11.9% 19.2% 9.9% 9.7% 9.7%Forecast2006 10.5% 17.3% 9.3% 9.5% 7.5%2007 9.2% 15.2% 9.1% 9.4% 7.5%2008 9.0% 13.0% 9.1% 9.4% 8.0%