participatory assessment of development · padev working paper no. w.2013.3 february 2013 this...
TRANSCRIPT

Participatory Assessment of Development http://www.padev.nl
DABOYA WORKSHOP REPORT
Ton Dietz
PAD Working Paper No. W.2013.3

2
Participatory Assessment of Development http://www.padev.nl
DABOYA WORKSHOP REPORT
Ton Dietz
PADev Working Paper No. W.2013.3
February 2013
This working paper reports on a participatory, holistic evaluation of development initiatives during a three-day
workshop in Daboya (Northern Region, Ghana). The workshop took place from 23-25 January 2010, and was
organised in the framework of the ‘Participatory Assessment of Development’ project. In this project the
University of Amsterdam (UvA, Netherlands), the University for Development Studies (UDS, Ghana), Expertise
pour le Développement du Sahel (EDS, Burkina Faso), ICCO, Woord en Daad and Prisma, together with the
Royal Tropical Institute in Amsterdam and the African Studies Centre Leiden (all in The Netherlands) carry out
a participatory and holistic evaluation of development interventions in Northern Ghana and Southern Burkina
Faso. For more information about the objectives and methodology of this project, see http://www.padev.nl.
Daboya workshop team leaders:
Dr. Francis Obeng (UDS): [email protected]
Prof. Dr Ton Dietz (UvA): [email protected]
Other team members: Mamudu Akudugu, Anika Altaf, Genevieve Audit-Bélanger, Frederick Bebelleh, Samuel
Bonye, Roger Bymolt, Kees van der Geest, Dieneke de Groot, Christy Kansangbata, Agnieszka Kazimierczuk,
David Millar, Nicky Pouw, Conrad Weobong, and Richard Yeboah.
Reference:
Dietz T. (2013). Participatory Assessment of Development: Daboya Workshop Report, PADev Working Paper
No. W.2013.3. Amsterdam: AISSR.
Author’s contact: [email protected]; [email protected]
Cover photograph by Fred Zaal
University of Amsterdam c/o Prof. Dr. Ton Dietz
Nieuwe Prinsengracht 130
1018VZ Amsterdam
The Netherlands
University for Development Studies c/o Dr. Francis Obeng
P.O. Box 1350 Tamale
Ghana
Expertise pour le Développement du Sahel
c/o Adama Belemvire
BP 5385 Ouagadougou
Burkina Faso
ICCO c/o Dieneke de Groot
Postbus 8190
3503 RD Utrecht
The Netherlands
Woord & Daad c/o Wouter Rijneveld
Postbus 560
4200 AN Gorinchem
The Netherlands
Prisma c/o Henk Jochemsen
Randhoeve 227 A
3995 GA Houten
The Netherlands
Royal Tropical Institute c/o Fred Zaal
Mauritskade 63
1092 AD Amsterdam
The Netherlands
African Studies Centre c/o Prof. Dr. Ton Dietz
PO Box 9555
2300 RB Leiden
The Netherlands

3
Table of contents
Summary 5
1. Introduction: the workshop in Daboya 7
2. Timeline: perceptions about local history and important events 11
3. Trends in capabilities: perceptions of change 18
4. A history of development interventions 34
5. Analysis of interventions by agency, sector and impact 41
6. Attribution of change to interventions 55
7. Best and worst projects 63
8. Perceptions of wealth and poverty 80
9. The impact of initiatives on wealth and poverty 90
10. Assessment of good and bad agencies 100
Appendix 1: Daboya workshop, 23-25 January 2010, List of participants 104
Appendix 2: Chronological list of interventions in the Daboya area 107
List of figures, tables and graphs
Figure 1.1 Map of Ghana showing the research area 8
Figure 1.2 Map of Northern Region, showing Tamale and Daboya 9
Figure 1.3 Detailed map of the Daboya area 10
Table 3.1 Perceptions about positive and negative changes in natural
capabilities 18
Table 3.2 Perceptions about positive and negative changes in physical
capabilities 20
Table 3.3 Perceptions about positive and negative changes in human
capabilities 22
Table 3.4 Perceptions about positive and negative changes in economic
capital 24
Table 3.5 Perceptions about changes in social and political capabilities 26
Table 3.6 Perceptions about positive and negative changes in cultural
capabilities 28
Table 3.7 Opinions about positive and negative change per domain by
workshop groups 32
Table 4.1 Workshop Groups and projects mentioned, with overlap 34
Table 4.2 Agencies active in Daboya’s development history, 1930-
2010 35
Table 4.3 Number of interventions by agency and decade 38
Table 4.4 Number of interventions by sector and decade 39
Table 4.5 Proportion of interventions by sector and decade 40
Table 5.1 Number of interventions per agency type (solo and in
partnership) 41
Table 5.2 Number of projects per sector 42
Table 5.3 Project impact judgments 43
Table 5.4 Project impact on domains 43
Table 5.5 Impact judgment per agency type 44
Table 5.6 Judgements per sector 45
Table 5.7 Number of intervening agencies per sector 50
Table 5.8 Proportion of sector involvement per agency 50

4
Table 5.9 Proportion of intervening agencies per sector 51
Table 5.10 Impact on domains, scores per sector (frequencies) 52
Table 5.11 Proportion of impact on domains, scores per sector (%) 53
Table 6.1 Summary of changes by domain 55
Table 6.2 Attribution of positive changes to agencies’ interventions 57
Table 6.3 Linking negative changes to agencies’ interventions and
ideas about mitigation by agencies 59
Table 7.1 Best projects 63
Table 7.2 Worst projects 71
Table 7.3 Best projects, according to five PADev groups in Daboya 76
Table 7.4 Worst projects, according to five PADev groups in Daboya 77
Table 7.5 Best, worst and other projects, by type of agency 78
Table 8.1 Local perceptions of the characteristics of five wealth
categories 81
Table 8.2 Summary of findings on wealth and poverty criteria 87
Table 8.3 Perception of wealth group distribution in the participants’
communities 89
Table 9.1 Impact of ‘best initiatives’ on five wealth categories,
percentages 90
Graph 9.1 Perceived distribution of best development initiatives
between wealth groups, compared with their perceived
distribution in the population of Daboya 91
Graph 9.2 Perceived impact of best initiatives between wealth groups
according to five different workshop groups in Daboya 92
Graph 9.3 Different assessment of ‘best projects in farming support’ 94
Table 9.2 Stinking toilets, percentages for wealth groups ‘hit most’ 95
Table 9.3 Bad roads, bad culverts, damaged bridge, percentages for
wealth groups ‘hit most’ 96
Table 9.4 Failed or unwanted livestock innovations 97
Table 9.5 Badly functioning local governance agencies 97
Table 9.6 Failed commercial projects 98
Graph 9.4 Negative impacts of development interventions in Daboya 99
Table 10.1 Opinions about the behaviour of the people involved in the
government clinic projects 100
Table 10.2 Opinion of the women about the behaviour of the agencies
involved in education in Daboya 101
Table 10.3 Opinions about the behaviour of the government with regard
to maintenance of the road infrastructure 102
Table 10.4 Opinions of the peasants around Daboya about the cassava
project of the Ministry of Agriculture 103

5
~0~ Summary
With the method developed for participatory assessment of development (PADev; see
www.padev.nl) local people in developing countries can write the development
histories of their own local areas. For the development of this method of self-
evaluation the PADev team included areas that were regarded as relatively neglected;
areas where, as far as our informants knew, also hardly any Dutch development
assistance has ever taken place. Daboya was one of three of these ‘neglected’ areas. In
January 2010 a team of PADev facilitators came to Daboya to work with about fifty
local people during a three-day workshop. The raw information that was collected can
be found on www.padev.nl. This report gives a detailed interpretation of these data.
Daboya is located in Northern Region in Ghana. In the distant past it used to be an
important trading centre, a.o. for salt. Also it was and is known for its artisans,
making smocks, traditional clothing in Northern Ghana. In the 1960s the area used to
be connected to Tamale in the East via a bridge across the White Volta river, but that
bridge collapsed in the early 1970s and was never repaired. Most people cross the
river by canoe nowadays. Those who want to visit the area by car have to make a
wide and difficult detour. People in Daboya generally feel neglected indeed.
However, it is not at all true that ‘nothing ever happens’ in the Daboya area, as
Tamale-based people seem to think. In Chapter 2 a long list of events could be
presented, as remembered by the workshop participants, while in Chapter 3 many
changes were reported during the last thirty years in their natural and physical
environment, in the human resources available in the area, and in the economic,
social-political and cultural realms. In Daboya among the many different changes
reported slightly more than half were seen as beneficial; and slightly less than half as
negative changes. People were particularly worried about the many negative changes
in the natural environment, mostly related to the farming impacts of population
growth.
As reported in Chapter 4 five workshop groups (which we called ‘local leaders’,
‘artisans’, ‘women’, ‘officials’ and ‘villagers/peasants’) together remembered 181
different ‘development initiatives’ which were meant to improve the lives of the
people in Daboya and surroundings. Half of these initiatives (the participants often
speak in terms of ‘projects’) were initiated by a variety of government agencies
funded by the Government of Ghana. People added specific ‘projects’ supported by
multilateral and bilateral development agencies from Europe and North America. A
quarter of all initiatives were supported by Christian organisations (churches of
various denominations and their NGOs and often foreign sponsors). Most of these
were focused on a few Christian enclaves (like a small centre called Lingbinsi) but not
exclusively. From the 1990s onwards also Muslim organisations started to give
development and cultural assistance (the population of Daboya Centre and most
villages around mostly adheres to various forms of Islam). Also non-faith based
NGOs came to the area, particularly in the wake of flood disasters. And very recently
a few telecom companies came to Daboya, which changed life considerably. During
the last few years workshop participants saw a ‘hybridisation’ taking place,
intermingling of various types of development agencies working together

6
(‘partnerships’), and they also mentioned a larger number of people’s own
development-oriented efforts.
Before 1990 initiatives seem to have been restricted to education and road
infrastructure (and the last one not so successfully); later also crop development,
water development and health care became important areas for external involvement.
Chapter 5 shows the assessment of workshop participants of all 181 different
initiatives. Two-thirds were very much appreciated (judged as ‘very positive’) and
only a few were seen as having had a negative or even very negative impact. Almost
all those were initiatives under the responsibility of the government. The impact of
initiatives was perceived to have been most pronounced in the realms of human,
economic, and socio-political capabilities and less so in the realms of the natural
environment and cultural behaviour. Most of the positive changes that had earlier
been mentioned in the domain of the natural and physical environment were attributed
(chapter 6) to specific ‘projects’ by mostly government agencies (although a lot more
could have been done; and here was also quite some criticism and negative
judgement). For the changes in the economic domain people mentioned a variety of
initiators, but often also from among them. Changes in the human capabilities were
result of government and Christian as well as other NGOs, while changes in the
cultural domain were very much attributed to the churches and mosques in the area
and their foreign supporters. For the changes in the political and social domains more
diffuse influences were mentioned.
In chapter 7 the assessment was presented of the initiatives/projects that the five
groups of workshop participants had liked and disliked most. Often they used a rather
generic grouping of initiatives, whereby the health clinic stood out as often mentioned
to be the most important ‘best initiative’ (despite many critical notes), and also water
projects (boreholes mostly) were often regarded as positive initiatives. The bad
conditions of the roads, of some buildings, and of the toilet facilities in Daboya Centre
were often mentioned as among the worst initiatives, while the peasants around
Daboya were very critical about some of the crop development initiatives.
In chapter 8 a detailed story was told about the people’s assessment of wealth and
poverty in the area, and in chapter 9 the distribution of the benefits of
projects/initiatives was given across wealth categories. In chapter 10 people were
asked to judge some agencies on a number of process characteristics, and in fact it is a
judgement about the behaviour of the agencies’ functionaries active in the Daboya
area. An important finding of the study is the fact that the general perception of the
workshop participants was that the (very) rich had benefited disproportionally and the
(very) poor much less so. But there were remarkable differences between the
‘common people’ (the groups of artisans, women and peasants) and the area’s elites
(the local leaders and the salaried officials). The last ones had a more rosy assessment
of the importance and the impact of development initiatives on the (very) poor.

7
~1~ Introduction: the workshop in Daboya
Daboya is a semi-urban locality in the Gonja area of Northern Region of Ghana (see
figure 1.1), between the regional capital Tamale in the East and the district centre
Damongo in the West. The distance to Damongo is about 80 kilometres, via a small
place called Busunu, and using a road that is very difficult during the rainy season.
The distance to Tamale is seventy kilometres, but travellers then have to cross the
White Volta river, immediately East of Daboya, by canoe. Trucks and cars going to
Daboya by road have to make a detour, via Yapei and Busunu, a distance of 130 km
(see figure 1.2). Daboya Centre is about two kilometres west of the river and another
seven kilometres in west-north-west direction an important village (Lingbinsi) was
established in the 1950s, settling people from the western and southern parts of
Northern Region, who had lived in the north-eastern part of Northern Region, in a
place called Langbensi for some time, but who no longer felt welcome there, after
they had expressed their wish to get their own Chief.
In scientific circles the Daboya area received some attention during the late 1970 and
1980s, when a team of archaeologists from the University of Calgary, in Canada, did
fieldwork and published some work about the iron-age history of the area (see Kense
1981, Gavua 1985 and Shinnie & Kense 1989)1. There was also some scientific
attention for Daboya because of its old tradition of artisanal weaving, that still is
important today. In 1982 Goody published a chapter about the Daboya weavers in a
book about the ethnography of proto-industrial cloth production2. Daboya also
received some attention because of its ancient position as a trade hub for salt, as
described in a book by Dickson (1966)3. In1981 Sutton described the competition of
this age-old local semi-industrial activity with coastal salt, transported by using the
Volta River upstream4. In 1996 a Ghanaian scholar, S. Yakubu, published an analysis
of the electoral behaviour in the Damongo-Daboya electoral constituency5
However, otherwise the marginalized position of Daboya in Ghana’s economy was
also reflected in the attention for this part of Ghana among foreign and Ghanaian
scientists. In fact we selected Daboya as an example of a ‘forgotten area’. In Tamale it
was regarded as an area ‘without development activities’. That was partly also related
to the fact that Daboya itself had a very dominant muslim culture, although the nearby
village of Lingbinsi was dominated by a Catholic church. That village (and six others
1 See F.J. Kense, 1981, Daboya, a Gonja frontier. University of Calgary: PhD thesis; K.K.B. Gavua,
1985, Daboya and the Kintampo culture of Ghana. University of Calgary: M.A. thesis.and Shinnie P.L.
& F. Kense, 1989, Archaeology of Gonja, Ghana, excavations in Daboya. Calgary: University of
Calgary Press. 2 See Goody, E.N., 1982, Daboya weavers: relations of production, dependence and reciprocity. In:
Goody, E.N., (ed.) From craft to industry. The ethnography of proto-industrial cloth production.
Cambridge: Cambridge University Press. 3 K.B. Dickson, 1966, Trade patterns in Ghana at the beginning of the eighteenth Century.
Geographical Review, Vol. 56, no 3, pp 417-431. 4 Sutton, I.B., The Volta river salt trade: the survival of an indigenous industry. The Journal of African
History, Vol. 22, pp. 43-61. 5 See Yakubu, S., 1996, The 1996 general elections in Ghana analysis. Electoral survey of the Bole-
Bamboi and Damongo-Daboya constituencies of Northern Ghana.

8
in the Daboya sub-district) was mentioned once in a scientific publication: in 1996-
1999 it had participated in a study done by the World Health Organization (and an
international NGO, with their headquarters in Germany, called Christoffel
Blindenmission) about the use of community volunteers for the prevention of
trachoma blindness (the volunteers earlier participated in guinea worm disease control
in the area)6. According to this WHO publication the Daboya subdistrict had 54
villages in 1996, that “were estimated to accommodate some 28 714 people (..). Most
live in traditional family compounds, surviving primarily by subsistence farming. The
subdistrict is serviced by a single health clinic staffed by two medical assistants, a
disease control officer, and a midwife. There are two ophthalmic nurses based in
Damongo Hospital, the main health care facility for the West Gonja district”
Figure 1.1: Map of Ghana showing the research area
6 Solomon, A.W., 2001, Pilot study of the use of community volunteers to distribute azithromycin for
trachoma control in Ghana. Bulletin for the World Health Organization, Vol. 79, pp. 8-14. A baseline
report was: Akudibillah J, Abugri P, McCurry J., 1996, A ‘‘quick and dirty’’ survey of trachoma
prevalence in the Daboya sub-district of West Gonja district, Northern Region, Ghana. Bawku, Ghana,
Christoffel Blindenmission, (unpublished document).

9
Figure 1.2 Map of Northern Region, showing Tamale and Daboya
<W > E.
0---------------------------80--------------------------160 Km.
Source: part of KLM-Shell A Guide map of Accra and road map of Ghana, Survey of Ghana, Accra, 1:
1,000,000 map, 1994 edition.

10
Figure 1.3 Detailed map of the Daboya area
<W. > E.
0------------10------------20------------30------------40-----------50 Km.
Source: Survey of Ghana, Accra, 1: 500,000; 1994 (8
th edition),part of Northwest Sheet.
Daboya Workshop Programme, 23-25 January, 2010
Day 1: (participants divided by gender and age; plus ‘officials’)
• Timeline exercise
• Changes in domains
• Wealth groups
Day 2: (participants divided in five groups: officials (O), male local leaders (L; chiefs,
shopkeepers, farmers), male artisans (A), women (W) and people from villages
around Daboya centre, including Lingbinsi; V)
• List of projects
• Selection of five best and worst projects
• Historical analysis of these best and worst projects
Day 3: (participants divided in five groups, see above)
• Impact of projects on wealth classes
• Attribution of changes to interventions
• Evaluation criteria

11
~2~ Timeline: perceptions about local history and
important events
On the first day of the workshop, we asked the participants to construct a timeline of
important events in the Daboya area. Important events would be events that have
become part of the collective memory of the people in the area and/or that have had a
lasting impact on the area. The aim of this exercise was to get a quick impression of
the local history of the area, seen through the eyes of the workshop participants. It
also helped the participants to mentally prepare for the following exercises that were
more complicated and that often involved comparing the present and the past. In our
analysis, the timeline helps to embed our findings on the impact of development
interventions in a historical context, as perceived by the people themselves.
The workshop participants were divided in five groups. In group discussions like
these, women often speak less than men, young people speak less than elders, and
‘common people’ speak less than officials. By dividing the workshop participants in
these five groups we could hear the voices of all and also note differences in the kind
of events they mentioned. In the list of events below, the abbreviations indicate which
group mentioned each event.
Groups:
Officials (O),
Elderly men (EM),
Young men (YM),
Elderly women (EW),
Young women (YW).
Note: The list of events, as mentioned in the timeline, has been organised by year.
However, in some cases, the participants estimated the year in which the event had
occurred. For some of the events mentioned in the timeline, different groups came up
with different years (see below). The exact timing of the events is of minor
importance, however.
1910s - A leader called Kankrafu organised a gun-powder plot to stop the Asantes
from taking slaves from Daboya. He killed himself in the process with his
sub-chiefs and all the Asantes; people in the community had their
independence from (no longer were harassed by) the Asante; a chief
warrior was taken away by Asantes, but people were happy the Asantes
could not kill their chief warrior (EM). There is a cave between Yezuri and
Tachali with doves that one can kill and eat in that cave but they cannot
(should not) be carried out; there is a legend that there were also guns there
that could not be taken out (EM; year unknown).
1920s - A woman was taken away by a crocodile; people thought that was nature’s
revenge for refusing to contribute for the pacification of the river; she was
a queen mother and used to sell at the market; people became alarmed and

12
became careful in making utterances against the river. This attitude lives
on until today; in the past crocodiles played a major spiritual role; a white
crocodile used to warn the community on impending disasters that might
occur through the river but this has stopped long ago (EM). Also the YW
recalled the story of a crocodile coming near the village; it was seen as a
bad sign for the village; women couldn’t use the river; one woman
disappeared mysteriously.
1930s - Military camp built on the other side of the river; young men visited the
town, stayed two months in the camp and returned home; they helped the
people on the other side of the river (in Daboya centre) (EW).
1945-50 - Poor harvests; people were hungry (EW).
1948 - Start of access to education, improvements in life and reduced illiteracy
(O)
- Chief Asafi starts office (O).
(late) colonial times
- Post Office was established as well as a Court, to enable Chiefs to
communicate with ‘the colonial masters’ and to arbitrate legal cases
locally (YM).
Around 1955 - Warriors from various places in Northern Region (including Daboya) had
been sent (when is unknown) to protect the Mamprusi chief at Langbinsi in
the north of what is now Northern Region; they settled and became
farmers there; when they wanted to appoint a chief of their own, they were
called strangers; they decided to go back and came to the chief in
Dumampro, who sent them to settle in Daboya, particularly in a place that
became known as Lingbinsi village; this helped to boost agricultural
production, particularly farming, in the area because people of Daboya
were until then predominantly fishermen and weavers (EM).
1955 - Tsetse control project in which all trees along the riverbank were felled;
wild animals also disappeared; fear among people in the community
reduced because wild animals no longer disturbed their residence (EM).
1957 - Ghana independence (not mentioned by any group)
1958 - Soon after independence the new government under Kwame Nkrumah
built a health centre in Daboya, but that was never opened (EM).
1960

13
- Bridge construction under the regime of President Nkrumah; it was meant
for traders, visitors and lorries, but it broke down in 1972 (EW; YM also
mentioned it but as if the bridge was only constructed in 1972).
1960/61 - Holes dug in search for cement materials by geological survey department
(Russians) (EM).
1962 - Arrival of health centre (YM).
1966 - A road was constructed from the Centre to the river with some tarmac
parts; it facilitated transportation (EW).
1967 - Measles outbreak in Daboya; many children died (EW).
1969 - Construction of a primary school in Lingbinsi village; children could go to
school now (EW).
- Construction of Baptist Church in Lingbinsi village (EW).
1970s - The Local Court was stopped; now cases had to be heard in Tamale (YM).
1970 - Health Centre commissioned by the new Busia regime; more effective
health care delivery since people did no longer have to travel to Tamale or
Damongo. A canoe capsized with ministers that came to inspect the
commissioned health centre (EM). YM and O: the health centre started in
1972.
- Tractors came to the area; this improved farming (EW).
1970/71 - Road to Damongo; more easy communication with outside world; lorries
started coming to the area (O).
1971 - Pipe-borne water commissioned; helped to eradicate water-borne diseases
in the community (EM). YM: started in 1972, but the water came from the
river and people were still affected by water-borne diseases.
- Trenches dug for hydro-power project (EM)
1972 - Building of health centre (clinic); improvement of health situation of
Daboya and the catchment area of the new health centre (O and YM).
- Flood. The existing bridge broke down; traders and other people had to go
back to use the boats, like they used to do in the past, trade went down
(EW). [According to the officials the bridge collapsed in 1974, but that

14
must have been a mistake; YM even talk about the bridge collapsing in
1979].
- Building of bridge started; more easy passage for vehicles (O). The Busia
government started building a new bridge across the river; however that
bridge was never finished; soldiers beat up the contactor of the bridge
across the river and that made the construction to stall (EM: 1972).
- Arrival of police station (YM).
1973 - New food crop helps to better feed the community (O).
1974/75 - Immunization programme started in the health clinic; women could deliver
in the clinic with assistance of the midwife and as part of ante-natal and
maternal care (EW).
1979 - Attempt to open a quarry at Tachiali (EM).
1980s - School Feeding Programme started; more children could go to school
(YW).
1980 - First set of water pipes to get water from the river; it improved access to
water, but in the dry season the water was not always clean (EW).
1982/1983 - Serious drought; famine in the community, people were able to sustain, but
the drought had a devastating impact (O). Some NGOs helped by
distributing seeds and oil (YW).
- Out break of sleeping sickness (trypanosomiasis) caused by tsetse flies
(YM).
1984 - Outbreak of bilharzia-epidemic (YM).
1986 - Road connection to Fumbisi, for more easy communication (YM).
1987 - Outbreak of apollo eye infection and diarrhoea; affected eyesight and
resulted in death among children (YM).
1988 - Floods (EM).
1988/89 - Chief Tikuri starts office (O).
15
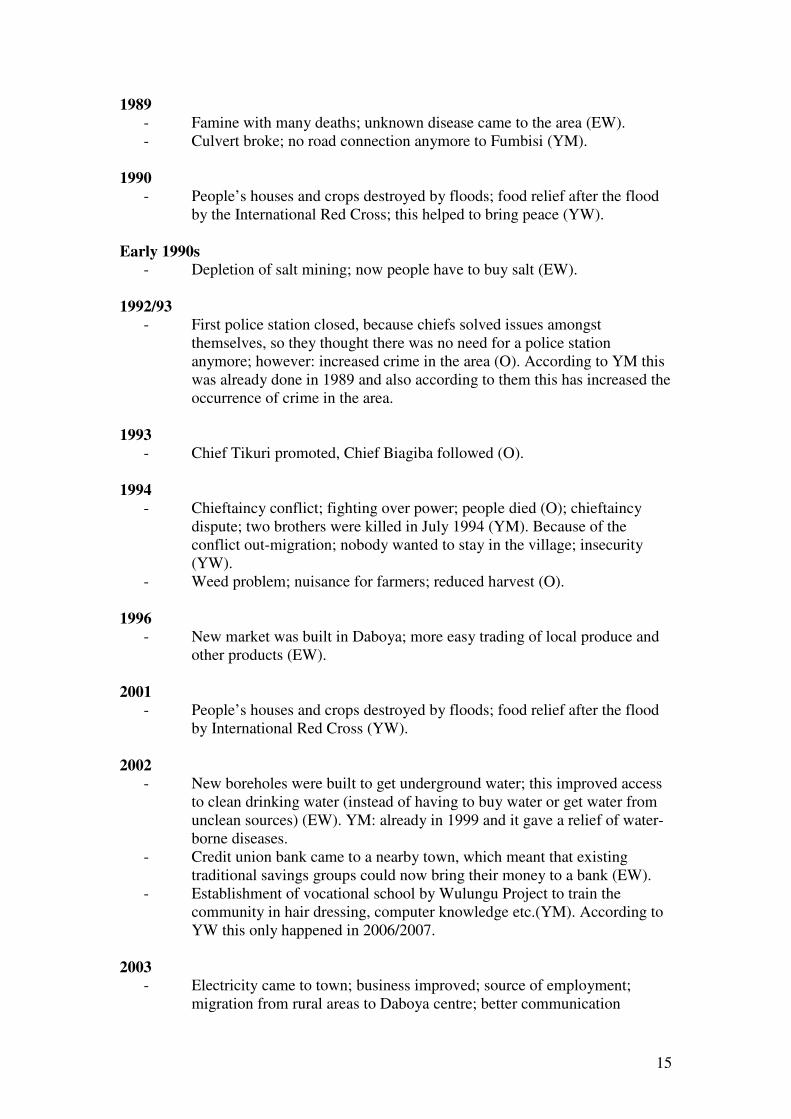
1989 - Famine with many deaths; unknown disease came to the area (EW).
- Culvert broke; no road connection anymore to Fumbisi (YM).
1990 - People’s houses and crops destroyed by floods; food relief after the flood
by the International Red Cross; this helped to bring peace (YW).
Early 1990s - Depletion of salt mining; now people have to buy salt (EW).
1992/93 - First police station closed, because chiefs solved issues amongst
themselves, so they thought there was no need for a police station
anymore; however: increased crime in the area (O). According to YM this
was already done in 1989 and also according to them this has increased the
occurrence of crime in the area.
1993 - Chief Tikuri promoted, Chief Biagiba followed (O).
1994 - Chieftaincy conflict; fighting over power; people died (O); chieftaincy
dispute; two brothers were killed in July 1994 (YM). Because of the
conflict out-migration; nobody wanted to stay in the village; insecurity
(YW).
- Weed problem; nuisance for farmers; reduced harvest (O).
1996 - New market was built in Daboya; more easy trading of local produce and
other products (EW).
2001 - People’s houses and crops destroyed by floods; food relief after the flood
by International Red Cross (YW).
2002 - New boreholes were built to get underground water; this improved access
to clean drinking water (instead of having to buy water or get water from
unclean sources) (EW). YM: already in 1999 and it gave a relief of water-
borne diseases.
- Credit union bank came to a nearby town, which meant that existing
traditional savings groups could now bring their money to a bank (EW).
- Establishment of vocational school by Wulungu Project to train the
community in hair dressing, computer knowledge etc.(YM). According to
YW this only happened in 2006/2007.
2003 - Electricity came to town; business improved; source of employment;
migration from rural areas to Daboya centre; better communication

16
possible and material changes such as cooling etc. (O). EW: this started
already in 2002; impacts: lights in the house; more security; electric
apparatuses and (later) possibilities of charging mobile phones; YM:
already in 2001 and it boosted business activities.
2004 - Chief Anyami started office (O). New chief elected (Sapewura) with some
positive effects on the community, more peace in the community (YW).
2005 - A new post office was built; now it became possible to send and receive
post and send and receive money via the post office (EW).
2006 - Heavy rainfall; four people were killed by a falling tree (YW).
2007 - Flood; homes lost, farms destroyed (O). Loss of life and property;
livestock and foodstuffs destroyed; the community was cut-off from other
communities; 2007 was the worst flood in living memory (EM). The
floods destroyed crops and buildings, obstructed farm work; and blocked
roads to farms; heavy wind destroyed houses and roofing sheets (YM).
2008 - Telecommunication network arrived; increased communication
possibilities (O). YM: started in 2007.
- New mosque was built; this increased the number of praying areas and
with electricity the mosque could be heard in villages as well, which made
people happy (EW).
- Floods (again) destroyed crops and farmlands and washed away farm
inputs (YM).
- Health Minister came to Daboya; pickup given to the community, two
motorbikes and ten bicycles (YM).
- UN Military came to the community; community received engine boats
(YM).
- Health centre upgraded to Polyclinic (YM).
- Shooting accident during the Fire Festival; two people were shot (YW).
2009 - Police station commissioned; (expected) reduction of crime (O).
- Another flood (EM).
- Earthquake occurred in Menpeasem; deformed/depressed land (YM).
- Construction of an eco-tourism centre by a Mr Larry (YW).
- An NGO distributed some money to the community (YW).
2010 (just before the workshop took place) - Accidental death of a small girl: a baby girl drunk a washing powder,
thinking that it was a drink, and died (YW).

17
CONCLUSIONS ON THE TIMELINE EXERCISE Several observations can be made from the timeline exercise. The lists of the five
groups differ a lot, and only a limited number of (very important) events were listed
by more than one group. This shows the group-specific memory and the importance
of combining the disparate information of groups with different function/age/gender
profiles. As could be expected, elderly men and women go back a long time, the
elderly men even to the 1910s; the memory of young men and women starts a lot
later. The list of events mentioned by the ‘officials’ from Daboya only starts in 1948
and is surprisingly thin (unlike what we have experienced in other case study areas).
However, quite a number of the ‘events’ mentioned by the officials deal with the
appointment/election of chiefs, and with some of the conflicts that were a result of
chieftainship competition. Young men reported a lot about the police station and the
local court (or their disappearance), while the elderly men were the only ones
reporting about the important fact of the establishment of a settlement village, north of
Daboya (Lingbinsi) and its history.
There are three major additional types of events, with only few mentioned by more
than one group. Natural disasters in the earlier years seem to have been mainly
droughts and related famines; recently most natural disasters were a result of the
opposite: floods, where particularly the recent flood of 2007 was listed by most
groups as one of the major events in the history of Daboya. Health aspects were listed
a lot as well, both in the sense of the outbreak of major disease epidemics, and in the
sense of particular health care campaigns or the arrival of health care clinics. Finally
the arrival of new infrastructure also received a lot of attention, with often unclear
memory about the exact periods involved. Of course, for an isolated place like
Daboya, next to a major river, the fate of the roads and bridges (and the fact that there
is no bridge since a long time) attracts a lot of attention, but also the building of water
infrastructure, the arrival of electricity (only recently) and telecom facilities (a few
years ago) get an important place in the lists.
As elsewhere, national-level events that could have had an impact locally were hardly
mentioned (e.g. Ghana’s Independence in 1957; several military coups in the 1970s
and early 1980s; the first democratic elections in 1992), while also the activities of
religious organizations received little attention in these lists, while mosques are an
important part of the social organization in Daboya, and Christian churches in
Lingbinsi village.
The timeline exercise yielded a first, fragmented glance of the recent history of
Daboya. The next chapter about changes in the area over the past two to three decades
shows a more in-depth picture of developments in different domains (natural,
physical, human, economic, socio-political and cultural). The subsequent chapters
provide a more in-depth view of the history of development interventions in the
Daboya area.

18
~3~
Trends in capabilities: perceptions of change
A second activity during the first day of the workshop was to assess the perceptions
about changes in six domains (or capitals/capabilities): the natural, physical,
economic, human, social-political and cultural domain. People were asked to use a
time perspective of 25-30 years. We asked the participants to “compare the situation
now, with the time when your father/mother was your current age”.
The purpose of this exercise was to assess how the people in the area have perceived
the positive and negative changes in their surroundings. This is the context in which
development interventions have taken place. In subsequent exercises we try to find
out to what extent these interventions can be linked to the changes that have occurred
in the different domains.
We used a checklist of six domains and forty-five items within these domains to
assess the changes. However, we started the session on change without using the
checklist. In the tables below, the changes that participants mentioned spontaneously
(i.e. before using the checklist) are written in italics.
The findings about change are presented in six tables (3.1 to 3.6), one for each
domain. A summary of the findings from this exercise can be found in chapter six in
which changes are linked to interventions. The abbreviations (see below) indicate
which group mentioned each change.
EW = Elderly Women; YW = Young Women; EM = Elderly Men; YM = Young
Men; O = Officials
Table 3.1: Perceptions about positive and negative changes in natural capabilities
Positive change Negative change
Land More difficult to cultivate the land
because of fertility loss (EW)
Changes in land tenure system: more
priority to individual ownerships
(EM);
Women stopped mining salt deposits at
Daboya and this is caused by the
invasion of Fulani herdsmen whose
animals go to lick the salt thereby
making the place untidy (EM)
It is no longer easy to get the land;
more difficult as now you have to pay
for it (YW)
Degradation due to increase in bush
fires (YM)

19
Positive change Negative change
Soil Degradation of soil, overgrazing by
Fulani cattle, overuse of same piece of
land, overuse of fertilizers (O)
Decline in land fertility (EW)
Reduced soil fertility due to
mechanised farming and chemical use
as well as burning (EM)
Infertile land (YW)
Reduced soil fertility. We now have to
use fertiliser and still don't get the
same yields as in the olden days (YM)
Water Now we have a lot of pipe-borne
ground water sources (from
boreholes) for drinking. Before
there was already a pipe system,
but with river water (YM)
River and streams drying up (O)
Reduction of salt (debate about it) (O)
Floods more frequent (O)
Rainfall pattern changed: rain falls in
months when not expected, this affects
cultivation (O)
Harmatan pattern changed, affects
cultivation (O)
Change in rainfall pattern with longer
dry season than before (O)
Floods disconnect Daboya from the
rest of the district (EM)
Dry water bodies e.g. ponds and
stream (YM)
Animals Extinction of wild life (lions)
[people are no longer afraid of
going outside](YW)
More [domesticated] animals
these days, but it is increasingly
difficult to rear them because
there is less pasture (YM)
Reduction of fresh fish, due to use of
chemicals (O)
Herders have to go far away to feed
the cattle because of declining land
fertility (EW)
Hippos; crocodiles (through illegal
hunting); Kingfisher birds; and
vultures disappear at Daboya and
Sanchewu (EM)
Bad fishing practices by Wangara's
has led to low fish harvest (EM)
Fish stock reduced due to the tsetse
project that led to cutting down of
trees along river banks (EM)
Less fish in rivers; less animals
(cattle); less wildlife available (YW)
Animals eat shea nuts, hence, we do
not get them to harvest; no pig
currently reared in the community
because of Islam, hence population of
pigs reduced (YM)
Less fish stock in the river as a result
of use of chemicals in fishing (YM)

20
Positive change Negative change
Forest Less fear of animals from forest
(EW)
Deforestation (now they can
more easily move around and
perform some activities which
was not possible before) (YW)
Chainsaw operators; charcoal and
wood for burning (O)
Reduction of forestry, also because of
expansion of buildings (O)
Loss of forest because of cutting down
of wood to sell timber and use for
firewood (EW)
Trees along river banks cut down to
control tsetse flies led to reduction in
fish stock (no shade to foster the fish
eggs and hiding place for the fish;
deforestation due to chainsaw
operators (from Mali) (EM)
Forest depleted and buildings
constructed (note: the expansion of
Daboya Town was seen as a positive
thing, but negative for forest)(YM)
Plants
and
Crops
Improved maize variety and
soybean introduced (EM)
Introduction of soybeans and
cashew nut trees (YW)
Rice cultivation increased (new
variety) now more rice than
before; increased groundnut
cultivation (YM)
Seeds infested by insects; has gotten
worse; germinated less (EW)
Low crop productivity (EM)
Poor soil fertility hence low yields
(EM)
Reduction in cotton plantation
resulting in less raw material for
weaving smocks (EM)
Conversion to new maize variety (YM)
Guinea corn and millet decreased
(YM)
Less intercropping now than before
(YM)
New beans variety introduced is not as
good as older variety (YM)
Table 3.2: Perceptions about positive and negative changes in physical capabilities
Positive Negative
Roads and
bridges
Improvement in roads (EW)
More roads being constructed to open
up community and connect them to
markets (EM)
No new roads (YW)
Road infrastructure has
deteriorated in the past few
decades (YM)
Bridge was built, but broke
down (YM)

21
Positive Negative
Building
Structures
Tourist centre: employment, revenue
for district, broadens the marketing
(O)
Health centre: (policlinic): it has an
ambulance, and offers employment
(O)
Buildings are made of concrete now,
less risks (O)
Better houses, more permanent
construction material being used (EW)
More permanent housing structure
(use of cement and stones instead of
mud and wattle) (EW)
More block buildings being built than
before; better resistance to the floods
than the mud houses (EM)
Improved houses (now use cement and
zinc) (YW)
From bush to towns; Now people have
block houses with zinc roofs (YM)
Costs of services are high (O)
Faeces from toilet facilities
are not being collected when
toilets came and this is still
the same now (EW)
There is absence of town
planning; everybody builds
houses everywhere (EM)
Dams No dam in community (EM)
No dams (YW)
Wells and
Boreholes
Mechanized borehole; guinea worm
totally reduced (and other water
borne diseases), reduction of distance
to fetch water (O)
More boreholes and water pipes =>
improvement in people’s health (EW)
Mechanised boreholes being dug
(EM)
Use of pipes and boreholes (YW)
Before we used river water; now more
boreholes are available (YM)
High maintenance costs and
costs for usage (O)
One community lacks water
(Kagbal); water is fetched 4
miles away (EM)
Grinding
mills
Now there are grinding mills, hence,
reduced drudgery (YM)
Farm Tools With coming of tractor farming work
of men and women became easier
(EW)
Farmers now use tractors for
ploughing and chemicals for weed
control (EM)
Using tractors to plough (but
expensive) (YW)
Availability of farm inputs e.g.
fertilizer, ‘ weediceds’; tractors etc
(YM)
Changes in the fertiliser
market. Now require chits
(coupons) to buy fertilizers
from the government
sector/office where they are
sold (YM)

22
Positive Negative
Telecom E.g. no need to go somewhere to do
business;, can be done by phone (O)
Reduces risk in terms of travelling (if
there is an accident, people can be
informed faster) (O)
More wide-spread use of mobile
phones, speakers of mosques and
radio improved community
communication; no need to send
children for errands (EW)
There is now telecommunication
including Tigo and MTN and the
others are yet to come. Loudspeakers
in mosques used for disseminating
information (EM)
Mobile phones, post office (YW)
Now communication facilitated
through mobile phones. Before we
depended on postal services that could
take up to a month to reach Accra
(YM)
E.g. when someone dies, you
do not go to pay your
condolences, but just make a
call (O)
More theft, phones are being
stolen (O)
Rumours spread more easily
(O)
Electricity Created business, communication is
easier after the introduction of
electricity, increased migration (O)
More widespread use of electricity;
increased safety in the area (EW)
There is now electricity (EM)
Introduction of electricity (YW)
Connection to electricity grid (YM)
Town became noisy, pressure
on social facilities (O)
Table 3.3: Perceptions about positive and negative changes in human capabilities
Positive Negative
Population Population has increased
now higher than before
and this puts pressure on
social amenities hence
making live difficult
(YM)
Knowledge More interest in politics, therefore more
knowledge on how to access certain things
or rights (O)
Enhanced knowledge because of schools,
area has developed in general. (EW)
More technical know-how in weaving
including the designs (EM)
More educated people around (YW)
Explosion of knowledge in the community as
a result of technology (YM)

23
Positive Negative
Education
Levels
More schools: reduced crowded class
room;, improved access to education (O)
School buildings also used for other
purposes (O)
Creation of SMC's and PTA's (O)
School feeding programmes: increased
number of enrolment (O)
Introduction of capitation: parents free of
paying school fees and increased enrolment
(O)
Vocational school: reduced ‘streetizm’,
promoted non-formal education (easy
access to education) (O)
More schools in villages; more children go
to school (EW)
More people now see profit in education
than before; they thought educating their
children would make them leave their faith
(Islam). More children now sent to school
because of the attachment of Arabic
instructors to schools and the building of
English-Arabic schools (EM)
Improved schools and more schools (3
primary schools and JSS) (YW)
Vocational training in town; more children
are sent to schools (YW)
Use to ‘foot’ to Kpembe for education; now
we have a lot of educational
facilities/schools; enrolments have also
increased; education was a punishment to
children now a choice of children; less
alcoholism of parents: they now use money
to educate their children (YM)
Crowded class rooms,
due to some school,
which provide meals, so
children move to these
schools (O)
Mismanagement of funds
of the capitation ->
teachers fighting over the
funds (O)
Secondary school out of
town so that children
may not come back after
completion (EW)
Reduction in quality of
education; no senior
school in the community
(YM)
Health Improved access to health services due to
the introduction of NHIS (EM)
The health centre was upgraded into a
health clinic (EM)
Improved children's health (measles, polio
no longer there); Health Centre has arrived;
more health workers in the area (Daboya
and Lingbinsi) (YW)
Reduction of diseases; more immunization
programmes (for free) e.g. measles, polio
etc (YM)
Less body exercise as a
result of a lot of grinding
mills (YM)

24
Positive Negative
Sanitation Hygiene has improved because of toilets
and because people keep it clean around the
houses (EW)
Improved hygiene (YW)
After toilets were built,
faeces were not
collected.(EW)
Poor hygiene due to the
absence of sanitary
inspectors; No public
toilets. Dirty
environment (EM)
Table 3.4: Perceptions about positive and negative changes in economic capital
Positive Negative
Women in
farming/
trading
More women farming in groups (pepper,
beans, okra) to sell and earn more
income (EW)
More women involved in farming than
before. (esp. in ground nut farming , and
new crops like tomatoes, peppers,
onions) (EM)
More women in small business; more
women trained in trades like dressmaking
and hairdressing (YW)
Women now can do any job that a man
can do; it is common now for women to
have their own farms to grow any crop
and even more than the men (note: some
participants also thought that this was a
negative change (YM)
Less women are farming
(YW)
Access to
money
Increased women's income; more spent
on children and support husband (EW)
More people now have access to money
than before (also young men, who are
now doing paid work) (EM)
Easier access to money by increased
trade (YW)
Less money since 2005
(political reason) (O)
Some men do not like
women earning income
(EW)
Increased need for
finances makes life
difficult sometimes (EW)

25
Positive Negative
Access to
credit
SUSU groups (Saving groups) (YW)
Farmers have no access
to credit from banks.
They rely on money
lenders at high interest
rates (EM)
More difficult to borrow,
as there is less sympathy
for each other (YW)
No change: we still rely
on private loans (friends,
lenders). Payment with
interest. There is no
bank, susu or credit
scheme for us (YM)
Market
structures
Weaving industry, increase in production
and the market is taking it up (O)
New market was built and this stimulated
trade (EW)
A smog festival has been created; which
crates economic opportunities since also
people from other areas (e.g. Accra)
would come an see the quality and
diversity in the weaving (EM)
Not enough buyers and
sellers are attracted to
the market (EW)
Kagbal market collapsed
due to lack of water in
community (EM)
No market (YW)
Daboya does not have a
real market; only a small
'evening' market for ‘
soup ingredients’ (YM)
Shops and
Kiosks
Increased shops and kiosks in town (EM)
More shops (YW)
More sewing and hairdressing centres
(YW)
Less female porters (thanks to more
women openings kiosks in town) (YW)
More women now controlling/owning
shops than their male counterparts in the
community (YM)
Limited access to other
markets (EW)
Prices of goods have
gone up (YM)
Buses/
transport
Increase of motor bikes and other means
of transport, which has increased the
number of filling stations (O)
More motorbikes and bicycles now being
used (EM)
More means of transport (YW)
More motor bikes and bicycles now than
before (YM)
Motorbikes came but
only used by men not by
women (EW)
High transport cost for
people and agricultural
produce (EM)
District assembly
stopped providing
canoes to community
(EM)

26
Positive Negative
Income from
business
More people involved in weaving now
than before. Weavers were given a
computer to help them design their
clothing (EM).
Livelihoods through salt
business now reduced in
the community (YM)
Profit margin for
weaving has reduced yet
cost of living is high
(YM)
Paid Jobs Increase of jobs, e.g. construction
projects, health centre (O)
Increased paid jobs including presence
of police personnel in community and
ecotourism (EM)
More paid jobs when you are not a
farmer: sawing, market, etc (YW)
Opportunities for making money has now
increased (YM)
Increase of paid jobs, but
people do not get their
salaries (O)
Remittances Increased remittances in the form of
money and building/materials (EM)
More remittances and it is helping a lot
(YW)
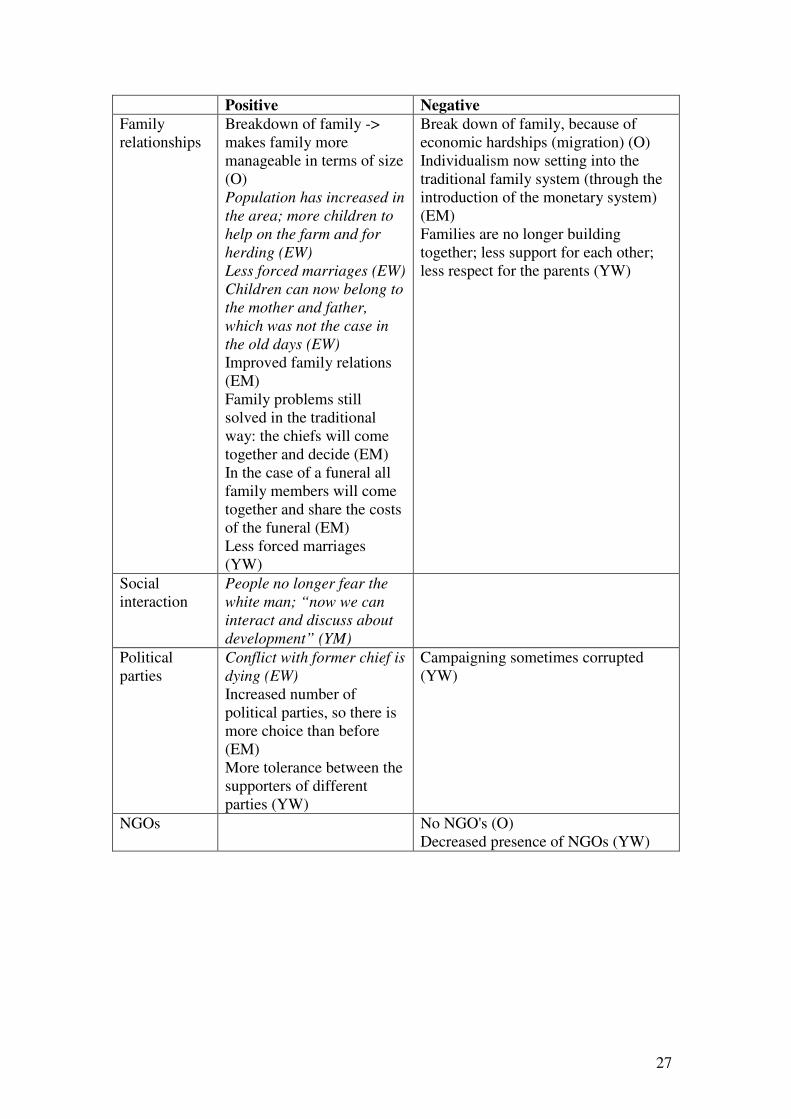
Table 3.5: Perceptions about changes in social and political capabilities
27
Positive Negative
Family
relationships
Breakdown of family ->
makes family more
manageable in terms of size
(O)
Population has increased in
the area; more children to
help on the farm and for
herding (EW)
Less forced marriages (EW)
Children can now belong to
the mother and father,
which was not the case in
the old days (EW)
Improved family relations
(EM)
Family problems still
solved in the traditional
way: the chiefs will come
together and decide (EM)
In the case of a funeral all
family members will come
together and share the costs
of the funeral (EM)
Less forced marriages
(YW)
Break down of family, because of
economic hardships (migration) (O)
Individualism now setting into the
traditional family system (through the
introduction of the monetary system)
(EM)
Families are no longer building
together; less support for each other;
less respect for the parents (YW)
Social
interaction
People no longer fear the
white man; “now we can
interact and discuss about
development” (YM)
Political
parties
Conflict with former chief is
dying (EW)
Increased number of
political parties, so there is
more choice than before
(EM)
More tolerance between the
supporters of different
parties (YW)
Campaigning sometimes corrupted
(YW)
NGOs No NGO's (O)
Decreased presence of NGOs (YW)

28
Positive Negative
Associations Increase in associations (O)
More women's savings
groups to put money in
bank (EW)
Increased number of
women's associations that
bring about unity and give
them skills (EM)
More associations in
general (YW)
Some groups have been formed but
these are not very sustainable
(especially if it was about the groups
formed on purpose of a project
introduced by an NGO, but the project
failed in an early stage) (YW)
Leadership More leadership structures
such as unit committees
introduced (EM)
At the same time no change
in the fact that the chiefs
still come together and take
the decisions (EM)
Young men now in
leadership positions as a
result of education; women
now involved more in
leadership positions (YM)
Since last leader died no more
production of salt (EW)
Less respect for the chiefs and the
elders (YW)
Respect for the chieftaincy institution
has reduced (YM)
Land
ownership/
tenure
Individual land ownerships now more
prevalent (EM)
No longer easy to get the land, more
difficult as now you have to pay for it
(YW)
(In)security Armed robbery increased (loss of
property and life) (O)
Table 3.6: Perceptions about positive and negative changes in cultural capabilities

29
Positive Negative
Christianity
and Islam
Coming of Christianity and
Islam; religious freedom (O)
Church and mosque came.
More places to say prayers;
Muslims and Christians
living peacefully together
(EW)
Churches now built in
Daboya, which include Word
Miracle Church, Catholic
Church, and Pentecostal
Church. More religious
tolerance now than before
(EM)
Increased presence of
Christianity (YW)
No longer fear of death for
building a block house for
fear that witches would eat
you up as a result of religion
(YM)
Some tensions between groups
themselves (so within Christians and
within Muslims) (O)
Ethnicity Increase of different
ethnicity groups->
knowledge exchange and
increased trade (O)
Visitors can come and settle
and we accept them as
community members (EW)
Increased number of ethnic
groups in community (EM)
Fulani causing problems (EM)
Fulani are disturbing the rest and
there are more of them, they are
destroying the crops and have lots of
money when they would sell an
animal (YW)
Languages Increased number of
languages (EM)
More different
languages/dialects (Ewe,
others), but it is good, as in
town we are all one (YW)
Music and
dance
Modern dance, globalisation
(O)
Loss of traditional dance (O)
Traditional music and dance
neglected for the foreign ones (EM)
Stop of "Salt Festival" and "Chump"
Festival (YW)
Vanishing of many traditional dances
(YW)
Bigger influence of modern music at
the expense of traditional songs (YW)

30
Positive Negative
Clothes Exhibition show for
traditionally woven clothes
(EM)
More freedom for women in
how do they dress (YW)
More cloths available (YW)
Really olden days: people
used to wear leaves as
clothes. Now we have clothes
(YM)
Modern dressing (men and women
showing underwear) (O)
Loss of value in the use of traditional
wear (smocks) because of
introduction of cheap second-hand
clothing (obroni wawu = the white
man has died) (YM)
Women now wear trousers (YM)
Food diet/
food types
Last few years more harvest
(O)
Changes in food eaten in
community (EM)
Majority of people now eat
two times a day (but mostly
no breakfast) (EM)
More frequent use of maggi,
polished rice (YW)
Less tasty food (YW)
‘Proper’
behaviour
Because of police station
inappropriate behaviour by
young men can now be
punished.(EW)
Now the number of wives
has reduced hence leading to
reduction in the number of
children and improved well
being (YM)
Behaviour of some youth is not
appropriate, including young men
marrying for themselves without their
parents’ consent. Youth engaged in
immoral activities and stealing; bad
dressing, skipping school lessons
(going out in the bush), not
performing school duties and being
attracted to western dances until early
in the morning (02.30 a.m). Chiefs
say they cannot do anything against
those bad habits (EM)
Less respect for people (YW)
Before a child was a labour force to
the parent now a cost (YM)
Chiefs who have been enskinned no
longer are transferred to the seat of
the paramountcy; they stay in their
local homes (YM)

31
Positive Negative
Migration
behaviour
Increase in migration (O)
More work for girls here so
less need to migrate for work
to Accra.(EW)
People have gone to Accra
and send money back home
(EM)
More people migrate, but it
is good, as they are coming
back as often as they can
(YW)
Women who migrate also
learn new things (YM)
Young ladies migrate to other places
which sometimes leads to broken
marriages (EM)
Increased migration among women
(Kayayee); they come home with
sicknesses (HIV/AIDS); they desert
their husbands when they migrate and
come home married to another
husband (YM)
Ritual
performances
Decrease of rituals, because
of [new] religion (O)
Still performing ritual
performances; no changes
(YW)
Decrease of festivals (culture is dying
out) (O)
Rituals now being seen as devilish
due to Islam and Christianity (EM)
Less traditional greetings (squatting)
performed, more the casual 'hello' is
said by youngsters (EM)
Ceremonies are more costly (YW).
CONCLUSIONS ON CHANGE
The descriptive tables of perceptions of changes in six domains and forty-five sub-
domains contain a wealth of data. Sometimes the answers were quite factual, but in
many cases, the participants added insightful information that revealed their way of
thinking about the changes that have taken place in their area over the past few
decades. Also, the participants often connected changes in one domain to changes in
another domain, which sheds light on the local ways in which the causality of change
is attributed. It is also interesting to see which group gives which type of information,
and with what type of judgement (positive or negative). In total the five different
groups gave 251 different ‘statements on change’, and out of those 135 were seen as
positive change (54%), and 116 as negative change (46%). However, the balance of
the positive and negative statements is very different if we look at the six different
‘domains’. People are very negative about changes in the natural domain (83% of the
47 statements reported a ‘negative change’, and that negative balance is visible in all
six sub-domains). The workshop participants particularly lamented the negative
changes in the availability of land and the quality of the soil for agricultural
production. On the other five major domains the balance was much more positive.
Particularly on the changes in human capabilities people were generally positive (73%
of 30 statements), with the exception of the sub-domain [number of] people and the
sub-domain of sanitation. On the domain of physical changes most statements were
positive as well (67% of 46), with the exception of the quality of the roads and the
breakdown of the bridge; while some groups were also complaining about the lack of
water dams in their communities. On the domain of social and political change and
the domain of economic change the balance is positive, but less so (59% of
respectively 32 and 46 statements). There were quite some critical remarks about the
lack of leadership, the lack of (or disappearance of) non-governmental agencies active

32
in their area, and the increased insecurity. And economically workshop participants
agreed that there was a lot to be desired about access to credit, proper market
structures, and access to income from doing business. However, the position of
women has improved a lot, economically, socially and politically. People often related
that to the profound changes in the cultural domain, although many participants were
quite ambivalent about some of the cultural consequences of rapid change in the other
domains (with only 56% of 50 statements being positive for ‘cultural change’). Not
only the elderly participants lamented the loss of traditions, and ritual performances,
dances and music; while there were also critical remarks about the increasing
‘improper behaviour’, which was seen as a negative consequence of exposure to an
outside world that has many good things to offer, but also threatens some of the deep-
rooted cultural attitudes and beliefs of the people living in Daboya.
The different assessment of positive and negative change per domain does give an
idea about different perceptions among ‘officials’ and ‘common people’, and between
age and gender groups; see table 3.7. First we have to say something about the
differences between the five groups in the coverage of changes, which were reported
during the group discussions: the workshop groups of the elderly men and the young
women were mentioning many types of changes, followed by the officials. The
workshop groups of the young men and the elderly women were less specific (or less
talkative, or the group’s secretaries did not make extensive notes on everything
discussed). In their relative assessment of change the women (and particularly the
elderly women) were more positive than the men or the officials (who were mostly
men as well). Among the officials and the young men the statements about negative
change were even (slightly) more numerous than the statements about positive
change.
If we look at the six major domains, we have already seen that the statements about
the changes in the natural domain were far more negative than positive. All groups
shared that negative attitude, with the exception of the young women, who had a
50/50 assessment. Particularly the officials (only negative changes mentioned) and the
elderly men were extremely negative. About the changes in the physical domain all
groups were more positive than negative, with very positive assessments by the
elderly women and young men. The changes in the domain of human capabilities
were seen as most positive of all changes. However, here the young men do not share
that enthusiasm (they give a 50/50 score), unlike their female age-mates, who only see
positive change. In the economic domain most groups are slightly more positive than
negative, with the exception of the elderly women. In the domain of social and
political change there are big differences: among the two groups with elderly people
these changes were mostly seen as positive, while the officials and particularly the
young women were not so positive. Finally, the changes in the cultural domain were
fully appreciated by the elderly women, but much less so by the younger generation,
where the young men even saw more negative than positive changes in that domain.
Table 3.7: Opinions about positive and negative change per domain by workshop
groups (in percentages of perceived positive change)
Domain Officials Elderly
women
Elderly
men
Young
women
Young
men
Total
Natural 0 17 8 50 23 17

33
Physical 54 90 67 56 86 67
Human 78 60 80 100 50 73
Economic 60 38 67 64 57 59
Soc-Polit. 40 83 78 33 67 59
Cultural 60 100 54 50 44 56
All 48 62 55 56 49 54
n 52 37 60 57 45 251

34
~4~
A history of development interventions
During the second day of the workshop the participants created a list of all
interventions they could remember that had taken place in the Daboya area. For this
exercise the workshop participants were divided in different groups, compared to the
first day, with the exception of the officials. The Daboya weavers and other artisans
(all male) formed a second group; the Chiefs, shopkeepers, traders and ‘big’ farmers
in and immediately around Daboya Centre formed a third group (we call them ‘local
leaders’); the women living in and immediately around Daboya formed a fourth group
and people coming from villages around (and particularly from Lingbinsi Village)
formed a fifth group. In the second part of this exercise, reported in chapter five, the
group members were asked to judge the impact of the projects (‘negative impact’,
‘project only existed on paper’, ‘no lasting impact’, ‘project on-going, not clear yet
what the impact will be’, ‘positive impact’) and to indicate on which domains the
interventions had an impact (natural, physical, human, economic, socio-political and
cultural).
This chapter is based on a descriptive table (in appendix 2 to this report) containing a
chronological list of interventions that have taken place in the area since the early
1930s. At the end of the chapter, a more quantitative analysis of agency involvement
and sector focus over the years (1930s – 2009) is presented. The chronological list of
interventions is based on the input from the five different workshop groups. The
original data were condensed and edited to provide a more comprehensible overview
of the history of development interventions in the Daboya Area. Interventions that
were mentioned by several groups are listed only once. Each of the five groups
mentioned around 49 different initiatives (the women, and the people from the
villages a bit more, the officials, the local leaders and the artisans a bit less. However:
in Daboya many interventions were only mentioned by one of the five groups. There
were no projects mentioned by all five groups, only seven by four groups, twelve by
three groups and sixteen by two groups. This means that out of 181 initiatives or
‘projects’ 147 were mentioned by only one of the five groups. This can be regarded as
remarkably high.
Table 4.1 Workshop Groups and projects mentioned, with overlap
Groups Total
initiatives
mentioned
As only
one
Together
with one
other
group
Together
with two
other
groups
Together
with three
other
groups
Officials 41 22 L:2
W:1
L+A:4
L+W:1
A+W:3
A+V:1
L+A+W:7
Local
leaders
46 23 O:2
L:1
W: 6
O+A:4
O+W:1
A+W:1
A+V:1
O+A+W:7

35
Artisans 43 19 L:1
W:4
V:1
O+L:4
O+W:3
O+V:1
L+W:1
L+V:1
W+V:1
O+L+W:7
Women 59 34 O:1
L: 6
A:4
V:1
O+L:1
O+A:3
L+A:1
A+V:1
O+L+A:7
Villages 54 49 A:1
W:1
O+A:1
L+A:1
A+W:1
Total 243 147 16 12 7
The condensed list of interventions reads as ‘a short history of development in the
Daboya area’. It reflects several wider trends in development practice worldwide as
well as local idiosyncrasies.
The chronological list of interventions in appendix 2 gives a descriptive impression of
the history of development in the Daboya area. The main players changed over time
and so did the sectors in which most interventions took place. Table 4.2 gives a
summary of all agencies that played a role in the development history of Daboya,
according to the workshop participants.
Table 4.2 Agencies active in Daboya’s development history, 1930-2010
Government
Government of Ghana/GoG; before 1957: Colonial Government (UK dependent)
District Assembly (DA; in Damongo; West Gonja District; unit committee Daboya);
also given as ‘ Local Authority (LA). In July 2008 a blogspot started at the level of
the Damongo/Daboya area (or West Gonja District, also with some information about
Daboya; see: http://www.damongodistrict.blogspot.nl/)
MOFA/Min of Agriculture/Agric (currently there is one extension officer in Daboya;
vacant in Lingbinsi; e.g. Participatory Community Planning = MOFA + ONCHO,
spraying against disease)
MASLOC, a Ghanaian government-based development unit, in the Office of the
President: the Microfinance and Small Loans Centre (see:
http://www.masloc.gov.gh/)
National Board for Small-scale Industries; support to spinners
Ministry of Health (MoH)/Ghana Health Service (GHS), (currently a polyclinic with
medical assistant i/c in Daboya and in Lingbinsi);
Ministry of Education (MoE)/Ghana Education Services (GES), Currently in Daboya:
2 Arabic-English schools and one English Primary School (PS); 2 Junior Secondary
School (JSS), one DA Junior High School (JHS) and Asafo JHS); plus schools in the
communities (e.g. Lingbinsi 3 PS and 2 JHS); in total the Daboya area currently has
50 schools)

36
Department. of Wildlife
Military
MP fund (Member of Parliament)
NDC Party; National Democratic Council (http://www.ndcghanaonline.com/),
currently the governing party of Ghana; and also the party that won the 2008
parliamentary elections in West Gonja, with Hon. Wusah (see:
http://www.ghanamps.gov.gh/mps/details.php?id=238). As you could see on this
website, Hon. Sammy Wusah comes from Lingbinsi-Daboya; is an Assemblies of
God Christian; and has a BEd in Agriculture; before being elected he was working as
a budget officer in Damongo. For the Parliamentary elections in December 2012bthe
West Gonja (or Damongo-Daboya) electoral area was split and became Damongo and
Daboya-Mankarigu. The elections in Damongo were won by Adam Mutawakilu
(NDC) and in Daboya-Mankarigu by Baani Abudu Nelson (NDC, 8,275 votes; 54%)
followed by Tika Samuel Yeyu (NPP, with 6,672 votes (44%). See:
http://www.ghanamps.gov.gh/mps/details.php?id=2685.
NPP Party, New Patriotic Party (http://www.thenewpatrioticparty.org/); was
governing Ghana during the 2000-2008 period.
Multilateral and Bilateral donors, except from Islamic states
European Union EU
DfID (from the UK)
DANIDA (from Denmark)
USAID (from the USA)
CIDA (from Canada)
American military team/ US Marines
UNDP: United Nations Development Programme
IFAD (Global-2000) Sasakawa project
Muslim organisations/donor agencies
Saudi Arabian embassy
Embassy of Iran
Egyptian Amadiya (?)
Amadiya Islamic Mission from Kuwait
Islamic Council for Development and Humanitarian Service ICODEHS, Ghana office
Accra; see http://www.icodehs.org/
Treeplanting NGO = Agricultural Support for Rural Development from Iran
Christian NGOs
Catholic Church/mission (German and Italian support)
Catholic Relief Services (CRS)
Presbyterain (Presby) church, with support from the New Ireland Christian Friends
SDA church
Assemblies of God
Gilbert (Christian organisation from the USA)
Pentecostal Church
Baptist Mission (USA backing)
Christ Command Evangelical Church (from Nigeria)

37
Word Miracle Church, a Pentecostal church group, with the Ghanaian hq in Accra,
see http://www.wordmiracle.com;
Other NGOs
ADRA
Wulugu project (supported by a British organisation; established by Mr Karim
Nachina from the area) a.o. funded the Vocational School, Salfiat PS and Tarbiat PS,
and schools at Lingbinsi and Bawena)
DUAF (?)
Danish NGO
Water NGO = CIDA
Credit NGO = Wulugu
Peacecorps (from the USA)
SNV (Netherlands)
Kofi Annan ICT
GATE 2 from USA
Equal from USA
Red Cross International
Agric NGO?
31st December Movement Women
Well producing NGO (Kopote, Tichali) = Community Water and Sanitation NGO
under CIDA
Private firms and local communities
Tigo
MTN
Vodafone
Mr Lary (ex Peacecorps volunteer)
Danish couple
Private supporters of the vocational school from Britain; lady was enskinned in
Daboya after many years of support, she is now called Pogbasinaba
Communities
Private farmers/traders
Tables 4.3 – 4.5 provide a more quantitative analysis of the changes in players
(agency types) and sectors.
Table 4.3 shows very clearly that according to the memories of the workshop
participants the government was the most important development agency in the area
(44% of all initiatives), followed by Christian (donor) agencies (21%), related to a
variety of Christian denominations, and by non-faith-based NGOs (13%). Local
initiatives followed with 10% (often together with other initiators), while there were
also initiatives by supranational donor agencies, muslim agencies and (although only
during the last five years) private companies: three competing telecom concerns.
Before the 1970s very few initiatives were mentioned. Of course, this can partly be a
result of fainted memories: the more recent the period is, the more detailed the
memories become. However, it also tells something about the relative position of
Northern Ghana. The colonial rulers largely neglected the North in the first decades of

38
colonial rule. Their policy was geared towards administration, not towards
development. In the last pre-independence decade (1950s), the colonial rulers changed
their policy in the North and tried to contribute more to development in the area, but
Daboya was largely bypassed. After independence, the neglect of the North by the
rulers in the South of Ghana continued. Christian agencies became more active, partly
supported by well-wishers in Europe or North America, related to one or another
church group. In the late 1960s and 1970s Ghana was poorly governed and it took
until the 1990s before the government became more active in promoting development,
after a relative dominance of Christian agencies and local initiatives in the 1980s.
These broad trends are clearly visible in the data (see table 4.4). Muslim agencies
became active in the 1990s (although in our workshops people had difficulty relating
mosque-based activities to ‘development’ initiatives, or to see them as a specific type
of NGO). During the 1990s also non-faith-based NGOs started to support initiatives
in the Daboya area, and these became relatively important during the last five years.
In Daboya many agencies supported ‘stand-alone’ initiatives. Only in 18 out of 181
‘projects’ two (or in a few cases three) types of agencies worked together: in most
cases local initiatives succeeded to connect to external donors, either a government
agency, or a Christian or Muslim NGO. During the last five years Daboya
experienced a trend that was already visible elsewhere for a longer period: foreign
donors demanding the central government to involve the local people as direct
stakeholders, ort bypassing the central government and working with an NGO
together with a local organization. However, in Daboya the examples are few.
Table 4.3: Number of interventions by agency and decade (N =181)
Government Supra-
national
donors
Christian
agencies
Muslim
agencies
Non-
faith-
based
NGOs
Private Local Total
1930s 1 1 1
1940s 1 1
1950s 1 1
1960s 7 4 11
1970s 5 1 1 7
1980s 5 1 8 4 17
1990s 12 1 9 2 1 4 25
2000s
I+II
22
37
3
9
8
12
1
5
6
19
0
3
2
11
37
81
Total 91 15 43 8 26 3 21 181
* Note: the total N for this table is more than the total number of interventions (181) because in some
interventions more than one agency was involved.
Not only the players in the field of development changed, also the sectors on which
they focus. Table 4.4 shows the number of interventions per sector and decade; table
4.5 the percentages. A few observations can be made from these two tables. Firstly,
the number of initiatives recalled by the workshop participants grows steadily over
time, with a very strong increase in the 2000s. It is hard to tell to what extent this is
due to a real increase in development interventions. Obviously, more recent projects
are easier to recall than interventions of several decades ago. Secondly, the earliest
interventions were mostly in the field of education and infrastructure. The first

39
projects in water, health and religion (the building of mosques and churches) were
mentioned to have started first in the 1960s (much later than elsewhere in the region).
Projects in social care and livestock development started during the 1970s and in
credit provision and business development, but also in crop development and
environmental care only in the 1980s. Electricity only came to the area in the early
2000s, and mobile phone technology (part of infrastructure in this list) only very
recently. In relative terms educational projects were mentioned most (and with a lot of
details), followed by projects in infrastructure (roads, bridge, buildings), water
development (piped water and boreholes mainly) and crop development. During the
various decades people mentioned different ‘major focus areas’: education was
leading in the early decades, in the 1980s and after 2000, and infrastructure in the
1950s and 1960s. The building of religious structures was most prominent in the
1990s, while the 1970s showed a more balanced composition of (the few)
development initiatives, with health, water and livestock projects all getting attention
among the leading initiatives.
Table 4.4: Number of interventions by sector and decade (N=181)
Sector 1930s 1940s 1950s 1960s 1970s 1980s 1990s 2000s
I
2000s
II
Total
Crops 3 4 7 9 23
Livestock 2 1 6 9
Nature 1 1 2 2 6
Water 1 2 4 4 2 9 22
Energy 4 2 6
Infrastructure 1 4 1 4 7 5 22
Credit/Business 2 1 2 8 13
Education 1 1 2 1 5 3 12 23 48
Health 2 2 1 2 13 20
Social 1 4 5
Religion 1 1 5 3 6 16
Other 1 1
Total 1 1 1 11 9
(7)
17 25 39
(37)
87
(81)
191
(181)
* Note: the total N for this table is higher than the total number of interventions (181) because some
interventions were related to more than one sector (e.g., crops and livestock, or social and business).
Table 4.5: Proportion of interventions by sector and decade (% of N=191)

40
Sector 1930s 1940s 1950s 1960s 1970s 1980s 1990s 2000s
I
2000s
II
Total
Crops 18 16 18 11 12
Livestock 22 4 7 5
Nature 6 4 5 2 3
Water 9 22 24 16 5 10 12
Energy 10 2 3
Infrastructure 100 36 6 16 18 6 12
Credit/Business 12 4 5 9 7
Education 100 100 18 11 29 12 31 26 25
Health 18 22 6 8 15 10
Social 11 5 3
Religion 9 11 20 8 7 8
Other 9 1
Total 100 100 100 100 100 100 100 100 100 100
CONCLUSIONS ON THE HISTORY OF DEVELOPMENT
INTERVENTIONS
In this chapter (and appendix 2), a chronological list of development interventions and
a more quantitative analysis of changes in development actors and sectors over time
was presented. The chronological list is based on the input of the workshop
participants (in five different groups, with little overlap), but condensed and edited by
the author of this workshop report. The list gives a good impression of the kinds of
development interventions that have taken place in the research area and changes
herein over time. These changes become even clearer in the quantitative analysis at
the end of the chapter. There are two main findings in this chapter. Firstly, the
government has been the most important development agent in the area, but compared
to other areas where we did PADev exercises, the total number of development
initiatives is rather meagre, also the ones by the government. Relatively few initiatives
in the Daboya area were initiated or supported by foreign state-derived and
multilateral donor agencies. Christian agencies were among the first ones active in
development activities, particularly in a few Christian enclaves (like Lingbinsi), while
in Daboya itself Muslim agencies started to become important in the 1990s. Non-
governmental agencies with a non-faith based background only became important
during the last decade and that is also true for private agencies. One can see a growing
importance of local initiatives, either by local communities or by private individuals
in some of the communities. A second finding is that the sectors in which
development interventions have taken place have become more diverse over time.
Initially, the focus was mainly on education and infrastructure. Later, other sectors
such as health, farming and livestock support, water, credit and business support,
environment and energy became increasingly important. In relative terms
development initiatives in education were mentioned most.

41
~5~
Analysis of interventions by agency, sector and impact
In this chapter, the interventions mentioned by the participants on the second day of
the workshop are analysed in a more quantitative way (see chapter four for a more
descriptive analysis). We look at the implementing agencies, sector involvement,
impact judgments and impact domains (and combinations of these variables).
The lists of projects/interventions mentioned by the workshop participants contained a
total of 181 interventions. Table 5.1 shows the number of interventions per type of
agency, either as a solo intervention or as a partnership. Of the seven types of actors
distinguished, the government had initiated the largest number of interventions,
followed by the Christian Churches, non-faith-based NGOs, local initiators, supra-
national organizations, Muslim organizations and private companies respectively.
Most of the local initiatives were done together with other agencies; of the other
agencies Muslim and supra-national organization had the largest proportion of
interventions as partnerships. Only 12% of all interventions that were listed by the
participant groups involved partnerships, which is low compared to all other PADev
research areas.
Table 5.1: Number of interventions per agency type (solo and in partnership)
Govern
ment
Supra-
national
Christian Muslim Non-
Faith
NGO
Private Local Total
Solo 75 9 41 4 22 3 6 159
Partnership 16 6 2 4 4 0 15 22
% Partner 18 40 5 50 15 0 71 12
Total 91 15 43 8 26 3 21 181
Table 5.2 repeats the total number of interventions per sector. A quarter of all
interventions mentioned concerned educational projects. The other most important
sectors in terms of number of interventions are water, infrastructure and crop
cultivation.
Table 5.2: Number of projects per sector (N=191)

42
Sector Frequency %
Crops 23 12
Livestock 9 5
Environment 6 3
Water 22 12
Energy 6 3
Infrastructure 22 12
Credit/Business 13 7
Education 48 25
Health 20 10
Social 5 3
Religion 16 8
Other 1 1
Total 191
(181)
100
For each of the projects in the list, the workshop participants were asked to judge their
impact. There were seven possibilities:
� the project had a very negative impact (--);
� the project had a negative impact (-);
� the impact of the project was not lasting; it only had a temporary
impact (0);
� for some there was a positive impact, but for others (or for other
aspects) the impact was negative (+/-)
� the impact of the project cannot be judged yet because it is ongoing
(x);
� the project had a positive impact, but only for some in the community
or for some among the intended beneficiaries.
� The project had a very positive impact, and for many in the
community, or for the majority among the intended beneficiaries
Table 5.3 shows the frequency of project impact judgments. In case of
projects/initiatives that were mentioned by more than one workshop group, most
judgements were identical. However, in some cases groups had different judgements,
and these will be treated separately, as ‘mixed judgements’. In general, people were
quite happy about the impact of the interventions in the list. In 67 percent of the
interventions they judged the impact as ‘very positive for many in the community’.
The participants were also asked to judge on which domain(s) or capabilities the
interventions in their list had had an impact. Each intervention could have an impact
on more than one domain and no distinction between positive and negative impact
was made. Most impact was experienced in the human, economic and socio-political
domain and least on the natural and cultural domain (see table 5.4).
Table 5.3: Project impact judgments
Impact Frequency %
Very Negative
impact
1 0
Negative Impact 7 4
Table 5.4: Project impact on domains
Impact domain Frequency %
Natural 19 5
Physical 51 12
Human 121 29

43
No lasting impact 7 4
Positive and
negative
2 1
Ongoing 5 3
Positive impact 26 14
Very positive impact 121 67
Mixed impact
judgement
12 7
Total 181 100
Economic 108 26
Socio-political 86 21
Cultural 32 8
Total 417 100
Table 5.5 gives the workshop judgements on impact per agency and agency
combinations, and also distinguishes between solo interventions of different agency
types and partnerships. Partnerships generally score better impact judgements, and for
the solo initiatives, the government initiatives are, on average, judged more critically
than the initiatives by other agency types. However, the overall judgement is very
favourable. In workshops of this kind in Africa one can expect some ‘positive bias’ (it
is sometimes difficult for people to openly criticise ‘authorities’, or agencies that
came ‘to help’), so it is important to specifically look at judgements that are less than
‘very positive’. Out of 176 initiatives that were not judged to be ‘ongoing’, in a way
that no (preliminary) judgement could be given, there were 55 initiatives, where one
or more workshop groups were less than ‘very positive’: 31% of all
initiatives/projects. In the analysis we will particularly look at these initiatives.
Table 5.5: Impact judgment per agency type (N=181)

44
Very
Negative
(--)
Neg.
(-)
Not
lasting
(0)
Pos
and
Neg (+/-)
On-
going
(x)
Positive
(+)
Very
pos.
(++)
Mixed Total Score*
SOLO 1 7 7 2 4 23 104 11 159 2.5Governm 1 6 5 1 1 12 40 7 73 2.2
Supranat. 0 0 1 0 0 1 7 0 9 2.7
Christian 0 1 0 0 1 6 35 0 43 2.8
Muslim 0 0 0 0 0 0 3 1 4 3.0
NGO 0 0 1 0 0 4 14 2 21 2.7
Private 0 0 0 0 1 0 1 1 3 3.0
Local 0 0 0 1 1 0 4 0 6 2.4
PARTNERS 0 0 0 0 1 3 17 1 22 2.9G+S 3 3 3.0
G+S+L 1 1 3.0
G+S+N 1 1 2.0
G+C 1 1 3.0
G+N 2 1 3.0
G+L 1 6 7 3.0
S+N+L 1 1 3.0
C+L 1 1 3.0
M+L 4 4 3.0
Total 1 7 7 2 5 26 121 12 181 2.5
* very negative impact = -2, negative impact = -1; ongoing/not yet possible to judge: not part of the
total score assessment; both positive and negative impact = 0; non-lasting impact = 1; positive impact =
2; very positive impact = 3; mixed impact: not judged; but also not part of total score judgement. Score
is the average, e.g. for Total: [(1*-2)+(7*-1)+(2*0)+(7*1)+(26*2) + 1021x3)/[181-5-12] = 2.5
Table 5.6 Judgements per sector (n=181)

45
Sector
* total ++ + 0 +/- - -- x Mixed
** C 21 11 3 1 0 5 0 0 1
L 8 2 3 2 1 0 0 0 0
N 6 3 1 0 0 0 0 2 0
W 22 19 2 0 0 0 0 0 1
I 21 11 1 1 2 1 0 1 4
P 5 2 1 0 0 1 0 0 1
B 7 5 1 1 0 0 0 0 0
E 45 41 1 1 0 0 0 0 2
H 20 12 4 0 0 0 1 2 1
S 3 2 0 0 0 0 0 0 1
R 15 10 4 0 0 0 0 0 1
B+S 1 0 1 0 0 0 0 0 0
B+I 1 0 0 0 0 0 0 0 1
B+E 2 0 2 0 0 0 0 0 0
B+C 1 0 1 0 0 0 0 0 0
C+L 1 0 1 0 0 0 0 0 0
E+S 1 0 0 1 0 0 0 0 0
P+W 1 1 0 0 0 0 0 0 0
Total 181 119 26 7 3 7 1 6 13
* C= Crop development, L=Livestock development, N=Natural resources, W=Water, I =
Infrastructure, P=Power (electricity), B=credit and business, E=Education, H=Health,
S=Social, R=Religion.
** Mixed judgments: for C: 1 = ++, +, -; W: 1 = ++,0; I: 4 = a) 1 +/- and 3 times 0; b) 2 times
++, 1+/-, 1x; c) 3++, 1+; d) 2++, 2+; P:1= 2++, 1x; E: 2 = a) ++, 2+; b) ++, 2x; H:1 = --, +/-;
S:1 = 2++, 1+; R:1 = 2++, 1+; B+I:1 = 2++, 0. In total these 13 project judgments combined
the judgments of 41 workshop group assessments of which 19 were ++, 8 were +, 5 were 0,
three were +/-; one was – and one --. In four cases a group decided that the project could not
be judged yet.
In the following section we will give an overview of the various judgments per sector,
and we will particularly highlight judgments that were not ‘very positive’.
Crop development: Out of 21 initiatives slightly more than half were judged as very
positive, but a relatively high percentage less so. Six projects were even judged
negatively (one as part of a mixed judgment). Criticisms were shared about the
following initiatives. In 2002 the Ministry of Agriculture introduced soybeans. The
women were happy about the income it provided, but critical about some of the
management aspects. They judged another agricultural project, to introduce cotton
and particular maize varieties in a village called Tidrope by an NGO, ADRA, as a
waste of effort, due to the low prices they received after the harvests. Villagers were
negative about a government project in 2004 to introduce cashew trees in Yazori and
Kogbal villages, as the ‘promises’ to provide a market failed to materialise. The same
was said about the introduction of a new variety of cassava during the same season. In
2005 the Ministry introduced a new rice variety. However, the local leaders were
negative: seeds came too late, there were no tractors available for ploughing the land,
and the yields were very poor. The artisans workshop group was not so positive about
the agricultural training that the Ministry of Agriculture people were supposed to give
from 2007 onwards: too little, too few. In 2007 another attempt was made to introduce
46
cashew planting, this time with a bit more positive impact, according to the artisan
group, but not very positive yet. When it was again done in 2009 in three villages the
villagers were negative about the impact: there is no ready market, according to them.
In 2009 Kogbal farmers became involved in a new soybeans campaign, judged
favourably by the villagers, but more critically by the artisan group, and with a
negative judgement by the local leaders. According to them the seeds were (again)
given too late in the season, and only a few individuals profited. Villagers were also
negative about the 2009 cassava campaign by MOFA.
Livestock development: Out of eight initiatives in livestock development only two
were judged to be ‘very positive’, but none purely negative. Some critical notes were
shared though. In 1974 the Ministry of Agriculture started a sheep ranch in Lingbinsi.
This soon was abandoned and the officials mentioned it as one of the abandoned
projects without a lasting impact. Somewhat later the government introduced
improved pigs, sheep, cows, goats and poultry, and also constructed a building for
that project. With the exception of the pigs, all other animals died, and the project did
not have any lasting impact (according to the women who mentioned this project),
although the building is still there (and used for other purposes). In 1992 the
government started with a vaccination campaign for livestock and with some
veterinary support. Local leaders said they appreciated that, but only few people
(some of the ones with cattle) benefited. The same was also true when a US military
team came to the area after the floods (2007) for a vaccination campaign. When in
2007 some Fulani herders in the area started to make use of a new, bigger variety of
cows, local leaders also looked at that with mixed feelings: positive for them, but who
else benefits? When in 2009 sheep were vaccinated in a ‘dedicated campaign’, local
leaders appreciated that, but were not very positive, as only few people seem to have
benefited.
Environment: Out of six environmental projects three were judged ‘very positively’,
one positively and two could not yet be assessed. In 1985 a local farmer started a teak
plantation in Yazori, one of the villages around Daboya. The villagers could not judge
the impact yet, as no teak was harvested so far. The idea was (and still is) to produce
poles for electricity. In 2001 a political party (NDC) and a related NGO, used funds
coming from IFAD as part of its ‘Global 2000’ project to support farmers with teak
planting. This was seen as a positive development, but not ‘very positive’, as it was
said that ‘only party members benefited’. For a project by the Ministry of Agriculture
to do the same in 2006 the villagers said that it was too early to judge its impact.
Water: Almost all 22 water projects were regarded as having had a very positive
impact. In two cases it was only seen as ‘positive’ and in one case there was a mixed
judgement, with one group stating that the impact had disappeared. In the early 1970s
the government created a piped water supply, pumping water from the river to the
centre of Daboya. In 1991 it collapsed, but was replaced by other water supplies. Two
groups judged this project as very positive (as long as it lasted; officials and local
leaders). According to them the quality of the drinking water had improved and it
saved people (women mainly) time. It was also seen as beneficial because it attracted
people to come and settle in the area. However, the artisans group regarded this
project as no longer having any impact. During the late 1970s also Lingbinsi got a
piped water supply. This still functions quite well (it was expanded in the 1990s), but

47
the women regarded the price they have to pay for water as too high, and hence
judged this project not as very positive but only as ‘positive’.
Energy: Many workshop participants saw the arrival of electricity in the area during
the 2000s as a very important development. In Daboya all groups were very positive;
in the villages people are eagerly waiting to be connected, so they see this project as
‘ongoing’. But the women (particularly the ones from Lingbinsi) were negative that it
took and takes far too long. Poles have been delivered (and can be seen along the road
since a few years now), but nothing happened afterwards. After the mobile phone
companies came to Daboya, from 2007 onwards there was suddenly a lot of demand
for phone chargers. When a foreign Christian NGO started to distribute solar ones it
was appreciated but also criticised as only few people benefited.
Infrastructure: Among the 21 infrastructure initiatives, eleven were judged to have
been ‘very positive’, but others received some criticism. Soon after independence in
1957 the Ghanaian central state built a District Magistrate court in Daboya, which
functioned for some time. Later that function was removed from Daboya and went to
Damongo, the district headquarters of West Gonja District. Now the building is no
longer used for that purpose; and the initiative was judged (by the women) as ‘not
with a lasting impact’. In the early 1960s the central government built feeder roads in
the area. These provided some employment and are still being used. However their
condition is very bad, as nobody maintains these roads (local leaders: +/-). In 1963 the
local government constructed a ‘rest home’ in Daboya, as a place to accommodate
visitors to the area. The local leaders judged it as a project with a negative impact, as
there was a lot of ‘mismanagement’ from the start and it soon became a ruin. Between
1969 and 1972 the central government built a so-called culvert bridge to enable river
crossings by cars and trucks (and others). From 1984 it was no longer maintained and
it collapsed in 1991. As a result people have to make use of canoes (that’s also how
the workshop facilitators travelled) and trucks and cars have to make a long and
expensive detour to reach Daboya, making it a very isolated place. Officials, artisans
and women workshop groups judged this major infrastructure project as ‘no longer
having an impact’, but the local leaders judged it more negatively: the fact that the
bridge collapsed and nothing was done to repair it was seen as proof of a government
that was not really interested in the area. In 1990 the Ministry of Agriculture built a
residence for the few officers they have in Daboya. The officials group in the
workshop said that the building was useful, but it was never used for its original
intentions, and there was a lot of criticism about the roles played by the MOFA
officials: they only served few people in the area. At the same time the local area
council built a structure as well, both in Daboya (in 1990) and in Lingbinsi (in 1998).
The one in Daboya is only marginally used, sometimes for lodging. The women
regarded it as positive, but not very positive. They were more positive about the
building in Lingbinsi. The improvements to the area council buildings in the years
after 1998 were criticised by the local leaders (‘not yet ready’) and the officials
(‘takes too long’). In 2004 a post office was started in Daboya, more than a century
after the introduction of postal services in Ghana. According to most groups this was
‘better late than never’, but the officials could not see this as ‘very positive’, as it
came at a time, when written letters started to loose their usefulness. In 2007 the first
mobile telephone company came to the area, followed by a second and a third one.
The last ones’ impact could not yet be judged, but the second one was seen by two of

48
the four groups as positive, but not very positive, as it appeared to be more expensive
than the first one.
Credit and business development: Out of twelve projects in this sector (often together
with another sector) five were judged to be ‘very positive’. In the other cases there
were some critical remarks. In 1980 a political party (NPP) used its influence to
encourage the government to build market structures in Daboya. That functioned quite
well for a long time, but was destroyed during the floods in 2007, and it was not yet
repaired, so the women judged it as ‘no longer with an impact’. In 2003 it became
possible to get credit for business improvements. The local leaders regarded this as a
positive development, but criticised the fact that only few people could benefit. In
2005 and 2006 the District Assembly built a few kiosks for the Daboya market,
supported by the local Member of Parliament. The artisans judged it as a very positive
project, but the women were more sceptical, after the floods had done their damage,
and nothing was repaired. In 2005 credit was given to the disabled by an NGO. Local
leaders regarded this as a useful project, but not very positive, as not many people
could benefit. The same was true for a credit project managed by the Ministry of
Agriculture, and one managed by a government-related agency called MASLOC.
Education: Thos was by far the most important sector, in terms of number of
initiatives/projects. Almost all were judged to have been ‘very positive’. In a few
cases people were a bit less positive. In 1978 USAID started a school feeding
programme in the Daboya area, which functioned for a brief period, but, according to
the women, did not have a lasting impact. In Diasali village the District assembly
constructed a pavilion for a school in 2003, but that was destroyed by strong winds in
2006, and not yet repaired. In Daboya some projects supported the building and
expansion of a vocational school. It was seen as positive, but not by all as very
positive, and that was a result of the fact that some groups saw it as ‘only useful for
school dropouts’, or ‘only useful for a few’. A project to give parents credit (or food
or school uniforms) to encourage them to send their children (or only their girls) to
school was seen as benefiting only a few. These were initiatives by NGOs like
Wulugu and Equall. A micro-credit project for women, to attract their children to
come to school, started by the Ghanaian government in 2008, received the same
criticism. In 2009 the District Assembly, with additional funds from the so-called
DUAF fund, started to build an examination centre. According to two of three groups
judging that project it was too early to see any impact, but it was seen as a useful
project when it would be ready.
Health: Out of twenty health initiatives in the Daboya area twelve were seen as ‘very
positive’, and the others less so. During the 1960s the first public toilet was
constructed in Daboya. Because nobody cleaned it, the Daboya women still judged
the project as ‘very negative’; the only project with such a purely negative judgement!
Much later (from 2006 onwards) some public and private toilet projects were
supported, but not seen as ‘very positive’, or even as negative, or partly negative. As
long as nobody seems to care about cleaning, and hence the smell can be awful
around toilets, it will remain a problem. In 2005 the government started an ante-natal
clinic in Daboya. Local leaders were positive, but not yet very positive, as ‘not all
people benefited’. The same can be said about the provision of specific drugs in 2006,
or a campaign to check eyesight (by the US Peacecorps) in 2009. Here it is not always
clear if the criticism comes from the idea that health care should be provided to all at

49
all times (and not for specific diseases only, during ‘campaign time’), or that only few
of the intended beneficiaries were actually reached. The Ghana-wide initiative to
provide health insurance to all people was launched in Daboya in 2007, but still has to
be implemented, and hence cannot be judged yet, according to the villagers. A
Lingbinsi Health post, funded by a Christian foreign agency could not be judged yet
as it was not yet ready.
Social: In 2007 the area was confronted with a flood calamity, and various
organisations came to Daboya to help. Most of it was appreciated a lot, but according
to the artisan group the Red Cross should have provided support to all people in the
area, and not only to the displaced people.
Religion: In the area there are quite some church and mosque buildings. We counted
fifteen separate ones. Most of those were judged to be ‘very positive’ initiatives.
Some were seen as benefiting only few people (‘positive but not very positive’), like
the Baptist church in Lingbinsi, the Assemblies of God church in Baulina, the
Catholic church in the same place, the Kalibito mosque (at least according to the
artisans), or the Pentecostal church in a village called Tachi.
Table 5.7 to 5.9 go more into detail about the sector involvement of the different
agency types. Table 5.7 shows the number of interventions of each agency type by
sector (see the details per project in chapter 4). Table 5.8 shows the proportional
sector involvement per agency (e.g. x % of the government interventions involve
education). Table 5.9 shows the percentage of agency interventions per sector (e.g. y
% of all interventions in education involve government interventions).
These three tables contain a lot of information. Just a few observations are highlighted
here. We already saw that the government has been the most active initiator of
development activities, mostly alone, and sometimes together with other agencies. If
we look at the distribution of government activities among the various sectors crop
development was most important, immediately followed by infrastructure projects and
education. Supra-national agencies, Christian NGOs (or church-related agencies) and
Non-faith-based organisations gave most of their attention to education (by far the
most important sector in terms of numbers of initiatives that the workshop participants
mentioned as separate ‘projects’). Private companies were only active in the telecom
industry (and only recently), while Muslim agencies, and initiatives in which local
people were (co-)responsible were mostly visible in the religious activities in Daboya
(and local ones also in water development).
Although the government dominated the ‘development activities’ in Daboya (in terms
of numbers of initiatives or projects mentioned by the workshop participants), that
was not so in all sectors, and where the government dominated there were big
differences in the measure of dominance. In education Christian churches and NGOs
were mentioned more than the government, in the social sector (particularly around
the dramatic floods that hit the area in 2007) non-governmental agencies dominated
(e.g. the Red Cross), while in religious projects the government was almost absent,
and Christian and Muslim agencies dominated, often together with local initiators. In
sectors where the government was the most-mentioned actor it was a majority
dominance in ‘other’ (military), followed by crop development, infrastructure
development, health and the provision of electricity.

50
Table 5.7: Number of intervening agencies per sector
Sector Gov Supra Christ Muslim NGO Priv Local Total
Crop 17 2 1 0 3 0 0 23.0
Livestock 4.5 1 0 0 1 0 2 8.5
Nature 4 1 0 1 0 0 3 9.0
Water 12 2 5.5 0 1 0 7 27.5
Power 3 0 2.5 0 0 0 0 5.5
Infrastructure 16.5 0 2 0 0 3 1 22.5
Business 4.5 2 2 0 2 0 1 11.5
Education 15.5 4.5 17 1 12.5 0 0 50.5
Health 12 1 5 0 2 0 0 20.0
Social 1 1.5 0 0 2 0 0 4.5
Religious 1 0 8 6 1.5 0 7 23.5
Other 1 0 0 0 0 0 0 1.0
Total 92 15 43 8 25 3 21 207.0
* Note: N = 181 interventions, but total > 181 because of 23 partnerships of more than one agency
type; in some cases initiatives combined two sectors; in those cases each of the two sectors received
0.5.
Table 5.8: Proportion of sector involvement per agency (%)
Sector Gov Supra Christ Muslim NGO Priv Local Total
Crop 18 13 2 0 12 0 0 11
Livestock 5 7 0 0 4 0 10 4
Nature 4 7 0 13 0 0 14 4
Water 13 13 13 0 4 0 33 13
Power 3 0 6 0 0 0 0 3
Infrastr 18 0 5 0 0 100 5 11
Business 5 13 5 0 8 0 5 6
Education 17 30 40 13 50 0 0 24 Health 13 7 12 0 8 0 0 10
Social 1 10 0 0 8 0 0 2
Religious 1 0 19 75 6 0 33 11
Other 1 0 0 0 0 0 0 0
Total 100 100 100 100 100 100 100 100
Table 5.9: Proportion of intervening agencies per sector (%)

51
Sector Gov Supra Christ Muslim NGO Priv Local Total
Crop 74 9 4 0 13 0 0 100
Livestock 53 12 0 0 12 0 24 100
Nature 44 11 0 11 0 0 33 100
Water 44 7 20 0 4 0 25 100
Power 55 0 45 0 0 0 0 100
Infrastr 73 0 9 0 0 13 4 100
Business 39 17 17 0 17 0 9 100
Education 31 9 34 2 25 0 0 100
Health 60 5 25 0 10 0 0 100
Social 22 33 0 0 44 0 0 100
Religious 4 0 34 25 6 0 30 100
Other 100 0 0 0 0 0 0 100
Total 44 7 21 4 12 1 10 100
Tables 5.10 and 5.11 show how the interventions in each of the sectors were thought
to have had an impact on the six major domains (natural, physical, human, economic,
socio-political and cultural); these domains are the ones normally used in ‘livelihood
studies’. Each intervention could have an impact on several domains. For the
workshop participants this appeared to be a difficult exercise. The artisans decided
that they could not do it, while the officials appeared to be very inclusive: most of the
initiatives that they mentioned were thought to have had an impact on four, five or
even six domains. The other three groups were more selective in their assessment, and
often selected ‘the most important impact domain’. We think that the results of this
exercise give a tentative idea about the ideas in the study area about impact of various
types of interventions, initiatives or projects on different aspects of life in the area.
But the results should be treated with caution.
In total the workshop participants mentioned 417 ‘impacts on domains’, for the 181
initiatives (with 191 sector positions), an average of impacts on 2.2 different
livelihood domains. Religious and water initiatives had a broad impact, on average,
while business, environmental and health initiatives had a more restricted impact.
Most impact was mentioned on human capabilities (knowledge, health, skills),
followed by impact on the economy (income and wealth levels; market access;
productivity levels), and impact on social relations in the area (which includes
political relations). Much less impact was mentioned on physical structures, visible in
the landscape, on cultural change (expressions of identity; spirituality; ‘habitus’) and
particularly on the quality of the environment (soils, forests, water and air quality).
Most of the findings are quite self evident; some are a bit surprising. Initiatives in the
crop, livestock and environmental sectors had a profound impact on the economy, and
on nature. Water investments had most impact on human capabilities (a clear health
impact) and on the economy. Investments in electricity had a clear impact on social
relations and on the local economy. Infrastructure projects (roads, bridges, buildings)
had a profound impact on the economy, but (of course) also on the physical/built
environment and on social relations. Business improvement and credit programmes
were important for the economy and changed social relations. The many education
initiatives improved human capabilities (knowledge, skills), but also had an impact on
social relations; less so on the economy. Health projects mainly impacted on human
capabilities, as can be expected. The few social projects (mainly emergency support)
had an impact on human capabilities and social relations. Religious projects were

52
thought to have had a very broad impact, but most so on social relations, and a bit less
(surprisingly) on cultural change. If we judge the impact per domain, changes in
nature were mostly caused by crop development projects, changes in the physical
environment mostly by infrastructure and education projects, changes in the economy
mostly by water and infrastructure projects, changes in people’s ‘human capabilities’
mostly by education and water projects (so not mostly by health projects; health care
is relatively underdeveloped in Daboya), changes in social relations and (access to)
political power mostly by education, infrastructure and religious initiatives, and
finally changes in people’s culture mostly by religious and educational projects.
Table 5.10: Impact on domains, scores per sector (frequencies)
n N P E H S C Total Total/n
Crops 23 11 1 15 9 0 0 36 1.6
Livestock 9 4 1 6 3 1 0 15 1.7
Environment 6 3 0 3 0 1 0 7 1.2
Water 22 0 6 23 24 10 6 69 3.1
Power 6 0 3 4 3 6 0 16 2.7
Infrastructure 22 1 16 18 8 16 0 59 2.7
Business 13 0 1 8 0 6 0 15 1.2
Education 48 0 13 14 47 22 12 108 2.3
Health 20 0 2 5 15 5 1 28 1.4
Social 5 0 0 2 3 3 0 8 1.6
Religious 16 0 8 8 8 16 13 53 3.3
Other 1 0 0 2 1 0 0 3 3.0
Total 191
(181)
19 51 108 121 86 32 417 2.2
N = Natural; P = Physical; H = Human; E = Economic; S = Socio-political; C = Cultural
Some initiatives combined two sectors, making the total (191) higher than the number of initiatives
(181).
Table 5.11: Proportion of impact on domains, scores per sector (%)
n N P E H S C
Crops 23 31 3 42 25 0 0
Livestock 9 27 7 40 20 7 0
Environment 6 43 0 43 0 14 0
Water 22 0 9 33 35 14 9
Power 6 0 19 25 19 38 0
Infrastructure 22 2 27 31 14 27 0
Business 13 0 7 53 0 40 0
Education 48 0 12 13 44 20 11
Health 20 0 7 18 54 18 4
Social 5 0 0 25 38 38 0
Religious 16 0 15 15 15 30 25
Other 1 0 0 67 33 0 0
Total 191
(181)
5 12 26 29 21 8
N = Natural; P = Physical; H = Human; E = Economic; S = Socio-political; C = Cultural

53
CONCLUSIONS BASED ON THE ANALYSIS OF INTERVENTIONS
In this chapter, the list of projects that were mentioned by the workshop participants
was analysed in terms of agency involvement, sector of implementation, impact
judgment and impact domain. The main findings are summarized here. It should be
noted that in this chapter we purely looked at the number of interventions per agency
type and sector. The weight of interventions can obviously differ (e.g. the
construction and subsequent management of a hospital is a much larger project than
drilling one borehole).
The joined list of interventions by the different workshop groups contained 181
projects of which 23 involved partnerships of more than one agency. Of the seven
types of agencies, the government had initiated the largest number of interventions,
followed by Church NGOs, non-church NGOs, (groups of) local people, supra-
national organizations, Islamic organizations and private companies respectively. In
an area that is dominated by people who regard themselves as Muslims, the number of
Christian initiatives is surprising. This may also be a result of people’s ideas that
activities related to mosques are not ‘public’ or ‘development activities’, but closer to
people’s personal lives. It is also clear that all types of private economic activities (by
farmers, transport entrepreneurs, the many weavers, shopkeepers and other economic
actors) are seldom mentioned as ‘public’ activities, while of course they also have (or
could have) a major impact on people’s lives and livelihoods. Workshops of this kind
tend to (over)emphasise public, or ‘developmental’ activities, and people are
generally very much used to the ‘language of projects’ (and of ‘outside
interventions’), even in a relatively isolated and ‘marginal’ area like Daboya .
The simple frequency tables of sector, impact judgment and impact domain produced
the following findings:
− Most projects in the list involved interventions in the sector education
(one quarter), followed by water, infrastructure and crop cultivation (about
twelve percent each).
− Two-thirds of all initiatives were judged to have had a ‘very positive’
impact; people were most positive about initiatives in education, and most
critical about initiatives in livestock and crop development, nature and
energy.
− The interventions had most impact on the human, economic and socio-
political domain and least on the natural and cultural domain.
The tables dealing with sector involvement per agency revealed that both the
government and Church NGOs have focussed many of their activities on education.
The government dominated activities in infrastructure and crop development. Muslim
agencies mostly restricted their activities to building mosques, while supra-national
agencies were important during the flood calamity that hit the area in 2007.
The impact judgment per agency type showed that the interventions of government
agencies were (relatively speaking) criticised most; and initiatives by Muslim,
Christian and non-faith-based NGOs were appreciated more. But in general the
workshop participants were appreciating most of the initiatives, and were hoping for
more: compared to other PADev areas the Daboya area is indeed not well endowed

54
with ‘projects’, although it is certainly not true that the area is ‘forgotten’. In fact we
were surprised to find so many different agencies in the area, and particularly during
the last decade there were many new initiatives, supported by a lot of different
agencies. It also seems that the local inhabitants no longer waited passively for ‘things
to happen’, and started to initiate activities in the public domain. They also succeeded
to attract different types of agencies to participate. The 2007 floods can be seen as a
‘wake-up call’.

55
~6~
Attribution of change to interventions
After the first workshop day, we summarized the perceptions of changes in the
different domains, as perceived by the five groups of workshop participants (see
chapter 3). On the last day of the workshop, we presented our synthesis to the
participant groups and asked them to what extent each of these – positive and negative
– changes could be attributed to interventions that they mentioned on the second day.
In the case of negative changes, we also asked whether there had been interventions
that had mitigated these adverse trends.
The synthesis of changes, made by the workshop facilitators, but based on the
perceptions of change mentioned by the workshop participants, is shown in table 6.1.
Overall, positive changes were more dominant than negative changes, especially in
the human, economic and physical domains. Table 6.2 and 6.3 show for each of the
positive and negative changes in the synthesis which interventions had contributed to
these changes, or – in the case of negative changes what mitigation initiatives had
been taken by whom.
Note: changes were not always attributed to interventions of particular agencies, but
to other phenomena, such as poverty, migration, etc. Tables 6.2 and 6.3 also show that
groups only selected some of the listed positive or negative changes, and some of
these changes (as summarised by the workshop facilitators) did not get any attention,
that is: were not seen as important enough to discuss.
Table 6.1: Summary of changes by domain
POSITIVE CHANGE NEGATIVE CHANGE
Natural >successful tsetse eradication
>less fear for wild animals
>more and better
crops/varieties
>reduced soil fertility
>reduced grazing
>reduced salt
>less fish
>reduced forests
>burning is still a problem
>loss of old crops and varieties
Physical >better, less risky houses
>borehole expansion
>mobile phones
>tractor services
>electricity (e.g. loudspeakers
in mosques)
>bad/no/deteriorated roads and bridge
>ever more noisy and dirty town,
without town planning

56
POSITIVE CHANGE NEGATIVE CHANGE
Human >enhanced technical
knowledge (a.o. on weaving)
>more schools
>much higher enrolment
>improved children’s health
>reduced quality of education since
capitation fund
>SSS out of town
>poor hygiene, unhealthy
environment
Economic >expansion of weaving and
kiosks
>women much more active as
farmers, artisans and traders
>motorbikes increased
>access to money increased,
also for women
>salt business collapsed
>no access to banks; reliance on
moneylenders with high interest rates
>profit margin decreased (a.o. in
‘smog’ weaving)
>problems with transporting goods
(expensive)
Socio-
political
>more women’s associations
>more leadership structures
>more political tolerance
>individualism: less respect for chiefs
and parents
>no/less NGOs in the community
Cultural >Increased Islam and
Christianity, with less fear for
witchcraft
>more ethnic diversity
>increased knowledge and
trade
>better and more ‘diverse’
food
>migration improved exposure
>Fulani causing problems
>loss of traditional customs/festivals
>indecent clothing and bad behaviour
by youth
>if ladies migrate they bring back
problems.
Table 6.2: Attribution of positive changes to agencies’ interventions

57
O = Officials; L=:Local leaders; A=Artisans; W=Women; V=Villagers
(Sub) Domain Interventions contributing to positive
trend
Natural
successful tsetse eradication L: UNDP Oncho project;
O: Govt tsetse control unit, felling trees
along the river
less fear for wild animals Not selected by any group
more and better crops/varieties A: Global 2000
W: ADRA, and particularly soybeans,
maize and cotton projects
V: MOFA; extension service, but also
farmers themselves started to use more
fertilizers
Physical
better, less risky houses A: fertilizer depot project influenced
people’s perception of durability of
‘sandcrete’ houses
W: the floods of 2007, and Red Cross
suggestions showed ways to improve
houses and make them less risk prone
borehole expansion W: the DA borehole projects mainly
V: idem but also CRS projects
mobile phones O: MTN and Tigo
tractor services Not selected by any group
electricity (e.g. loudspeakers in mosques) L+A+V: (rural) electrification project by
the Government
Human
enhanced technical knowledge (a.o. on
weaving)
Not selected by any group
more schools L: District Council
L+W: Wulugu project
much higher enrolment A: Gate and Equal
O: Capitation grant from the Government
O: the school feeding programme
O: The start of English-Arabic schools
encouraged Muslim parents to send their
children to schools
O: There is growing competition among
families about how many of their
children have gone to school and how
successful they are
improved children’s health A: the polyclinic, but also the use of
pickup trucks and motorbikes to transport
sick children and their mothers and/or
fathers to the clinic
O +V: immunization campaigns by the
Government

58
O: education on hygiene in the clinic and
in schools
V: more nurses in the Government clinic
Economic
expansion of weaving and kiosks
L: Vocational training NVTI
L: many private initiatives
A: the Visitors Centre
O: the Festival
O: population growth and fashion
V: opening of markets and support by
NGOs
V: higher profits possible
women much more active as farmers,
artisans and traders
L: Global 2000
A: Masloc credit
V: Wulugu and other NGOs
V: husbands are now more supportive
motorbikes increased Not selected by any group
access to money increased, also for
women
W: the agricultural projects
Socio-political
more women’s associations
A: Masloc credit groups
O: Women united themselves
more leadership structures V: as a result of the decentralisation of
government structures
more political tolerance L: experienced elders educated the youth
to be tolerant
V: political processes are now better
understood
Cultural
Increased Islam and Christianity, with
less fear for witchcraft
L: more Christian and Muslim leaders,
and more external support (Islamic
Council, Kuwait)
A: all Christian and Muslim projects
attract new converts
O: (public visibility of) preaching and
praying
W: building churches and mosques
more ethnic diversity A: the visitors centre, the polyclinic and
schools (bring people together with
different ethnic backgrounds)
V: travels, church and mosque preaching,
growing intermarriage, and football show
that ‘we are all one’.
increased knowledge and trade Not selected by any group
better and more ‘diverse’ food Not selected by any group
migration improved exposure O: Imitating behaviour; ‘bring back
(other cultures; practices) to the village’
V: there is more knowledge about
fundamental human rights now

59
In the domain of natural changes the workshop participants attributed positive
changes to particular ‘campaigns’: the tsetse eradication in the 1950s as an activity of
the Government with foreign (UNDP) support, the Global 2000 campaign of the
government together with UNDP and IFAD, and various interventions initiated by the
Ghanaian Ministry of Agriculture, MOFA. One NGO was mentioned specifically,
ADRA. In the domain of positive physical changes various District Assembly
initiatives were mentioned as catalysts of positive change, next to the electrification
project of the Central Government and the example a certain MOFA project (the
fertilizer depot) set to demonstrate better building techniques. Next to government
agencies also the Red Cross was mentioned as influential as well as two of the three
mobile phone companies. In the domain of positive changes in human capabilities
both government and NGO agencies were mentioned as catalysts of change: for the
government these were the District Council schools, the GoG capitation grants, the
polyclinic and the immunization campaigns, while Wulugu, Gate, and Equal were
mentioned as influential NGOs with a clear impact on positive change. The initiatives
to start English-Arabic schools (government and NGOs working together) were also
important. Finally the school feeding programme was mentioned as a contribution to
positive change, and this was supported by a foreign donor agency, USAID.
Economic changes were partly attributed to government agencies (like the vocational
school, the visitors centre, and MASLOC), to foreign donor-supported activities
(GLOBAL 2000) and to some NGOs (Wulugu again), but here many small-scale
private initiatives were mentioned as well, and also more structural changes in the
population and in (world) economy. Positive socio-political changes were hardly
attributed to agencies; only government agency MASLOC was mentioned explicitly.
The general tendency in government to decentralise was seen as an important and
positive development, though. For cultural change mostly the Christian and Muslim
agencies were seen as having been influential, and their foreign sponsors, of which
the Islamic Council and he Kuwaiti government were explicitly mentioned.
Government initiatives like the polyclinic and the visitors centre were seen as having
had some positive impact as well.
Table 6.3: Linking negative changes to agencies’ interventions and ideas about
mitigation by agencies
O = Officials; L=:Local leaders; A=Artisans; W=Women; V=Villagers
(Sub) Domain Interventions contributing to negative
trends and ideas on mitigation
Natural
reduced soil fertility Not caused by interventions; L: a.o.
MOFA’s soybean project tries to mitigate
reduced grazing land V: as a result of increased farm sizes
(more machines), more farmers, more
animals and increased numbers of Fulani
herders and their cattle; no mitigation
reduced salt Not specified
less fish O: by use of chemicals; chief tried to
stop it but could not enforce
reduced forests V: Because of bush burning and illegal

60
felling of trees (not because of
interventions); MOFA and AROCHA
assist with afforestation; Game &
Wildlife programme tries to minimise
burning; Chief tried to stop chainsaw
operators but could not enforce it; shea
butter dealers encourage burning as
yields are thought to be higher and
picking more easy; (given their
importance for the local economy there
is) no willingness to punish them;
V: school education should help
burning is still a problem Not caused by interventions; O:
‘smokers’ (charcoal burners) and hunters
to be blamed
L: no active mitigation by anybody
A: the Pentecostal church has formed
volunteer fire squads and the Mole
Wildlife Dept. trains the community to
fight fires
O: the chief should stop this, but has no
power to enforce
W: some NGOs do conscientization
loss of old crops and varieties Not specified
Physical
bad/no/deteriorated roads and bridge A: Government sometimes grades a road
O: Government neglect; now it is hard
and expensive to transport goods and
people
L: no mitigation
ever more noisy and dirty town, without
town planning
O: mainly ‘bad behaviour’ to blame; and
since electricity came radios and
loudspeakers make a lot of noise
L: children in schools misuse mobile
phones; Chiefs now permitted teachers to
take phones from children during classes
V: dirty conditions are a result of poor
health education; some mitigation by
public health officers (but these are few).
The Ghana Cleaning Service (a
government department) has a lack of
money and capacity; and pays bad
salaries to its workers. Some mitigation
by distributing mosquito nets, by school
education and by mobilising community
volunteers for cleaning the area. (Not
very effective).
Human
reduced quality of education since the
start of the capitation fund
O: increased numbers of school children
caused overcrowding of class rooms, less

61
books per pupil, uneducated teachers and
the low pay of teachers does not help to
give teaching a higher prestige; however,
many of the new pupils do not behave
properly. Chiefs have now proposed to
put a ban on dancing during week days.
Mitigation: some NGOs, e.g. Equal,
improving the quality of education for
girls
SSS out of town Not specified
poor hygiene, unhealthy environment L: due to high illiteracy
W: and despite the introduction of for
instance dust bins (‘people are not yet
used to them’)
V: the public health department, Ghana
Cleaning Service and the mosquito net
project try to mitigate
Economic
salt business collapsed
O: the women who used to organise it are
dead now; Fulani cattle destroyed the salt
harvest places; no mitigation attempts
no access to banks; reliance on
moneylenders with high interest rates
A: MASLOC and MOFA try to assist
O: plan to start a local ‘money union’
V: during election campaigns loans
become available; there is a credit union
now at Lingbinsi; NGOs try to encourage
the start of cooperative saving unions
profit margin decreased (a.o. in ‘smog’
weaving)
Not specified
problems with transporting goods
(expensive)
Not specified
Socio-political
individualism: less respect for chiefs and
parents
O: lack of parental care, use of hard
drugs; quest for freedom among the
youth; no real mitigation happening
V: new religious groups preach equality;
people do not respect leaders anymore
because some leaders have shown
‘unjust’ behaviour; needed: moral
education in schools, mosques and
churches
no/less NGOs in the community W: ‘nobody seems to care about us’
O: the community does not sell itself and
is difficult to reach
L: chiefs try to take initiatives to attract
NGOs (e.g. the visitors centre) and some
NGOs have responded positively, e.g. the
Pentecostal church
Fulani causing problems L: this really is a matter for the chief and
the Fulani leaders to solve, but chiefs are

62
in connivance and don’t want to interfere
Cultural
loss of traditional customs/festivals Not specified
indecent clothing and bad behaviour by
youth
O: mitigation needed by church, mosque
and school education
if ladies migrate they bring back
problems.
L: girls should learn a profession;
MASLOC helps
A+W: the vocational school (also for
girls) helps
Very few, if any, of the negative trends were directly attributed to ‘projects’ or to the
activities of external agencies. Many of the negative trends are perceived as
developments that happen anyhow and mitigation measures are either not part of
discussions in the community, or formulated in general terms (education; or churches
and mosques should do it). In the realm of natural resources, where many trends were
seen as rather negative, the Ministry of Agriculture and some NGOs did and do take
initiatives to mitigate some of the undesired trends, but often the legal authority to
interfere lacks, and/or chiefs do not implement measures with the authority they have.
As one group formulated it, ‘they are in connivance’. In other domains, government
agencies, like the clinic, or the cleaning service simply lack the manpower to deal
with all the demands, although recently NGOs have become more active, and mosque
and church leaders and communities are becoming more active. Some groups blame
‘lack of attention’, and ‘neglect’ by outside agencies, and see this as a continuation of
a very long process. Others also blame the very passive attitude of the community
itself, and the lack of initiatives by leaders to counter tendencies that many refer to as
unwanted.

63
~7~
Best and worst projects
On the third day of the workshop, we asked each workshop group to choose and rank
five best and five worst projects from the list they had assembled on the previous day.
For each of the best and worst projects the groups indicated why they appreciated or
disliked these projects so much. For each of the five best and worst projects that the
groups had selected, the workshop participants were asked to indicate what their ideas
about each of these projects were at the start of the projects and at present. With this
exercise we tried to find out more about the processes behind success and failure of
the development interventions that have taken place in the area. Not all workshop
groups could do these exercises properly, so we work with what we have.
This chapter starts with two descriptive tables listing the best and worst projects as
judged by the different groups. At the end of this chapter, an analysis of the best and
worst projects by agency, sector and group type is presented.
In most cases, the groups included concrete interventions by clearly identifiable
agencies in their list of best and worst project. In some cases, however, more generic
interventions were chosen, such as ‘boreholes’, ‘schools’, ‘farming’. To determine the
agency involvement in these cases, we checked from the list of projects which
agencies had been active in these broader categories of interventions (but specific for
that workshop group).
Table 7.1: Best projects
Project Group Rank Reason(s) why project was judged
positively
Policlinic/Daboya
Hospital (24 points)
Officials 1 “The clinic is benefiting many people both in
Daboya town and surroundings, which is not
the case for other [best] projects like
electricity and communication”

64
Project Group Rank Reason(s) why project was judged
positively
Local
leaders
1 “Health is life - without health one cannot
farm”
Historical expectations, when the project was
initiated: “Considered very important as it
would save our lives. Reduce travelling time
and costs, especially when women are to give
birth. Was intended to serve the whole
community (around Daboya town). Our
pregnant women would now go there for
check-ups”
Current observations: “Rooms are not
sufficient; would need expansion. Extra
medical assistance needed. After the
introduction of health insurance the poor
cannot pay anymore for the medical services.
Lack of drugs. Lack of qualified doctor to
operate”
Artisans 1 “Easy access to healthcare + ambulance
services + ethnic diversity”
Historical expectations, when the project was
initiated: “Thought all their health problems
were going to be solved and that some of the
indigenes will be employed to work there.
They also thought more nurses and medical
doctors were to be posted to the clinic”
Current observations: “No medical doctor and
the number of nurses not adequate and does
not solve all health problems because some
cases are referred”.
Women 1 “Health is important for everybody”
Historical expectations, when the project was
initiated: “I wont' send my child to far away
places since our community has a hospital of
its own. Reduce the distance I have to walk
for treatment”
Current observations: “I do not have to walk
long distance any longer; however I have to
pay. The hospital provides drugs for treatment
of diseases but not any longer for free”.
Remark by the facilitators: NHI has helped in
reducing the amount of money paid so it is
now manageable.

65
Project Group Rank Reason(s) why project was judged
positively
Villagers 2 “When there is better health you can work;
when there is no health you can’t do much”
Historical expectations, when the project was
initiated: “Everything was for free, everyone
would be enjoying”.
Current observations: “NHI is good, but
excludes certain people from attending the
clinic (the poor and very poor). The average
wealth group benefits the most from the
clinic, as in that group there are also the
workers of the clinics who are automatically
covered with NHI, thus they do profit the
most from it compared to the past”.
Officials 3 “Boreholes eliminated water-borne diseases,
fetching distance reduced. Created
employment for women who collect water”
Local
leaders
3 “River water was giving diseases. Good
drinking water is life”
Historical expectations, when the project was
initiated: “Reduced walking distance from
community to river. Expected that it would
reduce guinea worm and bilharzia
infestation”.
Current observations: “Taste of the water is
salty - not nice. Some complain and still go to
the river. Water-borne diseases have reduced.
Pray for other places around Daboya also to
get boreholes. Now they pay bills to use the
boreholes”
Boreholes
(mechanised) (15
points)
Artisans 2 “Eradication guinea worm + Bilharzia + other
water borne diseases”
Historical expectations, when the project was
initiated: “Thought the water was to be
provided for free and all areas connected”.
Current observations: “The provision of water
is paid for and it has not covered the whole
community”.

66
Project Group Rank Reason(s) why project was judged
positively
Villagers 1 “Better health, as easier to access drinkable
water; easier to farm” (also for dams)
Historical expectations, when the project was
initiated: “people were happy as the water was
closer and better quality; everyone could
easily use it”.
Current observations: ”It is still important,
even if in some communities you need to pay
to fetch the water, thus some groups like the
poor and the very poor cannot afford it”.
Officials 2 “Without electricity the whole town is down.
No lights, the mechanized boreholes don't
work, no communication possible, policlinic
would not function (storing medication etc).
Many projects depend on electricity, many
people benefit from it (e.g. entertainment,
economic activities)”
Local
leaders
4 “Electricity is needed to get water. Electricity
is good for keeping medicines in fridges”
Historical expectations, when the project was
initiated: “There would be light for all and
reduced drudgery for women to grind grains
by hand. Good for health to store medicines in
a fridge and have light in the hospital to help
patients also in the dark. It would provide jobs
to people in the community”
Current observations: “We became so used to
it that when lights are off nothing happens (no
cooking). Music and dancing, with noise
brought to the community. Electricity can be
dangerous and can give a shock to children.
High costs of bills, which cannot always be
paid by the poor”
Electricity (10
points)
Artisans 3 “Electrification brought about introduction of
mobile communication + Improved trade such
as sale of [cooled] sachet water”
Historical expectations, when the project was
initiated: “Thought it was going to improve
standards of living through improved
economic activity and provision of other
social amenities”.
Current observations:”Ideas the same as
during introduction”.

67
Project Group Rank Reason(s) why project was judged
positively
Villagers 5 “Improved communication; better working
conditions (fans, a/c); storing drugs in clinics;
storage of food; grinding seeds - mills; (even
if it is not any of the communities of the
participants, they do profit from the proximity
of electricity in Daboya)”
Historical expectations, when the project was
initiated: “Everyone was hoping and
expecting to benefit, thus everyone subscribed
for electricity without thinking about money-
matters”.
Current observations: “Today the poor and
very poor are missing out because they
couldn’t afford to pay for subscription”.
Women 2 “It educated our children”
Historical expectations, when the project was
initiated: “It would bring civilisation; children
don't have to walk long to go to school. They
become enlightened and learn to read, to write
and to count. They can read letters for their
parents and understand the bills of the
hospital”.
Current observations: “Education is
expensive. As the child progresses to JSS, the
money problems become big. They have to
pay for the books, the uniforms and school
fee; this was different in earlier times”.
Remark by the facilitator: Mostly women pay
school fees; men show no responsibility.
Education in general
(7 points)
Villagers 3 “Education, more jobs, [becoming] more
social through education; exchange of
language improved trade”
Historical expectations, when the project was
initiated: “Before only the very rich, rich and
average wealth groups could have afforded to
send children to school in Daboya village”.
Current observations: “People are happy
about the new schools in their villages, since
more children can attend”.
Mobile phone
technology (4
points)
Officials 4 “90% [of the local people] are [now] using
mobile phones. Those who don't come to use
the phones of those who do. Communication
is very important”

68
Project Group Rank Reason(s) why project was judged
positively
Artisans 4 “Connects community to the rest of the world
and improved trades such as customers
negotiating prices through the phone +
Employment for recharge cards sellers + Unit
transfer services” (mentioned Tigo
specifically)
Historical expectations, when the project was
initiated: “Thought it was to cover the whole
Wasipe traditional area”.
Current observation: “It does not cover all
communities in Wasipe”.
Global 2000
Farming project
Sasakowa (4 points)
Loc Lead 2 “Farming is a priority in this area”
Historical expectations, when the project was
initiated: “Expected better yields and
increased food security and sufficient
fertilizers for all farmers. People were afraid
because it was brought by the Government of
Ghana and they thought they would be
arrested if they did not pay back the credit”
Current observations: “It has increased yields.
[Farmers} still use new techniques for sowing
and preserving. Credit problems for some;
others managed to pay. Helped them to pay a
depot for the community. Should be
implemented again”.
Water projects in
general (3 points)
Women 3 “Water brings life”
Historical expectations, when the project was
initiated: “Before boreholes and pipes we
used and drank the river water but now we
would drink clean water. (Our educated
children told us that river water is not pure
and not good for drinking)”.
Current observations: “River water was / is
free of charge; for the bore hole water I have
to pay. On the other side we don't have to
walk far for it. It also is good and safe
drinking water”.
Remark by the facilitator: The women do not
regret it that they have to pay.

69
Project Group Rank Reason(s) why project was judged
positively
Villagers 4 “Easier transportation; link with the urban
centres and the community themselves; easier
to sell goods”
Historical expectations, when the project was
initiated: “People were happy, as they were
hoping that the road would improve
transportation”.
Current observations: “People are still happy,
but those with a means of transport benefit the
most, some poor and very poor are profiting if
they have a bicycle or else they have to walk;
development of markets: the very rich benefit
the most as they are the traders”.
Feeder roads (3
points)
Women 1 “It made transport possible; it links them up to
the rest of the world”
Historical expectations, when the project was
initiated: “We were very happy because we
thought that it would link us to far-away
places. We expected that the road would be
tarred to increase the number of commercial
and private vehicles that travel on it”
Current observations: “The road is good but
transport fares are expensive. The road has
linked us to other areas but travelling is still
difficult, especially in the rainy season
because then there would be many pot holes
in the road, and the trucks and lorries wouldn't
come”.

70
Project Group Rank Reason(s) why project was judged
positively
Farming projects in
general (2 points)
Women 4 “It helps to provide food to the family”
Historical expectations, when the project was
initiated: “We thought that we would get
income from farming because there would be
a surplus to sell and that the yield would
increase. Than we would have food to eat and
to sell”.
Current observations: “We have an income
but not as much as we expected we would
have. We have to pay for the seeds and the
fertilizer. This money we don't have and first
have to borrow. We borrow the seeds and pay
seeds back from our harvest. And we have to
pay for the ploughing and the other inputs.
When the yield is not that good we don't have
enough money to do so”.
Remark by the facilitator: The seeds to be
'paid back' can be a big part of the harvest; the
quantity for eating is than reduced. The seeds
are normally maize, soybeans. Also cassava is
planted.
Remark by the author: the women did not
include any crop development project in their
earlier list of initiatives; so this comes a bit as
a surprise.
Wulungu education
projects (1 point)
Officials 5 “[Although] only affecting a few”
Gate/Equall
education project (1
point)
Artisans 5 “Enlightenment on the need to educate the
girl-child + Increased school enrolment +
Employment for the youth through
engagement as pupil teachers”
Historical expectations, when the project was
initiated: “Thought the NGOs were going to
operate in the community forever”.
Current observations: “Project ended
sometime ago”.

71
Project Group Rank Reason(s) why project was judged
positively
Tsetse control
activities (1 point)
Local
leaders
5 “If not prevented it can make people very
sick, and bring other diseases”
Historical expectations, when the project was
initiated: “Expected that the incidence of
sleeping sickness and blindness would
reduce”
Current observations: “Project was successful
because it has met expectations. Reduction [
of tsetse flies] has also restored the cattle
stock”.
Remark by the author: The local leaders (or
anyone else) did not include tsetse eradication
among the list of projects, although it had
been mentioned earlier as one of the things
that had happened in the general history of the
area, although long ago (1950s). It is a bit of a
surprise to find it here among the ‘best
projects’.
Table 7.2: Worst projects
Project Group Rank Reason why project was judged negatively
Off 1 “Located at the wrong place, swampy, when it
rains, it cannot be used”
Toilets (public
and/or private)
(13 points) Art 3+4 Public toilets: “It is very closed to the hospital
with bad odour + unused in the rainy season
because it is a waterlogged area”
Private toilets: “Produces bad odour especially
during the rainy season which has serious
public health issues”
Original expectations: “They knew it was not
going to be useful because it is sited at a
waterlogged area”. For the private toilets:
“Thought every house was going to get it and
that it will not produce bad odour”.
Current observations: “Same as when it
started”. For the private toilets: “Only 30
houses benefited and bad odour is being
produced by the toilets”.

72
Project Group Rank Reason why project was judged negatively
Wom 3 “They are not cleaned; people don't use it”
Original expectations: “They don't have to
walk outside the village and the number of
snakebites would reduce (especially during the
rainy season). We would be able to offer our
visitors a toilet”.
Current observations: “we did not know we
would have to pay for cleaning and because of
non-payment the toilet has collapsed which has
resulted in unsanitary conditions”.
Off 2 “Not being used as such”
Loc
Lead
2 “Area council should have taken revenue for
the community to invest in development of the
community, which they haven't done. They
have not done any work so far. Only promises”
Art 5 “It is not being used for the intended purposes”
Original expectations: “Thought that workers
were going to be employed there + income +
development to the community”
Current observations: “It is useless because it is
not being used”.
Area Council
(building) (10
points)
Wom 5 Building is not used for the original purpose;
still it is sometimes used for lodging people”
Original expectations “We were happy because
we thought that it would boost development,
and it would make revenue collection easy
since all traders would go there and pay their
market tolls”.
Current observations: “It is not functioning
because there is no market place and hardly any
transportation (to get money from). The area
council has no income. The revenues, which are
collected are sent to Damongo. They profit
from it!”
Loc
Lead
3 “No sustainable impact (implemented in the
1970s). Veterinary officers did not come to
stay. No control of meat slaughtering around”
Animal
health/veterinary
services (7 points)
Art 2 [ The old veterinary quarters are being] used as
toilet because it is uncompleted + poses serious
sanitary issues”
Original expectations: “Thought veterinary
officers were to be posted to the area”.
Current observations: “It is useless because it is
not being used”.

73
Project Group Rank Reason why project was judged negatively
Roads (5 points) Loc
Lead
1 “Roads are in bad condition and are not being
maintained and repaired”
Culvert on the
Daboya-Bosonu
road (5 points)
Art 1 “It is now a death trap and makes road
‘unmotorable’, especially during the rainy
season. Community cut off from other
communities during the rainy season due to
construction of that uncompleted culvert”
Original expectations: “Thought it was going to
boost economic activities by linking the
community to other communities”.
Current observations: “It has created more
problems because before the construction cars
could used it even in the rainy season but now
no longer!”.
Old market (5
points)
Women 1 “Building has collapsed, is not being used”
Original expectations: “They thought to have a
place were they could sell their produce and
that the community would make profit and have
benefits from the market”.
Current observations: “When the market was
there, it was good but now it has collapsed
because of the floods. They don't benefit any
longer from it. Since there was not much selling
and buying in the market (due to the bad roads)
they didn't earn enough money to pay the
revenue officers their fee. This means that there
is no money at this moment to rebuild the
market”.
New cassava
variety (5 points)
Vill 1 “It is not used for food; no market for it”
Original expectations: “Everyone was happy
about the new variety when it was introduced;
especially the poor who were hoping for a new
source of income”.
Current observations: “Because there is no
market, farmers can’t sell. The most affected
are the poor and the very poor, as the very rich,
rich and average do not care that much about
the difficulty to sell”.

74
Project Group Rank Reason why project was judged negatively
Bridge (4 points) Women 2 “Has collapsed and people can not use it”
Original expectations: “The bridge would ease
travelling. People would have access to the
place; people from Daboya would travel easily
for commercial activities”.
Current observations: “The bridge collapsed
and as a result we are cut off. We have to travel
long distances to nearby villages because the
bridges connecting the roads to these villages
can't be used during the rainy season”.
New variety of
cows (4 points)
Vill 2 “Destroying the farms; spoiling the land; used
to be fed with salt which is not here anymore so
difficult to keep it”
Original expectations: “Only rich men benefit
from cows, as they are the ones who can afford
to buy cattle”.
Current observations: “Indeed, only rich men
benefited from the cows, as they are the ones
who could afford to buy cattle”.
Cashew projects (3
points)
Vill 3 “No market for it, difficult to weed it; requires
use of fertilizer”
Original expectations: “Everyone was happy
when the new variety was introduced;
especially the poor who were hoping for a new
source of income”.
Current observations: “Because there is no
market, farmers can’t sell; the most affected are
the poor and the very poor, as the very rich and
rich and average do not care that much about
the difficulty to sell”.
Magistrate’s
building (2 points)
Women 4 “Is not functioning for anything”
Original expectations: “We were happy that
there would be administration of justice.
Nobody would be able to cheat us. It gave a
feeling of security”.
Current observations: “The magistrate court
has collapsed because of the floods. Since now
the police station is performing a similar
function so we do not see its relevance any
longer”.

75
Project Group Rank Reason why project was judged negatively
Beekeeping (2
points)
Vill 4 “It is costly to get a hive and clothing and all
the necessary equipment; transportation
difficult to the nearest market”
Original expectations: “Everyone was happy as
it was an innovation and new, especially the
very poor as they were the ones who were given
the hives”.
Current observations: “Because of high costs,
the very poor and poor cannot afford the
keeping of hives any longer; the poor used to
use honey to pay for some services in kind”.
Soy beans (2
points)
Loc
Lead
4 “No sustainable impact. Seeds came too late.
Bad seeds”
Rest Home (1
point)
Loc
Lead
5 “Poor management so that it is now out of use
(built in 1963)”
Teak forest (1
point)
Vill 5 “Difficult to get seeds and prevent bush fires;
problems with transportation of the seeds; no
forest officials to train people on maintenance”
Original expectations: “People were hoping to
receive electrics poles, rafters, etc – they
thought it would bring lots of profit; the rich
could have afforded to keep the plantations in a
proper shape”.
Current observations: “The poor are now
suffering, as they were hoping to get something
out of it, but now only the rich people can
benefit from and afford the plantations”.
The groups’ choices of best and worst projects, and the motivation of these choices,
give a very insightful impression of the criteria the people used to judge the
interventions. Like in other PADev research areas best projects seem to be projects
that have (1) continuity; (2) a wide impact; and (3) equal access. Worst projects seem
to be projects that (1) have a short life-cycle (discontinued before they have had a
positive impact); (2) are poorly managed or implemented; (3) have unequal access or
benefits; (4) are not geared towards the needs of the people.
If we look at the best and worst projects mentioned, there is some overlap between
groups, but not a lot. Also the assessments between the five PADev groups seem to
differ. For the ‘officials’ in the area (the people with salaried jobs, many of whom
working for a government agency), their ‘urban’ position becomes clear if we look at
their choices of best and worst initiatives: they put a lot of emphasis on the impact of
the health clinic, the introduction of electricity and the quality of water provisioning,
while they dislike the bad state of the sanitation projects in Daboya Town and the

76
malfunctioning of the Area Council and its building. For the local leaders (chiefs,
major shopkeepers in town and influential farmers) the health clinic was also most
successful, followed by the agricultural activities of ‘Global 2000’ and the
improvement of water boreholes. They very much dislike the state of affairs in road
maintenance and - like the officials – they are disappointed by the Area Council and
its building. Many of them have cattle and they mention the bad state of the animal
health services as their third worst type of project. The artisans in Daboya (many of
them active in the production of smocks) share the positive assessments with the
officials, but they have another combination of initiatives which they dislike: the bad
state of the roads features prominently, followed by the bad state of veterinary care
and the smell of the public and private toilets. The women’s choice for ‘best projects’
is also health first, but followed by educational projects and better boreholes. They
very much disliked the state of the old market building (women are the ones spending
a lot of time there), the collapsed bridge and the malfunctioning toilets. The people
coming from the villages around Daboya shared the same ideas about ‘best projects’
with the women from Daboya, although in a different order. However, their choice of
‘worst projects’ showed their rural and agricultural orientation: they criticized the
government for the way they had introduced new cassava and cashew varieties as well
as the teak forest; they criticized an NGO for the way it had introduced a beekeeping
activity and they were very critical about Fulani herders, who had introduced a new
type of cattle, which had, according to them, created a lot of problems in the area.
Tables 7.3 and 7.4 present a condensed overview for all groups together. As we have
looked at the ‘most likely candidates’ for projects under generic headings
(‘education’) there are often more projects included under a ‘best’ (and a bit under
‘worst’) project assessment. The number of projects per sector in the table shows the
total that we have included, and the number of times groups have mentioned these
projects (specifically or as part of a generic ‘type of projects’). We also indicate
which type of agency was responsible for these ‘best’ or ‘worst ’scores. We then
show the number of different groups mentioning a particular sector among the ‘best’
or ‘worst’ projects. And finally we give a gross and net score per sector, whereby a
project mentioned as ‘best number 1’ or ‘worst number 1’ gets five points and ‘best
number 5’, or ‘worst number five’ one point. Gross refers to the total times projects
have been assessed as among the best or the worst by all groups; net refers to the
group scores as such.
Table 7.3: Best projects, according to five PADev groups in Daboya
Sector Nr % Gov G+S/
G+S
+L/
G+L/
S
G+C C/
C+L
N P Nr of
group
scores
Nr of
different
group
assessments
Gross
score
Net
score
Education 25 56 5 2 1 7 10 - 28 4 87 9
Health 2 10 2 - - - - - 5 5 24 24
Infrastr. 8 38 6 - - - - 2 9 4 21 11
Energy 2 40 2 - - - - - 4 4 10 10
Water 16 73 5 3 - 3 1 - 22 5 78 18
Crops* 1 5 - 1 - - - - 2 2 4 4
Nature* - - - - - - - - 1 1 - -

77
Total 54 30 20 5 1 10 11 2 68 22
* The women gave a generic assessment of ‘fourth best project’ to farming projects in
general, but in their earlier list of projects no specific farming projects had been
included; the same is true for tsetse eradication (under nature), which was not
included by the local leaders among the list of projects, but now featured as the fifth
best project.
Gov = Government (includes District Assembly, and specific government
departments); S= supranational agencies; C= Christian NGOs; N = Non-religious
NGOs; P=private (corporate) sector; L= local (individual initiators or local groups
of people working together).
Table 7.4: Worst projects, according to five PADev groups in Daboya
Sector Nr Gov S+G G+L N L Nr of
group
scores
Gross
score
Net
score
Sanitation 2 2 4 13 13
Infrastr.
roads
3 3 3 14 14
Infrastr.
buildings
4 4 6 13 13
Livestock 4 2 1 1 4 13 13
Crops 4 3 1 3 13 10
Business 1 1 1 5 5
Forestry 1 1 1 1 1
Total 19 15 1 1 1 1 22* 72 69
*One group (the officials) only scored two projects as ‘worst projects’); hence the
total is not 5{5+4+3+2+1}=75 but 6 less. In one case a score was given to a project
that appears twice in the list; that explains the difference between gross and net score.
Gov = Government (includes District Assembly, and specific government
departments); S= supranational agencies; L= local (individual initiators or local
groups of people working together).
Summary of the findings
The workshop participants were generally very positive about the (few) health
projects and about the various education and water projects. However, the two
sanitation projects in Daboya town got a very negative assessment. People were
ambivalent, and in fact quite negative about the infrastructural projects: the bad roads,
culverts that were never finished, the bridge that collapsed and was never repaired,
some government buildings that were never finished, or never used for what they
were supposed to do, or that were abandoned and then collapsed. On the other hadn
the electricity and mobile phone infrastructure was very much appreciated. It is
interesting to see how little appreciation there was for project that were meant to
improve agriculture, livestock, forestry or business development.
If we look at the various agencies responsible for the implementation of certain
projects, we can see that almost half the projects that were seen as among the best
were implemented by NGOs (half by Christian NGOs and half by non-faith based

78
ones) and a bit more than half by government agencies, some of those assisted by
supranational donors, or ‘hybrid’ forms of collaboration. If we look at the projects
with a negative assessment, the ‘worst projects’, with one exception we only see
government projects. As an overall conclusion we may formulate that the workshop
participants were relatively critical about government agencies. In the discussions
they were particularly critical about the Ministry of Agriculture and the District
Assembly.
Earlier we have seen that the workshop participants listed a total of 181 different
‘projects’. The majority of those were initiated by government agencies, either as
solitary agencies, or together met supranational/donor agencies (S) or in some kind of
hybrid form, often with local communities and/or with the involvement of a non-
governmental agency. Together these were 103 out of the 181 initiatives (57%). The
various non-governmental agencies (Christian, C, or Muslim M, or Non-faith based,
N) initiated a total of 69 projects (38%). The remainder were some initiatives by the
private sector (P) or by local individuals or groups (L). We have seen that among the
‘best’ initiatives there were specific projects, but there were also quite some generic
interventions, particularly in education. Among the ‘worst projects’ almost all were
specific initiatives. Among the ‘best projects’ more were generic, and hence there are
more scores for ‘best projects’ in the various tables. If we look at the frequencies and
the vertical percentages (tables 7.5 A and B) it is clear that government projects show
a relatively high score for ‘worst projects’, but also many appreciated initiatives,
while for the non-faith based NGOs and the private sector (but these are few, and only
in the telecom sector) the workshop participants saw many of their projects as highly
appreciated. If we look at the horizontal percentages (table 7.5.C) this is even more
clear: despite the critical attitude of the workshop participants towards the
government (among the ‘worst projects’ the majority was initiated by a government
agency) the government has an average score for ‘best projects’. Again it is clear that
relatively many of the initiatives by non-faith based agencies were highly appreciated.
The tables also show that relatively many of the project initiated by the Christian and
particularly the ones initiated by the Muslim agencies in the area were judged to be
‘middle of the road’: neither very much appreciated, nor very much criticized.
Table 7.5: Best, worst and other projects, by type of agency
A: frequencies
Gov G+S G+oth C M N P L Total
Best 22 3 4 10 - 11 2 - 52
B+W 1 1 - - - - - - 2
Worst 13 - 1 - - 1 - 1 16
Other 41 11 6 30 8 9 1 5 111
Total 77 15 11 40 8 21 3 6 181
B: vertical percentages
Gov G+S G+oth C M N P L Total
Best 29 20 36 25 - 52 67 - 29
B+W 1 7 - - - - - - 1

79
Worst 17 - 9 - - 5 - 17 9
Other 53 73 55 75 100 43 33 83 61
Total 100 100 100 100 100 100 100 100 100
C: horizontal percentages
Gov G+S G+oth C M N P L Total
Best 42 6 8 19 - 21 4 - 100
B+W 50 50 - - - - - - 100
Worst 81 - 6 - - 6 - 6 100
Other 37 10 5 27 7 8 1 5 100
Total 43 8 6 22 4 12 2 3 100

80
~8~
Perceptions of wealth and poverty
One of the objectives of the Participatory Assessment of Development project is to
learn more about local perceptions of the differential impact of development
interventions on different wealth groups. Which types of interventions are most
capable of reaching the poor and very poor? Before we asked the workshop
participants to express their views on project impacts, we first needed to investigate
local perceptions on these wealth groups. Are there specific names/labels for these
groups in the local language (Dagonja)? How do people in Daboya distinguish the
poor from the rich? Which criteria do they use? What kind of people belong to the
different wealth groups? Most research dealing with local perceptions of wealth and
poverty use three categories (poor, average, rich). To achieve a higher level of
nuance, we used five categories (very poor, poor, average, rich, very rich).
We also asked how the wealth groups were distributed in the workshop participants’
communities. To answer this last question, the workshop participants were asked to
distribute twenty stones among the wealth categories, each stone representing five
percent of the community’s population.
Table 8.1 describes the local perceptions of wealth and poverty in detail; table 8.2
gives a schematic overview of the characteristics of wealth groups; and table 8.3
shows the local perception of the distribution of wealth categories in the participants’
communities.
EM = Elderly Men; EW = Elderly Women; YM = Young Men; YW = Young
Women; O = Officials
Table 8.1: Local perceptions of the characteristics of five wealth categories

81
VERY RICH
In the local language:
O: Asowura/
Amasherwura
EW: Amasurinwura
EM: Dama-wura
YW: Amanshiribi-
Wura
YM: Damawura
Who: O: businessmen and women; EW: big trader of farm
produce and animals; EM: trader; has special prayer at
mosque; YW: big-time farmers, animals owners and traders
at the same time; paramount chief and smaller chiefs; YM:
big commercial farmer; big businessman.
Characteristics:
Livestock: O: > 100 cattle; EM: Has at least 1000 cattle;
YW: uncountable cows, goats and sheep; YM: have cattle;
Food: EW: enough to eat and provide for others as well;
EM: can eat 3 meals a day, and even more (drink tea and
prepares snacks); eat at anytime they want;
Housing: O: block houses; EW: More than 1 house; EM:
Has many houses; YW: on average five nice houses: three
in Tamale, two in Daboya; YM: have compound houses for
family and renting for others;
Transport: O: tractors and other vehicles; EW: tractor(s);
car, motorbike, bike; EM: Has cars/tractors; YW: 5 tractors,
cars, trucks, many motor bikes; YM: have lorries;
Education: EW: children continue in higher education; YM:
ability to educate children to tertiary education; highly
educated person and shares his knowledge with others;
Social support: YW: has sympathy for people; demands
respect; shares his food with the community during
Ramadan; supports the community with the tractors; for the
end of Ramadan, he will kill a cow;
Other: O: “he has got everything”, money, children (but not
too much dependent on family size), long life, way of
dressing (but not always); EM: many children, who also
own property, cars and tractors; has physical cash; YW: -
has many wives (5 -> 3); plenty of children; visited Mecca
twice; uncountable number of dresses; YM: have large
family.

82
RICH
In the local language:
O: Damawura;
EW: ?;
EM: Aso-wura;
YW: Asuwura
YM: Ekogin
Who: O: businessmen, (successful) farmers; EW: Chiefs,
landlords; YW: traders, river chief (terra wura) and land
chief; YM: have sizeable farmlands; government workers
with high wages; government workers who are also traders.
Characteristics:
Livestock: O: cattle ca 50; EM: has cattle 200-300; YW:
some cattle (3-5)
Farm / land / harvest: EW: big farmland
Food: EW: plenty of food for family; EM: eat 3 times a
day, and at anytime they want; YW: can feed around 20
people (all family) throughout the year; YM: has enough
food for himself and his family;
Housing: EW: completed building as a house; EM: has a
number of houses; YM: have a house for himself and the
family;
Transport: O: (often) has a car, but is not necessary to be
rich; EW: (has own) means of transport; YW: can buy a car;
YM: have no lorries; YM: have one or two vehicles
Education: YM: ability to pay his children’s school fees up
to the secondary level;
Social support: YW: feel sympathy for people; YM: ability
to help others
Other: O: “almost everything like the very rich”; EM: has
(many) children but less than the very rich; YW: having
money, and is able to borrow; proud; showing off with the
way he/she dresses, talks, walks; always the highest class of
cloths (Holland, GTP, etc); YM: does not depend on
anybody; have a buffer capacity.

83
AVERAGE
In the local language:
O: Enu du portor
portor
EW: Bakoso (“not a
word from here so
difficult to use”).
EM: Amashebi-Wura
(Money Rich)
YW: Ebo
YM: Eboo
Who: O: government sector; weavers; young businessmen;
EW: mostly farmers, small businesses, teacher, small
official job; EM: traders and farmers; YW: traders and
weavers; YM: drivers; employees in the government sector,
drawing salary e.g., teachers; petty traders or self employed.
Characteristics:
Livestock: YW: only fowls, goats and sheep
Food: EM: can eat 3 meals a day, and even more (drink tea
and prepares snacks); YW: will never go out to eat; what
she/he has is enough for him/her -> self-dependent; can feed
5 people out of the whole family from his farm products
throughout the year; YM: no problem with food to eat;
Housing: EW: has own house
Transport: YW: bicycle, motorbike;
Education: EW: children can complete secondary
education;
Other: EW: (has) mobile phone; this group was often seen
as the same as the poor. EM: Has only physical cash; has no
children; YW: he/she is OK; can wear the average quality
cloths; can borrow but not much (till 10 GHC); - income up
to 300 GHC if a trader; YM: does not borrow money from
others; not a criminal; does not work on other people’s
farm; has cloths to wear but limited; has a secure livelihood

84
POOR
In the local language:
O: Etripo;
EW: Etripoo;
EM: Kpakpa-Wura
YW: Etiripo;
YM: Etrepo
Who: O: farmers; people selling firewood; EW: single
parents, small farmers; EM: Labourers and farmers; YW:
idem; YM: small farmer; pusher of trucks; cutting and
bringing firewood to town to sell.
Characteristics:
Livestock:
Farm / land / harvest: EW: do not use fertilizer. weedy
farms; cannot hire in labour; YM: does peasant farming;
strong and does work for others;
Food: EW: food is not sufficient for all; EM: eats twice
daily; okro soup with TZ and cassava leaves; YW: finds it
difficult to get food; struggle to feed the family; YM: gets
food to eat but not to a satisfactory level;
Housing: EW: thatched house; they stay in the house; YW:
thatched house; YM: Lives in thatch houses;
Education: EW: Children do not finish school;
Other: O: can provide some very basic means (food, water),
but not adequately; EW: lack of money to go to hospital;
EM: always find it difficult to make a living; can't get things
done instantly, has to struggle for it; YW: many children;
two different sandals on feet or no sandals at all; self-fixed
sandals with straw.

85
VERY POOR
In the local language:
O: Kpakpawura;
EW: Ekulpoo;
EM: Atripo
YW: Etintina-Sipo
YM: Kpakpawura;
Who: O: sells firewood on the head; EW: beggars from the
rich, supported by the mosque; EM: Beggars and no work;
YW: farmers, sellers of fire woods; if beggars, then mostly
handicapped people; YM: jobless/unemployed; beggars;
lazy person.
Characteristics:
Livestock: all groups: none
Farm / land / harvest: YW: ploughs with hoes
Food: O: 1 meal a day; EM: eats what ever he gets; YW:
malnourished; difficult to get food, some are looking for
sympathy from the others; YM: food is always a problem;
Housing: EW: not own house; depending on others - live
with family; EM: can live in a family house; YW: mud
thatched houses, two rooms; YM: no shelter;
Transport: all groups: none
Education:YW: if they have children: cannot afford the
books and school uniforms; cannot afford the school fees
Social support: all groups: the very poor depend on others
Other: O: cannot afford anything; cannot provide his/her
basic needs and for a family; EW: If sick cannot do
anything; if well they can farm; EM: Only depend on others
for theirlivelihood; YW: walk bare-foot; always in the bush
looking for firewood to sell; children are dirty; YM: no
good clothing; no children.
Showing wealth (or poverty) at funerals We spent specific attention (but always probed) on the differences people experience
between funerals of the wealthy and funerals of the poor. In general it should be said
that in Daboya there should be funeral functions on the 3d, 7th, and 40th day and after
one year These are the impressions as given by various groups:
The very rich people’s funerals: EW: chiefs are buried under the big tree in town. People come from many places to
attend. Food is provided for all, even tea in the morning. Other food: TZ, fufu, meat,
soda drinks. A lamb is offered as part of the ritual. Food is prepared at home. People
are dressed in beautiful clothes;
EM: The normal performance is to slaughter a ram and some traditional foods such,
as masa, for every funeral. The number of animals would be many. His family would
kill animals to take care of the large number of visitors who would come. A lot of
poor people would go to get the money that would be shared. Food is also prepared
for the people. Food such as rice in take away containers is also provided;
YW: plenty of people and plenty of food, TZ in the morning and in the evening for
everyone; slaughters a cow for the 3rd, 7th and 40th day after death; cook rice for take
away for sympathisers for the 3rd, 7th and 40th day after death; print t-shirts and
prepare cloths for sympathisers; hire entertainment groups: singers/dancers; provide
drinks: beer, coca-cola, fanta, minerals and pure water; delaying the burial, as it is
also a source of money;

86
The rich people’s funerals:
YW: - also very rich funeral, like the very rich, just in stead of slaughtering a cow at
each occasion, they are slaughtering one cow and a sheep for the following days;
prepare TZ, but no "take aways"; also prepare t-shirts and uniforms, just lower
quality; can buy some dance groups and music (if he/she belongs to a dance groups
they will attend and perform);
The average people’s funerals: EM: the same as with the rich, but with less people and less food. Sometimes they
have to borrow money to afford the funeral and pay back later. Often ice water instead
of tea and sodas;
YW: on the 3rd day there is nothing to eat; 7th day they will slaughter a sheep; no
uniforms; not much food, unless the family will support; no music 0r dances (if he/she
belongs to a dance groups - they will attend and perform); can provide pure water for
sympathisers, but not much more;
The poor people’s funerals:
EM: Only the traditional requirements of providing a ram; traditional food is
prepared. The number of people attending such funerals is low hence everything is
prepared in small quantities;
YW: less people attend funerals; family members will have to contribute to the
funeral; small food will be provided if the family will support; only TZ; do not
slaughter any animals;
The very poor people’s funerals:
EW: for the very poor the family or the community organises the funeral. It can take
longer before the funeral takes place because of the time it takes to raise money. Less
people, less food. They go out to buy food;
EM: same as for the poor;
YW: if a very poor man or woman dies and has no family, people will bury him/her
fast and during the day; mostly no funeral rite;
Below, the findings on the type of people belonging to the different groups are
summarized and the characteristics of wealth and poverty are discussed. There was
quite some debate in the Daboya workshop about the various words to use to describe
the very poor, and no agreement about the correct spelling of these words. After,
sometimes heated, debate most people would agree on the following words and major
characteristics.
Wealth classes Daboya summary, agreed after a general discussion
Very rich: Aso-wura (‘all rich’/rich in every respect in Dagonja language)
Who: large-scale farmer, food and livestock trader, big business
� owns several vehicles and houses, including in Tamale. Large family, plenty
of cattle. Has gone to Mecca for the haj. “Has got everything in life”.
Rich: Amashirbi-wura (money rich)
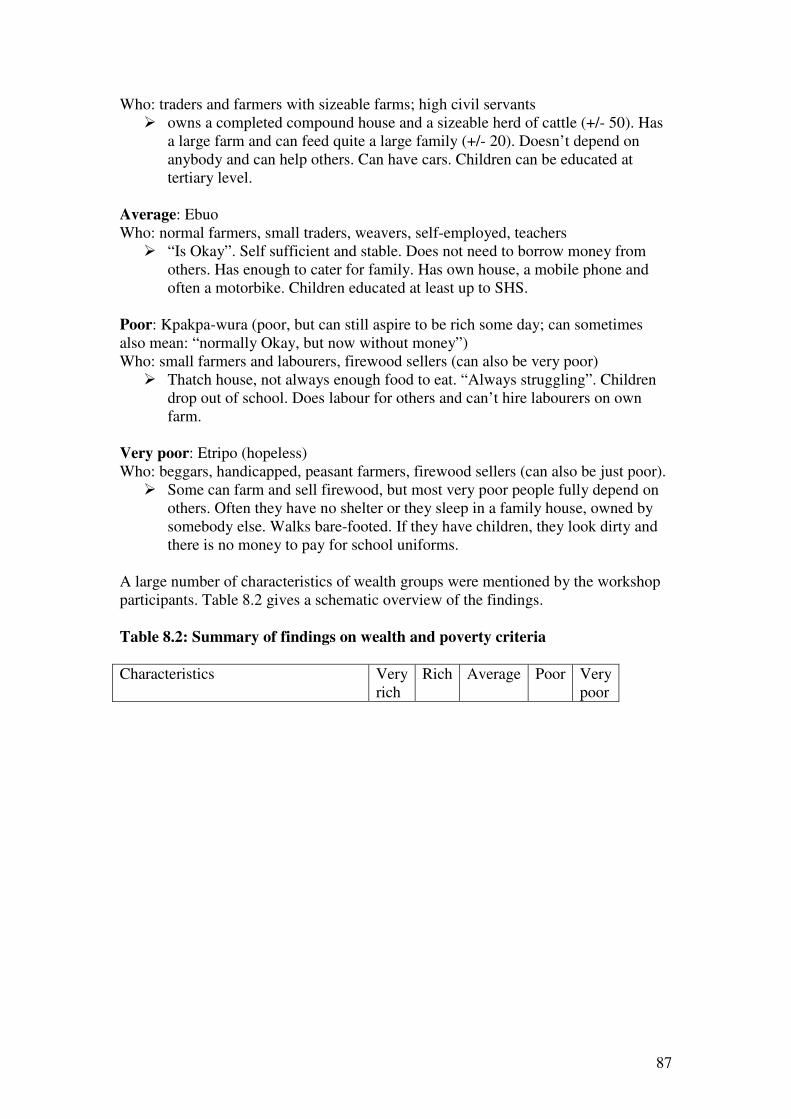
87
Who: traders and farmers with sizeable farms; high civil servants
� owns a completed compound house and a sizeable herd of cattle (+/- 50). Has
a large farm and can feed quite a large family (+/- 20). Doesn’t depend on
anybody and can help others. Can have cars. Children can be educated at
tertiary level.
Average: Ebuo
Who: normal farmers, small traders, weavers, self-employed, teachers
� “Is Okay”. Self sufficient and stable. Does not need to borrow money from
others. Has enough to cater for family. Has own house, a mobile phone and
often a motorbike. Children educated at least up to SHS.
Poor: Kpakpa-wura (poor, but can still aspire to be rich some day; can sometimes
also mean: “normally Okay, but now without money”)
Who: small farmers and labourers, firewood sellers (can also be very poor)
� Thatch house, not always enough food to eat. “Always struggling”. Children
drop out of school. Does labour for others and can’t hire labourers on own
farm.
Very poor: Etripo (hopeless)
Who: beggars, handicapped, peasant farmers, firewood sellers (can also be just poor).
� Some can farm and sell firewood, but most very poor people fully depend on
others. Often they have no shelter or they sleep in a family house, owned by
somebody else. Walks bare-footed. If they have children, they look dirty and
there is no money to pay for school uniforms.
A large number of characteristics of wealth groups were mentioned by the workshop
participants. Table 8.2 gives a schematic overview of the findings.
Table 8.2: Summary of findings on wealth and poverty criteria
Characteristics Very
rich
Rich Average Poor Very
poor

88
Owns a lorry or truck + - - - -
Owns a car + +/- - - -
Owns a motorbike + + +/- - -
Owns a bicycle + + + - -
Owns cattle + + - - -
Owns small ruminants + + + - -
Owns poultry + + + +/- -
Has many acres of farmland + + - - -
Has employees or helpers on the farm + - - - -
Owns a tractor + - - - -
Uses a tractor for ploughing + + + +/- -
Has a place to stay + + + + -
Owns several houses + - - - -
House made with cement blocks + + +/- - -
House roofed with zinc + + +/- - -
Able to support others + + - - -
Children in SSS + + + - -
Children in basic education + + + +/- -
Has access to good health care + +/- +/- - -
3 meals a day + + + - -
2 meals a day + + + + -
Has a family (wife/children) + + +/- +/- +/-
Has a mobile phone + + + - -
Goes well-dressed + + +/- - -
Visited Mecca + - - - -
Works for others - - - + +
Goes bare-footed - - - +/- +
Depends on help from others - - - +/- +
Has to beg in public - - - - +
The findings from table 9.2 could possibly be used in a more dynamic way to monitor
people’s movement in and out of poverty. For example, according to local wealth
criteria one can recognize that a person moves from poor to average if s/he is able to
purchase a bicycle, a mobile phone and small ruminants, if s/he has three meals a day
Conversely, a person moves from rich to average or poor if he loses his/her motorbike
and cattle, if his/her children can no longer attend senior secondary school and if s/he
can no longer afford three meals a day. On health care the groups were not very
explicit; later discussions made it obvious that only people who regularly go to
Tamale or who have a house there (only the very rich) can benefit from ‘proper’
health care. Locally the provisioning of health care is regarded as poor.
When the groups finished their description of the different wealth groups we asked
them to reflect on the distribution of these groups in their communities. The workshop
participants were asked to distribute twenty stones among the wealth categories, each
stone representing five percent of the community’s population. The distribution is
shown in table 9.3 and figure 9.1.
In the last column of table 9.3 an index score is presented for the distribution of
people among wealth groups. Values higher than 100 indicate that the perceived

89
distribution is skewed towards more wealthy people and values lower than 100
indicate that the perceived distribution is skewed towards more poor people, which is
mostly the case. The scores for elderly women are quite different from the others, and
they show a ‘normal distribution’ (as in statistics) with more cases in the middle
groups and less in the extreme groups. However, among all other groups the
perception is that there are considerably more (very) poor people compared to rich
and very rich people. About the very rich all groups agreed, they are only a small
minority (5%) and the elderly women added that in the recent past most of the very
rich local people left for the cities, and those who stayed during a conflict period lost
part of their assets.
Table 8.3: Perception of wealth group distribution in the participants’ communities (%)
Very rich Rich Average Poor Very poor Total Index*
Young women 5 20 20 20 35 100 70
Elderly women 5 25 40 25 5 100 100
Young men 5 5 40 35 15 100 75
Elderly men 5 15 20 40 20 100 72.5
Officials 5 10 20 40 25 100 65
Women 5 22.5 30 22.5 20 100 85
Men 5 10 30 37.5 17.5 100 73.75
Youth 5 12.5 30 27.5 25 100 72.5
Elderly 5 20 30 32.5 12.5 100 86.25
Average (%) 5 15 28 32 20 100 76.5 Median 5 15 20 35 20 95 70
* Index would be 100 if all groups contained 20% of the population; scores < 100
indicate more poor people; scores >100 indicate more rich people. Index = (2 * very
rich) + (1.5 * rich) + (1 * average) + (0.5 * poor) + (0 * very poor).
In chapter 9, the perceived impact of development interventions on the different
wealth groups is discussed. It is good to keep in mind the characteristics of these
groups as described in this chapter. The group of ‘very poor’, for example, is a very
marginal group with very specific problems (physically and mentally challenged,
social outcasts). Helping this group to improve their quality of life would require quite
a specific approach.

90
~9~ The impact of initiatives on wealth and poverty
During the last day of the PADev workshop in Daboya the participants were
presented with a condensed overview of what they earlier had discussed about wealth
levels in their area. Five different wealth classes and their characteristics were the
basis for an exercise in which five different groups had to agree on the impact of the
‘five best’ and the ‘five worst’ development initiatives on the various wealth classes.
Three groups worked with ten stones and for each ‘best’ or ‘worst’ initiative they had
to distribute the stones over the five wealth classes, which they had earlier defined.
The distribution then showed the relative impact per wealth group. Two groups, the
officials and the women, used twenty stones. Table 9.1 gives the results for the ‘best
initiatives’ (“who benefited most and who much less so”) and table 9.2 for the ‘worst
initiatives (“who were hit most”). It also differentiates between ‘then’ (when the
initiative or project had just been finished) and ‘now’.
The best initiatives
Table 9.1 Impact of ‘best initiatives’ on five wealth categories, percentages
Workshop
group
nr initiative Very rich Rich Average Poor Very poor
then now then now then now then now then now
1 clinic 0 0 10 10 20 20 30 30 40 40
2 Global
2000
0 57 10 43 20 0 30 0 40 0
3 boreholes 0 0 20 20 20 20 20 20 40 40
4 electricity 50 50 30 30 10 10 10 10 0 0
5 Tsetse
control
20 20 20 20 20 20 20 20 20 20
Leaders
Subtotal 14 25 18 25 18 14 22 16 28 20
1 clinic 40 40 30 30 20 20 10 10 0 0
2 boreholes 20 30 20 20 20 20 20 20 20 10
3 electricity 20 40 20 30 20 20 20 10 20 0
4 telecom 40 40 30 30 20 20 10 10 0 0
5 Equal
education
20 - 20 - 20 - 20 - 20 -
Artisans
Subtotal 28 37 24 27 20 20 16 13 12 3
Women 1 clinic 15 30 15 25 20 20 20 15 30 10
2 education 10 25 20 30 15 25 20 20 35 0
3 water 30 30 25 25 20 20 15 15 10 10
4 farming 30 35 30 25 20 20 15 15 5 5
5 Feeder
road
30 35 25 30 20 20 15 10 10 5
Subtotal 23 31 23 27 19 21 17 15 18 6
Peasants 1 boreholes 20 40 20 30 20 30 20 0 20 0
2 clinic 20 30 20 30 20 40 20 0 20 0

91
3 schools 40 30 30 30 30 20 0 10 0 10
4 Feeder
road
40 30 40 30 20 20 0 10 0 10
5 electricity 20 40 20 30 20 30 20 0 20 0
Subtotal 28 34 26 30 22 28 12 4 12 4
Officials 1 clinic 5 5 10 10 20 20 30 30 35 35
2 electricity 5 5 10 10 40 30 35 45 10 10
3 boreholes 10 10 15 15 40 40 20 20 15 15
4 telecom 5 5 25 25 55 55 10 10 5 5
5 Wulungu
schools
5 5 5 5 25 25 35 35 30 30
Subtotal 6 6 13 13 36 34 26 28 19 19
Total 20 27 21 24 23 23 19 15 18 10
Perceived current
distribution (see Ch. 8)
5 15 28 32 20
Relative perceived benefit
score (equality = 100)
540 160 82 47 50
Graphic illustration of percentages of perceived benefits per wealth category (blue
colour) and perceived distribution of wealth categories (red colour) (1 = very rich; 5 =
very poor)
Graph 9.1 Perceived distribution of best development initiatives between wealth
groups, compared with their perceived distribution in the population of Daboya
Graphic illustration of perceived benefits per workshop group (1=very rich; 5 = very
poor; percentages);
A Dark blue = local leaders in the area
B Red = artisans in Daboya Centre
C Green = women in Daboya Centre
D Purple = peasants in the villages around Daboya Centre
E Light blue = officials; salaried people

92
Graph 9.2 Perceived impact of best initiatives between wealth groups according to
five different workshop groups in Daboya
The interpretation of the perceived benefits by the five different workshop groups is
not always straightforward. What is immediately clear from the last graph is the
completely different perception of the group of salaried officials: for them the very
rich group hardly benefited and the very poor group benefited a lot. Among the local
leaders the very poor group also stands out as having benefited considerably.
However, in general the perception is that there is a downward trendline: the richer a
group is the more it benefited from those development initiatives that were perceived
to have been the best. This is even more so if we look at the perceived distribution of
the various wealth groups in the area. Relatively speaking the very rich benefited
more than five times more than their fair share in the community, while the poor and
very poor benefited half or a bit less than half of their fair share. The graphs illustrate
the situation during the time of the workshop (“now”). It is interesting to note that the
perception of benefits soon after the projects had been implemented was that these
benefits were more equally spread than currently. Over time there is a (perceived)
shift of benefits to the (very) rich.
Let us focus on the different types of ‘best initiatives’, of which there are eight.
The clinic, or local health centre in Daboya
This was mentioned as among the five best development initiatives by all five
workshop groups, and in four cases even as the most beneficial one. The opinions of
the officials and the local leaders clearly differ from all other groups with regard to
the wealth distribution of benefits. According to the officials and local leaders
(themselves belonging to the rich or even very rich categories) rich and certainly very
rich people do not make use of this health centre but go to Damongo or even to
Tamale if they need a doctor or medicines. According to them particularly the poor
and very poor now have access to a service that was too far away for them before and
it really helped them. The Daboya women agree with that point of view, but only in
the beginning of the ‘hospital’, but recently everything has to be paid for and the poor
and certainly the very poor can’t afford and no longer go, or if they go they are not

93
able to pay and depend on the willingness of the clinic staff to ‘cater for them’, or by
‘well-wishers’ in the community (or church or mosque leaders) to pay the bills, which
sometimes happens for the poor, but not often for the very poor.
The boreholes in and around Daboya.
Again this was mentioned among the ‘best initiatives’ by all five workshop groups.
According to the local leaders the very rich don’t need it so much, as they have
private watertaps in their houses, but others are not so sure about that: also the very
rich need borehole water for washing clothes (often by maids in their households).
According to the local leaders the arrival of boreholes changed the lives (and health)
of the very poor most, although the Daboya women remark that the poor and very
poor still go to the (nearby) river for bathing and washing clothes.
Primary schools or specific projects for education
With the exception of the local leaders all groups mentioned education, or specific
education projects (Equal; Wulugu) as among the five best initiatives. For the
officials, who mentioned the Wulugu project that provided school equipment, the
poor and very poor really benefited, but all other groups were far more sceptical. They
said that in the earlier years, when primary education became ‘free’ (when school fees
had been abolished) indeed also children of poor and even very poor people started to
attend school. But when recently ever more payments became necessary again the
(very) poor started to withdraw their children from school. The women had an
interesting observation to add: in the early years of primary education schools were
seen by many as a punishment because of the habit of teachers to use ‘caning’ as a
way of disciplining children. The very rich did not want their children to be treated
like that and they started to send their children to private schools elsewhere (or, in the
early years thought they could afford not to send their children to any school). This
was confirmed by the officials who stated that few rich persons would send their
children to the local schools, that were and are also regarded as rather poor in
performance. It should be noted here that many Muslim parents, who do not send their
children to primary school, or who withdrew their children from school do send their
children to Koran classes in the various mosques in the area.
Electrification
The very rich and rich benefitted most, according to most workshop groups, as they
have the money to buy the electric apparatuses and pay the electricity bill. Some
groups say that also the poor or even the very poor benefited somewhat because of the
street lights in Daboya. It was remarkable that also the peasants from the villages
around Daboya (where electricity has mostly not yet arrived) mention electrification
as among the best projects, as they also benefit from the electrification in Daboya
Centre. But the poor and very poor from their areas hardly benefit, according to them.
Telecom
Mobile phones are a recent phenomenon in the area and with currently three
providers, competing for customers, two groups regarded that as among the best
initiatives ever. Both the artisans and the officials judged the impact to be very high
for the rich and average people, although mainly the rich are the ones who buy phones
and credit, and others in the community can hire their services. The officials observed
that the arrival of the mobile phone had mainly changed the lives of the average and
the rich, not so much the very rich.

94
Farming support
Local leaders and women mentioned farming projects (including the ‘global 2000’
projects) and they completely disagreed about the impact on wealth groups when
those projects had just been implemented, but they agreed about the current ex-post
impact. According to the local leaders (in red on the graph) during implementation of
the ‘global 2000’ agricultural project particularly the poor benefited. They said that
the (very) rich did not really need the project, but the average and the poor they
suddenly could use fertiliser at no or very low costs, while the very poor could get
day-jobs in those expanding farms. However, when the project stopped only the rich
and very rich could afford to continue with the improvements taught by project staff.
According to the women (in blue), who talked about ‘farming projects in general’,
from the start the very rich and rich benefited most, as they were the ones with the
money to buy fertilisers and seeds, and to pay for labour needed to develop their
farms. The increased crop harvests initiated by farming projects could generally be
maintained, but now the (very) rich benefit even more, because they can buy
agricultural produce from their poorer peasant neighbours nearby after the harvests,
and they can sell at much higher prices later. The graph illustrates the differences.
Graph 9.3 Different assessment of ‘best projects in farming support’
‘Then’ ‘Now’
Roads
There have been some projects to build or improve feeder roads in the area. Both the
women from Daboya and the peasants from the villages and hamlets around Daboya
regarded this as beneficial projects, and among the best. But both groups agreed that
the (very) rich use these feeder roads most, particularly with their tractors and small
lorries. According to the women the average people sometimes hire the lorry to
transport agricultural produce and belongings. But the poor and very poor hardly
benefit; maybe a bit because the local market now has more local produce and prices
are cheaper.
Tsetse control
Although tsetse eradication happened a long time ago the local leaders (elderly people
generally) very much regarded it as an important innovation when it came and
according to them the benefits then and now are still considerable and shared by all.
The worst initiatives
The exercise about the differential impact of the ‘worst five projects’ on wealth
classes was done when many participants were tired and the results are not very clear,
as two completely different approaches were possibly used by participants and
facilitators. The approach that was intended was the one in which groups agreed on

95
the distribution across wealth groups of the most negative or damaging effects. But it
could also well be that some participants (and facilitators) agreed on an interpretation
where certain wealth categories benefited from a project despite their overall negative
impact. So the results should be read with caution. The results will be presented
according to major sectors.
Toilets
The public toilets in Daboya and for one group also the private toilets provided to
some houses were the most despised projects in the area. As many poor and very poor
people happen to live near the smell of these toilets, where no or hardly any cleaning
takes place, they are the ones who are suffering most. But also the (children of the)
rich and very rich are negatively effected, as they refuse to go to these stinking places,
and continue using the bush, with risks of snake bites. According to the officials the
average wealth groups are hit most, as the rich and very rich have private toilet
facilities on their compounds and do not live near the public toilets, while the average
people’s aspired status (and lessons learned about hygiene) make them use the
facilities, while they hate doing that. As visitors of the area, making use of these
toilets as well, we could smell what they meant.
Table 9.2 Stinking toilets, percentages for wealth groups ‘hit most’
Group Very rich Rich Average Poor Very poor
Artisans
Public toilets
20 20 20 20 20
Private toilets 0 10 20 30 40
Women
(then/now)
20/5 20/15 20/15 20/30 20/35
Officials 5 5 40 30 20
Total 11/8 14/13 25/24 25/28 25/29

96
The road conditions
Table 9.3 Bad roads, bad culverts, damaged bridge; percentages for wealth groups
‘hit most’.
Group Very rich Rich Average Poor Very poor
Local leaders 40 30 20 10 0
Artisans 0 10 20 30 40
Women
(then/now)
5 15/10 20 25 35/40
Total 15 18/17 20 8 25/27
Opinions differed a lot between on the one hand the local leaders and on the other
hand the artisans and the women from Daboya. Local leaders talked about the very
bad state of the road system in general and about the damage it has done to those
whose cars, motorbikes, trucks/lorries and tractors ‘suffer’ because of the bad
conditions and this is mainly a problem for the very rich and rich. Also their produce
cannot be traded easily or only at high costs and those who are traders have to spend a
lot of extra money and energy to get their trade goods to Daboya. Also a lot of money
has to be spent and time lost to cross the river. The artisans had a very different
perspective. They focused on a damaged culvert in a particular road and lack of
repairs meant that some goods could not be transported. They told an anecdote hat
donated furniture for schools could not be delivered and parents had to buy furniture
instead, which particularly hit the poorest parents. The women looked at this problem
from a different angle and the focused on the impact of the bridge that had collapsed
and had never been repaired. For the very rich and the rich they did not think it was a
really big problem, as they use other roads. The average people are the ones who own
the boats used for crossing the river and they earn money doing so. The poor and very
poor used to fish and they used to be able to use those boats free of charge. For them
fish was an important addition to their diet and it also provided them with a source of
income. Now they have to pay for the boats and it is no longer worth fishing the way
they used to do that in the past. And for the very poor conditions have further
deteriorated between ‘then’ and ‘now’.
Livestock innovations
The local leaders very much blamed the animal health control services for no longer
providing services in Daboya. According to them that meant that particularly the
(very) poor suffered as they were the ones buying or getting left-over meat that was
dangerous for their health and as they had no way of defending themselves against
malpractices of criminal businesspeople. Artisans, however, mainly blamed the
government for not maintaining the veterinary quarters and lack of veterinary services
mainly hits those with animals, the (very) rich in particular. Finally, the peasants in
the villages around Daboya stated that the (mobile) Fulani, who regularly visit the
area, had increased their herds of ‘big cattle’ (‘improved cattle’) and that was really
becoming a problem for the farmers with big areas of land, the very rich and rich
people in the area, as the Fulani with their cattle trampled the fields and caused a lot
of damage. Peasant also blamed the ‘beekeeping’ project for providing hives, also to

97
the poor and some very poor, who could afterwards not at all afford the costs of
maintenance and became very frustrated.
Table 9.4 Failed or unwanted livestock innovations
Group Very rich Rich Average Poor Very poor
Local leaders 0 10 10 40 40
Artisans 40 30 20 10 0
Peasants: new
cows
50 30 20 0 0
P: beekeeping 10 10 10 30 40
Total 25 20 15 20 20
Official agencies and their buildings
Many groups discussed in quite negative terms about the ‘Area Council’ in Daboya.
There was a general feeling of disappointment and of not fulfilling promises. Two
groups mentioned the Area Council as one of five ‘worst initiatives’ even. The
artisans mainly blamed the lack of activities, while the local leaders (including some
who are close to the Council themselves…) said that the lack of proper functioning of
the Council was a big blow for the poor and very poor, as they could be expected to
benefit most from a properly functioning local government with attention for their
problems. The women particularly blamed the area council for starting a rest or guest
house and not using it properly. According to them particularly he rich and very rich
could make use of that pseudo-hotel facility if it would function properly. The women
also blamed the government for not maintaining the magistrate’s house, or court
building, as the lack of proper local justice means that people have to go elsewhere
and there ‘the rich can bribe their way in’ and ‘buy their rights’, while the poor and
very poor cannot afford that. It is unclear from the notes why the women made a big
difference between ‘then’ and ‘now’.
Table 9.5 Badly functioning local governance agencies
Type Group Very rich Rich Average Poor Very
poor
Area
Council
Artisans unclear
Leaders 0 10 10 30 50
Rest house Women
(then/now)
35 35/30 20 5/10 5
Leaders unclear
Court bld Women
(then/now)
5/35 10/30 20 25/10 40/5
Total 13/23 18/23 17 20/17 32/20
Agricultural, forestry and market projects
Some workshop groups were very critical about projects meant to improve
commercial agriculture. The soy beans project was disliked by the local leaders
because it should have come with a promised guest house, that did not come. They

98
had hoped for a place to accommodate their visitors ( a practice only relevant for the
very rich, they thought). Peasants in the surrounding villages criticized a project to
introduce new varieties of cassava (failed completely and hit the poorest segments of
the community most as they would have benefited most). They also blamed a cashew
project that failed and a teak forest project that was a non-starter. The women, finally,
blamed the government for not maintaining the old market. First mainly the poorer
parts of the community suffered as they could not buy local produce in a central place.
Later the lack of local marketing opportunities were mainly seen to have hit the richer
parts of local society, as trading costs had gone up considerably.
Table 9.6 Failed commercial projects (then/now)
Type Group Very rich Rich Average Poor Very
poor
Soy beans Leaders 100 0 0 0 0
New cassava Peasants 20/10 10/10 20/10 20/30 20/40
New cashew Peasants 20/0 20/0 20/0 20/40 20/60
Teak forest Peasants 20/10 20/10 20/10 20/30 20/40
Old market Women 10/30 15/25 20 25/15 30/5
Total 34/30 13/9 16/8 17/23 18/29
Conclusions about the worst projects
The following graphs show the perceptions among the Daboya workshop participants
about the wealth groups that were impacted most negatively by failed or unwanted
projects or development initiatives in their area. The first graph shows the situation
when these projects were or had just been implemented and the second graph the
current assessment. Often groups did not or could not differentiate between ‘then’ and
‘now’ and hence these graphs are not very different. The blue colour shows the
distribution of the perceived negative impacts between the five wealth groups (from
very rich to very poor), while the red colour shows the perceived distribution of the
wealth groups among the population (assuming that that was the same ‘then’ and
‘now’). The conclusions are quite clear. In relative terms the very poor suffered most
by the non-implementation of, the failure of or the adversities caused by the ‘worst
initiatives’ in Daboya. In comparison to the perceived wealth class distribution in
Daboya this is even more so. However, in that case also the very rich were
considerably hit, mainly because they could have profited so much from some of the
projects and initiatives if these would not have failed. Of course one wonders: if that
is so, why did they not use their major decision-making and influencing powers to
make sure that these projects did not fail. Also among the rich and very rich there
often is a tendency to blame the ‘donor’ or initiator and not taking responsibility for
solving the problems. The lack of action around the public toilets is an illustration.
Graph 9.4 Negative impacts of development interventions in Daboya
‘Then’ ‘Now’

99

100
~10~ Assessment of good and bad agencies
In Daboya we experimented with an approach in which we asked the workshop
groups to look at the initiative, which they had judged to be the best initiative that had
ever happened to their area (and in some cases also the worst initiative) and value a
number of statements on a scale from ‘fully true’ (in the tables below: green), ‘a bit
true’ (yellow), ‘neutral’ (blue), ‘a bit false’ (pink) and ‘(fully) false’ (red). These
statements are judgements about the ‘project’ (or group of projects/initiatives) but in
fact also very much about the agency or agencies responsible for implementing these
‘projects’. These statements were:
"They are really concerned about us" (Long term commitment)
"They do not promise more than they can do" (Realistic expectation)
"When something goes wrong, they explain honestly" (Honesty)
"We feel that they trust us" (Trust in people)
"We feel that we can trust them" (Trustworthiness)
"They really address the problems that affect us" (Relevance)
"We have a real voice in what and how they do projects" (Participation)
"They treat us respectfully and take us seriously" (Respect)
"They really live among us and are part of us" (Local presence).
Three groups had selected the (poly)clinic as the best project in the area. This was and
is a government responsibility and it came to Daboya in the early 1970s, and
expanded in 2008, while in between and afterwards there were adjustments to tasks
and staffing.
Table 10.1 Opinions about the behaviour of the people involved in the government
clinic projects
Opinion L A O
"They are really concerned about us" (Long
term commitment)
++ ++ ++
"They do not promise more than they can
do" (Realistic expectation) ++ + +
"When something goes wrong, they explain
honestly" (Honesty) - + -
"We feel that they trust us"
(Trust in people) 0 ++ -
"We feel that we can trust them"
(Trustworthiness) ++ - -
"They really address the problems that affect
us" (Relevance) ++ ++ 0
"We have a real voice in what and how they
do projects" (Participation) + - -
"They treat us respectfully and take us
seriously" (Respect) 0 + -
"They really live among us and are part of
us" (Local presence) ++ ++ -

101
Overall judgement 10 9 -3
The local leaders and artisans in Daboya were quite positive about the mentality of the
people who were and are involved in the design and execution of the activities in and
around the health clinic. The local leaders have problems, though, with their honesty
and the artisans with their trustworthiness and about the participation they allow the
local people. Local leaders are not so sure about the respect with which the clinic
people treat the local people, and they doubt if the clinic people give enough trust to
the local people (artisans feel they do). On the other hand is it obvious that there is a
real long-term commitment and serious local presence, and that the activity is seen as
very relevant. The officials were far more negative about the clinic and its people. In
fact they only agreed with the others about the long-term commitment. Their overall
judgement is negative, and in some cases strongly worded if we look at the comments
they gave (like: ”there is no respect at all”), and they criticize the ‘politics’ that play
and have played a role, like “they built the clinic where we did not want it”.
The women of Daboya also had the clinic as their ‘best’ project, but decided to
discuss ‘education’ as their topic of discussion. It is not very clear which educational
activities they had in mind when they judged the behaviour of the people involved; it
is assumed here that they focus on the primary, junior secondary and vocational
schools in Daboya itself. The government’s Ministry of Education plays a key role
there, but assisted by international donors (HPIC of the World Bank; DfID and
Danida’, but also with a growing role for the District Assembly, and some support by
an NGO called Wulugu.
Table 10.2 Opinion of the women about the behaviour of the agencies involved in
education in Daboya
Opinion W
“They are really concerned about us” (Long
term commitment)
++
“They do not promise more than they can
do” (Realistic expectation)
++
“When something goes wrong, they explain
honestly” (Honesty)
--
“We feel that they trust us”
(Trust in people)
++
“We feel that we can trust them”
(Trustworthiness)
--
“They really address the problems that affect
us” (Relevance)
++
“We have a real voice in what and how they
do projects” (Participation)
++
“They treat us respectfully and take us
seriously” (Respect)
++
“They really live among us and are part of
us” (Local presence)
-
Overall judgement 7

102
Six of the nine opinions expressed were very positive, but two were very negative and
one a bit negative. The lack of honesty was linked to anger about the way suddenly
the school feeding programme had stopped and nobody could give them any
explanation. The lack of honesty and complete lack of trustworthiness is not related to
headmasters and teachers but to `the ones above them, whom we don’t know, and
who only come occasionally and for visits which are regarded as much too short`.
The peasants from the villages around Daboya Centre had selected the various
borehole projects as their ´best ones´. These were the ones constructed with supported
from the Catholic Relief Services in the early 1980s and the ones improved and
started by the District Assembly in the late 2000s, particularly in Lingbinsi. We can
be brief here. They judged all the statements as fully true, and the overall judgement
was extremely favourable.
What about the opinions about the agencies involved in the ´worst initiatives´. Only
three workshop groups were willing to do this exercise, or had time to do it (it was at
the end of the workshop). The local leaders and the artisans had selected the bad
condition of the roads as their ´worst project´, a government responsibility. As could
be expected the overall opinion was quite negative (although nowhere the local
leaders or artisans said that statements were ´fully false´). Both groups regarded the
roads as quite relevant (but it seems they had given up hope that it would ever
improve) and one group, the local leaders, stated that now the community themselves
had decided to get themselves organised and they started to maintain some of the
roads themselves, and the repairs were done with their own (unpaid) labour.
Table 10.3 Opinions about the behaviour of the government with regard to
maintenance of the road infrastructure
Opinion L A
“They are really concerned about us” (Long
term commitment) - -
“They do not promise more than they can
do” (Realistic expectation) - -
“When something goes wrong, they explain
honestly” (Honesty) - -
“We feel that they trust us”
(Trust in people) - -
“We feel that we can trust them”
(Trustworthiness) - -
“They really address the problems that affect
us” (Relevance) + +
“We have a real voice in what and how they
do projects” (Participation) + -
“They treat us respectfully and take us
seriously” (Respect) - -
“They really live among us and are part of
us” (Local presence) 0 -
Overall judgement -4 -7
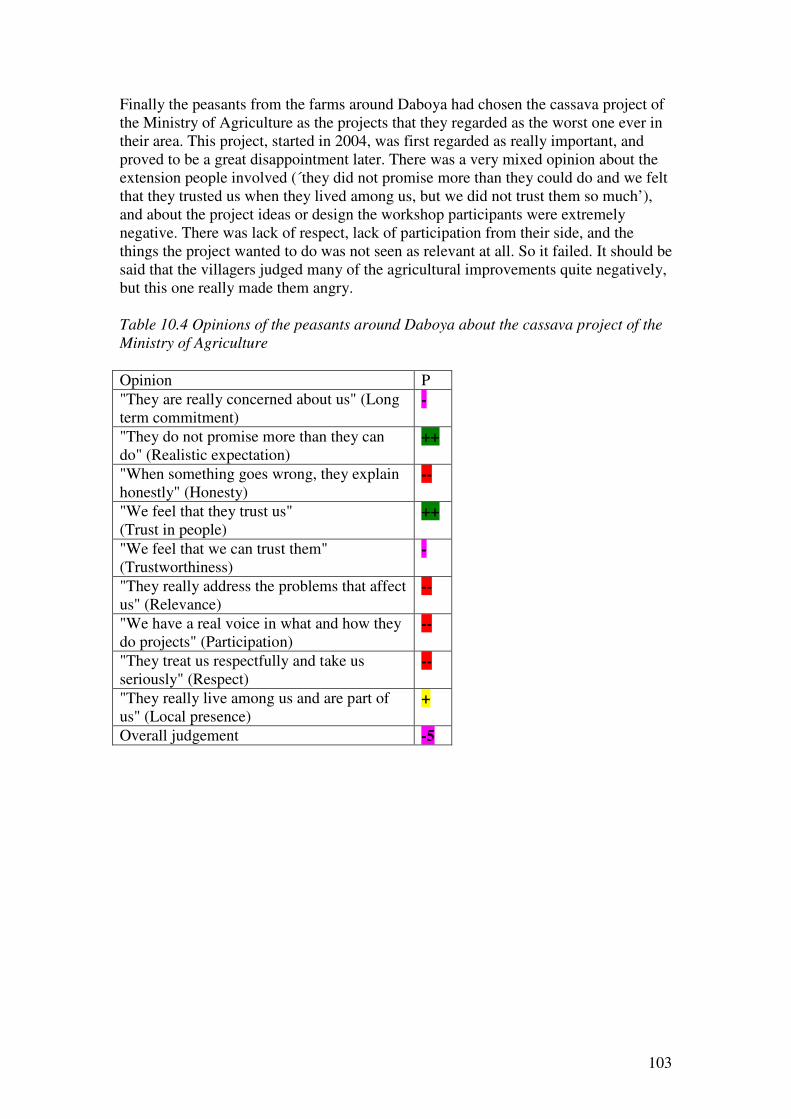
103
Finally the peasants from the farms around Daboya had chosen the cassava project of
the Ministry of Agriculture as the projects that they regarded as the worst one ever in
their area. This project, started in 2004, was first regarded as really important, and
proved to be a great disappointment later. There was a very mixed opinion about the
extension people involved (´they did not promise more than they could do and we felt
that they trusted us when they lived among us, but we did not trust them so much’),
and about the project ideas or design the workshop participants were extremely
negative. There was lack of respect, lack of participation from their side, and the
things the project wanted to do was not seen as relevant at all. So it failed. It should be
said that the villagers judged many of the agricultural improvements quite negatively,
but this one really made them angry.
Table 10.4 Opinions of the peasants around Daboya about the cassava project of the
Ministry of Agriculture
Opinion P
"They are really concerned about us" (Long
term commitment) -
"They do not promise more than they can
do" (Realistic expectation) ++
"When something goes wrong, they explain
honestly" (Honesty) --
"We feel that they trust us"
(Trust in people) ++
"We feel that we can trust them"
(Trustworthiness) -
"They really address the problems that affect
us" (Relevance) --
"We have a real voice in what and how they
do projects" (Participation) --
"They treat us respectfully and take us
seriously" (Respect) --
"They really live among us and are part of
us" (Local presence) +
Overall judgement -5

104
Appendix 1
Daboya workshop, 23-25 January 2010
List of participants
Nr Name Function Ethnicity/
Religion
Age-
gender
Group
1st
day
Area
group
2d/3d
day
1 Mr Garima wura Trad leader (chief) G/T OM D-1
2 Mr Adamu
Buma-Naa
(Ntere wura)
Trad leader (chief river) G/T OM D-1
3 Mr Saaka Bakeri
Ahmed
Headmaster; workshop
co-organiser
Hanga/M OM O
4 Mr Muazu
Haruna
Head Vocational School;
Secretary to the Chief;
workshop co-organiser
G/M O (O)
5 Mr Mazidu
(Majeed)
Kassim
Farmer Daboya G/M OM D-1
6 Mr Nyame
Mahama
Yazori, farmer Hanga/M OM H
7 Mr Kwame Vi Sisipe, fisherman Ewe/Pente OM H
8 Mr Charles
Mustapha
Health (accountants) Ashanti/M O O
9 Mr Ibrahim
Abubakar
Farmer Daboya G/M YM? D-1
10 Ms Yakubu
Salamatu
Tidrope, petty trader G/M OW W
11 Mr Mallam
Musah
Ferilah, religious head G/M YM? D-2
12 Mr Seidu Issah NFED G/M O O
13 Mr Abdul
Munim
Weavers Association,
chair
G/M YM? D-2
14 Mr Abdalah
Abubakar
Arabic Instructor G/M - O
15 Mr Dramani
Haruna
Kopoto, farmer G/M YM? H
16 Mr Sakitu
Abubakar
Disali, teacher G/M O H
17 Mr John M.
Tiika
Lingbinsi, Catholic
Mission GILLBT
Tamplma/
Cath
O H
18 Ms Mary
(Merry) John
Tiika
Lingbinsi, farmer Tamplma/
Cath
OW W
19 Mr Paul Adam Lingbinsi, farmer Tamplma/ O H
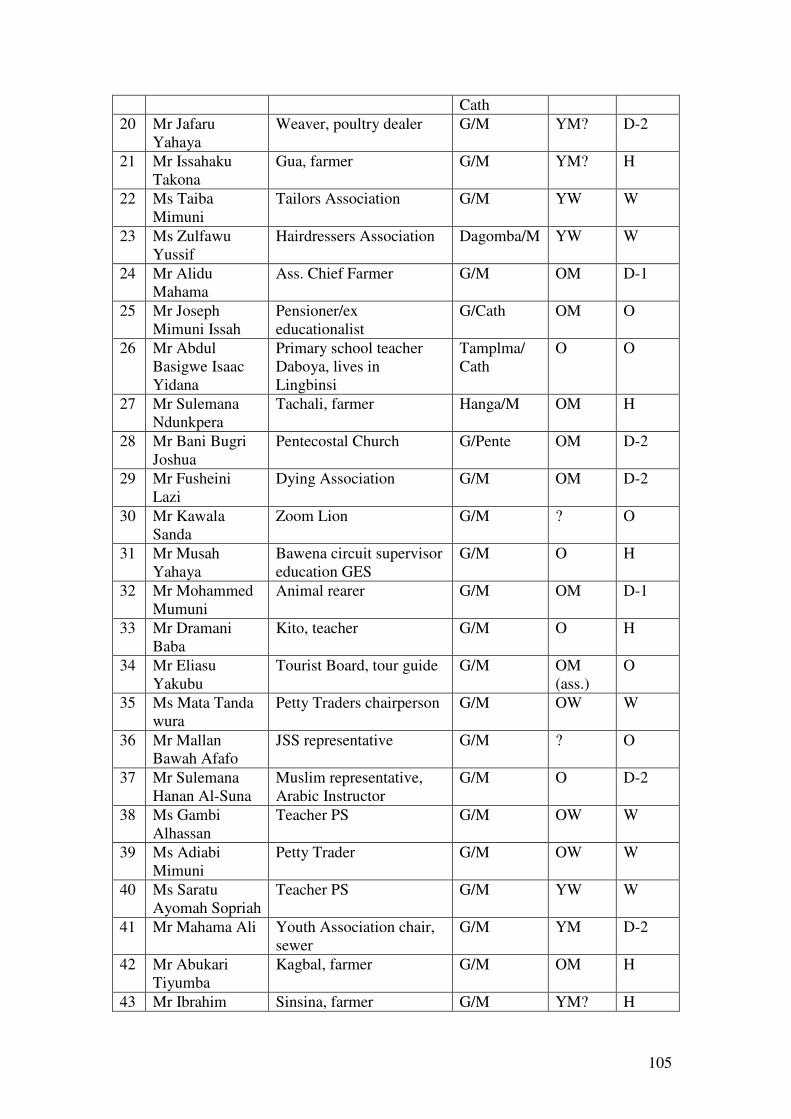
105
Cath
20 Mr Jafaru
Yahaya
Weaver, poultry dealer G/M YM? D-2
21 Mr Issahaku
Takona
Gua, farmer G/M YM? H
22 Ms Taiba
Mimuni
Tailors Association G/M YW W
23 Ms Zulfawu
Yussif
Hairdressers Association Dagomba/M YW W
24 Mr Alidu
Mahama
Ass. Chief Farmer G/M OM D-1
25 Mr Joseph
Mimuni Issah
Pensioner/ex
educationalist
G/Cath OM O
26 Mr Abdul
Basigwe Isaac
Yidana
Primary school teacher
Daboya, lives in
Lingbinsi
Tamplma/
Cath
O O
27 Mr Sulemana
Ndunkpera
Tachali, farmer Hanga/M OM H
28 Mr Bani Bugri
Joshua
Pentecostal Church G/Pente OM D-2
29 Mr Fusheini
Lazi
Dying Association G/M OM D-2
30 Mr Kawala
Sanda
Zoom Lion G/M ? O
31 Mr Musah
Yahaya
Bawena circuit supervisor
education GES
G/M O H
32 Mr Mohammed
Mumuni
Animal rearer G/M OM D-1
33 Mr Dramani
Baba
Kito, teacher G/M O H
34 Mr Eliasu
Yakubu
Tourist Board, tour guide G/M OM
(ass.)
O
35 Ms Mata Tanda
wura
Petty Traders chairperson G/M OW W
36 Mr Mallan
Bawah Afafo
JSS representative G/M ? O
37 Mr Sulemana
Hanan Al-Suna
Muslim representative,
Arabic Instructor
G/M O D-2
38 Ms Gambi
Alhassan
Teacher PS G/M OW W
39 Ms Adiabi
Mimuni
Petty Trader G/M OW W
40 Ms Saratu
Ayomah Sopriah
Teacher PS G/M YW W
41 Mr Mahama Ali Youth Association chair,
sewer
G/M YM D-2
42 Mr Abukari
Tiyumba
Kagbal, farmer G/M OM H
43 Mr Ibrahim Sinsina, farmer G/M YM? H

106
Mimuni
44 Mr Alhaji Soale
Saibu
Sewer G/M OM D-2
45 Ms Ramatu
Kelly
Hair dresser, petty trader G/M YW W
46 Ms Salamata
Saaka
Seamstress, Simisi G/M YW W
47 Mr Zakaria
Karimu Abongo
Sewer G/M OM D-2
48 Mr Dramani
Mahama
Farmer Daboya G/M OM D-1
49 Ms Surayatu
Jamani
Fish monger G/M OW W
50 Mr Mutallah
Yaya
NADMO G/M OM
(transl)
D-1
51 Mr Abi Vincent Daboya GES teacher Kasena/Cath O O
52 Mr Mahama
Huseini
Student Cape Coast Univ. G/M - O
53 Mr Mahama
Sumani
Traditional ruler G/T OM D-1
54 Ms Suraya
Amina Ali
Jamani
Fulani migrant woman F/M - W
55 Mr Alhaji Ali
Yobi
Fulani Chief F/M - D-1

107
Appendix 2: Chronological list of interventions in the Daboya area
Nr Impact on domain****Year
Project /
intervention /
initiative
Agency
*
Sector
**
Assess-
Ment
*** N P E H S C
1930 1 Construction of
first Local
Authority Primary
school
LA=G; support
from Presby=C
E W:++
Best2
+
1947 2 Daboya Primary
school
DA=G E O:++ + + + + +
[1955] 2a [Tsetsecontrol] [G] [N] [Not, but
later
included in
best
projects by
local
leaders]
>1957 3 District
Magistrate court
(abandoned)
G I W:0
W: Worst4
1960s (or
1971/72?)
4 Daboya Health
centre
(‘Policlinic’or
‘Hospital’)
G H L:++Best1
W:++Best1
+O: Best1
+V: Best1
+A: Best2
+
+
1960s
(1970?)
5 Military Training
Camp with
foreign trainers
G O L:++
W:++
+
+
+
1960-62 6 Feeder roads G I L:+/-
Worst1
+
1961
(1966?)
7 Construction of
first toilet in
Daboya
G H W:-- +
1961 8 Presby church
Lingbinsi
German
Presbyterian C
R O:++ + + + + +
1961 9 Water reservoir
Lingbinsi
Idem W O:++ + + + + +
1961 10 Lingbinsi PS and
TQ (Presbytarian)
Idem E O:++ + + + + +
1963 11 Daboya JSS Presby =C E O:++ + + + + +

108
Nr Impact on domain****Year
Project /
intervention /
initiative
Agency
*
Sector
**
Assess-
Ment
*** N P E H S C
1963 12 Daboya Rest
Home/Visitor’s
place
DA=G I L:- Worst5 + + +
1969-72 13 Culvert bridge
constructed (no
longer maintained
from 1984;
collapsed 1991)
G I O:0
L:+/-
A:0
W:0
:Worst2
+
+
+
+
+
+
+
1969-72 14 Construction of
road: Daboya-
Lingbinsi,
Daboya-
Damongo,
Daboya-Bowina
and Daboya to Wa
G I W:++
Best1
(But
culvert
Daboya-
Busonu:
A: Worst1)
1970 15 Baptist church USA C R O:++ + + + + +
1970-72 16 Piped water
supply
(mechanical;
collapsed in 1991)
G W O:++ Best3
L:++ Best3
A:0 Best2
+
+
+
+
+
+ +
1972-75 17 Upgrading
Daboya Health
Centre
G H O:++ Best1
(included
in nr 4)
+ + + +
1972 18 Nurse quarters G H O:++ + + + + +
1974 19 Sheep ranch
Lingbinsi
G (MOFA) L O:0 +
1978 20 Introduction of
(improved) pigs,
sheep, cows, goats
and poultry +
Building
G L W:0 + +
1978 21 School feeding
program from
Usaid
USAID=S E+S W:0 +
<1979 22 Piped water
supply Lingbinsi
G W W:+ Best3 + +
1980 23 Construction of
JSS
SDA
Mission=C
E W:++
Best2
+
1980 24 Pavilions in
Lingbinsi market
Party (MP)=G B W:++ + +

109
Nr Impact on domain****Year
Project /
intervention /
initiative
Agency
*
Sector
**
Assess-
Ment
*** N P E H S C
1980 25 Three boreholes
in Lingbinsi
Catholic
Church=C
W V:++ Best1 + +
1980 26 Market place in
Daboya
NPP party=G B W:0
Worst1
1981-82 27 Dam in Kagbal Local
community=L
W V:++ +
1982 28 Improved crop
varieties, e.g.
sweet potatoes
UNDP=S C A:++
1982 29 Borehole in
Yazori
CRS=C and the
community=L
W V:++Best1 + +
1982 30 Well in Kupote
and in Tachali
Community=L W V:++ + +
1982 31 Clinic in
Lingbinsi
New Ireland
Christian
Friends=C
H V:++ + +
1984 32 Fertilisers and
tools distributed
to farmers
G (MOFA) C L:++ + +
1985 33 Teak plantation in
Yazori
Private
farmer=L
N V:x +
1985 34 Construction of
Primary School in
Lingbinsi
Baptist
Church=C
E W:++
Best2
+
1987 35 Expansion of
primary School in
Lingbinsi
New Ireland
Christian
Friends=C
E V:++Best3 +
1988 36 PS Daboya Taken over by
LA=G
E O:++ + + + + +
1989 37 Fertiliser depot MOFA=G C A:++
1989 38 Construction of a
Literacy Office in
Lingbinsi, and
providing four
motorbikes
New Ireland
Christian
Friends=C
E V:++ +
1989 39 Construction of a
guest house in
Lingbinsi (3
rooms)
New Ireland
Christian
Friends=C
I V:++ +

110
Nr Impact on domain****Year
Project /
intervention /
initiative
Agency
*
Sector
**
Assess-
Ment
*** N P E H S C
1990 40 Lingbinsi Health
centre
Baptist
mission=C
H W:++ +
1990 41 Tree planting Iran=M N L:++ + +
1990 42 MOFA residence MOFA=G I O:+/- +
1990 43 Area Council
building
G I W:+
Worst5 (+
O:Worst2
L:Worst2
A: Worst5)
+
1990s 44 Introduction of
water yam
MOFA=G C V:++ + +
1992 45 Construction of St
Peters Primary
school in
Lingbinsi
Roman Catholic
Church=C
E W:++Best2 +
1992 46 Guesthouse
Lingbinsi
Baptist
Mission=C
I W:++ + +
1992 47 Donation of a
personal house for
a clinic in
Baulina,
supporting four
villages
Danish
couple=N (DA
took over in
1993)
H V:++ +
1992 48 Vaccination and
veterinary support
(incl. veterinary
quarters)
G L L:+
Worst3 (+A:
Worst2)
+ +
1993 49 Cashew planting
introduced
MOFA=G C L:++ + +
1994 50 (Expansion of)
Catholic church
Lingbinsi
Italy C R O:++ + + + + +
1994 (or
1992?)
51 Six Boreholes
Lingbinsi
Italy Roman
Catholic Church
=C
W O:++ Best3
W:++
Best3
+ + +
+
+
+
+
1994 52 SDA Church’s
JSS
C E O:++ + + + + +
1996 53 Introduction new
maize variety
MOFA=G C L:++ + +

111
Nr Impact on domain****Year
Project /
intervention /
initiative
Agency
*
Sector
**
Assess-
Ment
*** N P E H S C
1996 54 Credit Union in
Lingbinsi
Catholic
church=C
B V:++ +
1996 55 Building a
mosque in
Daboya
Local
initiative=L,
with support
from MP from
NDC party=G
R W:++ +
1996 56 Construction of
Baptist Church in
Lingbinsi
New Ireland
Christian
Friends=C
R V:+ +
<1997 57 Construction of
waterpipes (4) in
Lingbinsi
G W W:+ Best3 + +
1997 58 Construction of
Agricultural
cottage for an
Agric Officer in
Kagbal
MP=G C V:++ + + +
1997 59 Construction of
primary School in
Kagbal (3 class
rooms)
CRS=C E V:++ Best3 +
1997 60 Mechanical
boreholes Daboya
MP=G;
CIDA=S;
Comm=L
W O:++ Best3 + + + + +
1998-
2007
61 Improvements
Area Council/DA
Buildings in
Lingbinsi and
Daboya
(also see: nr 43)
DA=G I O:+/-
Worst2 L:x Worst2
A:++
Worst5 W:++
Worst5
+
+
1998-
2001
62 Support to Zungu
Central Mosque
Islamic Council
(S.Arab)=M +
Comm=L
R O:++
L:++
A:++
+ + + +
+
+
+
1999 63 Church building Comm=L R O:++ + + + + +
1999 64 Mechanised water
delivery, using a
borehole (later
collapsed)
G W A:++
Best2?

112
Nr Impact on domain****Year
Project /
intervention /
initiative
Agency
*
Sector
**
Assess-
Ment
*** N P E H S C
2000 65 Improvement of
road Lingbinsi-
Disali
DA=G I V:++
Best4?
+ +
2000 66 Construction of
feeder Road
Larabanga-
Yazori-Baulina
DA=G I V:++ Best4 + +
2000 67 Improvement of
road Tachali-
Daboya
DA=G I V:++
Best4?
+ +
2000 68 Widening of road
Disali-Tara
DA=G I V:++
Best4?
+ +
2000 69 Road Kogbil-Gua DA=G I V:++
Best4?
+ +
2000 70 Electricity poles
Daboya
G P O:++ Best2
L:++ Best4
(+ A: Best3
+V: Best5)
+
+
+
+
+
+
+
+
2000 71 Community
Forest
Management in
Baulina, and
Yazori,
Department of
Wildlife=G and
community=L
N V:++ +
2000 72 Construction of a
two-classroom
school and an
office in Sisina
NGO=N? E V:++ Best3 +
2000 73 Shinga PS DA=G E O:++
L:++
+ + +
+
+
+
+
2000 74 Start of Amadiya
activities near
Daboya
Two brothers,
with Iranian
support=L+M
R W:++ +
2000 75 Construction of a
Church in Baulina
Assemblies of
God=C
R V:+ +
2000 76 Construction of a
Church in Baulina
Catholic
Church=C
R V:+ +
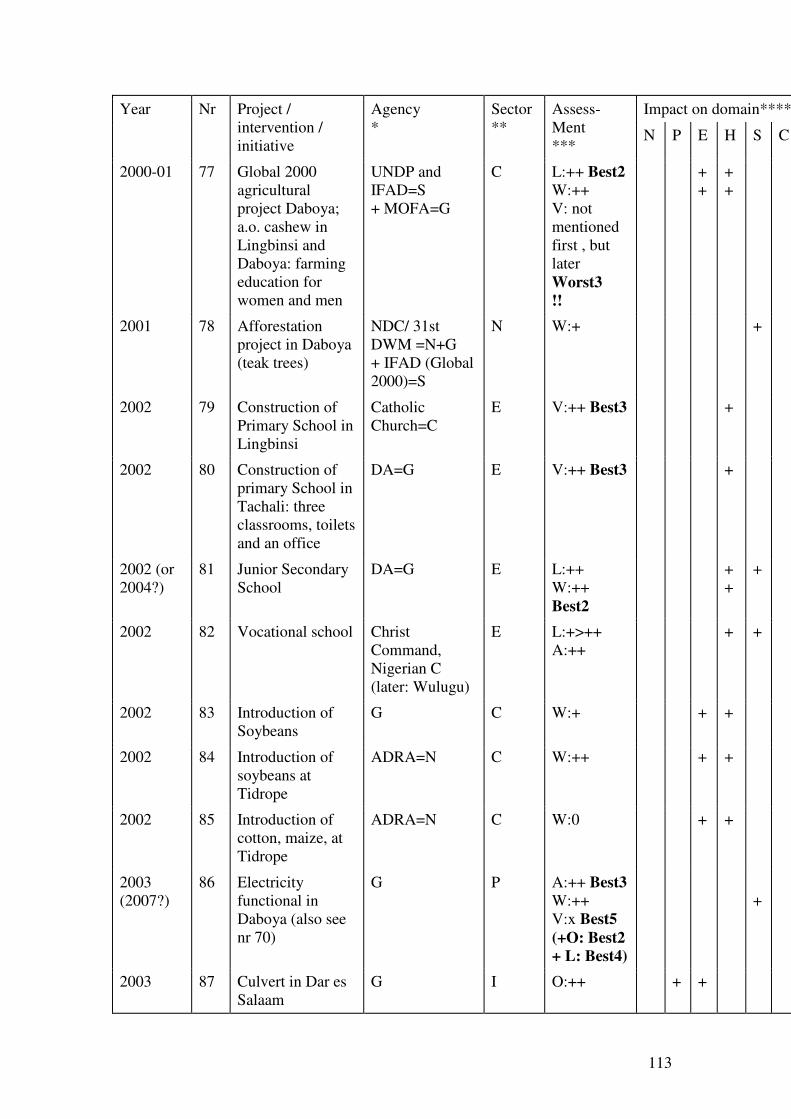
113
Nr Impact on domain****Year
Project /
intervention /
initiative
Agency
*
Sector
**
Assess-
Ment
*** N P E H S C
2000-01 77 Global 2000
agricultural
project Daboya;
a.o. cashew in
Lingbinsi and
Daboya: farming
education for
women and men
UNDP and
IFAD=S
+ MOFA=G
C L:++ Best2
W:++
V: not
mentioned
first , but
later
Worst3
!!
+
+
+
+
2001 78 Afforestation
project in Daboya
(teak trees)
NDC/ 31st
DWM =N+G
+ IFAD (Global
2000)=S
N W:+ +
2002 79 Construction of
Primary School in
Lingbinsi
Catholic
Church=C
E V:++ Best3 +
2002 80 Construction of
primary School in
Tachali: three
classrooms, toilets
and an office
DA=G E V:++ Best3 +
2002 (or
2004?)
81 Junior Secondary
School
DA=G E L:++
W:++
Best2
+
+
+
2002 82 Vocational school Christ
Command,
Nigerian C
(later: Wulugu)
E L:+>++
A:++
+ +
2002 83 Introduction of
Soybeans
G C W:+ + +
2002 84 Introduction of
soybeans at
Tidrope
ADRA=N C W:++ + +
2002 85 Introduction of
cotton, maize, at
Tidrope
ADRA=N C W:0 + +
2003
(2007?)
86 Electricity
functional in
Daboya (also see
nr 70)
G P A:++ Best3
W:++
V:x Best5
(+O: Best2
+ L: Best4)
+
2003 87 Culvert in Dar es
Salaam
G I O:++ + +
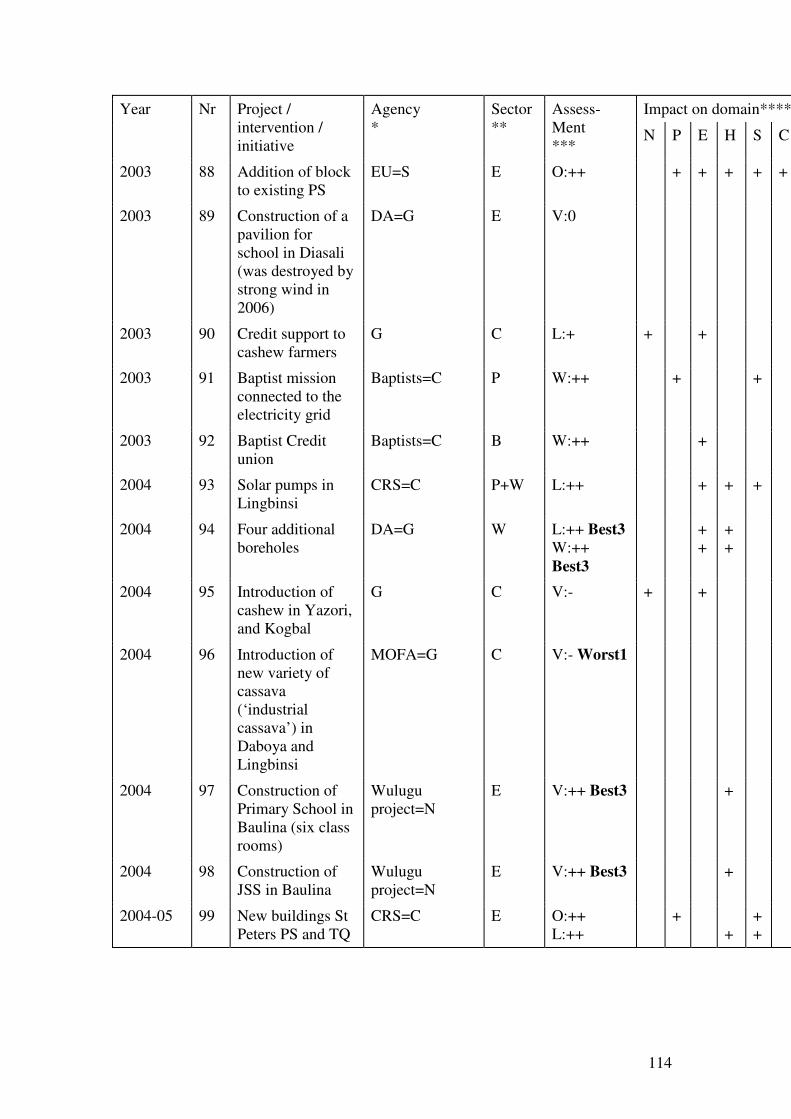
114
Nr Impact on domain****Year
Project /
intervention /
initiative
Agency
*
Sector
**
Assess-
Ment
*** N P E H S C
2003 88 Addition of block
to existing PS
EU=S E O:++ + + + + +
2003 89 Construction of a
pavilion for
school in Diasali
(was destroyed by
strong wind in
2006)
DA=G E V:0
2003 90 Credit support to
cashew farmers
G C L:+ + +
2003 91 Baptist mission
connected to the
electricity grid
Baptists=C P W:++ + +
2003 92 Baptist Credit
union
Baptists=C B W:++ +
2004 93 Solar pumps in
Lingbinsi
CRS=C P+W L:++ + + +
2004 94 Four additional
boreholes
DA=G W L:++ Best3
W:++
Best3
+
+
+
+
2004 95 Introduction of
cashew in Yazori,
and Kogbal
G C V:- + +
2004 96 Introduction of
new variety of
cassava
(‘industrial
cassava’) in
Daboya and
Lingbinsi
MOFA=G C V:- Worst1
2004 97 Construction of
Primary School in
Baulina (six class
rooms)
Wulugu
project=N
E V:++ Best3 +
2004 98 Construction of
JSS in Baulina
Wulugu
project=N
E V:++ Best3 +
2004-05 99 New buildings St
Peters PS and TQ
CRS=C E O:++
L:++
+
+
+
+

115
Nr Impact on domain****Year
Project /
intervention /
initiative
Agency
*
Sector
**
Assess-
Ment
*** N P E H S C
2004-07 100 Post office with
40 post boxes
G I O:+
L:++
A:++
W:++
+ +
+
+ +
+
+
2004-05 101 Primary school at
Tidrope
DA=G E W:++
Best2
+
2005 102 Support to two
(four?) PS and
provision of
furniture: Salafia,
Taraweka, Sarfiat,
Trabite
Wulugu=N E O:++ Best5
L:++
W:++
Best2
+ + +
+
+
+
+
+
+
2005 103 TQ Lingbinsi and
Daboya
Wulugu=N E L:++
W:++
Best2
+ +
+
2005 104 Introduction new
rice variety
MOFA=G C L:- + +
2005 105 Boreholes at
Anyando,
Bowina, Samisi
and Djiferano
NGO=N? W L:++ Best3 + + +
2005 106 Reconnection of
pipelines in
Daboya
DA=G W W:++ + +
2005 107 Day nursery Word
Ministry=C
E A:++
2005 108 Ante-natal clinic G H L:+ +
2005 109 Health clinic at
Tare
G H L:++ +
2005- 110 Provision of fund
for buying drugs
by Lingbinsi
clinic
New Ireland
Christian
Friends=C
H V:++ + +
2005-06 111 Pavilions built for
market kiosks
MP+DA=G I+B A:++
W:0
2005-06 112 Expansion of PS
Daboya
LA=G + HIPC
Initiative=S
E L:++
A:++
W:++
Best2
+
+
+
2005-06 113 Junior Sec. School LA=G E L:++
A:++
+ +

116
Nr Impact on domain****Year
Project /
intervention /
initiative
Agency
*
Sector
**
Assess-
Ment
*** N P E H S C
2005-06 114 Kalibito Mosque Islamic Council
(Arab)=M +
Community=L
R O:++
L:++
A:+
+ + + +
+
+
+
2005-06 115 Credit to the
disabled
NGO=N? S+B L:+ +
2005-07 116 Expansion
vocational school
(3 unit classroom
block)
Wulugu=N E O:+ Best5
A++
W:+ Best2
+
+
+
+ +
2005-07 117 School uniforms,
books (for girls)
Gate-2
programme =
Equal (N)
E A:++ Best5
2005-07 118 Solar-Mechanized
Boreholes in
Lingbinsi (six)
EU=S W V:++ Best1 + +
2006 119 Bee-keeping
project
Arocha-Ghana
=N
L V:++
Worst4
+ +
2006 120 Construction of
primary School in
Lingbinsi
Wulugu/
Wuzulungu=N
E W:++
Best2 V:++ Best3
+
+
2006 121 Credit to parents
to send their
children to school
Wulugu=N E+B L:+
2006 122 Elephantiasis
drugs given to
community
G H L:+ + +
2006 123 KVIP toilets (“6-
seater”)
G H A:+
Worst3
(+O:
Worst1 +
W:
Worst3)
2006 124 Teak plantation in
Lingbinsi
MOFA=G and
private
farmers=L
N V:x
Worst5
+
2006 125 Support to PS Danida=S E L:++ + +

117
Nr Impact on domain****Year
Project /
intervention /
initiative
Agency
*
Sector
**
Assess-
Ment
*** N P E H S C
2006- 126 Distribution of
school uniforms
and food for
school girls in
Baulina, Disali
and Yazori
EQUALL=N E V:+
Best3
+
2006-07 127 Barkarbasipel
Mosque
Islamic Council
(Arab)=M +
Community=L
R O:++
L:++
A:++
+ + + +
+
+
+
2006-08 128 Credit to farmers MOFA=G +
NGO (?)=N
C+B A:+
2007 129 Conscientization
project on
bushfire by radio
DA=G
(Took over
from unknown
NGO)
N W:++ +
2007 130 Pigs rearing
initiative
Lingbinsi
Local
community=L
(taken over
from MOFA)
L W:++ + +
2007 131 Construction of
pipes in Daboya
Roman Catholic
Church=C
W W:++ + +
2007 132 Six boreholes in
Daboya, Yazori,
Disali, and
Tachali (one
never working)
DA=G +
Comm=L
W O:++ Best3
A:++ Best2
V:++ Best1
+ +
+
+
+
+ +
2007 133 Boreholes in
Lingbinsi
DA=G +
Comm=L
W O:++ Best3 + + + + +
2007 134 Four boreholes in
Baulina
DA=G W V:++ Best1 + +
2007 135 Lingbinsi (to be)
connected to the
electricity grid
G P W:-
2007 136 Construction of 3
new class rooms
for JSS in
Lingbinsi
Catholic
Church=C
E V:++ Best3 +
2007 137 CHIP (Health
Insurance) Project
in Lingbinsi
GHS=G H V:x
2007 138 Penta Church Pentecostal C R O:++ + + + + +

118
Nr Impact on domain****Year
Project /
intervention /
initiative
Agency
*
Sector
**
Assess-
Ment
*** N P E H S C
2007 139 Expansion
Amadiya Mosque
near Daboya
Amadiya
Mission
(support from
Egypt)=M
R W:++ +
2007 140 Amadiya Islamic
Daycare
Amadiya
Mission
(support from
Egypt)=M
E W:++ +
2007 141 English-Arabic PS
+ TQ Lingbinsi
Wulugu=N E O:++ Best5 + +
2007 142 Individual farmer
training
MOFA=G C+L A:+
2007 143 Cashew support G + NGO (?)=N C A:+
2007 and
2009
144 Flood victim
support: food,
medicine,
drinking water;
building materials
Red Cross=N S A:+
W:++
+
+
+
2007 and
2009
145 Food from
NADMO for
flood victims
(Tidrope, Daboya
and Lingbinsi
NADMO=G S A:++
W:++
+
+
+
2007 146 Idem US Marines=S S A:++
2007 147 Idem MoH
support=G
H A:++
2007-08 148 New variety of
cows (bigger
cows; grows
faster)
Fulanis =L L V:+/-
Worst2
+ +
2007-08 149 KVIP toilets to 30
individual houses
DA=G H A:+/-
Worst3 W:--
Worst3
(+O:
Worst1)
2007-08 150 Asafu JSS DA=G + DFID
and/or
Danida=S
E O:++
A:++
W:++
Best2
+ + +
+
+ +

119
Nr Impact on domain****Year
Project /
intervention /
initiative
Agency
*
Sector
**
Assess-
Ment
*** N P E H S C
2007-08 151 Upgrading of
Daboya HC to
Policlinic
G H A:++
2007-08 152 Tigo mobile
phone network,
mast
P I O:++ Best4
L:++
A:++ Best4
W:++
+ +
+
+
+
+
+
+
2007-08 153 MTN mobile
phone network,
mast
P I O:++ Best4
L:++
A:+
W:+
+ +
+
+
+
+
+
+
2008 154 Livestock
vaccination
campaign during
floods
American
military team=S
L L:+ + +
2008 155 Boreholes in
Kupote
District
Assembly=G
with the
community=L
W V:++ Best1 + +
2008 156 Borehole in Sisipe Ghana
Military=G
W V:++ Best1 + +
2008 157 Distribution of
solar mobile
chargers
New Ireland
Christian
Friends=C
P V:+ + +
2008 158 Construction of
Primary School in
Kupoto (3
classrooms, toilets
and an office)
DA=G E V:++ Best3 +
2008 159 Pentecostal
kindergarten near
the church
Pentecostal C E A:++
2008 160 Madina Central
Mosque
Iran=M +
Comm=L
R A:++
2008 161 Dustbins (NCRC) EU=S H A:++ +
2008 162 Microcredit to
women (to send
children to
school)
G E+B L:+ + +

120
Nr Impact on domain****Year
Project /
intervention /
initiative
Agency
*
Sector
**
Assess-
Ment
*** N P E H S C
2008 163 MASLOC
microfinance
loans to farmers
and traders
G B A:+
2008 164 Weaving project USAID=S B W:++ +
2008-09
(2005?)
165 Police station G + Local
support=L
I O:++
L:++
A:++
W:++
+ + + +
+
+
2008-09 166 Visitors/tourist
centre
(NCRC) EU=S
+ Peacecorps
(‘Mr Lary’)=N
+ Comm=L
B O:++
L:++
A:++
W:++
+ +
+
+
+
+
+
2008-09 167 Construction of
Pentacost Church
in Tachi
Pentecostal C R A:+
V:+
+
2008
09
2009 168 Construction of a
new block (4 class
rooms) of the
primary school in
Kagbal
DA=G E V:++ Best3 +
2009 169 Construction of
Kindergarten
Pentecostal
Church=C
E W:++ +
2009 170 Eyesight checking Peacecorps=N H L:+ + +
2009 171 Soybeans
campaign (in
Kogbal)
MOFA=G C L:- Worst4
A:+
V:++
+
+
+
+
2009 172 (Re-)introduction
of cashew in
Lingbinsi, Yazori,
Kogbal
MOFA=G C V:- Worst3
2009 173 Introduction of
cassava in Kogbal
MOFA=G C V:-
2009 174 Introduction of
soybeans and
cassava in Yazori
Arocha
Ghana=N
C V:++ + + +
2009 175 Maize Project at
Lingbinsi
(RC) Church
=C
C W:++ + +
2009 176 Sheep vaccination G L L:+ + +

121
Nr Impact on domain****Year
Project /
intervention /
initiative
Agency
*
Sector
**
Assess-
Ment
*** N P E H S C
2009 177 Vodafone mobile
phone network,
mast
P I A:x
2009 178 Construction of a
pavilion for
school in Tachali
DA=G E V:++ Best3 +
2009 179 Computer
facilities added to
vocational school
Kofi Annan ICT
Initiative (N)
E A:++
2009-10 180 Examination
centre
construction
DA=G +
DUAF=N
E O:++
A:x
W:x
+ + +
+
+ +
2010 181 a) Lingbinsi
Health post, and
b) Lingbinsi guest
house for health
worker.
Gilbert=C H a) O:x
b) O++
+
+
+
+
Explanation of symbols:
* C
G
L
M
N
P
S
Christian Church/Mission;
Government (LA=Local Authority; DA=District Assembly);
Local initiative;
Muslim support [state or NGO]; mosque-based
Non-faith-based NGO;
Private company
Supra-national agency; often a foreign state (donor) agency; or a UN
agency (foreign NGOs can be found under N; Muslim state donors
under M)
** B
C
E
H
I
L
N
O
P
R
S
W
Business
Crops
Education
Health and sanitation
Infrastructure
Livestock
Nature/Natural resources
Other
Power (electricity)
Religion
Social
Water

122
*** ++
+
+/-
x
-
--
Positive for many people or many of the intended beneficiaries
Positive for some
Partly positive; partly negative
Not yet functioning
Negative
Very negative; should never have started
Best1-5: among the best five projects according to a group
Worst1-5: among the worst five projects according to a group
**** N
P
E
H
S
C
Natural resources; nature
Physical infrastructure (roads, buildings)
Economic Capabilities; market access; wealth levels
Human capabilities: health; knowledge levels; skills
Social relations; social capabilities; access to political power
Cultural abilities (language, mentality, spirituality)