particulate matter monitoring network description · pdf filesouth coast air basin and...
TRANSCRIPT

South Coast Air Basin and Coachella Valley Monitoring Planning Areas
1
PARTICULATE MATTERMONITORING NETWORK DESCRIPTION
FOR SOUTH COAST AIR BASIN ANDCOACHELLA VALLEY MONITORING PLANNING
AREAS
PREPARED BYSouth Coast A.Q.M.D.
Applied Science and Technology
March 25, 1998

South Coast Air Basin and Coachella Valley Monitoring Planning Areas
2
TABLE OF CONTENTS
1. Introduction ....................................................................................................... 41.1 Physical Setting..................................................................................... 41.2 Population Characteristics.................................................................... 51.3 Climate and Weather ............................................................................ 51.4 Dominant Economic Activities and Emission Sources...................... 71.5 PM2.5 Monitoring Requirements.......................................................... 7
2. PM2.5 Monitoring Network ............................................................................... 102.1 PM2.5 Monitors Planned for Deployment............................................ 102.2 Existing Particulate Matter Monitors................................................... 132.3 PM2.5 Quality Assurance ...................................................................... 142.4 Laboratory Analyses ............................................................................ 15
3. PM2.5 Monitoring Sites to be Deployed in 1998............................................. 153.1 Monitor Siting ....................................................................................... 153.2 Site Description..................................................................................... 18
4. PM2.5 Monitoring Sites to be Deployed in 1999.............................................. 194.1 Sites Operating FRM Monitors............................................................ 194.2 Chemical Speciation Monitoring ......................................................... 194.3 Continuous PM2.5 Monitoring.............................................................. 25
5. Sampling Frequency ......................................................................................... 265.1 PM2.5 FRM Sampling Frequency......................................................... 265.2 PM2.5 FRM Chemical Speciation Sampling Frequency ..................... 275.3 PM10 Sampling Frequency ................................................................... 27
Site Description...............................................................................................Appendix A

South Coast Air Basin and Coachella Valley Monitoring Planning Areas
3
LIST OF TABLES
Table 1.1.1 Historical Population and Population Growth Forecasts ...............................5
Table 1.5.1 PM2.5 Monitoring Requirements ....................................................................8
Table 2.1.1 PM2.5 Monitoring Network............................................................................ 11
Table 2.2.1 Existing Particulate Matter Monitors............................................................13
Table 3.2.1 PM2.5 Monitoring Sites to be Deployed in 1998 ..........................................18
Table 4.1.1 PM2.5 Monitoring Sites to be Deployed in 1999 ..........................................19
Table 4.2.1 PM2.5 Chemical Speciation Monitoring........................................................19
Table 4.3.1 Continuous PM2.5 Monitors to be Deployed in 1999 ..................................25
Table 5.1.1 PM2.5 Sampling Frequency ...........................................................................27
Table 5.3.1 PM10 Sites Not Covered by Requested Waiver ...........................................28
LIST OF FIGURES
Figure 1.1.1 Boundaries of the South Coast Air Quality Management District................4
Figure 1.5.1 Existing NAMS/SLAMS Sites for Gaseous and Particulate Pollutants........9
Figure 2.1.1 Planned Locations of Monitors.....................................................................12
Figure 3.1.1 Population by MSA in the South Coast Air Basin.......................................16
Figure 3.1.2 PM10 Concentrations in the South Coast Air Basin.....................................16
Figure 4.2.1 Schematic of the SCAQMD Multi-Channel Fine Particulate Sampler......21
Figure 4.2.2 Particulate Monitoring Network for TEP 2000.............................................23
South Coast Air Basin and Coachella Valley Monitoring Planning Areas
4
1.0 INTRODUCTION
This Document details the South Coast Air Quality Management District’s(SCAQMD) plan to accomplish the implementation of the PM2.5 monitoring networkthat has been promulgated by the United States EPA. The plan will include thenetwork plans for both the South Coast Air Basin and the Coachella ValleyMonitoring Planning Areas.
1.1 Physical Setting
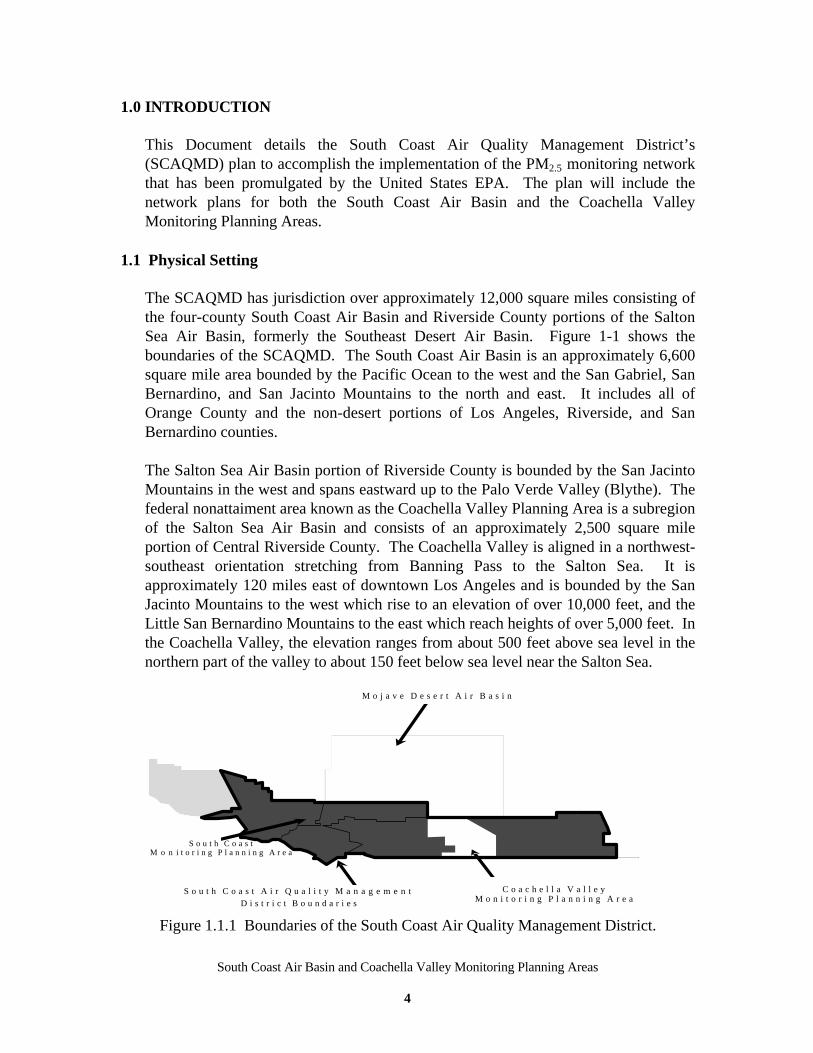
The SCAQMD has jurisdiction over approximately 12,000 square miles consisting ofthe four-county South Coast Air Basin and Riverside County portions of the SaltonSea Air Basin, formerly the Southeast Desert Air Basin. Figure 1-1 shows theboundaries of the SCAQMD. The South Coast Air Basin is an approximately 6,600square mile area bounded by the Pacific Ocean to the west and the San Gabriel, SanBernardino, and San Jacinto Mountains to the north and east. It includes all ofOrange County and the non-desert portions of Los Angeles, Riverside, and SanBernardino counties.
The Salton Sea Air Basin portion of Riverside County is bounded by the San JacintoMountains in the west and spans eastward up to the Palo Verde Valley (Blythe). Thefederal nonattaiment area known as the Coachella Valley Planning Area is a subregionof the Salton Sea Air Basin and consists of an approximately 2,500 square mileportion of Central Riverside County. The Coachella Valley is aligned in a northwest-southeast orientation stretching from Banning Pass to the Salton Sea. It isapproximately 120 miles east of downtown Los Angeles and is bounded by the SanJacinto Mountains to the west which rise to an elevation of over 10,000 feet, and theLittle San Bernardino Mountains to the east which reach heights of over 5,000 feet. Inthe Coachella Valley, the elevation ranges from about 500 feet above sea level in thenorthern part of the valley to about 150 feet below sea level near the Salton Sea.
Figure 1.1.1 Boundaries of the South Coast Air Quality Management District.
M o j a v e D e s e r t A i r B a s i n
S o u t h C o a s t A i r Q u a l i t y M a n a g e m e n t D i s t r i c t B o u n d a r i e s
C o a c h e l l a V a l l e yM o n i t o r i n g P l a n n i n g A r e a
S o u t h C o a s tM o n i t o r i n g P l a n n i n g A r e a

South Coast Air Basin and Coachella Valley Monitoring Planning Areas
5
1.2 Population Characteristics
The South Coast Air Basin (Basin) has experienced faster population growth than therest of the nation since the end of World War II. Although growth has slowedsomewhat, the region’s population is expected to increase significantly towards theend of the century and through 2020. Table 1.1.1 shows the projected growth basedon The Southern California Association of Government’s regional growth forecast.As shown in the Table, the population in the South Coast Air Basin is expected toincrease 1.5 times by the year 2020 from the 1990 levels.
The Coachella Valley is an even more rapidly growing area, with the populationexpected to double by the year 2020 from 1990 levels. As shown in Table 1.1.1, thevalley’s 1990 population was 267,000, with growth to 598,000 expected by the year2020. In addition to its permanent residents, over 100,000 seasonal residents spendthree to six months in the Coachella Valley. The northern part of the valley,northwest of Indio, is the most densely populated area, with residential housingprimarily toward the wind-sheltered areas near the foothills of the Santa RosaMountains. In recent years, however, population growth has pushed the residentialdevelopment northward, closer to the high wind belt.
Table 1.1.1 Historical population and population growth forecasts
Year South Coast Air Basin Coachella Valley1950 4,800,000 N/A1980 10,500,000 139,0001990 13,022,000 267,0002000 14,798,000 374,0002010 16,653,000 469,0002020 18,926,000 598,000
1.3 Climate and Weather
The topography and climate of Southern California combine to make the Basin anarea of high air pollution potential, including PM2.5 and PM10. During the summermonths, a warm air mass frequently descends over the cool, moist marine layerproduced by the interaction between the ocean’s surface and the lowest layer of theatmosphere. The warm upper layer forms a cap over the cool marine layer andinhibits the pollutants in the marine layer from dispersing upward. In addition, lightwinds during the summer further limit ventilation. These conditions are ideal for theformation of fine particles from precursor gaseous emissions. The abundance ofafternoon sunlight and the persistence of morning fog and low clouds trigger bothhomogeneous (gas phase chemistry) and heterogeneous (aqueous phase chemistry)reactions forming secondary particles in the Basin. In addition, the dry, hot summersare conducive to the generation of fugitive dust from earth-disturbing activities.

South Coast Air Basin and Coachella Valley Monitoring Planning Areas
6
In the fall and winter months, two meteorological conditions can occur which areconducive to high PM levels. Unlike the spring and summer months when persistentonshore winds sweep across the Basin to the north and east, high pressureperiodically develops over the desert areas in the fall and winter. If the desert highpressure system is weak, the desert high pressure counteracts the onshore sea breezeleading to very stagnant conditions in the Basin. Some of the highest 24-hour PMlevels resulting from secondary particles occur under this meteorological regime. Ifthe desert high pressure system is strong, then Santa Ana winds occur. Gusting attimes to velocities in excess of 60 miles an hour, Santa Ana winds flow from the northand east toward the ocean. This condition can lead to high levels of PM10 resultingfrom windblown fugitive dust.
The climate of the Coachella Valley is of the continental desert type, with hotsummers, mild winters, and very little annual rainfall. Precipitation is less than sixinches annually and occurs mostly in the winter months from active frontal systems,and in the late summer months from thunderstorms. Temperatures exceed 100degrees Fahrenheit, on the average, for four months each year, with daily highs near110 degrees Fahrenheit during July and August. Summer nights are very mild withminimum temperatures in the mid-70’s. During the winter season, daytime highs arequite mild, but the dry air is conducive to nocturnal radiational cooling, with earlymorning lows around 40 degrees.
The Coachella Valley is exposed to frequent gusty winds, primarily during the springand early summer months. The strong and most persistent winds typically occurimmediately to the east of Banning Pass. This wind condition is caused by strongpressure and air mass density differences between the desert air mass and the marine-modified coastal air mass. Surface low pressure in the desert causes cooler anddenser ocean-modified air to move through Banning Pass into the Coachella Valley.As synoptic weather patterns reinforce the localized regime through wind-inducingsurface pressure gradients, strong and widespread winds result. These winds canpersist for many hours and generally have a west-through-north wind component.Winds can also be generated by strong downbursts from summertime thunderstorms.Winds generated by this condition are more localized in nature, but strongdownrushes of cooler air can produce wind gusts which occasionally exceed 60 mph.These wind gusts and gust fronts can pick up large amounts of natural desert soilswhich, once suspended in the atmosphere, can be transported over large distances,even though the gustiness subsides. Since the necessary weather pattern forproducing such thunderstorms is one in which high level tropical moisture istransported into the deserts from areas to the southeast, these storms are typicallyassociated with erratic southeasterly winds.

South Coast Air Basin and Coachella Valley Monitoring Planning Areas
7
1.4 Dominant Economic Activities and Emission Sources
The economic base of the Basin is diverse. Historically, the four counties of the Basinhave collectively comprised one of the fastest-growing local economies in the UnitedStates. Until recently, the aerospace and electronic industries accounted for about 20percent of the Basin’s employment. Significant changes have occurred in thecomposition of the industrial base of the region in the past ten years. As in manyareas of the country, a large segment of heavy manufacturing, including steel and tiremanufacturing and automobile assembly, has been phased down. The aerospace andelectronics industries have been reduced in scale by cutbacks in defense spending.Replacing much of the heavy industry has been new growth in small serviceindustries and businesses related to increased shipping and trade.
Particulate matter in the Basin can either be directly or indirectly emitted from avariety of emissions sources. These sources can be natural, such as oil seeps,vegetation, or windblown dust. Emissions may also result from combustion, as inautomobile engines; from evaporation of organic liquids, such as those used incoating and cleaning processes; or through abrasion, such as from tires on roadways.In 1995, 412 tons per day of PM10 were emitted in the Basin. Over 80 percent of theseemissions were caused by stationary sources, with approximately 333 tonscontributed by fugitive dust from geological sources. About 38 tons per day ofprimary PM10 emissions were emitted by mobile sources. Point sources contributedthe remaining 10 percent of the PM10 emissions in the Basin.
The economy of the Coachella Valley is presently dominated by recreation, tourismand agriculture. Tourist amenities include 85 golf courses, 270 motels with a total of15,800 rooms, and large conference facilities. The area has over 58,000 acres ofproductive farmland with grapes, citrus, dates, and vegetables being the major crops.Total crop production in 1992 exceeded 283 million dollars. Agricultural activity isdominant south of Indio. Large employers in the area include Bird Products(manufacturing), Armtec Products (defense), and Sun World (food processing).
In 1995, 48 tons per day of PM10 were emitted in the Coachella Valley. Over 96percent of these emissions were caused by stationary sources, with approximately 47tons contributed by windblown dust, entrained road dust, construction/demolitionoperations, and farming operations. About 1.4 tons per day of primary PM10
emissions were emitted by mobile sources.
1.5 PM2.5 Monitoring Requirements
Three major metropolitan statistical areas (MSA) lie within the Basin--Los Angeles-Long Beach area, the Anaheim-Santa Ana area, and the Riverside-San Bernardinoarea. A map showing existing NAMS-SLAMS sites for monitoring gaseous andparticulate pollutants is shown in Figure 1.5 and each MSA, it’s population andnumber of required monitors is shown in Table 1.5.1. Each area has a population in

South Coast Air Basin and Coachella Valley Monitoring Planning Areas
8
excess of one million, thus requiring a minimum of two core sites. An additional siteis required since the air basin is a PAMS monitoring area. Proposed PM2.5 sites arelisted and discussed in the following sections.
Table 1.5.1 PM2.5 Monitoring Requirements
MSA/PMSAPopulatio
nin 1990
Core Monitors Basedon Population
Core Monitors inPAMS areas
(sampling everyday)TotalCore
samplingeveryday
Sampling1 in 3 day
Los Angeles-LongBeach, CA PMSA
8,863,164 2 8 0-1 10-11
Riverside-SanBernardino, CA PMSA
2,588,793 2 2 0-1 4-5
Orange County, CAPMSA
2,410,556 2 2 0 4
Coachella Valley CAPMSA
267,000 0 1 0 1

South Coast Air Basin and Coachella Valley Monitoring Planning Areas
9

South Coast Air Basin and Coachella Valley Monitoring Planning Areas
10
2.0 PM2.5 MONITORING NETWORK ELEMENTS
Several types of PM2.5 monitors are proposed for use in the monitoring network. Thissection summarizes the following: monitors planned for deployment in 1998 and1999, and existing particulate monitors at proposed PM2.5 sites. In addition to theSouth Coast Air Basin, the SCAQMD has jurisdiction over that northwest portion ofthe Salton Sea Air Basin in Riverside County. Monitoring in that area is included inthe South Coast monitoring network description. For a summary of particulate matteroutside the South Coast monitoring network, please refer to the statewide summary.
2.1 PM2.5 Monitors Planned for Deployment
In order to satisfy monitoring program objectives of the PM2.5 program, several typesof monitors will be employed. The primary objective of the monitoring program isthe development of a larger PM2.5 data base than currently exists to asses compliancewith the national ambient air quality standards (NAAQS) over a larger geographicalarea than covered by the existing data base. Such measurements would be made withfederal reference method (FRM) monitors. In addition, chemical speciationdeterminations are planned to resume at selected sites using the SCAQMD’s PM10
Technical Enhancement Program (PTEP) samplers described in section 4.2. This typesampler was used during the extensive PM2.5 monitoring program conducted in 1995.Also planned for use in the network are continued use of several dichotomoussamplers and real-time continuous monitors based on the beta attenuation principle(BAM). See the map, Figure 2.1.1 and Table 2.1.1 below for the planned distributionof monitors, by type.
South Coast Air Basin and Coachella Valley Monitoring Planning Areas
11
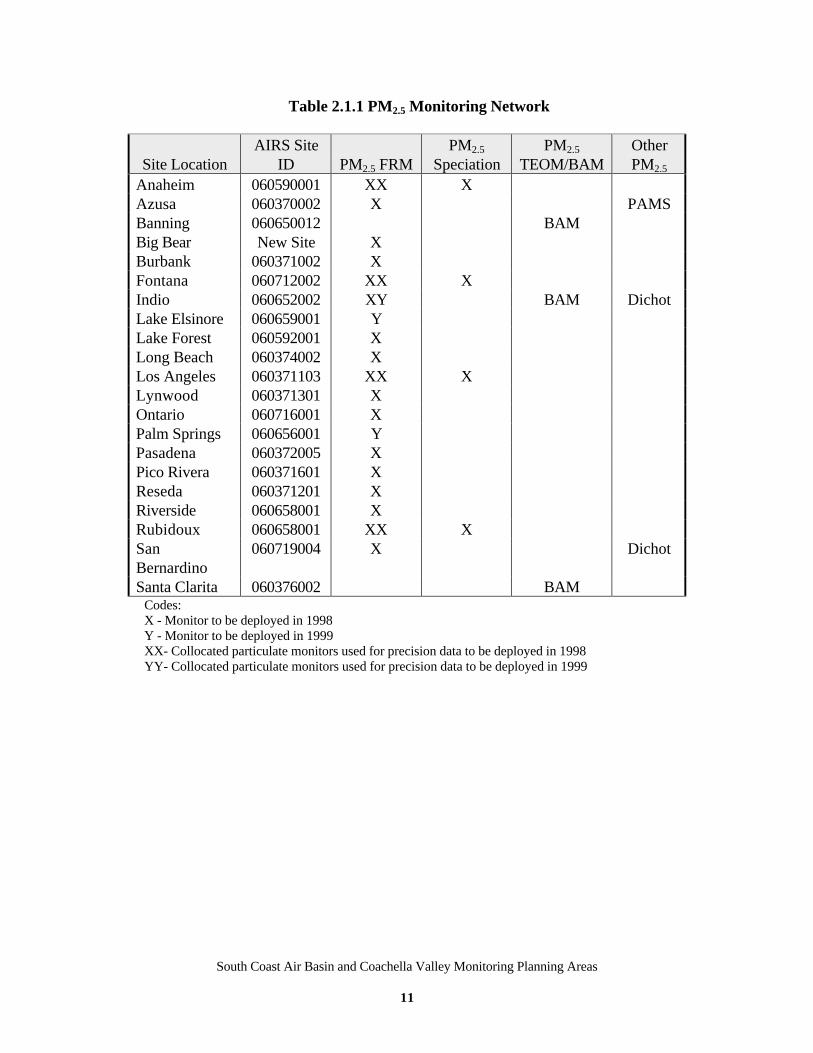
Table 2.1.1 PM2.5 Monitoring Network
Site LocationAIRS Site
ID PM2.5 FRMPM2.5
SpeciationPM2.5
TEOM/BAMOtherPM2.5
Anaheim 060590001 XX XAzusa 060370002 X PAMSBanning 060650012 BAMBig Bear New Site XBurbank 060371002 XFontana 060712002 XX XIndio 060652002 XY BAM DichotLake Elsinore 060659001 YLake Forest 060592001 XLong Beach 060374002 XLos Angeles 060371103 XX XLynwood 060371301 XOntario 060716001 XPalm Springs 060656001 YPasadena 060372005 XPico Rivera 060371601 XReseda 060371201 XRiverside 060658001 XRubidoux 060658001 XX XSanBernardino
060719004 X Dichot
Santa Clarita 060376002 BAMCodes:X - Monitor to be deployed in 1998Y - Monitor to be deployed in 1999XX- Collocated particulate monitors used for precision data to be deployed in 1998YY- Collocated particulate monitors used for precision data to be deployed in 1999

South Coast Air Basin and Coachella Valley Monitoring Planning Areas
12
Los Angeles
Anaheim
San Bernardino
Riverside
S C A Q M D A I R M O N I T O R I N G N E T W O R K
M ILES
0 25
S O U T H C O A S T A I R B A S I N ( S C A B ) C O U N T Y L I N E S
A I R M O N I T O R I N GS T A T I O N
Everyday schedule siteOne in three schedule site
Long Beach
Fontana
Ontario Rubidoux
El Toro
Lynwood
Pico Rivera
PalmSprings
Azusa
Burbank Reseda
Indio
Pasadena
Figure 2.1.1 Planned Locations of M onitors
Lake Elsinore
Big Bear
F e b r u a r y 1 9 9 6 V e r s i o n

South Coast Air Basin and Coachella Valley Monitoring Planning Areas
13
2.2 Existing Particulate Matter Monitors
The SCAQMD’s current particulate network, in addition to the several monitors forPM2.5, consists of SSI High Volume, dichotomous samplers, TSP High Volume, andbeta attenuation monitors (BAM) and tapered element oscillating microbalances(TEOM). These monitors and respective current locations are shown in Table 2.2.1below. For a statewide summary of particulate matter monitoring outside thepresently described network, please refer to the statewide summary.
Table 2.2.1 Existing Particulate Matter Monitors
Site LocationAIRS Site
ID DichotPM10SSI
PM10TEOM/BAM
ExistingParticulate
Matter Monitors
Anaheim 060590001 X BAMAzusa 060370002 X BAMBanning 060650012 XBurbank 060371002 X TEOMCrestline 060710005 XFontana 060712002 XGlendora 060370016 TEOMHawthorne 060375001 X TSPIndio 060652002 X X BAMLake Elsinore 060659001 TEOMLake Forest 060592001 XLong Beach 060374002 X XX TEOM TSPLos Angeles 060371103 XX BAM TSPLynwood 060371301 TSPNorco 060650003 XOntario 060716001 XXPalm Springs 060656001 X BAMPerris 060656001 XPico Rivera 060371601 TSPRedlands 060714003 XRiverside 060651003 TSPRubidoux 060658001 XX TEOM, BAM TSPSan Bernardino 060719004 X TSPSanta Clarita 060376002 XUpland 060711004 TEOM TSP
Codes:X Existing monitorXX Collocated particulate matter monitor used for precision dataTSP Total Suspended Particulate high volume samplerBAM Beta Attenuation PM10
TEOM Tapered Element Oscillating Microbalance PM10

South Coast Air Basin and Coachella Valley Monitoring Planning Areas
14
2.3 PM2.5 Quality Assurance
The SCAQMD is committed to achieving the very high level of data quality mandatedfor the PM2.5 monitoring program. The enabling legislation dictates that a wide arrayof Quality Assurance (QA) and Quality Control (QC) activities be performed by theFederal, State, and local agencies. These activities will assure that data generated inthe program meets the program’s data quality objectives for accuracy, precision,representativeness and completeness.
Quality Control activities are those procedures employed by the staff responsible foroperation of the sample collection and analysis. Under the guidance outlined in theDraft EPA Quality Assurance Handbook, Volume II, Part II, Section 12, SCAQMDwill establish procedures for day-to-day operations by SCAQMD staff. QCprocedures include but are not limited to: annual multipoint sampler flowcalibrations; biweekly sampler flow rate and leak checks; pre-sampling and postsampling temperature and pressure sensor checks; monthly timer accuracy checks;semimonthly inlet, impactor and well cleaning; quarterly inspection and greasing ofsampler o-rings; lab and field blanks on three filters of each filter lot; annualmicrobalance certification; daily microbalance zero and standard checks; and dailybalance room environmental checks. These QC activities will be performed bySCAQMD staff and will be implemented concurrently with the networkimplementation schedule.
Quality Assurance activities are procedures conducted in addition to the day-to-dayoperations of sampling and analysis that assure that the program’s data qualityobjective are being met. The Draft EPA Quality Assurance handbook cited abovealso establishes criteria for PM2.5 QA operations. The PM2.5 QA activities will beperformed by staff from EPA, CARB and SCAQMD. These activities will serve toassess the PM2.5 program’s accuracy, precision, representativeness and completeness.The QA activities include but are not limited to: FRM audits performed by an EPAcontractor (that are actually independent parallel sampling and analysis); quarterlyflow, temperature and pressure audits conducted by SCAQMD auditors; collocatedsampling at 25% of the sampling sites; and annual system and flow audits performedby ARB staff. The QA activities performed by SCAQMD will commence in the firstquarter of operation of the monitoring network. SCAQMD will also participate in anylaboratory system or performance audits conducted by EPA or ARB.
The SCAQMD is also prepared to institute other QA or QC activities that itdetermines appropriate. These activities might include QC procedures for samplemedia preservation during transport and storage as well as QA procedures for datavalidation and reporting. SCAQMD expects to work in close cooperation with EPAand ARB to implement all necessary QA/QC procedures necessary to assure validPM2.5 data.
South Coast Air Basin and Coachella Valley Monitoring Planning Areas
15
2.4 Laboratory Analyses
The SCAQMD’s Laboratory will conduct all weighing of filters for massdetermination. The District measured in excess of 1500 filters for its PTEP programrun in 1995. The District presently uses temperature and humidity controlledchambers but will install a temperature and humidity controlled room for themicrobalance within 3 months of receiving federal 103 grant funds. SCAQMDLaboratory Technicians have ten years experience in the handling of Teflon 47 mmfilters.
The SCAQMD uses a Cahn (ATI) 38-C microbalance reading to 0.001 milligram. Themicrobalance is interfaced to a computer utilizing a database program designed bySCAQMD to store data and make reports for Quality Assurance. The microbalance ison a marble table and operated in accordance with the SCAQMD QualityAssurance/Quality Control program. The SCAQMD will install a second identicalsystem by the second quarter of 1999 to handle the expected workload.
Filters will be received from the field in coolers within three working days of samplingand immediately placed in the temperature/humidity controlled environment for aminimum of 24 hours. The mass determination will follow the SCAQMD StandardOperating Procedure (SOP) that is in compliance with federal and state regulations.Once the filters are weighed they will be stored in refrigerators for a minimum of oneyear. The quality assured flow determinations from the field technicians will betransferred to the microbalance computer and the final report transferred to AIRS.
3.0 PM2.5 MONITORING SITES TO BE DEPLOYED IN 1998
The SCAQMD is planning to deploy seventeen PM2.5 sites in 1998. Out of these,seven are considered SLAMS core sites. The balance of the sites are non-core one inthree day sampling sites. This section defines why those sites were selected alongwith more important parameters that characterize those sites.
3.1 Monitor Siting
The U.S. EPA Federal regulation for PM2.5 requires that criteria for site selectioninclude locations with expected maximum concentrations and population density(Figures 3.1.1 and 3.1.2 show population and PM10 concentrations respectively, forthe South Coast Air Basin). SCAQMD has historically conducted monitoring inthose areas where high population exists as its primary mission. The most highlyconcentrated population exists in Los Angeles county. Therefore the largest numberof sites will be located in that county. The inland counties, Riverside and SanBernardino, are less densely populated but are receptors for emissions from upwind

South Coast Air Basin and Coachella Valley Monitoring Planning Areas
16
areas during the prevailing onshore air mass flow. These inland areas experience thehighest concentrations of particulate found in the South Coast Air basin.
Figure 3.1.1 Population Concentration in South Coast Air Basin
Figure 3.1.2 PM10 Concentrations in the South Coast Air Basin

South Coast Air Basin and Coachella Valley Monitoring Planning Areas
17
Orange County is less densely populated than Los Angeles County; howeverparticulate levels are consistently lower in Orange County than the inland counties.The northwest portion of the Salton Sea Air Basin, the Coachella Valley, experiencessome transport from the South Coast Air Basin, but also has its own sources ofparticulate, primarily crustal matter. SCAQMD has, over the years, attempted tolocate its monitoring sites in locations that are representative of the populated areas.Thus it is appropriate to locate PM2.5 sites at existing monitoring locations wheneverpractical. It is also desirable to locate PM2.5 sites at locations that have previouslymeasured PM10 and TSP to better understand the size distribution of particulatematter. There are also several main transport routes from the South Coast Air Basinthat should be documented -- the Soledad and Cajon Passes into the Mojave DesertAir Basin and the San Gorgonio Pass into the Salton Sea Air Basin. This transportcan be studied with a combination of FRM and continuous analyzers. Further,SCAQMD will include a mountain area monitor where winter populations increasedue to recreational activities. The proposed site is Big Bear, in the Central SanBernardino Mountains, which lies in a valley where wood smoke may be a factorduring the winter season. The proximity of an existing air monitoring site in Crestlineis not topographically favored for potential woodsmoke accumulations, nor does thatarea experience the recreational increase in population that Big Bear receives.

South Coast Air Basin and Coachella Valley Monitoring Planning Areas
18
3.2 Site Description
In 1998 the SCAQMD will deploy 17 PM2.5 sites using Federal Reference Method(FRM) samplers. These samplers will be purchased through national contracts. Datafrom these sites will be compared with both the annual average standard and the 24-hour average standard to extend the current PM2.5 data base. These sites arepopulation-oriented in keeping with the SCAQMD’s historic mission, and they arerepresentative of a neighborhood spatial scale. These sites are all neighborhood scaleand set out a good ground work for the network, giving wide geographic coverage andlying in the two primary air mass routes from the Los Angeles County and OrangeCounty coastal areas to the inland valleys. (See Table 3.2.1.) Anaheim and LakeForest are in residential-commercial areas, Los Angeles and Long Beach are incommercial areas with some vehicular traffic influence, Azusa is in a light industrialarea, and Fontana and Riverside (Rubidoux) are in semi-rural residential areas. A sitedescription containing greater detail of each site will be included with the final PM2.5
network plan. An example of a site report is included as attachment A.
Table 3.2.1 PM2.5 Sites to be Deployed in 1998
Site Location Airs Site IDOperatingAgency
SpatialScale
Monit.Objective2
SiteType3
Meas.Method
4
Anaheim 060590001 SC N1 R C FRMAzusa 060370002 SC N R, P C FRMBig Bear New Site SC N R S FRMBurbank 060371002 SC N R S FRMFontana 060712002 SC N M,T C FRMLake Forest 060592001 SC N R C FRMLynwood 060371301 SC N R S FRMLong Beach 060374002 SC N R, HS C FRMLos Angeles 060371103 SC N R,M C FRMOntario 060716001 SC N M S FRMPasadena 060372005 SC N R S FRMPico Rivera 060371601 SC N R S FRMReseda 060371201 SC N R S FRMRiverside 060651003 SC N R, T S FRMRubidoux 060658001 SC N M C FRMSan Bernardino 060719004 SC N R,T S FRMIndio 060652002 SC N M,T S FRM
1 Neighborhood Scale2 Monitoring Objective Codes: R - To determine high concentrations in a populated area; M - To
determine the highest concentration expected to occur in an area covered by the network; T - todetermine the extent of regional pollutant transport; HS - to support special health studies; P -Location satisfying PAMS requirement.
3 Site Types: C - Core SLAMS; S - Non Core SLAMS; P - Special Purpose Monitors.4 The proposed FRM device is the Graseby sequential sampler.

South Coast Air Basin and Coachella Valley Monitoring Planning Areas
19
4.0 PM2.5 MONITORING SITES TO BE DEPLOYED IN 1999
In 1999 the SCAQMD plans to establish additional PM2.5 FRM monitors tocomplement the sites established in 1998. These sites will provide additionalinformation in better defining boundaries of non-attainment areas and clarify transportroutes and satisfy other objectives of the PM2.5 monitoring network. The SCAQMDalso plans to deploy real-time continuous PM2.5 monitors in 1999 to supplement theFRM network. See also Section 3.0
4.1 Monitoring Sites Operating PM2.5 FRM Monitors
In 1999 SCAQMD is planning to deploy additional monitoring sites equipped withFRM monitors. Lake Elsinore has been selected as a site for better geographicalrepresentation of attainments/nonattaiment boundaries and to support ongoing heathstudies and Palm Springs has been selected to provide better representation for localconditions and regional transport. Lake Elsinore is in a commercial/residential areawith some impact from vehicular traffic and Palm Springs is a residential area.
Table 4.1.1 PM2.5 Monitoring Sites to be Deployed in 1999
Site Location Airs Site ID OperatingAgency
SpatialScale
Monit.Objective
SiteType
Meas.Method
Lake Elsinore 060659001 SC N M,HS S FRMPalm Springs 060655001 SC N M,T S FRM(Legend: See Table 3.2.1)
4.2 PM2.5 Chemical Speciation Sampling
SCAQMD proposes to conduct sampling for chemical speciation at 4 sites usingPTEP samplers as was the case in the extensive study in 1995. The sampling locationwill be the same as in that study and shown in Table 4.2.1 below. The SCAQMD isstrongly recommending the use of the PTEP samplers to allow for better continuity ofspeciated data. These samplers have demonstrated excellent field results, and havecompared well to the FRM in limited sampling.
Table 4.2.1 PM2.5 Chemical Speciation Monitoring
Site Location Airs Site ID Operating Agency Monitoring MethodAnaheim 060590001 SC TEP-2000Fontana 060712002 SC TEP-2000Los Angeles 060371103 SC TEP-2000Rubidoux 060658001 SC TEP-2000

South Coast Air Basin and Coachella Valley Monitoring Planning Areas
20
PTEP Enhanced Ambient Air Monitoring Program
In December 1994, the SCAQMD initiated a comprehensive program, the PM10
Technical Enhancement Program (PTEP), to characterize fine particulate matter in theSouth Coast Air Basin (Basin). To build an optimal PM database for the 1997 PM10
State Implementation Plan (SIP) and Air Quality Management Plan (AQMP) revision,a one-year special particulate monitoring program was initiated in January 1995 aspart of the PTEP program. Under this enhanced monitoring, nitric acid, ammonia,and speciated PM10 and PM2.5 concentrations were measured at five stations in theBasin and at one background station at San Nicholas Island, located 80 miles off theSouthern California Coast. The PM10 data was the first speciated data collected for airquality planning purposes since 1986, and the PM2.5 data was the first such speciateddata collected in the Basin on an annual basis. The successful one-year PTEPmonitoring program was essential to the modeling analysis and development of the1997 AQMP.
TEP 2000 Enhanced Ambient Air Monitoring Program
As a sequel to the PTEP program, the SCAQMD has initiated, a comprehensiveprogram to characterize the ozone and PM problem in the Basin for the upcoming2000 AQMP. Under this Technical Enhancement Program for the 2000 AQMPrevision (TEP 2000), a one-year special monitoring program will be conducted in theBasin from August 1998 through July 1999. A one-in-three day sampling schedulewill be conducted at eight sites including: Downtown Los Angeles, Anaheim,Diamond Bar, Fontana, Rubidoux, Ontario, Long Beach and Costa Mesa. Inaddition, if sufficient resources are available, daily sampling will be conducted at threeof the sites (Downtown Los Angeles, Anaheim, and Rubidoux) during the peakOctober through November period. The TEP 2000 ambient monitoring program willprovide a much more complete data base for the chemical speciation required underEPA’s new PM10/PM2.5 regulatory standards, and more complete data for receptorand dispersion modeling. In the following text, PM sampler, sampling location andschedule, and sample analysis for the TEP 2000 program are explained.
SCAQMD-MCFP Sampler (PTEP Sampler)
For the PTEP special monitoring program, the PM sampler used for the SCAQS(Southern California Air Quality Study) was specially modified to improve samplehandling and maintenance. The same modified PM sampler used for the PTEPprogram will be used for the TEP 2000 ambient monitoring program. The samplerconsists of three separate components: the main sampler box, the control box, and thepump box. For ease of use, color-coded “quick fit” connections were used at allpossible connection sites. The main sampler box, shown in Figure 4.2.1, has four
South Coast Air Basin and Coachella Valley Monitoring Planning Areas
21
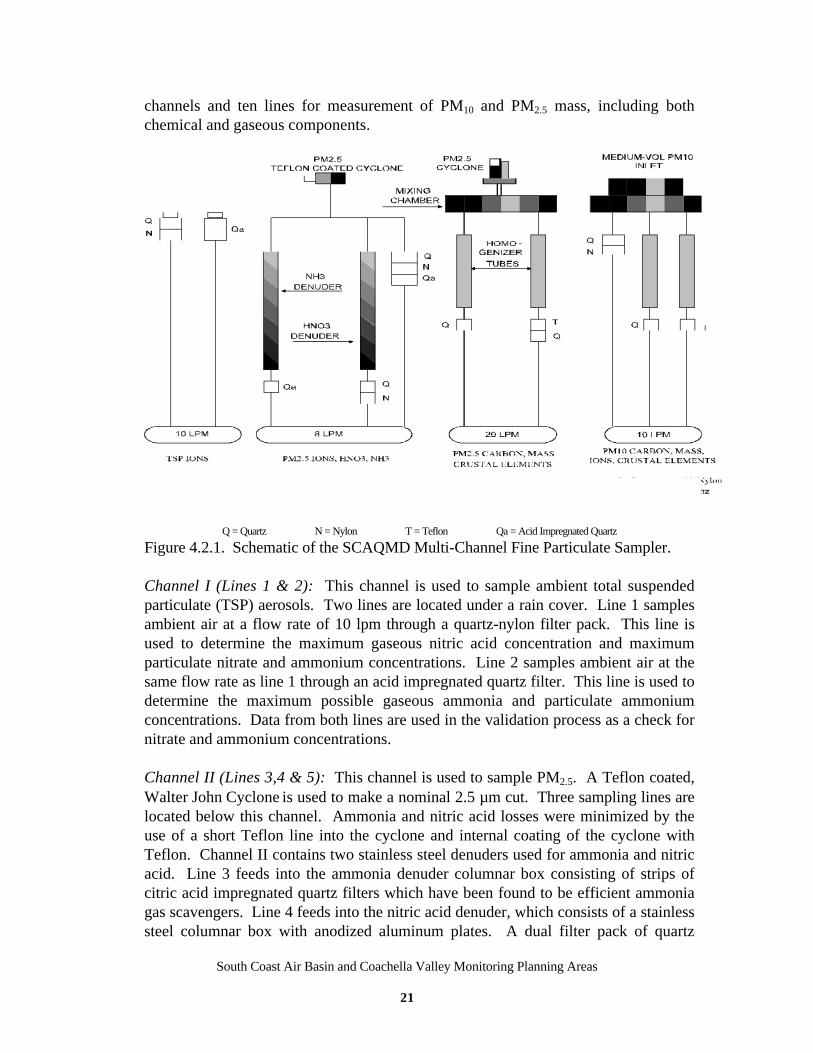
channels and ten lines for measurement of PM10 and PM2.5 mass, including bothchemical and gaseous components.
Q = Quartz N = Nylon T = Teflon Qa = Acid Impregnated Quartz
Figure 4.2.1. Schematic of the SCAQMD Multi-Channel Fine Particulate Sampler.
Channel I (Lines 1 & 2): This channel is used to sample ambient total suspendedparticulate (TSP) aerosols. Two lines are located under a rain cover. Line 1 samplesambient air at a flow rate of 10 lpm through a quartz-nylon filter pack. This line isused to determine the maximum gaseous nitric acid concentration and maximumparticulate nitrate and ammonium concentrations. Line 2 samples ambient air at thesame flow rate as line 1 through an acid impregnated quartz filter. This line is used todetermine the maximum possible gaseous ammonia and particulate ammoniumconcentrations. Data from both lines are used in the validation process as a check fornitrate and ammonium concentrations.
Channel II (Lines 3,4 & 5): This channel is used to sample PM2.5. A Teflon coated,Walter John Cyclone is used to make a nominal 2.5 µm cut. Three sampling lines arelocated below this channel. Ammonia and nitric acid losses were minimized by theuse of a short Teflon line into the cyclone and internal coating of the cyclone withTeflon. Channel II contains two stainless steel denuders used for ammonia and nitricacid. Line 3 feeds into the ammonia denuder columnar box consisting of strips ofcitric acid impregnated quartz filters which have been found to be efficient ammoniagas scavengers. Line 4 feeds into the nitric acid denuder, which consists of a stainlesssteel columnar box with anodized aluminum plates. A dual filter pack of quartz
South Coast Air Basin and Coachella Valley Monitoring Planning Areas
22
followed by nylon, is mounted below this denuder. The quartz filter collects theparticulate nitrate and the nylon filter is used to quantitatively trap any gaseous nitricacid that has penetrated through the denuder and volatilized from the front quartzfilter.
Line 5 consists of an all-Teflon filter pack (Savillex) with three stages. A quartz filterfollowed by a Nylosorb (Gelman) and citric acid impregnated quartz filter are allmounted beneath this line. This line collects PM2.5 particulate, nitric acid andammonia gas, and is used as the non-denuded leg of the denuder system to be usedlater for the determination of particulate nitrate, ammonium, nitric acid and ammoniagas by the denuder difference method.
Channel III (Lines 6 & 7): The two lines connected to this channel are used tosample fine particles for determination of PM2.5 mass, organic and elemental carbon,and inorganic trace metals. The size segregation is made in this channel with the useof a stainless steel Sensydyne model 240 cyclone which has the desired inlet cut size.A stainless steel bowl with stainless steel mesh protects the inlet of the cyclone.Because of the high volume flow characteristic (110 lpm) of the cyclone, a stilling ormixing chamber coated with Teflon is used prior to the splitting of the flow into twolines. Since both the carbon analysis and elemental analysis utilize techniques whoseprecision is sensitive to the homogeniety of particle deposits on the filter, flowhomogenizers were used. The homogenizers are 30 cm long stainless tubes withinternal diameters of 4.5 cm. Line 6 samples PM2.5 carbon while line 7 captures massand inorganic trace metal concentrations.
Channel IV (Lines 8,9, & 10): The fourth channel is used to sample PM10. Amedium volume PM10 sampler (Anderson model GMW-254-I) is used as a PM10 inlet.Three lines are located below this channel. Line 8 is used to sample PM10 particulateions using a quartz/nylon filter combination mounted on a Gelman filter holder. Line9 is used to sample PM10 carbon with a flow homogenizer and a quartz filter mountedon a Gelman filter holder. Line 10 is used to sample PM10 mass and trace elementalcomponents using a Palliflex Teflon filter mounted below a flow homogenizer.

South Coast Air Basin and Coachella Valley Monitoring Planning Areas
23
Sampling Locations and Schedule
PM10 and PM2.5 24-hour sampling will be conducted at eight monitoring stations(Downtown Los Angeles, Anaheim, Diamond Bar, Fontana, Rubidoux, Ontario,Long Beach, and Costa Mesa) in the Basin as shown in Figure 4.2.2. Three moresampling locations (Ontario, Long Beach, and Costa Mesa) will be added to the PTEPsampling locations. The sampling will be performed both upwind and downwind ofsignificant ammonia sources in the Basin. Diamond Bar is a representative area at theurban fringe and upwind of ammonia sources. Ontario represents a site downwind ofprimary urban particulate source and also located at significant ammonia sources.Fontana and Rubidoux represent downwind receptor areas and also downwind ofammonia sources. Monitoring will also be focused at sources with significantcontributions by mobile and stationary source emissions. The Los Angeles andAnaheim sites are representative of primary vehicle and stationary source emissionsareas. The Long Beach site is representative of coastal primary vehicle and stationarysource emissions. Costa Mesa will be used as a coastal background site in the Basinto characterize PM data from the upwind clean background air mass moving into theBasin.
Enhanced Fine Particulate MonitoringNetwork
SCAQMDAIR MONITORING NET WORK
M IL ES
0 2 5
SOUTH COASTAIR BASIN (SCAB)
COUNTY LINES
AREA LINES
AIR MONITORINGSTATION
APRIL 1995 VERSION
Los Angeles County
Orange County
Los Angeles
Diamond BarFontana
Rubidoux
Anaheim
San Bernardino County
Riverside County
Ontario
Costa M esa
Long Beach
Figure 4.2.2 Particulate Monitoring Network for TEP 2000

South Coast Air Basin and Coachella Valley Monitoring Planning Areas
24
The TEP 2000 monitoring program will be conducted from August 1998 through July1999 on a one-in-three day sampling schedule. During the high PM season months ofOctober and November, if sufficient resources are available, daily sampling will beconducted at three of the sites (Downtown Los Angeles, Anaheim, and Rubidoux) toprovide a continuum of daily speciated database across the Basin to help validate theepisodic PM model such as UAM-AERO and to provide a more detailed database forcharacterizing high PM conditions. To conserve limited resources, however, samplingwill not be conducted on days of predicted rain.
Quality Assurance
At two of the eight locations (yet to be determined), duplicate PTEP samplers will beoperated. This is consistent with EPA guidance of having 25 percent of the networkbe located with the same type of sampler.
Sample Analysis
At each location, state-of-the-science sampling equipment will be deployed to collectfine and coarse particulate fractions. Total mass and 43 species (Mg, Al, Si, P, S, Cl,K, Ca, Ti, V, Cr, Mn, Fe, Co, Ni, Cu, Zn, Ga, As, Se, Br, Rb, Sr, Y, Mo, Pd, Ag, Cd,In, Sn, Sb, Ba, La, Au, Pb, U, OC, EC, Cl, Na, NO3, SO4, NH4) will be analyzed for afull chemical speciation of the particle data. Total mass will be determinedgravimetrically as collected on Teflon filters, and the concentrations of 36 traceelements will be determined by Energy Dispersive X-ray Fluorescence. Quartz fiberfilters will be used to collect samples to be analyzed for organic carbon and elementalcarbon using an optical thermal carbon analyzer (DRI model 4000X). Water solubleionic species, such as NO3, SO4, NH4, Na, and Cl will be extracted from the quartzand nylon filters and analyzed by ion chromatography. Two gaseous species, nitricacid and ammonia, will be determined by the denuder difference method and PMconcentrations will be measured by filters on a filter pack.
A total of 16 filters will be analyzed for each 24-hr sample from each sampler at eachsite and each collocated sampler: 7 quartz filters will be extracted for ion analysis(NH4, NO3, SO4, Cl, Na); 3 quartz filers will be analyzed for carbon analysis; 4 nylonfilters will be used for nitrate analysis; and 2 Teflon filters will be used for massmeasurements and elemental analysis. Field blanks will be collected from allsampling sites for each month and will be chemically analyzed. The analyzed resultswill be used to determine the background levels of chemical components deposited onthe filters and sample concentrations will be adjusted accordingly.
PM Data Use
As noted previously, the TEP 2000 ambient monitoring program will provide a muchmore complete database for the chemical speciation required under the new EPAPM10/PM2.5 standards, and a more complete database for receptor and dispersion

South Coast Air Basin and Coachella Valley Monitoring Planning Areas
25
modeling. The October and November time frame is the seasonally favorable time forhigh ambient particulate concentrations. If conducted, daily sampling during Octoberand November will provide a continuum of daily speciated data across the Basin tohelp validate episodic PM models such as UAM-AERO, and will provide a moredetailed database for characterizing high PM conditions.
The TEP 2000 PM data will be essential to the modeling analysis and development ofthe 2000 AQMP. The data will be used to estimate the source contributions using theChemical Mass Balance (CMB) receptor model, and will also be used for theperformance evaluation of the annual PM model UAM/LC and the episodic model ofUAM-AERO. The data will also provide invaluable information on the chemicalcomposition, spatial and temporal variations of PM10 and PM2.5 in the Basin. TheTEP 2000 data can also be used by academia, health-related research groups, andenvironmental groups as well as the U.S. EPA for evaluation of the new PM2.5
standard.
Post TEP 2000 Enhanced Ambient Air Monitoring Program
The TEP 2000 ambient monitoring program will be concluded at the end of July,1999. However, PM sampling will still be continued at four locations (Anaheim,Downtown Los Angeles, Fontana and Rubidoux) once every three days on anongoing basis with one site having a collocated sampler. All four sites will have PM2.5
FRMs as part of the core network. It is anticipated that the network will be expandedevery third year to meet AQMP needs, and in the intervening two years, these foursites will provide value for continuity and trend purposes.
4.3 Continuous PM2.5 Monitoring
Continuous BAM samplers fitted with a PM2.5 cut point inlet are planned for use tosupplement FRM monitors at several sites. BAM monitors are selected becauseexperience in the Basin indicate that the BAM is less susceptible to data errors causedby volatilization of organic and nitrate fractions than the micro balances technique.Proposed PM2.5 BAM sites are listed in Table 4.4.1, below.
Table 4.3.1 Continuous PM2.5 Monitors to be Deployed in 1999
Site Location Airs Site IDOperatingAgency
MonitoringObjective
MonitoringMethod
Banning 060650012 SC T PM2.5 BAMIndio 060652002 SC T PM2.5 BAM
Santa Clarita 060376002 SC T PM2.5 BAM(Legend: See Table 3.2.1)

South Coast Air Basin and Coachella Valley Monitoring Planning Areas
26
5.0 SAMPLING FREQUENCY
The federal requirements specify everyday sampling for PM2.5 at certain core SLAMSlocations and one in three day sampling at all other PM2.5 sites. In the South CoastAir Basin and Coachella Valley Air Basin there are a total of seventeen sites to beimplemented in 1998. Out of these seventeen, seven sample on a everyday schedule,the remainder on a one in three day basis. There are two additional sites in 1999 thatwill operate on a one in three day schedule and four speciation samplers that will runon a one in twelve day basis.
PM10 sites are required to sample on a one in three day basis but SCAQMD hasdetermined moving to a one in three day schedule from the current one in six wouldnot be of significant benefit to the database considering the current concentrations ofPM10 and limitation of monitoring resources. We propose the current schedule of onein six for all sites with the exception of Rubidoux and Indio which would adhere tothe one in three day requirement until a waiver is approved. Please refer toAttachment 1 of the February 20, 1998, letter from the ARB for further informationregarding EPA sampling frequency requirements.
5.1 PM2.5 FRM Sampling Frequency
The SCAQMD will operate the PM2.5 network according to the schedule proposed byEPA, although concerns regarding adequate funding remain. During the start-up ofthe network in 1998, all sites will operate on a one-day-in-three basis, using the waiverprovisions from daily sampling as allowed by USEPA. Beginning on January 1, 1999,the seven core sites proposed for daily sampling will begin operating in that mode.The sites with primary mass samplers selected for implementation beginning in 1998and 1999 are summarized along with their schedules in Table 5.1.1.

South Coast Air Basin and Coachella Valley Monitoring Planning Areas
27
Table 5.1.1 PM2.5 Sampling Frequency
Site Location AIRS Site ID
RequiredSamplingFrequency
Proposed TimePeriod
ProposedFrequency
Indio 060652002 1 in 3 1-1-99 1 in 3Anaheim 060590001 Everyday 1-1-99 Everyday
Azusa 060370002 Everyday 1-1-99 EverydayBig Bear New site 1 in 3 1-1-99 1 in 3Burbank 060371002 1 in 3 1-1-99 1 in 3Fontana 060712002 Everyday 1-1-99 1 in 3
Lake Forest 060592001 Everyday 1-1-99 1 in 3Los Angeles 060317103 Everyday 1-1-99 Everyday
Lynwood 060371301 1 in 3 1-1-99 1 in 3Long Beach 060374002 Everyday 1-1-99 Everyday
Ontario 060716001 1 in 3 1-1-99 1 in 3Pasadena 060372005 1 in 3 1-1-99 1 in 3
Pico Rivera 060371601 1 in 3 1-1-99 1 in 3Reseda 060371201 1 in 3 1-1-99 1 in 3
Riverside 060651003 1 in 3 1-1-99 1 in 3Rubidoux 060658001 Everyday 1-1-99 Everyday
San Bernardino 060719004 1 in 3 1-1-99 1 in 3Palm Springs 060655001 1 in 3 8-1-99 1 in 3Lake Elsinore 060659001 1 in 3 8-1-99 1 in 3
5.2 PM2.5 Chemical Speciation Sampling Frequency
The federal requirements suggest one in twelve day sampling for speciated PM2.5.SCAQMD will sample on a one in twelve day basis following the end of the TEP 2000sampling program at four locations. These locations will sample on a one-in-three-day basis from August of 1998 to July, 1999. If SCAQMD determines that thesampling frequency is not adequate to support control plan development, the Districtis prepared to make appropriate adjustments to the sampling frequency.
5.3 PM10 Sampling Frequency
The new U.S. EPA federal regulation requires the sampling frequency for PM 10 toincrease from the current one in six day to one in three day. The SCAQMD requeststhe U.S. EPA Region IX grant a statewide waiver allowing sampling to remain at thecurrent one in six day schedule, with the exception of Rubidoux and Indio, becausehistorical data indicate these are the locations most likely to exceed the 24-hour PM10
standards. Sites that will not be covered by the requested waiver are listed in Table5.3.1.

South Coast Air Basin and Coachella Valley Monitoring Planning Areas
28
Table 5.3.1 PM10 Sites Not Covered by Requested Waiver
Site Location AIRS Site ID
RequiredSamplingFrequency
Date to InitiateIncreasedFrequency
ProposedFrequency
Rubidoux 060658001 1 in 3 2-1-98 1 in 3Indio 060652002 1 in 3 6-1-98 1 in 3

South Coast Air Basin and Coachella Valley Monitoring Planning Areas
29
Appendix A
Site Descriptions
∗ Note: Only the Azusa site is provided at this time as an example. The completed sitedescriptions will be provided with the final version of this report.