patient perceptions of quality in discharge instruction · patient perceptions of quality in...
TRANSCRIPT

Patient perceptions of quality in discharge instruction
Paul Alexander Clark*, Maxwell Drain, Sabina B. Gesell, Deirdre M. Mylod,Dennis O. Kaldenberg, Julie Hamilton
Press Ganey, Research Service and Strategy, 404 Columbia Place, South Bend, IN 46601, USA
Received 15 December 2003; received in revised form 23 August 2004; accepted 18 September 2004
Abstract
The present study investigates patient perceptions of the quality of discharge instruction by assessing inpatients’ ratings of care and service
in the United States over the past 5 years (1997–2001) (n = 4,901,178). As expected, patients’ ratings of ‘‘instructions given about how to care
for yourself at home’’ showed a strong, consistent positive relationship with overall patient satisfaction from 1997 through 2001. Nevertheless,
patient satisfaction with discharge instructions decreased significantly each year (p < 0.001). Patients gave lower ratings to the quality of
discharge instruction than to the overall quality of their hospital stay which indicates a failure to match the quality delivered among other
services within the hospital. Patient assessments of discharge instruction quality varied systematically among conditions. Patients with
musculoskeletal diseases and disorders (MDC-8) rated discharge instruction considerably lower than all other patient groups. Patients’ age,
sex, self-described health status and length of stay did not predict patients’ evaluations of discharge instructions. U.S. hospitals may not be
meeting existing AMA and JCAHO standards for patient education and discharge.
# 2004 Published by Elsevier Ireland Ltd.
Keywords: Patient satisfaction; Patient discharge; Patients; Health services; Patient education
www.elsevier.com/locate/pateducou
Patient Education and Counseling 59 (2005) 56–68
1. Introduction
1.1. What quality of service do patients want and receive?
‘‘Patients want to be taken seriously both as patients and as
real people whose family and social and economic lives have
been threatened or disrupted by the medical problem and by
the isolation and disorientation of hospitalization’’ [1].
Discharge from the hospital represents a serious and
complex transition in patients’ lives. Patients and their
families begin to cope with the repercussions of illness in
their daily life absent the comprehensive support of nurses
and physicians. The stress and anxiety involved only serve to
intensify patients’ needs for information, education and
reassurance. This information is critical to the patient’s
welfare; nineteen percent of patients have adverse events
after discharge [2].
* Corresponding author. Tel.: +1 574 232 3387x249;
fax: +1 574 233 8251.
E-mail address: [email protected] (P.A. Clark).
0738-3991/$ – see front matter # 2004 Published by Elsevier Ireland Ltd.
doi:10.1016/j.pec.2004.09.010
Recent studies have substantially increased the body of
knowledge and understanding of patients’ informational and
educational needs in preparation for discharge [3–11].
Patients desire information on follow-up, home care,
symptom management, pain management and coping with
potential health problems [5–7]. Patients want specific
written information and resources on follow-up and
community services [6,10], pain treatment [6,11], and life
activities [6] (e.g., ‘‘What could or could not be done’’ [10]).
In fact, Gustafson et al. [8] found that information and
support needs of patients outweighed care delivery needs
and any service concerns.
Despite the value and demand for this information,
between 27 and 80% of patients do not receive the desired
amount of information [7,9,12]. In addition to general
informational needs, clinically related educational needs are
also slipping through the cracks. Rowe et al. [13] surveyed
patients following a stay of 5 days or less revealing that
over 50% of these patients failed to receive information on
‘‘side effects,’’ ‘‘recovery at home’’ or ‘‘community health
services’’. Jones et al. [14] found that 81% of patients

P.A. Clark et al. / Patient Education and Counseling 59 (2005) 56–68 57
needing assistance with basic functional needs failed to
receive home care referrals and 64% of these patients
reported that no one at the hospital had talked to them about
‘‘managing at home’’. A postdischarge follow-up study
found that 50% of patients dependent upon others for basic
functional needs failed to receive home care referrals [15].
In a recent study by Bowles et al. [16], more than 56% of
patients discharged did not receive a home care referral
despite being screened into the study on the basis of this
need and being at risk for poor discharge outcomes—96% of
these patients had unmet discharge needs. Such studies
confirm observations that, as a side effect of U.S. health care
consumerism, patients and families have assumed greater
direct responsibility for their own care; care which is often
complex and dangerous [17].
Patients’ postdischarge care needs, usually undertaken by
families, range from errands and household chores to basic,
functional needs (e.g. bathing, getting dressed, etc.) to
nontrivial medical needs (e.g. changing dressings, wound
care, help with physical therapy regimens, etc.) [18]. The
majority of caregivers care for patients’ personal needs
following hospitalization, and three-fourths assume respon-
sibility for five or more tasks (e.g. preparing meals,
administering medication, etc.) [19]. Caregivers frequently
do not feel adequately prepared to assume these responsi-
bilities [20].
Table 1
Summary of JCAHO Standards for patient education and AMA Standards for di
Joint Commission Standards
No. Standard
PF.1 An assessment of the patients’ learning need
emotional barriers, desire, motivation, physic
(for the patient) and includes:
� medication use education; medical equip
on nutrition; techniques to help patients adap
� information on when and how to obtain
� elucidate to patients and families respon
and the knowledge and skills to carry them o
� education and help maintaining good hy
PF.2 Patient education is interactive.
PF.3 Provide discharge instructions to the respons
PF.4 The hospital plans, supports, and coordinates
education—including provision of all resourc
collaborative and interdisciplinary.
American Medical Association Standards
No. Standard
1 Discharge criteria should be based on data fr
social and functional needs.
2 An interdisciplinary team is necessary for co
3 Early assessment and planning should be org
equipment or training can be arranged in tim
4 Postdischarge medical care requires arrangem
for easy access to continuing physician care.
5 Patient and caregiver education in meeting p
Patients and caregivers should be able to dem
the care needs before discharge.
6 Coordinated, timely and effective communic
the patient is essential and should be well es
Patients and families who do receive hospital discharge
planning, counseling, home care referrals and other social
interventions often do not find these interventions
beneficial [21,22]. Posthospital needs for care, assistance
and information (e.g. activity limitations) persist [23,24],
discharge plans are not implemented as planned [25], and
home care services deviate from discharge plans or
unexpectedly terminate within a few weeks after discharge
[26]. Nurses routinely underestimate patients’ needs at
discharge, overestimate the quality and amount of
education and information provided and fail to discern
the same needs that patients and caregivers find important
[27–29].
In short, patients and caregivers want information on
what to expect, how to manage, when and where to get help,
education on their illness and recovery, counseling,
continuity of care and involvement in discharge preparation
and decision making.
1.2. Research questions
Previous research has explicated patients’ needs for
discharge instructions—we know what patients want. In
addition to this knowledge, practitioners are guided by the
American Medical Association and the Joint Commission
on Accreditation of Healthcare Organizations which provide
scharge
s, abilities, preferences, and readiness which considers culture, religion,
al and cognitive limitations, language barriers and financial implications
ment use education; information on drug-food interaction and counseling
t and function independently; information on community resources;
any further treatment potentially needed;
sibilities for ongoing health care needs
ut;
giene.
ible caregiver in addition to the patient or family.
activities and resources for patient and family
es required and that this education process be
om assessments of physiological, psychological,
mprehensive planning to meet the patient’s needs.
anized so that necessary personnel,
e for discharge.
ents (before discharge)
ostdischarge patient needs should occur prior to discharge.
onstrate their understanding and ability to meet
ation between all health professionals, caregivers and
tablished before discharge.

P.A. Clark et al. / Patient Education and Counseling 59 (2005) 56–6858
comprehensive standards for a quality discharge process,
patient education and continuity of care (Table 1) [30,31].
But do these standards result in discharge instruction that
patients assess as high-quality relative to overall perceptions
of health care service quality? What aspects of the hospital
experience are linked to satisfaction with discharge
instruction? Do patients with different conditions experience
discharge instruction differently? Do any demographic
variables (e.g. age, sex, self-described health status and
length of stay) predict patient satisfaction with discharge
instruction? Do patients perceive discharge instruction
differently than information giving? To date, no study
has investigated patients’ assessments of the quality of
discharge instruction currently being delivered on a national
level.
The present cross-sectional study investigates patients’
satisfaction with instructions on home care at discharge in
the United States over the past 5 years (1997–2001) to reveal
common perceptions, establish a national benchmark and to
detect any trends. Establishment of benchmarks and
identification of trends in health care quality will be of
interest to public health officials, especially in light of the
possibility of a government-mandated patient satisfaction
survey [32–34]. Understanding patient perceptions will help
practitioners structure discharge instruction towards opti-
mizing the outcome of patient satisfaction.
Patient satisfaction is an outcome of quality care [35,36]
and a precise measure of service quality in health care
[35,37–40]. The ratings method (e.g. Likert-type scales) of
measuring patient perceptions’ of the hospitalization
experience allows the patient to evaluate quality in relation
to the patients’ own needs, not an imposed standard [41].
Therefore, patient satisfaction can reflect changing con-
sumer values, quality of care and service quality at the
national and local levels.
A previous Health Care Advisory Board (HCAB) study
of overall inpatient satisfaction using the identical methods
and a similarly large national dataset revealed a stable
equilibrium across several years [42]. Patients’ expectations
for service and quality likely have increased in tandem with
hospitals’ improvements. The overall level of patient
satisfaction was expected to remain unchanged between
1997 and 2001 and for patients’ evaluations of discharge
instructions to remain similarly steadfast.
2. Methods
2.1. Overview
Data were obtained from the Press Ganey national
databases and represent 33% of all U.S. hospitals and 44% of
all U.S. hospitals over 100 beds. Press Ganey, a research firm
specializing in satisfaction measurement within the health-
care industry, collects and houses data for hospitals across
the U.S. for the purposes of quality improvement and
benchmarking. Hospitals partner with Press Ganey to
measure patients’ perceptions of their health care experi-
ence. All facilities either survey all discharged patients or a
random sample of patients. The methods detailed here have
been applied to assess service quality and patient satisfaction
on national and local levels across a variety of settings
[41,43–46].
The standard survey includes 49 questions in 10 separate
sections covering the complete hospitalization experience
from admissions to discharge. The instrument employs a 5-
point Likert-type response scale—(1) very poor, (2) poor, (3)
fair, (4) good, (5) very good. Cover letters accompany the
survey. The exact wording of the letter varies by hospital but
all are subject to two explicit standards to ensure data
quality: (a) no persuading comments, e.g. ‘‘Thank you for
helping us. . . as we strive for 5’s’’ and (b) no inclusion of the
phrase ‘‘very good’’ or reference to ‘‘5’’ or ‘‘five’’ anywhere
on letter.
2.2. Development of the survey instrument
The Press Ganey Inpatient Survey was originally
constructed in 1987 and revised in 1997. The revision
strengthened its effectiveness as a measure of patients’
perspectives, experience and evaluations and improved the
utility of the data for hospitals’ quality improvement efforts.
Focus groups and structured interviews with inpatient
facilities across the country were conducted for each
initiative. Patients, direct care providers, and administrators
using the data for quality improvement purposes were
consulted. These panels reviewed prototype questionnaires
and provided feedback throughout the development, testing
and revision of the instrument. Comprehensive literature
reviews of existing patient surveys informed these efforts.
The conceptual model underlying the survey is well-
grounded in reality. It follows the typical experiences a
patient usually encounters during a hospital stay. Events that
occur, (admission, meals, tests or treatments, discharge);
personnel encountered (nurses, physicians and technical
staff); the physical surroundings (room and hospital) and the
psychosocial aspects of the stay were found to be principal
contributors to the patient’s experience of care.
2.3. Psychometrics
The instrument was developed using standard psycho-
metric and scaling criteria. To insure that there was sufficient
variation in responses, response patterns were evaluated for
each question. Several tests of validity and reliability run on
the present sample confirmed the findings reported in
Kaldenberg et al. [41]. A principal components factor
analysis with correlated factors was conducted to identify
the underlying dimensions among the set of questions which
resulted in a dimensional structure that naturally organizes
questions into meaningful subscales (Table 2). Internal
consistency of the scale as a whole and each subscale

P.A. Clark et al. / Patient Education and Counseling 59 (2005) 56–68 59
Table 2
Principal components factor analysis [41]
Dimensions
Nursing Physician Room Tests Admission Discharge Meals Visitors Personal
Admit speed 0.88
Admit courtesy 0.77
Pre-adm process 0.86
Room decor 0.76
Room cleanliness 0.79
Clean courtesy 0.65
Room temperature 0.69
Noise level 0.70
Working TV, etc. 0.56
Diet information 0.68
Food temperature 0.87
Food quality 0.89
Server courtesy 0.52
Nurse friendly 0.83
Nurse prompt 0.78
Nurse attitude 0.87
Nurse attn needs 0.83
Nurse inform 0.75
Nurse skill 0.78
Wait time
Comfort concern �0.49
Explained T&T �0.47
Skill of pers. �0.79
Courtesy of pers. �0.76
Skill I.V. pers. �0.79
Courtesy I.V. pers. �0.76
Help info desk �0.83
Comfort visitors �0.85
Staff attitude �0.83
Family/treatment �0.70
Physician time 0.87
Physician concern 0.94
Physician info 0.93
Physician courtesy 0.91
Physician skill 0.80
Ready discharge �0.71
Discharge speed �0.73
Discharge instruction �0.70
Arrange home serv �0.76
Privacy �0.43
Sensitivity to inconvenience �0.50
Pain management �0.45
Emotional needs �0.57
Response to concerns �0.51
Involved treatment dec �0.53
Principal component analysis: oblique rotation method with Kaiser normalization. Overall items excluded from analysis; factor loadings less than 0.40 are
suppressed.
identified in the factor analysis was evaluated with reliability
testing. Cronbach’s alpha for the whole scale was a = 0.98
and ranged from a = 0.84 to 0.95 for the individual subscales
(Table 3). Finally, an analysis of correlations was conducted
to evaluate convergent (within scale) validity and discrimi-
nant (between scales) validity. Items in each subscale
correlated with the other items in that subscale, (exceeding
the recommended ‘‘item to total’’ correlation of 0.30),
confirming that the items within each scale were measuring
the same dimension. To illustrate, for the discharge section,
the average corrected item-scale correlation (which removes
the question being analyzed to avoid artificial inflation
through perfect self-correlation) was 0.73 with a range from
0.69 to 0.80. Equally important, items in each subscale also
correlated more highly with their own subscale than with
any other subscale, confirming that each subscale was
measuring a separate dimension. To illustrate, for the
discharge section, the average item-nonscale correlation was
0.45 with a range from 0.31 to 0.63. The results of these
psychometric analyses establish the instrument as a reliable
and valid measure of patient satisfaction in the inpatient
setting.

P.A. Clark et al. / Patient Education and Counseling 59 (2005) 56–6860
Table 3
Item analyses and reliability estimates [41]
Scale Alpha Average corrected item-
scale correlations
Range of corrected
item-scale correlations
Average item-
nonscale correlations
Range of item-
nonscale correlations
Admission 0.88 0.77 0.71–0.81 0.43 0.34–0.53
Room 0.84 0.62 0.56–0.73 0.40 0.28–0.54
Meals 0.84 0.68 0.62–0.75 0.40 0.26–0.53
Nurses 0.95 0.85 0.80–0.89 0.51 0.35–0.73
Tests and treatments 0.91 0.72 0.59–0.79 0.46 0.31–0.62
Visitors and family 0.90 0.78 0.74–0.83 0.51 0.37–0.67
Physician 0.95 0.86 0.80–0.91 0.43 0.29–0.53
Discharge 0.87 0.73 0.69–0.80 0.45 0.31–0.63
Personal issues 0.94 0.81 0.72–0.85 0.56 0.76–0.38
Overall assessment 0.94 0.87 0.82–0.90 0.59 0.45–0.77
2.4. Data collection and sample characteristics
Questionnaires were mailed immediately following a
patient’s discharge from acute-care facilities. Patients
received the surveys well within the 6-week time frame
recommended by Bredart et al. [47] and typically within 15
days from discharge. Data from questionnaires returned to
the research firm between January 1, 1997, and December
31, 2001 (n = 4,901,178) were analyzed. The sample was
drawn from 1290 acute care facilities across all 50 states and
the District of Columbia. Each facility sampled patients
using standard random sampling procedures or conducted a
census. Repeat patients within one quarter, deaths and
newborns were excluded from the samples. The standard
survey does not collect data on race, ethnicity or culture. All
available demographics are presented in Table 4. A second
sample with analogous demographics was drawn for
analysis by condition (n = 175,927). To be included in this
sample, the data had to include codes for Diagnosis Related
Group (DRG), each DRG had to meet a minimum of 30
cases, and the survey had to be collected between January 1,
1997 and December 31, 2001.
2.5. Response rate and nonresponse bias
The response rate for the sample is estimated at 25–30%,
a range considered good practice for this kind of survey
research [48]. Nonresponse bias occurs when the responses
from nonrespondent and respondent groups differ—non-
response in and of itself does not indicate biased data [49]. A
study of the characteristics of inpatient respondents and
Table 4
Sample demographics
Age distribution
Children (0–12) Adolescents (13–17) Young adults (18–24) Adults (25–3
3.07% 1.20% 5.14% 19.71%
Self-described health status distribution
Very poor Poor Fair Good
2.2% 6.8% 22.1% 43.3%
Male: 38.2%, female: 61.8%, first stay at this hospital: 45.9%, admission was u
nonrespondents found that although certain characteristics
were associated with lower response rates (men, nonmar-
ried, very young and very old, no insurance or Medicaid,
African American and Hispanic) these groups mirrored
other research on response tendencies to mail surveys and
did not differ in their ratings of care [50,51].
2.6. Data interpretation and measurement
The overall patient satisfaction score implicitly indexes
global satisfaction and is calculated by averaging the ratings
for all individual survey items by each section to determine a
section mean score. Then, all section mean scores are
averaged to determine the overall patient satisfaction score.
To improve data interpretation and analysis of score
variation, the 1–5 scale is converted using a linear
transformation to a 0–100 score where (1) very poor = 0,
(2) poor = 25, (3) fair = 50, (4) good = 75 and (5) very
good = 100. This degree of measurement is sensitive enough
to detect small changes in patient satisfaction [41]. This is
important because small changes can result in large
movements in national and state rankings.
2.7. Outcome measures
The previously mentioned psychometric research shows
that patients perceive the discharge process as a distinct
episode of care. This episode is measured with four
questions, ‘‘Extent to which you felt ready to be
discharged,’’ ‘‘Speed of discharge process after you were
told you could go home,’’ ‘‘Help with arranging home care
9) Middle aged (40–64) Elderly (65–74) Advanced elderly (>75)
29.65% 19.40% 21.83%
Very good
25.7%
nexpected: 52.7%, admitted through ER: 46.5%, mean age: 54.62.

P.A. Clark et al. / Patient Education and Counseling 59 (2005) 56–68 61
services (if needed),’’ and ‘‘Instructions given about how to
care for yourself at home.’’ The latter measure assesses
patients’ perceptions of the instructions provided about
caring for themselves after discharge. These instructions
may focus on dietary and treatment regimens, medications
and their side effects, danger signs to watch out for, when to
resume normal activities, and when to return to work. Does
the patient feel adequately prepared, educated and confident
in caring for themselves? Or does the patient have unmet
needs, unanswered questions and an absence of the requisite
knowledge to care for themselves?
3. Results
3.1. Patients’ assessments of quality of discharge
instructions for care at home
Table 5 presents annual patient satisfaction mean scores
from 1997 though 2001 for the questions ‘‘Instructions given
about how to care for yourself at home’’ and ‘‘Overall rating
of care given.’’ A strong, consistent positive correlation
existed between ‘‘Instructions given about how to care for
yourself at home’’ and the overall calculated mean score for
patient satisfaction each year from 1997 through 2001. This
correlation indicates that patients who view the discharge
information more favorably are also likely to report higher
overall patient satisfaction in general.
Patients’ ratings during the final year of the sample
(2001) were aggregated to produce one score for each of the
acute care facilities reporting that year (n = 1136). The
aggregated mean for all facilities ‘‘Instructions given about
how to care for yourself at home’’ was 84.4 with standard
deviation of 3.4. Aggregate mean scores for each facility in
2001 ranged from 60.00 to 96.43 (Fig. 1). This considerable
variation indicates the existence of substantial quality
improvement opportunities and demonstrates that patients’
evaluations are not universally positive.
Nationally, patients were less satisfied with discharge
instructions for care at home than with the overall quality of
care each year and across the 5-year period ratings of
discharge instruction declined more than ratings of overall
Table 5
National patient satisfaction data, 1997–2001
1997 1998
Mean
scores
S.D. Mean
scores
‘‘Instructions given about how
to care for yourself at home’’
85.7 20.5 85.4
‘‘Overall rating of care given’’ 87.4 18.9 88.2
N 180,542 1,03
‘‘Instructions given about how to care for
yourself at home’’—correlation with overall
patient satisfaction score (Pearson’s r)
0.71 0
P < 0.001 (two-tailed test of significance).
quality with a total five-year score decrease of 1.34
[t(1,748,596) = 25.5; p < 0.001] compared to a decline of
0.33 [t(1,748,596) = 6.37; p < 0.001] in ‘‘Overall rating of
care given’’ along the same time period (Fig. 2). Previous
research leads one to expect little change in patients’
evaluations within such a large dataset and national scale
[42]. Using the method set forth by Cohen [52,53], we
calculated the expected effect size based upon this previous
study (g = 0.005). Contrary to expectations, the observed
effect size was more than ten times greater than expected
(g = 0.06). The observed effect size is small using standard
psychological conventions, however Cohen [53] and Howell
[54] admit these conventions to be arbitrary and recommend
the adjustment of gamma based upon the expected effect
size. Finally, a recalculation of effect size considering the
statistical power of our observations determined ES = 1.00
(a = 0.0001) indicating a robust level of sensitivity [55]. We
consider the observed decrease to be of moderate
significance in both the statistical and practical senses.
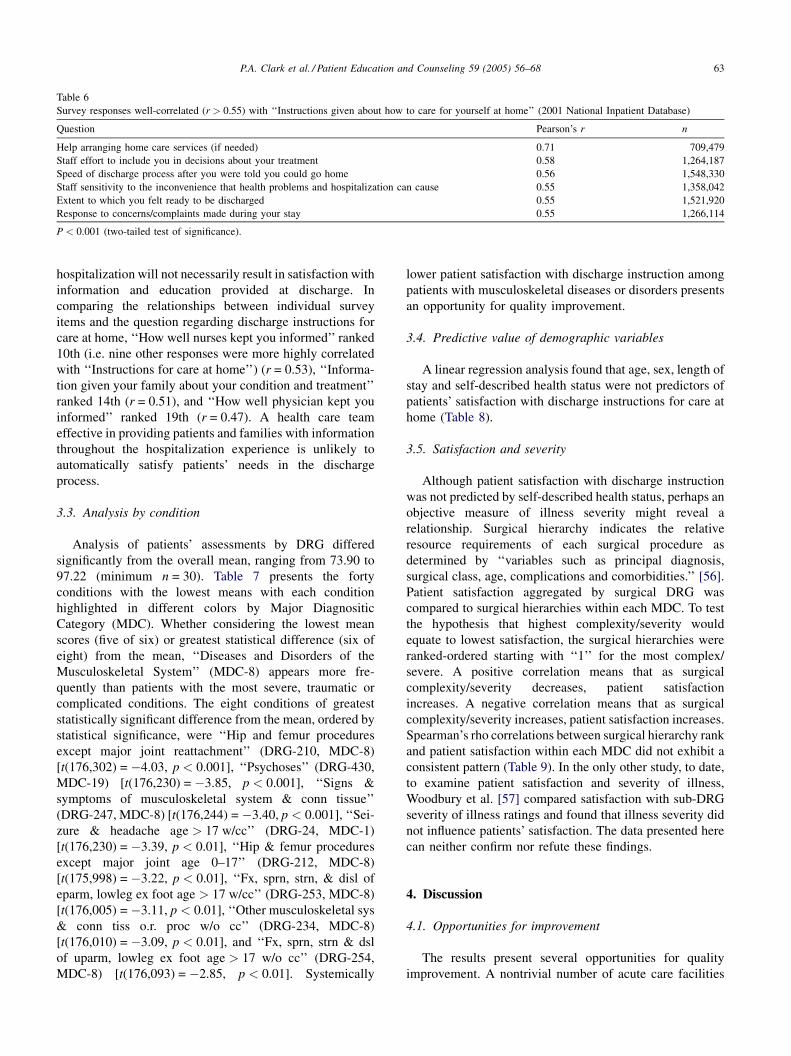
3.2. Patient perceptions
Beyond showing strong internal consistency, the Cron-
bach’s alpha (a = 0.87) for the discharge section also
demonstrates the patient’s view of the discharge process as a
distinctive episode which would lead one to predict that the
most highly correlated items will be the measures of the
discharge process within the discharge section. Table 6
displays the responses most correlated with discharge
instructions for care at home: ‘‘Help arranging home care
services (if needed)’’ ‘‘Staff effort to include you in
decisions about your treatment,’’ ‘‘Speed of discharge
process after you were told you could go home,’’ ‘‘Staff
sensitivity to the inconvenience that health problems and
hospitalization can cause,’’ ‘‘Extent to which you felt ready
to be discharged,’’ and ‘‘Response to concerns/complaints
made during your stay.’’ Higher scores on these questions
were associated with higher scores for the home self-care
discharge instructions item.
Inclusion in decision making, staff sensitivity and
response to concerns and complaints were three measures
which correlated highly with discharge instructions and
1999 2000 2001
S.D. Mean
scores
S.D. Mean
scores
S.D. Mean
scores
S.D.
20.5 85.0 20.7 84.7 20.8 84.4 21.0
18.3 87.7 18.9 87.2 19.1 87.1 19.4
5,637 1,210,044 906,902 1,568,053
.70 0.69 0.69 0.69

P.A. Clark et al. / Patient Education and Counseling 59 (2005) 56–6862
Fig. 1. National patient satisfaction mean scores, 1997–2001.
likely indicate components of discharge instructions
considered important to patients (Table 6).
One might hypothesize that education provided earlier in
the hospital stay would influence patients’ satisfaction with
discharge instructions about self-care. Yet, relatively mild
correlations (i.e. correlations less than 0.55 not displayed in
Fig. 2. Overall patient s
Table 6) were found between patients’ satisfaction with
discharge instructions for care at home and measures of
information provision. This demonstrates that the perceived
demarcation between the preparation for discharge and
care at home versus general patient education, suggesting
that meeting patients’ information needs throughout
atisfaction, 2001.
P.A. Clark et al. / Patient Education and Counseling 59 (2005) 56–68 63
Table 6
Survey responses well-correlated (r > 0.55) with ‘‘Instructions given about how to care for yourself at home’’ (2001 National Inpatient Database)
Question Pearson’s r n
Help arranging home care services (if needed) 0.71 709,479
Staff effort to include you in decisions about your treatment 0.58 1,264,187
Speed of discharge process after you were told you could go home 0.56 1,548,330
Staff sensitivity to the inconvenience that health problems and hospitalization can cause 0.55 1,358,042
Extent to which you felt ready to be discharged 0.55 1,521,920
Response to concerns/complaints made during your stay 0.55 1,266,114
P < 0.001 (two-tailed test of significance).
hospitalization will not necessarily result in satisfaction with
information and education provided at discharge. In
comparing the relationships between individual survey
items and the question regarding discharge instructions for
care at home, ‘‘How well nurses kept you informed’’ ranked
10th (i.e. nine other responses were more highly correlated
with ‘‘Instructions for care at home’’) (r = 0.53), ‘‘Informa-
tion given your family about your condition and treatment’’
ranked 14th (r = 0.51), and ‘‘How well physician kept you
informed’’ ranked 19th (r = 0.47). A health care team
effective in providing patients and families with information
throughout the hospitalization experience is unlikely to
automatically satisfy patients’ needs in the discharge
process.
3.3. Analysis by condition
Analysis of patients’ assessments by DRG differed
significantly from the overall mean, ranging from 73.90 to
97.22 (minimum n = 30). Table 7 presents the forty
conditions with the lowest means with each condition
highlighted in different colors by Major Diagnositic
Category (MDC). Whether considering the lowest mean
scores (five of six) or greatest statistical difference (six of
eight) from the mean, ‘‘Diseases and Disorders of the
Musculoskeletal System’’ (MDC-8) appears more fre-
quently than patients with the most severe, traumatic or
complicated conditions. The eight conditions of greatest
statistically significant difference from the mean, ordered by
statistical significance, were ‘‘Hip and femur procedures
except major joint reattachment’’ (DRG-210, MDC-8)
[t(176,302) = �4.03, p < 0.001], ‘‘Psychoses’’ (DRG-430,
MDC-19) [t(176,230) = �3.85, p < 0.001], ‘‘Signs &
symptoms of musculoskeletal system & conn tissue’’
(DRG-247, MDC-8) [t(176,244) = �3.40, p < 0.001], ‘‘Sei-
zure & headache age > 17 w/cc’’ (DRG-24, MDC-1)
[t(176,230) = �3.39, p < 0.01], ‘‘Hip & femur procedures
except major joint age 0–17’’ (DRG-212, MDC-8)
[t(175,998) = �3.22, p < 0.01], ‘‘Fx, sprn, strn, & disl of
eparm, lowleg ex foot age > 17 w/cc’’ (DRG-253, MDC-8)
[t(176,005) = �3.11, p < 0.01], ‘‘Other musculoskeletal sys
& conn tiss o.r. proc w/o cc’’ (DRG-234, MDC-8)
[t(176,010) = �3.09, p < 0.01], and ‘‘Fx, sprn, strn & dsl
of uparm, lowleg ex foot age > 17 w/o cc’’ (DRG-254,
MDC-8) [t(176,093) = �2.85, p < 0.01]. Systemically
lower patient satisfaction with discharge instruction among
patients with musculoskeletal diseases or disorders presents
an opportunity for quality improvement.
3.4. Predictive value of demographic variables
A linear regression analysis found that age, sex, length of
stay and self-described health status were not predictors of
patients’ satisfaction with discharge instructions for care at
home (Table 8).
3.5. Satisfaction and severity
Although patient satisfaction with discharge instruction
was not predicted by self-described health status, perhaps an
objective measure of illness severity might reveal a
relationship. Surgical hierarchy indicates the relative
resource requirements of each surgical procedure as
determined by ‘‘variables such as principal diagnosis,
surgical class, age, complications and comorbidities.’’ [56].
Patient satisfaction aggregated by surgical DRG was
compared to surgical hierarchies within each MDC. To test
the hypothesis that highest complexity/severity would
equate to lowest satisfaction, the surgical hierarchies were
ranked-ordered starting with ‘‘1’’ for the most complex/
severe. A positive correlation means that as surgical
complexity/severity decreases, patient satisfaction
increases. A negative correlation means that as surgical
complexity/severity increases, patient satisfaction increases.
Spearman’s rho correlations between surgical hierarchy rank
and patient satisfaction within each MDC did not exhibit a
consistent pattern (Table 9). In the only other study, to date,
to examine patient satisfaction and severity of illness,
Woodbury et al. [57] compared satisfaction with sub-DRG
severity of illness ratings and found that illness severity did
not influence patients’ satisfaction. The data presented here
can neither confirm nor refute these findings.
4. Discussion
4.1. Opportunities for improvement
The results present several opportunities for quality
improvement. A nontrivial number of acute care facilities

P.A. Clark et al. / Patient Education and Counseling 59 (2005) 56–6864
Table 7
Analysis of patient satisfaction with discharge instruction by condition
perform significantly below the mean for patient assess-
ments of discharge instruction quality. Demographic
variables did not predict patients’ ratings of instructions
for care at home and perceptions are not likely affected by
illness severity. Nevertheless, systemic variation by condi-
tion was observed. Patients with diseases or disorders of the
musculoskeletal system evaluated the quality of discharge
instruction lower than patients with other conditions.
Most importantly, patients find discharge instruction to be
of lower quality relative to overall perceptions of health care
service quality. Their satisfaction with discharge instruc-
tions is strongly correlated to overall satisfaction with their
hospital care—therefore, dissatisfaction with the discharge
episode is likely to negatively influence patients’ overall
perception of quality in the hospital. The moderate
downward trend in patients’ ratings of the quality of

P.A. Clark et al. / Patient Education and Counseling 59 (2005) 56–68 65
Table 8
‘‘Instructions given about how to care for yourself at home,’’ relationships to
demographic variables (2001 National Inpatient Database)
Linear regression analysis
Variable R R2
Days in hospital 0.001 0.000
Sex 0.003 0.000
Age 0.021 0.000
Self-described health status 0.119 0.014
P < 0.001 (two-tailed test of significance). ‘‘Compared to others your age,
would you typically describe your health as: (rate 1–5)’’.
instructions for home care from 1997–2001 gives little sign
of progress in meeting patients’ needs at this juncture of
their hospital experience.
Collectively, these findings suggest that delivered care
does not reflect existing standards for patient education and
discharge. Although the vast majority of hospitals are
accredited and presumed to fulfill AMA and JCAHO
standards (Table 1), a serious disconnect exists between the
assessments of health care professionals and patients.
4.2. Patients’ perceptions
Patients perceive the hospitalization experience through
distinct episodes. One of the distinct episodes, for patients, is
the process of being discharged from the hospital.
Information on self-care may be given throughout the
hospital stay by nurses, case managers, patient education
professionals, physicians, etc.; all who perceive this as
‘‘discharge instruction.’’ This information-giving would be
reflected in satisfaction with information provision, but
satisfaction with discharge instruction will be founded on
perceptions within a discharge episode occurring from the
moment when the physician tells the patient that he or she
can go home, through leaving the hospital, to the patient’s
actual application of the discharge instruction in coping with
the condition and symptoms. Therefore, accurate measure of
the patient’s perspective necessitates surveying patients
after this discharge episode, when the patient has been home
Table 9
Correlations between patient satisfaction and surgical severity within MDCs
MDC Correlation between surgical
severity rank and patient satisfaction
N (DRGs)
1 0.82 8
2 0.16 7
3 �0.22 17
4 0.91 3
5 �0.37 20
6 �0.32 24
7 �0.58 13
8 0.03 33
9 0.10 14
10 0.41 9
11 �0.21 14
12 0.25 12
13 0.22 13
for several days—not in the lobby while the patient leaves
the hospital.
4.3. Influences of patients’ perceptions
Those responding to ‘‘Help arranging home care services
(if needed)’’ likely received some case management, social
work and/or comprehensive discharge planning to set up
home care services. Most patients do not receive assistance
arranging home care service, hence the lower number of
responses (n = 709,409) to this question compared to other
discharge questions (n > 1,500,000). The strong correlation
(r = 0.71) between satisfaction with discharge instructions
and ‘‘Help arranging home services’’ could be considered a
function of the increased attention, education, counseling
and specific needs assessments patients’ commonly receive
within these processes. This confirms evidence presented in
a recent Cochrane’s review that comprehensive discharge
planning improved patient satisfaction [58]. From the
caregiver’s perspective, this confirms a study by Bull et
al. [59] that found continuity of care and the extent to which
the caregiver felt prepared to manage care to be the strongest
predictors of satisfaction with the discharge process. The
more education, planning, coordination of care and
counseling a patient receives, the more satisfied they are
with the quality of discharge instructions would be a
reasonable interpretation of these results.
The second-highest correlated response to the question
on discharge instructions for care at home (r = 0.58), ‘‘Staff
effort to include you in decisions about your treatment,’’
confirms the findings of Proctor et al. [60], which found that
patient satisfaction with discharge was related to patients’
degree of involvement in decision making and those of
Coulton et al. [61] which found that patients and their
families desired involvement in discharge planning and
long-term care decision making.
The results of this study support the results of several
trials testing models of patient–family participation in
discharge preparation which show increased involvement to
result in: (a) better self-reported health and shorter length-
of-stay in future readmittances [62], (b) improved patient
satisfaction, shortened length of stay and fewer readmissions
[63], and (c) improved caregiver satisfaction [64].
4.4. Limitations
Although derived from the largest dataset of patient
perceptions of care in the United States, the sample presents
some limitations. First, hospitals that participate in
benchmarking with a research firm may be different than
those hospitals which do not. Second, hospitals may opt out
of an analysis of patient satisfaction by DRG; these hospitals
may also differ from hospitals which do not. If either of these
limitations systematically skew the scores any direction, it is
likely to be positive as hospitals interested in benchmarking
to improve patient service may tend to provide better service

P.A. Clark et al. / Patient Education and Counseling 59 (2005) 56–6866
than those who do not benchmark. Third, the cohort is not
stable across time and therefore represents a potential
confound. Finally, we did not have any information
regarding language or literacy backgrounds of the patients.
Non-English speaking patients or patients with limited
English proficiency may tend to rate instructions delivered in
English-only lower, as the instructions will hold little
perceived value. The well-documented shortfall in accom-
modating these needs may contribute to dissatisfaction; but
the study lacks the information needed to explore this.
1 Although this intervention holds promise, it requires substantial time
and labor costs and callers could potentially violate HIPPAA regulations if
they identify themselves as being from the hospital to someone other than
the patient.
5. Practice implications
5.1. Measuring for quality improvement
Several quality measures can be used to benchmark
against and make improvements (using various techniques
such as Plan–Do–Study–Act). Evidence supports the use of
patient satisfaction as an important quality measure
[35,36,38]. Patient-derived data should be further analyzed
by unit to search out pockets of underperformance as well as
exemplary performance [1]. The systematic variations
across diagnostic categories demonstrate the importance
of analyzing patient satisfaction by DRG, which may
highlight unknown disparities in the delivery of education,
information and other services. Evidence also supports using
readmission rates or emergency department visits as a
measure of the efficacy of discharge instruction. Patients
inadequately educated in the discharge process will be more
likely to access additional health services through read-
mission, emergency department and/or primary care [65–
68].
5.2. Practices for quality improvement
To match the patient’s perceptions, practitioners can
structure education and information delivery throughout the
discharge episode, from the day of discharge throughout
recovery at home.
Information given at discharge helps patients feel more
confident in the management of their health [67]. A standard
communication on the morning of discharge will ensure
fulfillment of any lingering information needs: ‘‘Is there
anything you need or want to know?’’ [69]. Education and
information can then be provided and tailored to the
patients’ and families’ expressed needs. However, patients’
feelings of confidence may not last—patients may feel well
informed at the point of discharge but this perception
deteriorates over time. Henderson and Zernike [67] found
that within 1–2 weeks later patients felt substantially less
well informed.
Once home, written instructions serve as a continuous
information resource (such as, what to do at home, when to
resume life activities, symptoms to look out for, and the
contact information of someone on the health care team).
Patients desire clear, easily understandable instructions
[70,71]. Postdischarge telephone follow-up holds substantial
promise to address these ongoing information needs. Several
studies have shown significant increases in patient satisfac-
tion and improved clinical outcomes when members of the
health care team phone patients 1–2 weeks following
discharge [72–76].1
5.3. Financial implications
Finally, since organizational support for patient education
programs results, in large part, from provider’s perception of
the program’s payoffs, the benefits of patient satisfaction in
this context deserve review [77]. Patient perceptions of the
quality of the discharge process substantially impact a
hospital’s financial outcomes: ‘‘One of the four dimensions
of hospital quality, discharge, is significantly related to
earnings per bed (p < 0.003). For earnings per bed, the
dollar amount associated with a one point gain or loss in
satisfaction (i.e. moving from an average rating of
‘‘good’’ = 3 points to ‘‘very good’’ = 4 points) for this
dimension of quality is $4980’’ [78]. Recognition of this and
the powerful bond between overall patient satisfaction and
patient loyalty, likelihood to recommend and measures
financial performance [79–84] should provide ample
justification for resource dedication to improve the quality
of discharge preparation to better meet patients’ changing
needs.
5.4. Future research
Not included in the present study but worthy of future
investigations are the issues of the patient’s dominant
language. Future research can examine likely interaction
effects of the patient’s language preference, the language the
discharge instructions are provided in (verbal and written),
and the language the patient satisfaction survey is printed in.
It is likely that patient perceptions will be more positive if
discharge instructions (and surveys) are provided in the
patients’ preferred language, especially if the information to
be conveyed is complex.
References
[1] Press I. Patient satisfaction: defining, measuring, and improving the
experience of care. Chicago: Health Administration Press; 2002.
[2] Forster AJ, Murff HJ, Peterson JF, Gandhi TK, Bates DW. The
incidence and severity of adverse events affecting patients after
discharge from the hospital. Ann Intern Med 2003;138:161–7.

P.A. Clark et al. / Patient Education and Counseling 59 (2005) 56–68 67
[3] Bubela N, Galloway S, McCay E, McKibbon A, Nagle L, Pringle D,
Ross E, Shamian J. Factors influencing patients’ informational needs
at time of hospital discharge. Patient Educ Couns 1990;16:21–8.
[4] Bostrom J, Crawford-Swent C, Lazar N, Helmer D. Learning needs of
hospitalized and recently discharged patients. Patient Educ Couns
1994;23:83–9.
[5] Armitage SK, Kavanagh KM. Consumer-orientated outcomes in dis-
charge planning: a pilot study. J Clin Nurs 1998;7:67–74.
[6] Lithner M, Zilling T. Pre- and post-operative information needs.
Patient Educ Couns 2000;40:29–37.
[7] Burney M, Purden M, McVey L. Patient satisfaction and nurses’
perceptions of quality in an inpatient cardiology population. J Nurs
Care Qual 2002;16:56–67.
[8] Gustafson DH, Arora NK, Nelson EC, Boberg EW. Increasing under-
standing of patient needs during and after hospitalization. Jt Comm J
Qual Improv 2001;27:81–92.
[9] Jones KR, Burney RE, Christy B. Patient expectations for surgery: are
they being met? Jt Comm J Qual Improv 2000;26:349–60.
[10] Reiley P, Pike A, Phipps M, Weiner M, Miller N, Stengrevics SS, Clark
L, Wandel J. Learning from patients: a discharge planning improve-
ment project. Jt Comm J Qual Improv 1996;22:311–22.
[11] Burney M, Purden M, McVey L. Patient satisfaction and nurses’
perceptions of quality in an inpatient cardiology population. J Nurs
Care Qual 2002;16:56–67.
[12] Mistiaen P, Duijnhouwer E, Wijkel D, de Bont M, Veeger A. The
problems of elderly people at home one week after discharge from an
acute care setting. J Adv Nurs 1997;25:1233–40.
[13] Rowe WS, Yaffe MJ, Pepler C, Dulka IM. Variables impacting on
patients’ perceptions of discharge from short-stay hospitalisation or
same-day surgery. Health Soc Care Community 2000;8:362–71.
[14] Jones EW, Densen PM, Brown SD. Posthospital needs of elderly
people at home: findings from an eight-month follow-up study. Health
Serv Res 1989;24:643–64.
[15] Rosswurm MA, Lanham DM. Discharge planning for elderly patients.
J Gerontol Nurs 1998;24:14–21.
[16] Bowles KH, Naylor MD, Foust JB. Patient characteristics at hospital
discharge and a comparison of home care referral decisions. J Am
Geriatr Soc 2002;50:336–42.
[17] Morrison I. Health care in the new millennium: vision, values, and
leadership. San Francisco: Jossey-Bass; 2000.
[18] Wolock I, Schlesinger E, Dinerman M, Seaton R. The posthospital
needs and care of patients: implications for discharge planning. Soc
Work Health Care 1987;12:61–76.
[19] DesRoches C, Blendon R, Young J, Scoles K, Kim M. Caregiving in
the post-hospitalization period: findings from a national survey. Nurs
Econ 2002;20:216–21. 224.
[20] Leske JS, Pelczynski SA. Caregiver satisfaction with preparation for
discharge in a decreased-length-of-stay cardiac surgery program. J
Cardiovasc Nurs 1999;14:35–43.
[21] Jackson MF. Discharge planning: issues and challenges for geronto-
logical nursing. A critique of the literature. J Adv Nurs 1994;19:492–
502.
[22] vom Eigen KA, Walker JD, Edgman-Levitan S, Cleary PD, Delbanco
TL. Carepartner experiences with hospital care. Med Care
1999;37:33–8.
[23] Oktay JS, Steinwachs DM, Mamon J, Bone LR, Fahey M. Evaluating
social work discharge planning services for elderly people: access,
complexity, and outcome. Health Soc Work 1992;17:290–8.
[24] Mamon J, Steinwachs DM, Fahey M, Bone LR, Oktay J, Klein L.
Impact of hospital discharge planning on meeting patient needs after
returning home. Health Serv Res 1992;27:155–75.
[25] Proctor EK, Morrow-Howell N, Kaplan SJ. Implementation of dis-
charge plans for chronically ill elders discharged home. Health Soc
Work 1996;21:30–40.
[26] Simon EP, Showers N, Blumenfield S, Holden G, Wu X. Delivery of
home care services after discharge: what really happens. Health Soc
Work 1995;20:5–14.
[27] Rose JH, Bowman KF, Kresevic D. Nurse versus family caregiver
perspectives on hospitalized older patients: an exploratory study of
agreement at admission and discharge. Health Commun 2000;12:63–
80.
[28] Bowman KF, Rose JH, Kresevic D. Family caregiving of hospitalized
patients. Caregiver and nurse perceptions at admission and discharge. J
Gerontol Nurs 1998;24:8–16.
[29] Clemens EL. Multiple perceptions of discharge planning in one urban
hospital. Health Soc Work 1995;20:254–61.
[30] Report 4 of the Council on Scientific Affairs (A-96): Evidence-based
Principles of Discharge and Discharge Criteria. Chicago, IL: Amer-
ican Medical Association; 1996. Revised: July 12, 2002; available
from: http://www.ama-assn.org/ama/pub/article/2036-2532.html;
accessed: October 6, 2003.
[31] 1999 Hospital Accreditation Standards. Oakbrook Terrace, IL: Joint
Commission on Accreditation of Healthcare Organizations; 1999. p.
113–5.
[32] AHRQ. Hospital-CAHPS: web chat transcript. January 2003;
available from: http://www.ahrq.gov/qual/cahps/hcahpstrans.htm;
accessed: February 16, 2003.
[33] Clancy CM, Scully T. Perspective: a call to excellence. Health Affairs
2003;22:113–5.
[34] Tieman J. Medicare to require reports detailing patient satisfaction.
Modern Healthcare 2003;33:8–9.
[35] Cleary PD, McNeil BJ. Patient satisfaction as an indicator of quality
care. Inquiry 1988;25:25–36.
[36] Donabedian A. The quality of care. How can it be assessed? JAMA
1988;260:1743–8.
[37] Donabedian A. Methods for deriving criteria for assessing the quality
of medical care. Med Care Rev 1980;37:653–98.
[38] Kenagy JW, Berwick DM, Shore MF. Service quality in health care.
JAMA 1999;281:661–5.
[39] Press I. Patient satisfaction. Hosp Health Netw 1994;68:60.
[40] McAlexander JH, Kaldenberg DO, Koenig HF. Service quality mea-
surement. J Health Care Mark 1994;14:34–40.
[41] Kaldenberg DO, Mylod DM, Drain M. Patient-derived information:
satisfaction with care in acute and post-acute care environments. In:
Goldfield N, Pine M, Pine J, editors. Measuring and managing health
care quality. New York, NY: Aspen Publishers; 2002.
[42] Health Care Advisory Board. Hardwiring for service excellence:
hospital strategies for breakthrough improvements in patient satisfac-
tion. Washington, DC: The Advisory Board Company; 1999.
[43] Clark PA, Drain M, Malone MP. Addressing emotional and spiritual
needs. Jt Comm J Qual Safety 2003;12:659–70.
[44] Clark PA. Medical practices’ sensitivity to patients’ needs. Opportu-
nities and practices for improvement. J Ambul Care Manage
2003;26:110–23.
[45] Drain M. Quality improvement in primary care and the importance of
patient perceptions. J Ambul Care Manage 2001;24:30–46.
[46] Gesell SB. A measure of satisfaction for the assisted-living industry. J
Healthcare Qual 2001;23:16–25.
[47] Bredart A, Razavi D, Robertson C, Brignone S, Fonzo D, Petit JY, de
Haes JC. Timing of patient satisfaction assessment: effect on ques-
tionnaire acceptability, completeness of data, reliability and variability
of scores. Patient Educ Couns 2002;46:131–6.
[48] Kelley K, Clark B, Brown V, Sitzia J. Good practice in the conduct and
reporting of survey research. Int J Qual Health Care 2003;15:261–6.
[49] Rogelberg SG, Luong A. Nonresponse to mailed surveys: a review and
guide. Curr Directions Psychol Sci 1998;7:61–5.
[50] Kaldenberg D.O. Results from the Press, Ganey response study (Part
1). The Satisfaction Monitor, March/April 1998. p. 4, 5, 12.
[51] Kaldenberg D.O. Results from the Press, Ganey response study (Part
2). The Satisfaction Monitor, May/June 1998. p. 5–7, 10.
[52] Welkowitz J, Ewen RB, Cohen J. Introductory statistics for the
behavioral sciences. New York: Academic Press; 1971.
[53] Cohen J. Statistical power analysis for behavioral sciences. New York:
Academic Press; 1977.

P.A. Clark et al. / Patient Education and Counseling 59 (2005) 56–6868
[54] Howell DC. Statistical methods for psychology. Boston: PWS-Kent
Publishing Company; 1987.
[55] Lipsey MW. Design sensitivity: statistical power for experimental
research. Newbury Park, CA: Sage Publications; 1990.
[56] DRG guidebook: a comprehensive reference to the DRG classification
system. Reston, VA: St. Anthony’s Publishing; 2000. p. 543–8.
[57] Woodbury D, Tracy D, McKnight E. Does considering severity of
illness improve interpretation of patient satisfaction data? J Healthcare
Qual 1998;20:33–40.
[58] Parkes J, Shepperd S. Discharge planning from hospital to home,
Cochrane. Database Syst. Rev. 2000;CD000313.
[59] Bull MJ, Hansen HE, Gross CR. Predictors of elder and family
caregiver satisfaction with discharge planning. J Cardiovasc Nurs
2000;3:76–87.
[60] Proctor E, Morrow-Howell N, Albaz R, Weir C. Patient and family
satisfaction with discharge plans. Med Care 1992;30:262–75.
[61] Coulton CJ, Dunkle RE, Goode RA, MacKintosh J. Discharge plan-
ning and decision making. Health Soc Work 1982;7:253–61.
[62] Bull MJ, Hansen HE, Gross CR. A professional–patient partnership
model of discharge planning with elders hospitalized with heart
failure. Appl Nurs Res 2000;13:19–28.
[63] Haddock KS. Collaborative discharge planning: nursing and social
services. Clin Nurs Spec 1994;8:248–52.
[64] Cox CB. Discharge planning for dementia patients: factors influencing
caregiver decisions and satisfaction. Health Soc Work 1996;21:97–
104.
[65] Naylor M, Brooten D, Jones R, Lavizzo-Mourey R, Mezey M, Pauly
M. Comprehensive discharge planning for the hospitalized elderly. A
randomized clinical trial. Ann Intern Med 1994;120:999–1006.
[66] Naylor MD, Brooten D, Campbell R, Jacobsen BS, Mezey MD, Pauly
MV, Schwartz JS. Comprehensive discharge planning and home
follow-up of hospitalized elders: a randomized clinical trial. JAMA
1999;281:613–20.
[67] Henderson A, Zernike W. A study of the impact of discharge informa-
tion for surgical patients. J Adv Nurs 2001;35:435–41.
[68] Evans RL, Hendricks RD. Evaluating hospital discharge planning: a
randomized clinical trial. Med Care 1993;31:358–70.
[69] Tierney AJ, Worth A, Watson N. Meeting patients’ information
needs before and after discharge from hospital. J Clin Nurs
2000;9:859–60.
[70] Robinson A, Miller M. Making information accessible: developing
plain English discharge instructions. J Adv Nurs 1996;24:528–35.
[71] Discharge kits boost patient satisfaction 65%. Hosp Peer Rev
2000;25:121–2.
[72] Dudas V, Bookwalter T, Kerr KM, Pantilat SZ. The impact of follow-
up telephone calls to patients after hospitalization. Am J Med
2001;111:26S–30S.
[73] Nelson JR. The importance of postdischarge telephone follow-up for
hospitalists: a view from the trenches. Am J Med 2001;111:43S–4S.
[74] Gombeski Jr WR, Miller PJ, Hahn JH, Gillette CM, Belinson JL,
Bravo LN, Curry PS. Patient callback program: a quality improve-
ment, customer service, and marketing tool. J Health Care Mark
1993;13:60–5.
[75] Laughlin T, Colwell P. Leaving the hospital: satisfaction with the
discharge process. The Satisfaction Monitor [newsletter], March/April
2002. Available from: http://www.pressganey.com/research/resources/
satmon/text/bin/135.shtm; accessed: November 29, 2002.
[76] Bostrom J, Caldwell J, McGuire K, Everson D. Telephone follow-up
after discharge from the hospital: does it make a difference? Appl Nurs
Res 1996;9:47–52.
[77] Redman BK, Levine D, Howard D. Organizational resources in
support of patient education programs: relationship to reported deliv-
ery of instruction. Patient Educ Couns 1987;9:177–97.
[78] Nelson EC, Rust RT, Zahorik A, Rose RL, Batalden P, Siemanski BA.
Do patient perceptions of quality relate to hospital financial perfor-
mance? J Health Care Mark 1992;12:6–13.
[79] Peltier JW, Schibrowsky JA, Cochran CR. By now it’s accepted:
patient loyalty that lasts a lifetime experiences with hospital staff
can make or break relationships. Marketing Health Serv 2002;22:29.
[80] John J. Referent opinion and health care satisfaction: patients’ evalua-
tions of hospital care can be linked to how they select the provider. J
Health Care Mark 1994;14:24.
[81] Ware Jr JE, Davies AR. Behavioral consequences of consumer dis-
satisfaction with medical care. Eval Program Plann 1983;6:291–7.
[82] Drain M, Kaldenberg DC. Building patient loyalty and trust: the role of
patient satisfaction. Group Pract J 1998 (October).
[83] Press I, Ganey RF, Malone MP. Satisfied patients can spell financial
well-being. Healthcare Financial Manage 1991;45:34–6.
[84] Bell R, Krivich MJ. How to use patient satisfaction data to improve
healthcare quality. Milwaukee, WI: ASQ Quality Press; 2000.