pavel ciaian andrey ivanov d’artis kancs long-run economic...
TRANSCRIPT

Long-run Economic, Budgetary and Fiscal Effects of Roma Integration Policies
Pavel Ciaian,
Andrey Ivanov,
d’Artis Kancs
2018
JRC Working Papers in Economics and Finance, 2018/7

This publication is a Technical report by the Joint Research Centre (JRC), the European Commission’s science
and knowledge service. It aims to provide evidence-based scientific support to the European policymaking
process. The scientific output expressed does not imply a policy position of the European Commission. Neither
the European Commission nor any person acting on behalf of the Commission is responsible for the use that
might be made of this publication.
Contact information
Name: d'Artis Kancs
Address: European Commission, DG Joint Research Centre, Via E. Fermi 2749, 21027 Ispra, Italy.
Email: d'[email protected]
Tel.: +32 229-59203
JRC Science Hub
https://ec.europa.eu/jrc
JRC112839
PDF ISBN 978-92-79-93400-1 ISSN 2467-2203 doi:10.2760/480218
Luxembourg: Publications Office of the European Union, 2018
© European Union, 2018
The reuse policy of the European Commission is implemented by Commission Decision 2011/833/EU of 12 December 2011 on the reuse of Commission documents (OJ L 330, 14.12.2011, p. 39). Reuse is authorised, provided the source of the document is acknowledged and its original meaning or message is not distorted. The European Commission shall not be liable for any consequence stemming from the reuse. For any use or reproduction of photos or other material that is not owned by the EU, permission must be sought directly from the copyright holders.
How to cite this report: Pavel Ciaian, Andrey Ivanov and d'Artis Kancs; Long-run Economic, Budgetary and Fiscal Effects of Roma Integration Policies; doi:10.2760/480218, JRC112839.
All content © European Union 2018.

Long-run Economic, Budgetary and Fiscal Effects of RomaIntegration PoliciesI
Pavel Ciaiana, Andrey Ivanovb, d’Artis Kancsa,∗
aEuropean Commission, DG Joint Research Centre, Ispra, Italy.bEuropean Union Agency for Fundamental Rights, Vienna, Austria.
Abstract
Although, the need for an efficient Roma integration policy is growing in Europe,surprisingly little robust scientific evidence regarding potential policy costs and expectedbenefits of alternative policy options has supported the policy design and implementationso far. The present study attempts to narrow this evidence gap and aims to shedlight on long-run economic, budgetary and fiscal effects of selected education andemployment policies for the inclusion of the marginalised Roma in the EU. We employa general equilibrium approach that allows us to assess not only the direct impact ofalternative Roma integration policies but also to capture all induced feedback effects. Oursimulation results suggest that, although Roma integration policies would be costly forthe public budget, in the medium- to long-run, economic, budgetary and fiscal benefitsmay significantly outweigh short- to medium-run Roma integration costs. Dependingon the integration policy scenario and the analysed country, the full repayment of theintegration policy investment (positive net present value) may be achieved after 7 to9 years. In terms of the GDP, employment and earnings, the universal basic incomescenario may have the highest potential, particularly in the medium- to long-run.
Keywords: Roma, social marginalisation, education, labour market, integration policy,universal basic income.JEL code: J6, J11, J24, O17, O43, I32.
IThe authors acknowledge excellent comments from Peter Benczur, Ruxanda Berlinschi, IoannisDimitrakopoulous, David Reichel and Sylke Schnepf, as well as helpful suggestions from participantsof the European Commission’s workshop on Roma communities in Europe "Taking stock of currentscience-based knowledge and what is needed for effective policy development", and the internationalconference "Challenges of Europe" in Bol. The authors are solely responsible for the content of the paper.The views expressed are purely those of the authors and may not in any circumstances be regarded asstating an official position of the European Commission or the European Union Agency for FundamentalRights.
∗Corresponding author, Competence Centre on Modelling, European Commission.Email address: d'[email protected] (d’Artis Kancs)

1. Introduction
The marginalisation of Roma is widespread in Europe and takes various forms, itencompasses almost all aspects of life spanning from education and employment tohealth and housing (O’Higgins and Ivanov 2006; FRA 2011; FRA 2018a; FRA 2018b).In order to improve the Roma situation, there is a strong political willingness andcommitment in the EU (European Parliament 2011). It is surprising however how littlerobust scientific evidence regarding potential costs and benefits of Roma integrationpolicies has supported the policy design and implementation so far.
To narrow this evidence gap and provide policy makers with the missing scientificevidence, the present study undertakes a comparative analysis of long-term economic,budgetary and fiscal costs and benefits of alternative Roma integration policies in theareas of education and employment in five EU Member States with the largest share ofthe Roma population – Bulgaria, the Czech Republic, Hungary, Slovakia and Romania.1
We employ a general equilibrium approach that allows us to assess not only the directimpact of selected Roma integration policies but also to capture all induced feedbackeffects.
In the five studied EU Member States from the Central and Eastern Europe (CEE) livearound 4 million Roma (Council of Europe 2012). Many Roma communities are amongthe most socially and economically marginalised groups in these countries; they performworse than the mainstream society in almost all socio-economic spheres of life, beingrelegated to the fringe of society. On average, Roma are found to have lower income level,higher poverty rate regardless of the poverty metrics applied (Ivanov and Kagin 2014),higher unemployment rate (FRA 2018b), they are less educated, face higher incidenceof undernourishment, have lower life expectancy, higher child mortality, less access todrinking water, sanitation and electricity, etc. (O’Higgins and Ivanov 2006; Kertesi andKézdi 2011).
These evident and sizeable well-being differences between Roma and the mainstreampopulation make the Roma inclusion issue high on the policy agenda in EU MemberStates. The key priorities of inclusion policies include the integration of Roma into theschooling system, labour markets and improving access to social services and infrastruc-ture (Achim 2004; Ringold, Orenstein and Wilkens 2005; Ciaian and Kancs 2016). Atthe European level, two policy initiatives (and policy frameworks) highlight the political
1In the present study we neglect impacts on humanitarian, human right and many social issues, thepositive impact of which is uncontested though.
1
importance of the Roma inclusion: the Decade of Roma Inclusion (2005-2015), and theEU Framework for National Roma Integration Strategies (2011-2020). Similarly importantis the Paris Declaration,2 which aims at mobilising the education system to preventand tackle marginalisation, intolerance, racism and radicalisation, and to preserve aframework of equal opportunities for all, including an inclusive education for all chil-dren, independent of the social background. Further, the European Commission hasincreased its policy support under the European Semester of the Europe 2020 strategy,and has linked the EU funding to the policy implementation. For example, in 2016 theEuropean Commission issued Country Specific Recommendations to improve accessto the schooling and employment of Roma in five EU Member States with most acutemarginalisation challenges, i.e. Bulgaria, the Czech Republic, Hungary, Romania andSlovakia. In addition, there is also legislation for fighting discrimination against Roma(the Racial Equality Directive),3 as well as European Structural and Investment Funds canbe used for the Roma inclusion in the EU.4 At the national level, policy instruments in-clude targeted national Roma integration strategies and measures, reforms of mainstreampolicies impacting Roma and the enforcement of an anti-discrimination legislation. Bothnational and EU funds are being used either for Roma-targeted measures or for inclusivemainstream reforms (European Commission 2018).
Despite of a growing demand for and supply of Roma integration policies, the existingevidence base supporting the design, implementation and evaluation of Roma integrationpolicies is scarce and inconclusive. On the one hand, there are only few studies inthe scientific literature looking at these questions systematically. On the other hand,the few existing studies apply at most a partial equilibrium approach or undertakea reduced form analysis to estimate costs and benefits of Roma integration policies.For example, Kertesi and Kézdi (2006) have estimated long-term budgetary effects ofinvestments in Roma children in the secondary education in Hungary. Bogdanov andAngelov (2007) have estimated costs and benefits of an improved education of Romain Bulgaria. Marcincin and Marcincinová (2009) and a team of the World Bank expertshave conducted a similar analysis for Slovakia (World Bank 2012). There have been also
2Declaration on promoting citizenship and the common values of freedom, tolerance and non-discrimination through education adopted by the Commissioner Navracsics and Education Ministersin 2015, see https://webgate.ec.europa.eu/fpfis/mwikis/eurydice/images/1/14/Leaflet_Paris_
Declaration.pdf.3Council Directive 2000/43/EC, http://eur-lex.europa.eu/legal-content/EN/TXT/?uri=celex:
32000L00434ESIF Investment priority 9(ii) ’Integration of marginalised communities such as the Roma’.
2

attempts to estimate economic and fiscal costs and benefits of the Roma inclusion in thelabour market in the Czech Republic and Romania. Despite providing some evidence,an important limitation of reduced form / partial equilibrium analyses is that they donot take into account economy-wide interactions and medium- to long-run feedbackeffects and adjustments on labour markets. As result, without accounting for all directand indirect rebound effects provides only a partial and/or biased picture of true policyeffects.
In order to narrow this evidence gap, the present study undertakes a holistic analysisof long-run economic, budgetary and fiscal costs and benefits of selected Roma inclusionpolicies in five EU countries from the CEE: Bulgaria, the Czech Republic, Hungary,Slovakia and Romania. We have selected these five countries, because more than twothirds of the total EU Roma population reside in these EU Member States. The secondreason for choosing these countries is that the Roma marginalisation is particularlywidespread and represent an acute and rapidly growing socio-economic problem in thesecountries (see section 2). They cause frictions not only at the national level, but mayalso have EU-wide implications, e.g. through migration (Halasz 2009; Korando 2012).From the EU policy perspective, these five countries are the only EU Member States withcountry specific recommendations regarding Roma issued by the European Commission.
By complementing previous findings, the current study undertakes a comparativeanalysis of long-run economic, budgetary and fiscal impacts of alternative Roma inte-gration policies by following the modelling approach of Tanaka et al. (2018) and Kancsand Lecca 2018) implemented for the five EU Member States. This modelling frameworkallows us to undertake a holistic analysis of long-run social, economic and fiscal impactsof alternative Roma integration policies. The modelling of education is based on Tanakaet al. (2018), who propose an education model in the context if immigrants versus nativeswith two channels of adjustment: the education quantity and quality. Given that Romaare long-term immigrants with important differences in educational attainment rates andin the education quality with respect to the mainstream population in host countries,we adopt this approach in the present study. The labour market is modelled followingBonacich (1975), who proposes a split labour market between migrant and native workers.The empirical implementation of the split labour market follows Kancs and Lecca (2018).
The adopted general equilibrium framework has important advantages over alterna-tive methods in the context of our study. As summarised by the OECD (1986):
"The most important strength of the general equilibrium methodology is its solid
3

microeconomic foundation, which precludes ad-hoc specification and makes the modelstructure more transparent. The theoretical foundation of such models makes itpossible to trace back, in every case, the simulation results and determine whichfactors are crucial in explaining them."
"Moreover, the general equilibrium models ensure the internal consistency of theanalysis. This makes general equilibrium models extremely useful in the case ofeconomy-wide policy issues with many ramifications, sometimes acting in oppositedirections, and generating feedback effects which are crucial to the final result."
In collaboration with Roma experts and policy makers in the EU, we have designedtwo alternative Roma integration policy scenarios and assess long-run economic, bud-getary and fiscal effects. In addition to assessing the impacts of Roma integration policyinitiatives currently being planned/implemented in the five EU Member States, we alsodesign and simulate a hypothetical – universal basic income – scenario, where the sameamount of public funding for the Roma integration is disbursed in form of direct cashtransfers. According to the existing evidence (Aizer et al. 2016; Nikiforos et al. 2017,Kela 2018; Pareliussen et al. 2018; Jones and Marinescu 2018; Marinescu 2018), thereare good reasons to believe that providing direct cash transfers to poor/marginalisedhouseholds, such as Roma, may be the preferred policy option over complex supply-sideprograms conditioned on many factors. Indeed, Roma integration policies that attemptto increase the supply of certain public services, e.g. education, are often being criticised:key drivers of low educational attainment rates are not tackled, private costs of Romahouseholds often exceed social benefits, wrong incentives are created and high admin-istrative costs imposed that significantly reduce the net amounts actually arriving atRoma households.5 Also, supply-driven programs tend to reflect donor’s understandingthe challenges Roma are facing, which may diverge from the reality on the ground.In the long-run, this top-down approach facilitated by layers of intermediaries makesparticipatory approaches more difficult to implement ultimately encouraging a culture ofdependency of the communities commonly referred to as ‘target groups’ (FRA 2018c).For these and other reasons, direct cash transfers to poor households and marginalisedcommunities are being increasingly implemented not only in developing but also in
5Among others, discussions during the European Commission’s workshop on Roma communitiesin Europe "Taking stock of current science-based knowledge and what is needed for effective policydevelopment".
4

developed countries, such as the USA, Canada and Finland (de Janvry and Sadoulet 2004;Bassett 2008; Kela 2018).
Our simulation results suggest that, although the Roma integration e.g. by providingtargeted education assistance services and reducing the labour market discriminationwould be costly for the public budget, in the medium- to long-run, economic, budgetaryand fiscal benefits may significantly outweigh short- to medium-run Roma integrationcosts. Depending on the integration policy scenario and the analysed country, the annuallong-run GDP effect would be between 16.47 and 109.93 million Euro above the baselinegrowth, and the full repayment of the integration policy investment (positive net presentvalue) would be achieved after 7 to 9 years. In terms of the GDP, employment andearnings, the universal basic income scenario clearly outperforms currently implementedRoma integration policies, particularly in the medium- to long-run.
The rest of the paper is organised as follows. The next section provides a briefbackground of the Roma population in Europe and summarises the socio-economicsituation of Roma in the five study countries. Section 3 sketches the underlying modellingframework, whereas section 4 details the construction of alternative policy scenarios andmain assumptions behind each of them. Section 5 presents simulation results, whereasthe final section concludes.
2. Roma in Europe: A historical background and current situation
2.1. Historical background
Since their arrival in Europe in the 15-16th century, Roma have faced various types ofdiscrimination by the mainstream society lasting for many centuries. Throughout thecenturies, the concept of otherness was (and still is) shaping the relationships betweenthe Roma and the surrounding (Gadzo) societies. Both Roma and non-Roma looked atthe others as dangerous, putting own group’s identity at risk. In the case of the Roma,the hostility on the side of the Gadzo and the factual exclusion of Roma was augmentedby the Roma’s implicit resistance to engage with the disciplining structures of sedentarysocieties and their non-Roma hierarchies, both cleric and secular. The process intensifiedwith the consolidation of nation-states in the 19th and 20th century (Ivanov 2012).
The discriminatory attitudes against Roma that were later incorporated in the publiclegislation and regulations in Europe have varied between countries and over time andhave included, among others, banishment to enter and stay in countries, expulsion,deportation, imprisonment, forced labour, death penalty without trial on the grounds of
5

being Roma, banishment of certain occupations (e.g. trade), confiscations of possessions,forceful taking of Roma children from families and placing them in non-Roma families,forced assimilation and integration, deportation to colonies and enslavement in severalparts of Europe. One of the worst records in the European history of Roma occurredduring the World War II, when Roma were subject to deportations and mass executions,similar to Jews. Historians estimate that 220,000 to 600,000 Roma were killed by Nazisand their collaborators, in other words, between 22% and 60% of the around 1 millionRoma in Europe at the time. The biggest losses in Roma lives were recorded in CEEcountries, particularly in Romania and Hungary (Fraser 1995; Hancock 2005; HolocaustEncyclopedia 2016; Ciaian and Kancs 2016).
After the World War II, the attitude of state authorities towards Roma started tochange. The countries of Central and Eastern Europa (the former socialist block) adopteda class-based approach addressing Roma integration in the context of ‘elevating’ inferiorgroups to proletariat status trough full employment – in the case of Roma, mostly inheavy industry and agriculture. In the Western Europe, the approach was based onrespect to individual rights and minority integration gradually became one of the EUpolicy paradigms to address the challenges of social and economic marginalisation.Since 2010 the marginalisation of Roma is seen as violation of fundamental rights andnot merely as socio-economic vulnerability prompting the active involvement of theEuropean Commission in Roma integration (EC 2011). Since then, inclusion policies inthe EU seek to integrate Roma into the mainstream society, i.e. in the schooling system,labour markets and improve access to social services. In contrast, countries under theCommunist regime followed a different path, as a forced assimilation remained to be themain government policy paradigm, e.g. sterilisation of Roma women in Czechoslovakia,taking away Roma children from their families and destruction of Roma villages inHungary; assimilation policy in Romania. Only after the fall of the Communist regime inaround 1990, CEE countries started to adopt a more integrated approach towards Roma(Achim 2004; Ringold, Orenstein and Wilkens 2005; Ciaian and Kancs 2016).
Even though the anti-Roma discrimination by state authorities has reduced signifi-cantly during last decades, it has not been eliminated completely in Europe. Discrimina-tory attitudes of state authorities against Roma can still be observed in many Europeancountries, particularly in the Central and Eastern Europe. The most widespread forms ofthe anti-Roma discrimination are linked to ethnic bias in the provision of various publicinstitutions and/or the way regulations are implemented and/or enforced by central,
6

regional and local authorities. Examples of the formal anti-Roma discrimination takingplace in CEE countries include an abusive behaviour of police towards Roma, failure ofthe justice system to investigate racist abuses, forced evictions, an unequal treatment ofRoma children by the mainstream schooling system, e.g. segregation, abusive behaviourof teachers, inferior education, failure of official authorities to take active actions (stand)against racist attitudes towards Roma, etc. (Petrova 2004; Mudde 2005; Cviklova 2015;Ciaian and Kancs 2016).
In addition, various extremist and radical political parties (active in almost all Eu-ropean countries) exploit the anti-Roma attitudes fuelling them further. Many of thesepolitical parties legitimise their existence and build their political capital by prototypingminorities as a burden to the mainstream society and as a cause of societal problems.Roma and immigrants are among the most common targets of extremist and radicalpolitical parties in Europe to gain votes and the political power (Halasz 2009; Stewart2012; Ram 2014; Ciaian and Kancs 2016).
Despite discriminations and genocides in past, Roma is one of the largest ethnicminorities in Europe nowadays. Although, the exact size of the Roma population isnotoriously hard to estimate, because statistical data by the ethnic origin are not collectedin an accurate and systematic way (mostly due to privacy reasons), their size in Europeis estimated between 11 and 20 million. In the EU, Roma population is estimated tobe between 4 and 8 million (Barany 2002; Council of Europe 2012; Ringold et al. 2005).Most of European Roma (around 80%) live in former communist countries in the CEE;Bulgaria, Hungary, Slovakia and Romania have the largest Roma populations in Europe.The share of Roma in the total population is close to 10% in Bulgaria, around 9% inSlovakia and Romania and 7% in Hungary, followed by the Czech Republic. More thanone third of European Roma live in these five CEE countries, whereas the share of Romaaccount for more than two thirds of all Roma in the EU.
Finally, it is important to note that Roma is one of the fastest growing populationgroups in Europe at the beginning of the 21st century, with an increasing share of theRoma population being comprised of youth: 36% of the Roma population are under 15compared to 16% of the overall population in Europe. The average age is 25 years amongRoma, compared to around 40 years among non-Roma (Fundacion Secretariado Gitano2009; Roma Education Fund 2004). Particularly in the CEE, Roma represent a significantand growing share of the school age population and therefore the future workforce.
7

2.2. Socio-economic situation of Roma in study countries
The social and economic deprivation of Roma is widespread in all five studiedcountries and takes various forms, it encompasses almost all aspects of life spanningfrom educational, economic (e.g. labour market, income) to social (e.g. housing, health)and infrastructure (e.g. Cretan and Turnock 2009; Kézdi and Suranyi 2009; Kertesi andKézdi 2011; O’Higgins 2012; Brüggemann 2012; Mihailov 2012; Peric 2012; Ivanov andKagin 2014; Cviklova 2015). However, not all Roma households are marginalised. In orderto identify the share of marginalised Roma (and non-Roma) households, we adopt theUNDP’s social exclusion index (Peleah and Ivanov 2013). The UNDP index contains threedimensions, each being described by 8 indicators (24 in total). Given that the primaryfocus of our study are those policy interventions that improve the educational andemployment situation of economic and social dimensions, we adopt narrower definitionof marginalisation in our analysis.6 According to this adjusted definition of the UNDP’ssocial exclusion index, a Roma adult is considered as ‘socio-economically excluded’ if ithas accumulated deprivations in these indicators: (i) adults with a not completed uppersecondary education; (ii) being an unemployed (or a discouraged worker).7 For Romachildren, we use one socio-economic indicator: (iii) children of compulsory school-age notattending school. These three key indicators are complemented by four further indicators:(iv) children with/without a pre-school education; (v) illiteracy; (vi) paid employment;and (vii) at risk of poverty. We use the FRA / European Commission’s survey data tocompute the three marginalisation indicators.8
Children with preschool education. Education problems of Roma are pervasive at allstages of education. The gap between Roma and non-Roma in accessing the educationsystem starts already with the preschool education. The European Union Agency forFundamental Rights (FRA) and European Commission’s 2011 survey conducted inselected EU countries among Roma and non-Roma which share a similar environmentreveals a significant gap in the preschool attendance between Roma and the mainstreampopulation. In contrast to 87%-96% of similar non-Roma, only 44% of Roma aged 6-15
6In the original UNDP definition of the social exclusion person is considered as ‘socially excluded’ if ithas accumulated 9 or more deprivations from the 24 indicators.
7The original UNDP labelling for three of these indicators – (i) Household with young children not inschool or pre-school, (ii) Low educational achievements (basic schooling) and early school leavers; (iii)Being unemployed or a discouraged worker – has been adjusted to match them more precisely with thoseavailable in the European Commission’s 2011 survey data.
8Data from 2011 Roma survey are accessible from the FRA’s online data explorer: http://fra.europa.eu/en/publications-and-resources/data-and-maps?mdq1=theme&mdq2=3508
8

4987
1345
4130
115
3285
012
9464
0 20 40 60 80 100
At risk of poverty
Unemployment
Paid employment
Illiteracy
Not completed upper secondary education
Children not attending school
Children with preschool education
Roma Non−Roma
Figure 1: Socio-economic characteristics of Roma in Bulgaria, percent of respondents. Sources: Childrenwith preschool education (age group 6-15); Children of compulsory school age not attending schoolin 2010/2011; Adults with not completed upper secondary education (age group between 18-24); Selfperceived illiteracy (age group 16 and above): FRA (2014c); Paid employment (age group 16 and above)(including full-time, part-time, ad-hoc jobs, self-employment): FRA (2014a); Self-perceived unemployment:FRA (2011); At risk of poverty (below 60 % of the national median): FRA (2014b).
in the Czech Republic, 48% in Slovakia, 55% in Romania and 64% in Bulgaria had everattended the preschool education (Figures 1, 2, 4 and 5). Although, in Hungary thepreschool education participation of Roma is somewhat higher, it is still below that of asimilar non-Roma population 3. The very low preschool attendance indicates that Romachildren will likely face difficulties to catch up with non-Roma at subsequent schoolingstages (primary and secondary education) and thus represents an important cause of theearly school drop-out (European Commission 2012; FRA 2014a).
Children not attending school. The FRA / European Commission’s 2011 survey resultsalso reveal important differences in the compulsory school attendance (at the age between7 and 15) between Roma and non-Roma children in the five studied countries: between5% and 22% of the Roma children aged 7 to 15 are not attending the compulsory schooleducation compared to between 0% and 6% of non-Roma children. According to Figures1 and 4, the school attendance gap is particularly sizeable in Bulgaria and Romania,
9

4780
935
6034
04
2572
27
9344
0 20 40 60 80 100
At risk of poverty
Unemployment
Paid employment
Illiteracy
Not completed upper secondary education
Children not attending school
Children with preschool education
Roma Non−Roma
Figure 2: Socio-economic characteristics of Roma in the Czech Republic, percent of respondents. Sources:Children with preschool education (age group 6-15); Children of compulsory school age not attendingschool in 2010/2011; Adults with not completed upper secondary education (age group between 18-24);Self perceived illiteracy (age group 16 and above): FRA (2014c); Paid employment (age group 16 and above)(including full-time, part-time, ad-hoc jobs, self-employment): FRA (2014a); Self-perceived unemployment:FRA (2011); At risk of poverty (below 60 % of the national median): FRA (2014b).
where respectively 12% and 22% of Roma children in the compulsory school age are notattending a compulsory school education either because they are still in preschool, notyet in education, skipped the year, stopped school completely or are already working(European Commission 2012; FRA 2014a).
Not completed upper secondary education. With respect to the upper secondary education,the FRA / European Commission’s 2011 survey results suggest that only a fraction ofRoma children have completed the upper secondary education compared to non-Romain the five study countries. Between 72% and 93% of Roma in the age group between 18to 24 have not completed the upper secondary education compared to between 7% and50% of non-Roma in the five study countries. The secondary education situation of Romais particularly alarming in Bulgaria, the Czech Republic and Slovakia, where educationalgaps to the mainstream population are more than 50%. For example, in Slovakia only 7%of Roma have completed the upper secondary education, compared to 83% of non-Roma.
10

3581
1333
3529
06
4882
45
9692
0 20 40 60 80 100
At risk of poverty
Unemployment
Paid employment
Illiteracy
Not completed upper secondary education
Children not attending school
Children with preschool education
Roma Non−Roma
Figure 3: Socio-economic characteristics of Roma in Hungary, percent of respondents. Sources: Childrenwith preschool education (age group 6-15); Children of compulsory school age not attending schoolin 2010/2011; Adults with not completed upper secondary education (age group between 18-24); Selfperceived illiteracy (age group 16 and above): FRA (2014c); Paid employment (age group 16 and above)(including full-time, part-time, ad-hoc jobs, self-employment): FRA (2014a); Self-perceived unemployment:FRA (2011); At risk of poverty (below 60 % of the national median): FRA (2014b).
Illiteracy. The illiteracy rate of Roma aged 16 and above is between 4% and 31%compared to 1% or less for non-Roma in the five study countries. The illiteracy rateis particularly high in Romania (31%) and Bulgaria (15%) (Figures 1 and 4) (EuropeanCommission 2012; FRA 2014a). The very high illiteracy rate of Roma is both causeand implication of their socio-economic marginalisation. According to UNESCO (2010),illiteracy not only limits the full development of individuals and their participation in so-ciety, but also has repercussions throughout life, affecting a person’s family environment,restricting access to the benefits of development, and hindering the enjoyment of otherhuman rights.
Paid employment. Roma are significantly worse off also on labour markets comparedto non-Roma, particularly in terms of the employment share. According to the FRA /European Commission’s 2011 survey, in the five studied countries only 21% to 34% ofRoma aged 15 and above were in a paid employment (including full-time, part-time,
11

3578
1030
3829
231
5093
622
8755
0 20 40 60 80 100
At risk of poverty
Unemployment
Paid employment
Illiteracy
Not completed upper secondary education
Children not attending school
Children with preschool education
Roma Non−Roma
Figure 4: Socio-economic characteristics of Roma in Romania, percent of respondents. Sources: Childrenwith preschool education (age group 6-15); Children of compulsory school age not attending schoolin 2010/2011; Adults with not completed upper secondary education (age group between 18-24); Selfperceived illiteracy (age group 16 and above): FRA (2014c); Paid employment (age group 16 and above)(including full-time, part-time, ad-hoc jobs, self-employment): FRA (2014a); Self-perceived unemployment:FRA (2011); At risk of poverty (below 60 % of the national median): FRA (2014b).
ad-hoc jobs, self-employment) compared to between 35% and 60% of non-Roma thatshare a similar environment. For example, in Slovakia only 21% of the surveyed Romawere in a paid employment, compared 53% of a similar non-Roma population (Figure 5).A significant gap – of more than 20% in a paid employment between similar Roma andnon-Roma – is also observed in Bulgaria and the Czech Republic (Figures 1 and 2) (FRA2012c).
Even when Roma are in paid employment, they often have to rely on seasonal andoccasional type of jobs (Troc 2002; O’Higgins and Ivanov 2006). According to the FRA/ European Commission’s 2011 survey, only between 34% and 81% of Roma in paidemployment have full-time jobs in the five study countries, while the rest of Romain a paid employment face precarious employment conditions, i.e. hold ad-hoc jobs,are self-employed and are employed part-time. Two thirds of those who are in a paidemployment do not have a full time job (4) (FRA 2012c).
12

4491
738
5321
05
783
57
8848
0 20 40 60 80 100
At risk of poverty
Unemployment
Paid employment
Illiteracy
Not completed upper secondary education
Children not attending school
Children with preschool education
Roma Non−Roma
Figure 5: Socio-economic characteristics of Roma in Slovakia, percent of respondents. Sources: Childrenwith preschool education (age group 6-15); Children of compulsory school age not attending schoolin 2010/2011; Adults with not completed upper secondary education (age group between 18-24); Selfperceived illiteracy (age group 16 and above): FRA (2014c); Paid employment (age group 16 and above)(including full-time, part-time, ad-hoc jobs, self-employment): FRA (2014a); Self-perceived unemployment:FRA (2011); At risk of poverty (below 60 % of the national median): FRA (2014b).
Unemployment. Regarding the unemployment rate in the five study countries, theFRA / European Commission’s 2011 survey revealed that between 30% and 45% ofRoma were unemployed; which is more than two times higher compared to a similarnon-Roma population. In Bulgaria, the Czech Republic, Romania and Slovakia, the Romaunemployment rate was between 3 to 6 times higher than that of a comparable non-Romapopulation (Figures 1, 2, 4 and 5) (FRA 2011).
Based on the UNDP Roma survey results conducted in CEE countries in 2002 and2004, O’Higgins and Ivanov (2006) have found that most Roma suffered from a long-termunemployment. While in the 2002 survey, more than half (51%) of the unemployed Romawere without job since 1996 or earlier, in the 2004 survey, the average share of thosewithout job since 1996 has increased to 64% (ranging from 55% in Bulgaria to 88% inRomania). A further effect of the long-term unemployment is reflected also in the factthat many Roma are not eligible for unemployment benefits and must rely among others
13

on a minimal social assistance.Further, O’Higgins and Ivanov (2006) have found that Roma unemployment rates
decrease with the educational attainment level, a fact which is known also from themainstream population. However, survey results reveal that unemployment rates amongRoma fall much slower with the educational attainment level than among non-Romaliving in a close proximity to Roma. This discrepancy between Roma and non-Romaindicates a presence of an anti-Roma discrimination in the labour market. According toO’Higgins and Ivanov (2006), among others, this contributes to explaining the fact thatthe early school leaving of Roma pupils is larger than of non-Roma children, as the gainsfrom education (schooling premium) are considerably smaller for Roma. However, thismay also indicate lower quality education attained by Roma for the same grade, as manyRoma tend to attend lower quality schools and/or segregated classes.
Risk of poverty. According to the FRA / European Commission’s 2011 survey, the largemajority of Roma households (more than 78%) have an income level below the nationalrisk-of-poverty level (i.e. lower than 60% of the national median disposable income),compared to less than 49% of similar non- Roma households in the five study countries(Figures 1 – 5). This latter figure represents a poverty risk significantly above the averagerate at the national level. The poverty risk is positively correlated with the householdsize, though the variation between household sizes is relatively small (FRA 2014b).
Kertesi and Kézdi (2011) have identified a significant wage gap between Roma andnon-Roma in Hungary in surveys conducted between 1993 and 2007. According totheir results, differences in observable characteristics, e.g. the educational backgroundand geographic isolation, explain 40% of the wage gap between the employed Romaand non-Roma, whereas the rest of the wage gap has to be attributed to differences inunobserved skills and the anti-Roma discrimination on the labour market.
2.3. Education quality
When thinking about fundamental differences in the educational attainment betweenRoma and non-Roma children, it is useful to distinguish between two broad types ofeducation pathways:9 (i) Vocational education – education pathway leading to an appren-ticeship; and (ii) general education – education pathway finishing with a matriculationexamination (matura).10
9Note that in reality there are many more types of education pathways possible in the five studied CEEcountries and there is a certain mobility between the two broad types identified in the present study.
10A type of a matriculation examination exists in each of the five studied CEE countries.
14

The apprenticeship education pathway implies finishing a primary school plus avocational training. Hence, apprenticeship is the lower standard of a school educationqualification: it is less demanding for children (and their parents), but usually also labourmarket outcomes are lower. There are several types of schools offering education thatfinishes with this lower standard of qualification: practical schools, vocational schools,etc. In the context of Roma, also special schools and segregated schools are relevant,as they all do not lead to the matura exam. For example, in the Czech Republic thereare ’mainstream schools with special educational programmes for pupils with specialeducation needs’, which are more commonly referred to as ’practical schools’. Accordingto European Parliament (2011), 27 percent of Roma children attend these practical schools,which is in stark contrast with 2 percent of children from the mainstream population.According to Stejskalova (2012), these practical schools are the preferred option by manyRoma households. First, in these schools parents are only little involved and takenas responsible for their child’s education and homework preparation. Second, thesepractical schools are usually located in a close neighbourhood of Roma communities,implying lower transport/commuting costs for children to attend school. Third, becausethe majority of classmates are from disadvantageous families, children in these schoolsexperience less discrimination from peers. On the other hand, the education qualityin these practical schools is considerably lower than in regular schools. According toEuropean Parliament (2011), 65 percent of Roma pupils who follow the practical schooleducational pathway finish school with the lower standard of qualification (secondaryschool with apprenticeship) and less than one percent of Roma pupils graduate with thehighest form of qualification – matura.
The matura education pathway implies finishing a primary school plus a secondaryschool with a matriculation examination. Hence, mature is the higher standard of aschool education qualification: it is more demanding for children (and their parents),but usually also labour market outcomes are higher. A matriculation examination istaken at the end of the secondary education, and generally must be passed in orderto apply to a university or other institutions of higher education. After passing thematriculation examination, students receive a school leaving certificate, which allowsthem to matriculate at university and take up their studies. In other words, completing asecondary school with a matriculation examination makes a higher education possible.There are different types of schools leading to the matura exam, they vary from countryto country: high schools, gymnasiums, lyceums, upper schools, etc.
15

According to the Roma Education Fund (2018), around 46% of Roma children attendspecial schools in the CEE, which compares to just below 5% of children of the mainstreamsociety (see also Kertesi and Kezdi 2011). Hence, there are important differences not onlyin educational attainment rates between Roma and non-Roma, but also in the quality ofthe received education.
3. Modelling framework
As noted in introduction, the existing evidence base supporting the design andimplementation of Roma integration policies is scarce and inconclusive. The few existingstudies estimating costs and benefits of Roma integration policies apply at most a partialequilibrium approach or undertake a reduced form analysis. A key limitation of reducedform / partial equilibrium analyses, which are being used to assess Roma integrationpolicies, is that they do not take into account economy-wide interactions and medium-to long-run feedback effects and adjustments on labour markets. For example, usually,they assume that policy-induced investments in the human capital of Roma would notchange wages and employment probabilities of the mainstream population. Justificationsfor such rather limiting assumptions are provided by evidence that Roma are minoritiesin countries where they reside and their share in the total labour force is relativelysmall. However, from the dual labour market theory (e.g. Dickens and Lang 1985) weknow that an integration policy that would improve the labour market participation andemployment of the economically inactive population would shift the labour supply, whichin turn would affect labour market outcomes in the medium- to long-run. Furthermore,the inclusion of Roma into labour markets is expected to generate more economic activity,which will affect demand, the tax revenue of government, etc. Although, both types ofgeneral equilibrium effects affect the overall costs and benefits of the Roma integrationpolicy in the medium- to long-run, they are not accounted for in reduced form / partialequilibrium analyses.
Capturing general equilibrium feedback effects and the above discussed sizeabledifferences between Roma and non-Roma in education and labour markets pose chal-lenges to the analytical framework. First, the model must be able to identify Romaand non-Roma children in education and workers on the labour market separately, assection 2 suggests sizeable differences between the two population groups. Second, themodelling framework should be able to capture all short- and long-run policy-inducedgeneral equilibrium feedback effects on labour markets, public budget, etc. Third, the
16

modelling framework should allow for an integration policy-induced social mobility.Taking these aspects into consideration, in the present study we follow the modelling
approach of Tanaka et al. (2018) and Kancs and Lecca 2018) that allows us to undertakea holistic analysis of long-run social, economic and fiscal impacts of alternative Romaintegration policies. The modelling of education and labour markets is less traditional,therefore, all key equations are presented and discussed in detail. The rest of the under-lying model (firms, government, equilibrium conditions) is rather standard, therefore,it’s description is kept concise. The modelling of education is based on Tanaka et al.(2018), who propose an education model in the context if immigrants versus nativeswith two channels of adjustment: the education quantity and quality. Given that allmain results of this model apply also to Roma (who share key patterns of exclusion anddiscrimination based on social constructs and prejudice because of their ’otherness’),we adopt the Tanaka et al. (2018) approach in the present study. The labour marketis modelled following Bonacich (1975), who proposes a split labour market betweenmigrant and native workers (see Kancs and Lecca 2018).
The adopted general equilibrium framework offers several advantages in our study,compared to partial equilibrium and reduced form methods. According to the EuropeanCommission’s Better Regulation Toolbox (p.359), 11 a general equilibrium framework,which captures linkages between markets across the entire economy, is the most appropri-ate when indirect impacts are likely to be the most significant ones in terms of magnitudeof expected impacts:
"General equilibrium models are able to simulate the shifts in supply curves andcorresponding demand changes that can result from any change in the economy,from a price shock in raw materials to a new form of price regulation. Accordingly,they are able to model the links between connected markets in a way that shows theultimate impact on outputs and consumption of goods and services in the new marketequilibrium; and they can also determine a new set of prices and demands for variousproduction factors (labour, capital, land). As a final result, they can also provideindications and estimates as regards macroeconomic changes, such as GDP, overalldemand, etc." Better Regulation Toolbox (p.359)
11https://ec.europa.eu/info/better-regulation-guidelines-and-toolbox_en
17

3.1. Overview of the model12
Key economic ’agents’ in the model are households, firms and government; keyproduction factors are different types of labour and capital. The model economy isrepresented by five EU Member States: Bulgaria, the Czech Republic, Hungary, Slovakiaand Romania, the rest of the EU and the rest of the world. Being a general equilibrium,the model captures all flows of goods and services of the global economy in the baseyear. Through international trade linkages, the model covers also the rest of the world,which for the sake of simplicity is modelled in a fairly aggregated way though.
Each EU Member State’s economy is composed of a number of economic sectors,the supply of educational services representing one such sector.13 Each economic sectorproduces goods or services for the intermediate and final use by combining inputs frommaterials, capital and labour according to a nested Constant Elasticity of Substitution(CES) production function framework. In each sector goods are either vertically dif-ferentiated (education services) or horizontally differentiated (all other sectors).14 Insectors producing horizontally differentiated goods, the competition between firms ismonopolistic, implying that many small firms offer similar products or services, whichhowever are not perfect substitutes. Barriers to entry and exit in each economic sectorare sufficiently low, such that the production/pricing decision of any one firm does notdirectly affect those of its competitors. The equilibrium nature of the model implies thatall revenues from the production of goods and services are allocated either to households(as returns to labour or capital), to other industries as payments for the intermediateoutput, or to government as taxes.
The demand for goods and services produced in all economies stems from households,firms in the same or other sectors and the public sector (government). As usual, thegovernment budget (net of taxes, subsidies, transfers and savings) is allocated amongdifferent commodities according to a CES utility function.
12See Appendix for a formal description of the model.13The SAM data set to which the model is calibrated provides a considerable flexibility to re-aggregate
the model into different sectoral groupings, which we exploit intensively in a sensitivity analysis, in orderto assess impacts on low-tech versus high-tech sectors, skill-intensive versus skill-extensive sectors, etc.In the this study we employ a five sector version of the model: Low-skill manufacturing; Medium-skillmanufacturing; High-skill manufacturing; Education and the Rest of the economy (see Appendix for detailsof the sectoral classification).
14See Lutz and Turrini (2006) for vertically differentiated skills.
18

3.2. Education
Each of the five EU Member State is populated by heterogenous households. FollowingTanaka et al. (2018), households are differentiated according to their ethnic origin, f , thatinclude mainstream society’s households and Roma households. Households betweendifferent ethnic origin groups differ with respect to the number of children, the preferencefor education, costs of education (opportunity costs of a child labour in household) andthe disposable income.
Following Tanaka et al. (2018), households have a nested utility structure, where atthe top level, household with the ethnical background, f , derive utility, u f , from theconsumption of horizontally differentiated consumption goods and services, C, and fromvertically differentiated education services, E f (in per-child units):15
u f =1α(C)α︸ ︷︷ ︸
Consumption goods
+γ f
α
(E f)α︸ ︷︷ ︸
Educaiton services
(1)
where α < 1 is parameter determining the share of the aggregate income devoted toeducation by the government, that is, and implicit tax rate determining the tax elasticityof demand for educational services, and γ f > 0 is a preference parameter for educationrelative to consumption that is common to all households from the same ethnic group.
As regards consumption goods, see Appendix for a description of the householdconsumption behaviour. As regards education services, at the second tier householdsdecide on a particular education quality from a range of vertically differentiated educationservices, each firm in the education sector supplying a different quality education services.All firms in the education sector receive a per-student subsidy from government, denotedby b ≥ 0. This education subsidy constitutes a public cost of education that is financedthrough taxes, t. In addition, households face also a private cost of education, e.g. schoolfees, z f ≥ 0, that are education quality-specific: higher quality education costs more tohouseholds and vice versa. Households choose their preferred education quality amonga range of vertically differentiated education services indexed by the quality premium,z f . The household indirect utility can then be rewritten as:
u f = maxz f ≥0
1α
(y f (1 − t)− c f n f z f
)α+
γ f
α
(b + z f
)α (2)
15Country subscripts are omitted in this section for the sake of brevity.
19

which is increasing in the disposable (net of taxes, t) household income, y f , and educationunits (quality), b + z f . The household utility is decreasing in education costs, c f n f z f ,where c f captures ethnic origin-specific education costs that are not related to schools,e.g. the opportunity cost of a child labour in household or cost of additional languagecourses that are not equal/relevant for all ethnic groups, e.g. the mainstream population.Whereas b is an exogenous policy variable, z f is an endogenous decision variable ofhouseholds.
Following Tanaka et al. (2018), from equation (2) the utility-maximising educationquality, z f , chosen by household with f ethnical background, n number of children and yincome level can be expressed as:
z f =y f (1 − t)−
(γ f
c f n f
) 1α−1
(γ f
c f n f
) 1α−1
+ c f n f
(3)
According to equation (3), households with higher disposable income, y f (1 − t), orethnic groups with higher taste for education, γ f , will choose higher quality educationthat is more expensive. In contrast, households with more children, n f , or facing higheropportunity costs of sending children to school, c f , will choose relatively lower qualityeducation that is less expensive.
This adopted education modelling framework of Tanaka et al. (2018) allows us tocapture fundamental education differences between Roma and non-Roma in the fiveCEE study countries. On average, Roma households have lower level of income andmore children than non-Roma households (see Ciaian and Kancs 2018). According to theFRA / European Commission’s 2011 survey data, Roma children have lower educationalattainment compared to non-Roma children both in terms of quality and quantity. Third,the education demand of Roma households is decreasing in opportunity costs e.g. ofthe child labour in household. In contrast, higher preference for education of non-Romahouseholds contributes to higher educational outcomes. Further, the quality of educationpositively affects the returns to education. According to Castelló-Climent and Hidalgo-Cabrillana (2012), there are increasing marginal returns to the education quality. Hence,a further implicit result of the model is that those households that choose lower qualityschools will have lower marginal returns to education and vice versa.
20

3.3. Labour markets
Households own production factors – capital and labour – which they rent to firms.Labour is disaggregated according to skill levels into three categories: low-skill (primaryand lower secondary education, ISCED 0-2); medium-skill (upper-secondary and post-secondary education ISCED 3-4); and high-skill: (tertiary education, ISCED 5-6). Net wagedifferences between low-, medium- and high-skill workers together with employmentprobabilities determine the share of low-, medium- and high-skill workers in each countryin the long-run.
The labour market is represented by a downward sloping labour demand curveand a wage curve determining the relationship between wage and unemployment. Theslope and position of each curve is skill-specific, implying that also the wage rate andemployment are differentiated between the low-, medium- and high-skill labour. In orderto account for the ethnically split labour market widely observed in the CEE (Ciaian andKancs 2016), we follow (Bonacich 1975) and further introduce two types of parallel labourmarkets – Roma and non-Roma (see Kancs and Lecca 2018, for details). According toBonacich (1975), there may be several reasons for the existence of a split labour market:(i) discrimination from the mainstream population, (ii) differences and the quality ofeducation and/or professional qualifications; (iii) differences in worker preferences(e.g. reservation wage), etc. In our model, the split labour market is country-specific, itdepends on differences in the education quality between Roma and non-Roma. Accordingto the data that we use to calibrate the model, the larger is the education quality gap(measured by national test scores of schools with predominantly Roma children andpredominantly non-Roma children), the larger are wage differences for a comparablework between the two parts of the split labour market. On the labour demand side,the two types of workers are substitutable (though not perfectly), implying that eachmainstream economy’s firm can hire either Roma workers or non-Roma workers for theproduction of goods and services.
4. Scenario construction
4.1. Baseline and setup
In order to undertake a comparative scenario analysis and assess impacts of selectedRoma integration policies in the five CEE countries, first, a baseline scenario is constructedand simulated. Alternative policy scenarios will be measured against this baseline. Inthe context of the European Roma, one of the key assumptions regards the future Roma
21

population growth. As detailed in Ciaian and Kancs 2018, Roma is one of the fastestgrowing population groups in Europe. In order to account for this fact, we use Eurostat’spopulation projections for the general population, which provide ‘what-if ’ scenarios aboutthe likely future size and structure of population groups, based on assumptions aboutfertility, mortality and migration (Eurostat, proj_15npms). We complement Eurostat datawith FRA / European Commission’s 2011 survey data for Roma to derive projectionsabout the future Roma population growth the rate of which, as detailed in Ciaian andKancs 2018, is considerably higher than that of the mainstream population.
Second, alternative integration (counterfactual) scenarios for the marginalised Romainclusion are constructed and simulated. In the designed alternative integration policyscenarios, the education and labour market outcomes of Roma depend on implementedRoma integration policies. Together with marginalised community inclusion policymakers and Roma experts in the five studied countries and the European Commission,we have designed two Roma integration scenarios that could be useful for better under-standing of the potential magnitude and distribution of economic, budgetary and fiscalcosts and benefits of policy options regarding the Roma integration:16
• Policy Status Quo scenario;
• Universal Basic Income scenario.17
The policy status quo scenario is based on estimates of actual current/future policyexpenditure data, in which already allocated and/or foreseen Roma integration policyexpenditures serve a starting point. Subsequently, improvements in the Roma educationaland labour market outcomes are projected, and finally using the model economic,budgetary and fiscal effects simulated.
Most of Roma integration policies currently implemented in the EU and simulatedin the policy status quo scenario aim at expanding the supply of social and economicservices (both availability and quality) by improving the education, health and other socio-economic infrastructure. Whereas supply-side policies may be effective in increasing thesupply of educational services, according to OECD (2017) they do not always lead to the
16Main ideas and key inputs for the Roma integration scenario construction were crystallised at theEuropean Commission’s workshop on Roma communities in Europe "Taking stock of current science-basedknowledge and what is needed for effective policy development".
17A universal basic income, also referred to as a guaranteed minimum income or income guarantee, is acash transfer that everyone within a geographic territory or social community receives on a regular basiswith no conditions on a long-term basis (Thigpen 2016).
22

desired uptake and use of these services. The European Court of Auditors has voicedsimilar concerns in its special report on EU policy initiatives and financial support forRoma integration (ECA 2016). Even when costs for these services are kept low or evenfree, nevertheless, supply-side policies often fail to satisfactory increase the use of theseservices (de Janvry and Sadoulet 2004; Bassett 2008; World Bank 2010).
In order to address deficiencies of supply-side policies, the use of direct cash transfersis becoming more and more popular in many countries (both developing and developed),as they can more effectively help to overcome liquidity constraints preventing the use ofsupplied public services by poor/marginalised households and are less costly in termsof their implementation (Tabor 2002; OECD 2017). The idea of direct cash transfersis not new, it is rooted in the neoclassical economics, according to which individualsmake rational decisions to maximise their own wellbeing by taking into considerationbenefits and costs associated with each decision. When liquidity constrained householdsreceive cash transfers, their cost-benefit considerations change, which in turn affecttheir decision-making calculus. For example, a direct income transfer can reduce thehousehold opportunity cost of sending children to school, making the benefits of theschooling & education decision outweigh the costs (de Janvry and Sadoulet 2004; Bassett2008).
The second scenario – universal basic income – is a hypothetical scenario, in whichwe analyse policy impacts under ’what would happen if’ assumptions. In particular,we assess economic, budgetary and fiscal effects by assuming that the same amount ofRoma policy expenditure as under the policy status quo scenario would be disbursedin form of direct cash transfers. The analysis investigates the impact of direct cashtransfers but it does not call for such transfers to be targeting only Roma. To the contrary,they might be more cost-efficient tool for addressing the multiple poverty, deprivationand discrimination any other group at risk of marginalisation faces, as previous studiessuggest (see section 5.3).
Three types of assumptions need to be made when constructing Roma integrationscenarios: the magnitude and distribution of policy costs (section 4.2); associated im-provements in the educational attainment (section 4.3); policy-induced improvements inlabour market outcomes (section 4.4); and policy financing sources and methods (section4.5).
23

4.2. Policy costs
We can distinguish between two types of education and training programs andtheir related costs in the policy status quo scenario. (i) Roma-specific education andtraining programs. Costs of these programs include, for example, teacher salariesand school buildings for Roma children. (ii) Education programs for children from asocially disadvantaged environment in general. Costs of these programs include, forexample, equipment in classrooms designated for the instruction of children from sociallydisadvantaged environments through the use of special teaching aids, didactic mediaand teaching technology.
Roma-specific education and training programs cover policy initiatives that are de-signed and implemented specifically for Roma. These costs (per child) differ substantiallybetween the five studied countries. In counterfactual policy scenarios, these costs arealso identified by the educational attainment level, wherever possible. Costs of othereducation and training programs, which cannot be associated to children from a par-ticular educational attainment level as main beneficiaries, are assumed to incur to alleducational attainment levels (primary, secondary and tertiary) proportionally.
Education assistance programs for children from socially disadvantaged environmentsinclude, among others, children from marginalised Roma families. Per child costs ofthese programs differ significantly between the five studied countries. However, in oursimulations they are not specific to a particular educational attainment level, as many ofeducation assistance programs for children from socially disadvantaged environments,e.g. the early childhood development and pre-school education, are beneficial for childrenfrom all educational attainment levels (primary, secondary and tertiary).
An overview of total Roma integration policy cost estimates in the policy status quoscenario in each of the five studied countries during 2014-2020 is provided in Table1. The expenditure estimates reported in Table 1 suggest that, in terms of the totalfunding, the marginalised Roma community in Romania (721.82 million Euro) followedby Hungary (675.70 million Euro) would be the largest beneficiaries of those Romaintegration policies that are analysed in the present study.18 The total funding madeavailable for Roma integration policy measures that we simulate in counterfactual policyscenarios is considerably lower in Bulgaria (254.35 million Euro), the Czech Republic(276.48 million Euro) and Slovakia (272.72 million Euro).
18Note that these selected funds do not correspond to entire policy expenditures on Roma integration inthe five studied EU countries.
24

Table 1: Policy costs: yearly amounts made available under selected national, EU and internationalmeasures for the Roma integration in the five study countries during 2014-2020
Bulgaria Czechia Hungary Romania SlovakiaMillion Euro2014 36.05 39.33 98.67 102.81 41.082015 36.57 40.14 94.31 106.04 40.832016 37.72 38.49 98.65 103.03 37.932017 35.48 39.76 98.05 100.86 39.382018 36.68 39.05 93.57 98.54 39.382019 35.63 39.66 95.25 106.43 37.422020 36.23 40.06 97.21 104.11 36.69Total 254.35 276.48 675.70 721.82 272.72Percent of GDP2014 0.090 0.026 0.101 0.073 0.0572015 0.092 0.027 0.096 0.075 0.0572016 0.095 0.026 0.101 0.073 0.0532017 0.089 0.027 0.100 0.071 0.0552018 0.092 0.026 0.096 0.070 0.0552019 0.089 0.027 0.097 0.075 0.0522020 0.091 0.027 0.099 0.074 0.051Average 0.091 0.026 0.099 0.073 0.054
Source: Authors’ estimates based on national Roma integration authorities; European Commission (2017) and Roma Education
Fund (2017).
For the sake of comparability between the two policy scenarios, in the universal basicincome scenario we assume that the same total amounts of the Roma integration fundingare made available to Roma in each of the five studied countries as under the policy statusquo scenario (Table 1). The key difference between the two policy scenarios is that in theuniversal basic income scenario these funds are disbursed directly to marginalised Romahouseholds. Specifically, we assume that direct cash transfers are disbursed withoutcoupling them to any spending condition.19 Being administratively simple, low-cost andfundamentally market neutral, unconditional cash transfers do not introduce any market
19In sensitivity analyses we also explore a potential value added of conditional cash transfers. For thatpurpose, we construct an additional sub-scenario where cash transfers to Roma households are conditionedon the children school attendance. In order to account for costs associated with verifying and imposingthe compliance with transfer conditionalities, we follow Caldes et al. (2006) and assume that policyimplementation and verification costs burn 24 percent of total policy expenditures in the conditional cashtransfer scenario.
25

Education costs
Private costs of education
Public costs of education
Direct costs Indirect costs
Tuition & other school fees,
uniforms, books, transportation, …
Opportunity costs (child work in household),
informal institutions (Romaniya), …
Variable costs Fixed costs
Personnel (teachers, administrative staff),
non-personnel (textbooks, utilities, maintenance) , …
Capital costs (buildings, land,
equipment, furniture), …
Education policies:demand-side
Education policies: supply-side
Figure 6: Education costs: public versus private. Source: Based on Tsang (1988).
distortions (Standing 2007).As shown in Figure 6, education costs consist of two parts: private and public (Tsang
1988; Mehrotra et al. 1996). Both types of education costs are captured explicitly in theunderlying model. Whereas education demand-side policies attempt to reduce mainlyprivate education costs (see right panel of Figure 6), education supply-side policies arerelated mainly to public education costs (see left panel of Figure 6).
4.3. Policy impact on education
We can distinguish between policy-induced improvements in educational outcomesand improvements in labour market outcomes. As regards educational outcomes, theirimpact depends on policy implementation details (parameter α in equation (1) andvariable b in equation (2)) and also on a number of household-specific factors, which inthe underlying model are captured through decision variables (variable ze in equation(2)). Two important elasticities governing the policy impact on the Roma education arethe income elasticity of demand for education and the price elasticity of demand foreducation.
According to the previous literature (Dur and Teulings 2003), an important determi-
26

nant of the education policy impact is the price elasticity of demand for education. Amongothers, the elasticity of demand for education with respect to the schooling cost deter-mines the effectiveness of supply-side education policies in increasing the stock of thehuman capital through education. Households choose their demand for education suchthat the marginal return to education is equal to its cost. A supply-side education policyreduces the education cost and hence also the marginal return. The larger is the elasticityof demand for schooling with respect to its cost, the lower is the amount of a policyintervention that is required for a given increase in the mean level of the human capital,and hence the smaller is the adverse effect on the income distribution. The sensitivity ofdemand for education to supply-side education policies is particularly important, whenthe innate ability of individuals and the education demand are complementary. Thebaseline value of this elasticity is adopted from Campbell and Siegel (1967) and is set to-0.44. In sensitivity analyses we explore the impact in 5% steps of up to 50% lower/higherelasticities (see section 5.2).
As regards the income elasticity of demand for education, generally, the previous literaturesuggests positive relationship, implying that an increase in the household income resultsin higher demand for education (Becker 1990). However, the relationship between theeducation demand and household income is complex and non-linear, as the demand foreducation depends among others on household preferences and budget constraints facedby (marginalised) households, both in turn being influenced by the household income.For example, given the labour-supply potential of children in poor households, higherhousehold income decreases (lower income increases) – as in the universal basic incomescenario – the opportunity cost of sending children to school. Overall, an increase in thehousehold income is expected to positively influence schooling decisions, particularly ofpoor households. Also the baseline value of this elasticity is adopted from Campbell andSiegel (1967) and is set to 1.20. In sensitivity analyses we explore the impact in 5% stepsof up to 50% lower/higher elasticities (see section 5.2).
In line with the previous literature (Tsang 1988), we assume that Roma policiesimplemented through the policy status quo scenario function primarily through loweringcosts, by covering e.g. personnel costs such as teachers and administrative staff, non-personnel costs such as textbooks, utilities and the school maintenance, as well as capitalcosts such as buildings, land, equipment and furniture and hence increasing the supplyof educational services (see the right panel of Figure 6 as captured by parameter α inequation (1) and variable b in equation (2)). Building new schools/classes in a close
27

proximity to Roma communities, reduces the cost of accessing educational services. Thisreduction however risks contributing to the segregation of Roma children in educationdiluting the potential benefits from reduced costs through a sub-standard quality ofeducation services provided and underdeveloped social skills necessary for a sustainableintegration of children in the mainstream society after completing education. Similarly,training teachers to new integrated education methods increases the accessibility ofeducation for Roma children (Kertesi and Kezdi 2011). Hence, educational outcomesin the policy status quo scenario will depend primarily on the price elasticity of thehousehold demand for education as well as on the implementation of policy measuresto offset the potential negative implications of focused interventions (e.g. through anincreased segregation).
In line with the previous evidence (Aizer et al. 2016; Nikiforos et al. 2017; Marinescu2017), we further assume that Roma policies implemented through the universal basicincome scenario function primarily through increasing the household income and henceprovide additional financial resources to households for lowering e.g. opportunity costsof a child work in household, covering tuition and other school fees, uniforms, books andtransportation costs (see the left panel of Figure 6 as captured by variable ze in equation(2)) resulting in higher demand for education. Increasing a household income that isnot related to household economic activities may also optimise consumption/investmentdecisions, resulting in more efficient allocation of household resources, including educa-tion. Hence, educational outcomes in the universal basic income scenario will dependprimarily on the income elasticity of the household demand for education. Finally, theuniversal basic income scenario has important empowerment implications reinforcing theagency of marginalised populations that are difficult to factor in the model but should bekept in mind when interpreting simulation results.
Differences in the channels of adjustment (reducing public versus private educationcosts) and in values between the income elasticity and price elasticity of demand foreducation will result in different educational outcomes between the policy status quo anduniversal basic income scenarios. In line with Roma policy expenditure data discussedin the previous section, we assume that Roma education-related policy expendituresimprove children educational attainment rates in all three levels (primary, secondaryand tertiary). Further, we also assume that the quality of education improves, whichwill reduce the Roma / non-Roma labour market segregation. Note that there will beimportant differences in educational outcomes (in terms of policy-induced improvements
28

in the education quality and quantity) between the two simulated policy scenarios.
4.4. Labour market outcomes
As regards policy-induced improvements in labour market outcomes, in line with theempirical evidence (e.g. O’Higgins and Ivanov 2006; O’Higgins 2012), in both scenarioshigher educational attainment rates and higher education quality of Roma children resultin better labour market outcomes of Roma – employment and earnings – increase. Inorder to link policy expenditures on the Roma education to labour market outcomes (i.e.the employment rate and wage rate) in both the policy status quo and universal basic incomescenarios, we base our estimates on European Commission’s 2017 data, according towhich there are substantial differences in unemployment rates between those Roma whohave completed a tertiary education, secondary, primary or have less than the primaryeducation. On average, in the five studied countries, respective unemployment rates are29%, 38%, 55% and 81%. These figures are comparable to those reported in O’Higginsand Ivanov (2006) for Roma in nine CEE countries. Note that in both scenarios we assumethe same relationship between policy-induced improvements in educational outcomesand labour market outcomes. Hence, an equivalent increase in the educational attainmentin the policy status quo and universal basic income scenarios will result in an equal increasein the employment probability and wage rate.20
Key assumptions linking policy-induced improvements in educational attainmentrates and higher education quality and labour market outcomes of Roma – employmentand earnings – are summarised in Table 2. As shown in the Table, one extra year ofschooling has higher impact on the Roma unemployment than earnings. The opposite istrue for the increase in test scores by one standard deviation. For comparison, in Table2 we have also provided the estimated impact of marginal labour market effects of oneextra year of schooling and one standard deviation increase in test scores on employmentand earnings for the USA, Canada, UK and OECD countries.
4.5. Policy financing methods and sources
In the policy status quo scenario, we simulate impacts of selected national government,EU and internationally funded programmes of the Roma inclusion. Nationally fundedRoma integration programs simulated in the present study include both Roma-specific
20We are aware of the significant role of the quality of education (the breadth and depth of knowledgeacquired). We assume however that quality remains the same under both scenarios.
29

Table 2: Scenario construction: Marginal labour market effects
Education quantity channel Education quality channelEffect on: One extra year of schooling One s.d. higher test scoresUnemploymentPolicy status quo -13.3% -2.5%Universal basic income -13.3% -2.5%Previous studies
USA -40.6%Canada -21.0%UK -18.2%OECD -1.4%
EarningsPolicy status quo 6.1% +3.3%Universal basic income 6.1% +3.3%Previous studies
USA +15.7%Canada +13.8%UK +7.3%OECD +2.0%
Source: Authors’ estimates based on European Commission (2017): Roma integration indicators scoreboard (2011-2016), SWD(2017)
286 final. Notes: s.d. denotes standard deviation, estimates for the USA, Canada and UK based on Oreopoulos (2007), estimates for
OECD countries based on Hanushek and Woessmann (2007).
programs as well as general programs for marginalised society groups from which Romabenefit, e.g. programs for children from a socially disadvantaged environment. As forEU funds, we have selected the European Structural and Investment Funds (ESIF), whichprovide allocations to Roma under the investment priority ‘Integration of marginalisedcommunities such as the Roma’ for the 2014-2020 programming period. As for theinternational funding of the Roma integration, we have chosen programmes managed bythe Rome Education Fund, which include allocations to the Roma education under theheading ’Programs and Grants’.
Table 3 provides an overview of the total funding made available under national,EU and international financing tools for the Roma integration simulated in the presentstudy during 2014-2020, by the source of funding. The expenditure estimates reportedin Table 3 suggest that, from those Roma integration funds considered in the presentstudy, the ESIF make available the largest funding (1284.00 million Euro), followed bynational Roma integration programmes (881.94 million Euro) and the Roma Education
30

Table 3: Total amounts made available under selected national, EU and international measures for theRoma integration during 2014-2020 by the source of funding, million Euro
Bulgaria Czechia Hungary Romania Slovakia AverageNational Funding 104.84 74.03 197.19 334.36 171.52 176.39ESIF 143.00 200.00 470.00 372.00 99.00 256.80Roma Education Fund 6.52 2.45 8.51 15.46 2.20 7.03Total 254.35 276.48 675.70 721.82 272.72 440.21
Source: Authors’ estimates based on national Roma integration authorities; European Commission (2017) and Roma Education
Fund (2017). Notes: The national funding includes selected Roma-targeted measures and general programmes for marginalised
society groups; the ESIF includes European Structural and Investment Funds investment priority 9(ii) ’Integration of marginalised
communities such as the Roma’; the Roma Education Fund includes all investment in the Roma education listed under ’Total
Programs and Grants’.
Fund (35.13 million Euro).21
For the sake of comparability between the two policy scenarios, in the universal basicincome scenario we assume not only the same total amounts in each country but also thesame funding sources as under the policy status quo scenario.
Important for both scenarios is that in the general equilibrium framework adopted inthe present study all expenditures have to be covered through an additional governmentrevenue (or an equivalent reduction in the existing government expenditure), either at thenational, EU or international level. Note, however, that there are important differencesbetween the three financing sources of Roma integration programs, and these differencesare fully accounted for in our model. Whereas national Roma integration policies areentirely financed from respective Member State budgets, EU funds are financed by all EUtaxpayers. This implies that EU-level Roma integration programs are partially financed byother EU Member States, as the distribution of net contributing and receiving paymentsacross EU Member States according to the EU budgetary data (European Commission2017) is fully captured in the model. As regards internationally funded Roma inclusionprograms, such as the Roma Education Fund, their financing is not modelled explicitly,
21Note that for those Roma integration policies for which there is available information also aboutplanned expenditures in future we use these data. For example, the ESIF provide allocations to EUMember States under the investment priority ‘Integration of marginalised communities such as the Roma’for the entire 2014-2020(+3) programming period. For other programs, for which no expenditure dataabout future Roma integration programs are available year-by-year for 2014-2020, e.g. national Romaintegration programmes and the Roma Education Fund, we use average expenditures from the last threeyears (2014-2016) also for the remaining period (2017-2020).
31

they are considered as pure financial transfers from the rest of the world.
5. Simulation results
5.1. Main results
Aggregated simulation results are reported in Figure 7, where we plot the percentagedeviation in the GDP from baseline values for the two alternative Roma integrationscenarios (policy status quo and universal basic income) for the five studied countries(Bulgaria, the Czech Republic, Hungary, Romania and Slovakia) for the 2014-2040 pe-riod.22 Whereas the solid and dashed lines denote GDP impacts of the policy status quoand universal basic income scenarios, respectively, bars represent policy costs as a shareof the GDP. Note that bars correspond to figures reported in Tables 1 and 3. For the sakeof comparability, both policy costs and impacts are plotted on the same scale – as percentof the GDP – and hence are directly comparable.
Generally, our simulation results suggest that in the first years of the policy implemen-tation policy costs (bars in Figure 7) would be higher than the GDP growth generatedthrough Roma integration in labour markets. Second, in the medium- to long-run bothtypes of Roma integration policies would have positive and significant impact on the GDP(solid and dashed lines in Figure 7) (in addition to likely positive humanitarian and othernon-economic effects, which are not considered here). However, there are remarkabledifferences in terms of the economic impact between the five studied countries, the twoRoma integration scenarios and the time period considered.
From the very first year of the integration policy implementation, the positive impacton the GDP increases continuously in all five studied countries. The policy-induced GDPgrowth reaches its peak in 7-10 years, after which is starts to decline. It is not surprisingto observe a declining impact on the GDP, as in our simulations the Roma policy fundingstops after 2020(+3). Depending on the policy scenario and country, the policy-inducedlong-run growth path stabilises at around 0.01 % to 0.10 % above the baseline growth(see Figure 7). While all five countries share a similar short-run dynamics, differencesin the GDP impact between countries become more visible when, because of the Romaintegration, the labour force and hence economies expand.
The result that the medium-term impact on the GDP is larger than the long-runeffect is due to the fact that the simulated Roma integration policy measures imply a
22We are aware also of the positive non-monetary implications of integration policies. We assumehowever that these are correlated with the GDP impact that can be quantified.
32

0.0
3.0
6.0
9.1
2.1
5
2015 2020 2025 2030 2035 2040
Bulgaria
0.0
3.0
6.0
9.1
2.1
5
2015 2020 2025 2030 2035 2040
Czech Republic
0.0
3.0
6.0
9.1
2.1
5
2015 2020 2025 2030 2035 2040
Hungary
0.0
3.0
6.0
9.1
2.1
52015 2020 2025 2030 2035 2040
Romania
0.0
3.0
6.0
9.1
2.1
5
2015 2020 2025 2030 2035 2040
Slovakia
Lower/upper bounds
Policy Status Quo Univ Basic Income
Policy costs
Figure 7: The simulated impact on the GDP and policy costs in percent of the GDP in the five studiedcountries under the Policy Status Quo and Universal Basic Income scenarios. Source: Authors’ simulations.Notes: Y axis: percent of the GDP; X axis: years. See section 5.2 for lower/upper bounds.
combination of one short-run demand-side shock and one long-run supply-side shock. Inthe short- to medium-run, on the demand side there is an increase in current governmentexpenditures related to policy costs of the Roma integration into the labour market andthe corresponding reduction in the disposable household income (due to lower transfers/ higher taxes). The latter effect arises, because we account for the fact that all integrationpolicy costs are fully financed by EU Member States.23 On the supply-side the integrationof Roma into labour markets increases the labour supply in EU Member States in themedium- to long-run. As detailed in section 4, the increase in the labour force is Member
23We believe that by assuming that integration policy costs could be financed through a governmentborrowing could bias the interpretation of simulation results. For example, more integration policyexpenditures could be always better than less, if associated policy costs were not borne by economic agentsthrough appropriate financing mechanisms. Therefore, we assume that all Roma integration policies arefully financed by households in the form of a reduction in government transfers to the household incomeor, equivalently, an increase in income taxes.
33

State-, skill- and year-specific, and differs between the two Roma integration policyscenarios. Peak in the policy-induced GDP growth is reached after 7-10 years, when thedemand-side shock is still present and in addition also the supply-side shock alreadymaterialises.
The integration policy-induced growth rate of the GDP is comparably high in all fivestudied countries in the short-run. It is a remarkable result in light of the negligible shareof the Roma population in the total labour force (see first years in Figure 7). According toour simulation results, in the short-run, the strongest positive GDP effect can be expectedin Romania, followed by the Czech Republic and Bulgaria. The lowest short-run GDPgrowth rate can be expected in Hungary. In the medium-run, as more educated andtrained Roma workers enter the labour market, all five economies continue to expand,though the marginal effect is decreasing.
After a transitionary dynamics, GDP growth rates reach a new steady state above thebaseline growth path of the GDP. In terms of the GDP level, under the universal basicincome scenario expected policy-induced deviations above the base line are significantlylarger in the long-run than in the short-run, which is consistent for all five studiedcountries. This however, is not true under the policy status quo scenario, implying thatpolicy demand-side effects are stronger than policy supply-side effects in the medium- tolong-run.
Comparing GDP impacts between the two Roma integration scenarios, we can noticethat in the short-run the policy status quo scenario generates more economic activities,resulting in higher GDP effects compared to the universal basic income scenario (seeFigure 7). In the medium- to long-run (starting from year 5), however, the policy-inducedGDP growth generated under the universal basic income scenario becomes larger thanunder the policy status quo scenario. It is also interesting to notice that in all five studiedcountries the GDP reaches the highest impact earlier under the policy status quo scenariothan under the universal basic income scenario (2020-2021 and 2023-2024, respectively).This result is in line with previous studies on assessing impacts of the universal basicincome, which find that conditioning a public policy support to marginalised societygroups can sooner produce higher impact in terms of GDP, income and employment(Akee et al. 2010; Butcher 2017; Colombino 2015; Hum and Simpson 1993; Kela 2016;Nikiforos et al. 2017; Pareliussen et al. 2018). In the medium- to long-run, however, thepositive effect remains below that of universal basic income policies.
Turning to country-specific results, we notice that Hungary, followed by Bulgaria, has
34
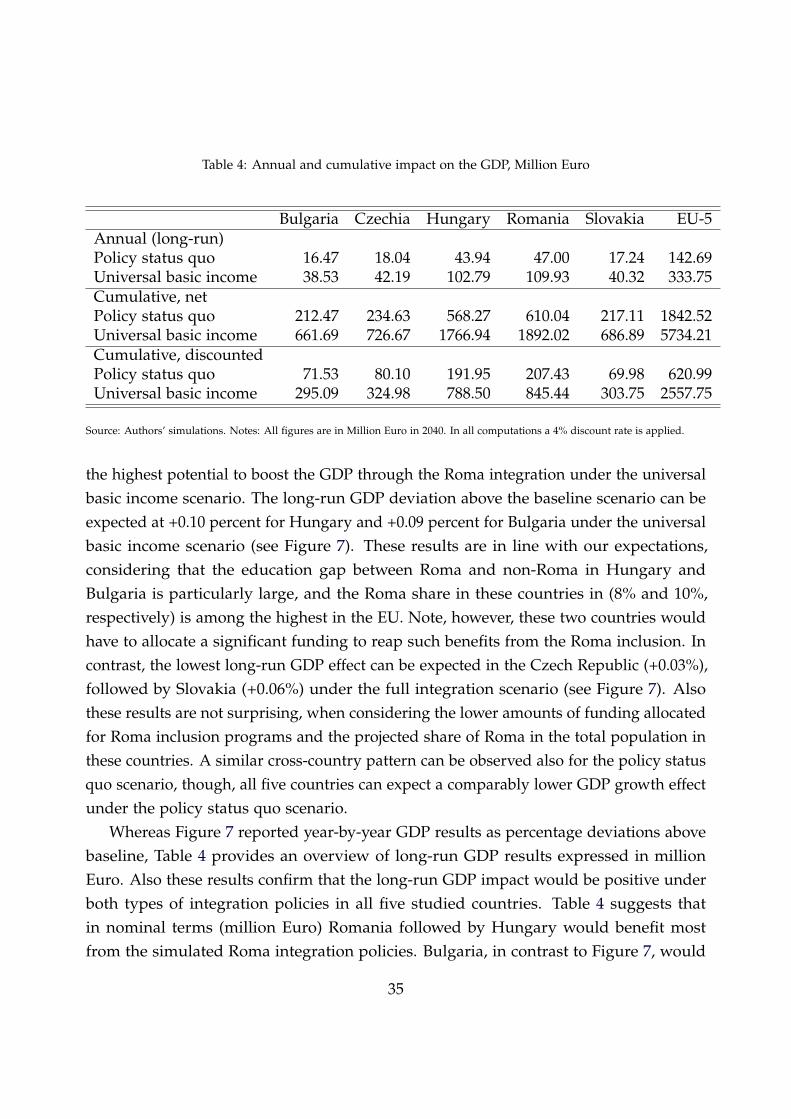
Table 4: Annual and cumulative impact on the GDP, Million Euro
Bulgaria Czechia Hungary Romania Slovakia EU-5Annual (long-run)Policy status quo 16.47 18.04 43.94 47.00 17.24 142.69Universal basic income 38.53 42.19 102.79 109.93 40.32 333.75Cumulative, netPolicy status quo 212.47 234.63 568.27 610.04 217.11 1842.52Universal basic income 661.69 726.67 1766.94 1892.02 686.89 5734.21Cumulative, discountedPolicy status quo 71.53 80.10 191.95 207.43 69.98 620.99Universal basic income 295.09 324.98 788.50 845.44 303.75 2557.75
Source: Authors’ simulations. Notes: All figures are in Million Euro in 2040. In all computations a 4% discount rate is applied.
the highest potential to boost the GDP through the Roma integration under the universalbasic income scenario. The long-run GDP deviation above the baseline scenario can beexpected at +0.10 percent for Hungary and +0.09 percent for Bulgaria under the universalbasic income scenario (see Figure 7). These results are in line with our expectations,considering that the education gap between Roma and non-Roma in Hungary andBulgaria is particularly large, and the Roma share in these countries in (8% and 10%,respectively) is among the highest in the EU. Note, however, these two countries wouldhave to allocate a significant funding to reap such benefits from the Roma inclusion. Incontrast, the lowest long-run GDP effect can be expected in the Czech Republic (+0.03%),followed by Slovakia (+0.06%) under the full integration scenario (see Figure 7). Alsothese results are not surprising, when considering the lower amounts of funding allocatedfor Roma inclusion programs and the projected share of Roma in the total population inthese countries. A similar cross-country pattern can be observed also for the policy statusquo scenario, though, all five countries can expect a comparably lower GDP growth effectunder the policy status quo scenario.
Whereas Figure 7 reported year-by-year GDP results as percentage deviations abovebaseline, Table 4 provides an overview of long-run GDP results expressed in millionEuro. Also these results confirm that the long-run GDP impact would be positive underboth types of integration policies in all five studied countries. Table 4 suggests thatin nominal terms (million Euro) Romania followed by Hungary would benefit mostfrom the simulated Roma integration policies. Bulgaria, in contrast to Figure 7, would
35

benefit the least, as in these computations the size of economies plays a role as well.According to Table 4, the positive GDP effects generated under the universal basic incomescenario are considerably larger than under the policy status quo scenario (as alreadyseen in Figure 7). Aggregated for the five studied countries, annually, the universal basicincome scenario would generate more that two times higher GDP impact than the policystatus quo scenario: 142.69 and 333.75 million Euro, respectively (last column in Table 4).Cumulatively, the difference in the discounted net GDP effect is even larger: by 2040 theuniversal basic income scenario would have generated almost 2 billion more GDP thanthe policy status quo scenario (2557.75 and 620.99 million Euro, respectively).
Finally, the general equilibrium nature of the model allows us to identify policyleakages to non-targeted groups/expenditures of Roma integration policies. According toour simulation results, the main source of a potential policy leakage in the policy statusquo scenario is the inter-household competition for additional / less costly educationservices stemming from non-Roma households. Between 16.9% and 47.1% of Romaintegration policy expenditures end up in non-Roma households in the five studycountries. In the universal basic income scenario, the main source of a potential policyleakage is the intra-household competition for additional financial resources from other(non-education) expenditures of Roma households. Between 24.3% and 55.8% of Romaintegration policy expenditures result in non-education expenditures of Roma households.These two sources of potential policy leakages need to be kept in mind when designingand implementing Roma integration policies in the EU.
As next, we investigate whether and to what extent the costs associated with Romaintegration policies would be offset by positive economic, budgetary and fiscal benefitsgenerated from the increase in workforce in the long-run. To identify relative policybenefits, we compute the net present value (NPV) associated with each integrationscenario until 2040, as it should provide an idea of the time in which the economy isable to fully absorb the exogenous demand shock. The NPV is calculated as a differencebetween the discounted present value of the policy-induced GDP growth above baselinevalues and the discounted present value of government expenditures. Following the EUBetter regulation guidelines,24 the discount rate applied in these calculations is equalto 0.04.25 NPV results for the five studied countries for both scenarios are reported inFigure 8.
24https://ec.europa.eu/info/better-regulation-guidelines-and-toolbox_en25In order to assess differences in the simulated policy impact under alternative discount rates, we
36

−10
0−
500
5010
0
2015 2020 2025 2030 2035 2040
Bulgaria
−10
0−
500
5010
0
2015 2020 2025 2030 2035 2040
Czechia
−10
0−
500
5010
0
2015 2020 2025 2030 2035 2040
Hungary
−10
0−
500
5010
02015 2020 2025 2030 2035 2040
Romania
−10
0−
500
5010
0
2015 2020 2025 2030 2035 2040
Slovakia
Policy Status Quo
Universal Basic Income
Figure 8: Net present value, Million Euro. Source: Authors’ simulations. Notes: In all computations a4% discount rate is applied. Shaded areas around main NPV results represent 3% and 5% discount rates,respectively.
Results from NPV computations suggest that the NPV is negative in initial years butthen eventually becomes positive in the medium- to long-run (Figure 8). More importantis fact that the NPV becomes positive under both Roma integration scenarios. Dependingon the scenario and country of analysis, the full repayment of the integration policyinvestment (positive net present value) would be achieved after 7 to 9 years. Note thatthe NPV gives us the size of the (discounted) financial multiplier effect in each period.Hence, even if the NPV is negative in the short- to medium-run, not necessarily theoverall impact on the economy is negative. These results could simply imply that thefinancial multiplier effect is lower than one. Hence, our results suggest that, in orderto be able to gain from the full potential of the Roma integration in EU labour markets,
perform sensitivity analyses with 0.03 and 0.05 discount rates.
37

taxpayers should be prepared to accept certain costs in the short-run. Moreover, eventhese short-run disadvantages are associated with positive growth effects in all fivestudied countries (Figure 7).
Comparing the two alternative integration policy scenarios, we notice that in theshort-run the policy status quo scenario is associated with higher NPV. In the medium- tolong-run however, the generated benefits in terms of an additional GDP growth are higherunder the universal basic income scenario. In order to assess robustness of presentedsimulation results with respect to alternative discount rate assumptions, we performNPV computations with 1 percentage point lower/higher discount rates, the results ofwhich are reported as shaded areas around main NPV results (solid line for the policystatus quo scenario and dashed line for the universal basic income scenario) in Figure 8.These results suggest that there are no qualitative changes in the simulated NPV whenapplying different (+/- 1 percentage point) discount rates in a reasonable range.
5.2. Sensitivity analysis and robustness checks
In order to ensure that our simulation results are robust with respect to reasonablechanges in underlying parameter values and assumptions, we undertake a global sen-sitivity analysis of the parameterised model and the two Roma integration scenarios,selected results of which are presented in Figure 7. Given that the objective of the presentstudy is to simulate, assess and compare impacts of alternative Roma integration policies,those assumptions that govern the scenario construction are particularly critical for therobustness of our simulation results. Therefore, all these assumptions are scrutinisedextensively in sensitivity and uncertainty analyses.
Because of its prominent role, we report and discuss the results of the sensitivityanalysis obtained under alternative assumptions of the integration policy elasticities(the income elasticity of demand for education and the price elasticity of demandfor education, see section 4.3), as these assumptions have been identified among keydeterminants driving simulation results. In this exercise, we decrease and increase defaultpolicy elasticities by 5% to 50% (see Table 5), respectively, and compare model results withthose under our default assumptions. The main purpose of this exercise is to evaluatethe extent to which marginal changes in underlying model assumptions would alter thedirection and magnitude of the projected policy impacts reported in preceding sections.
The sensitivity analysis results for these two key parameters (the income elasticity ofdemand for education and the price elasticity of demand for education) are reported asshaded areas in Figure 7, which report the possible outcome range (lower/upper bounds)
38

Table 5: Values of income and price elasticities of demand for education used in the sensitivity analysis
Elasticities of demand for educationIncome elasticity Price elasticity
Lower value 0.60 -0.66Central value 1.20 -0.44Upper value 1.80 -0.22
Source: Education elasticity values based on Campbell and Siegel (1967).
identified in these simulations. For each scenario, we show a case where policy elasticitiesare reduced (lower), augmented (upper) and kept at their default (central) value.
Sensitivity analysis results reported in Figure 7 suggest that in both Roma integrationscenarios the short-run impact of altering policy elasticities in a reasonable range doesnot generate qualitatively different and statistically significant deviations in simulationresults. However, as the labour force expands and economies grow due to the integrationof Roma workers into labour markets, the impact of higher/lower policy elasticitiesrealises more prominently. In line with our expectations, by lowering policy elasticities,the simulated GDP impact is lower; whereas by increasing policy elasticities, the GDPimpact becomes larger. We do not observe, however, qualitative changes in simulationresults under alternative policy efficiency assumptions.
In addition to the above presented sensitivity analysis results, we have also performedfurther sensitivity analyses with respect to the Roma population growth in the fivestudied countries, key model assumptions and parameter values. Also these sensitivityanalysis results suggest that the underlying simulation model is robust with respect toqualitatively reasonable changes in baseline assumptions, key model assumptions andvalues of behavioural parameters. Hence, we may conclude that the results presented inthis study are robust and therefore can be made available for an evidence-based policysupport.
5.3. Comparison with previous studies
The results reported in previous two sections that unconditional income transfersto poor and marginalised households (as simulated under the universal basic incomescenario) have positive and a statistically significant impact on children education, adultearnings and employment and the GDP in the medium- to long-run, are supported by theprevious literature. Our main findings could be summarised by the words of Marinescu
39

(2018):
"Providing cash directly to individuals has often been met with criticism, suspicion,and fear: the thinking goes that people who need financial assistance are not to betrusted, as their financial position reflects a moral failing rather than a societal one.These objections to cash transfer programs are rooted more in myth than empiricalevidence."
Hum and Simpson (1993) review research from five universal basic income experi-ments in Canada and the United States. In order to make results for different uncon-ditional income transfer programs comparable, the authors account for differences inthe designs of policy experiments. The primary focus of Hum and Simpson (1993) isthe work-incentive issue, both nonstructural estimates of the experimental effects andelasticity estimates of structural labour-supply functions, though the authors also provideinitial estimates of nonstructural and structural models for the Canadian universal basicincome experiments. Hum and Simpson (1993) find only few adverse effects from theuniversal basic income. More importantly, those adverse effects found, such as the workresponse, were smaller than suggested by the economic theory.
Kertesi and Kézdi (2006) estimate the expected long-term budgetary benefits frominvesting into the Roma education in Hungary. The authors estimate the net benefit ofan extra investment (on top of the existing pre-school and primary school financing)that enables a young Roma to successfully complete secondary school. The resultsof Kertesi and Kézdi (2006) indicate that an investment that makes one young Romasuccessfully complete secondary school would yield significant direct long-term benefitsto the national budget. According to benchmark estimates discounted to age 4, the netpresent value of future benefits is about EUR 70 000 relative to the value the governmentwould collect on the representative Roma person in case if she had not continued herstudies after the primary school.
Akee et al. (2010) study the role of an exogenous increase in the household income dueto government transfers that are unrelated to household characteristics on children’s long-run outcomes. The authors look at households in which incomes have been increasedexogenously and permanently through a governmental transfer program without regardto the parental human capital, ability or other household characteristics. Akee et al.(2010) find that children in treated households have higher levels of education in theiryoung adulthood and lower incidence of criminality; though effects differ by the initial
40

household poverty status. On average, an unconditional income support of USD 4 000per year for the poorest households increases the educational attainment by one year atage 21.
Also Colombino (2015) finds that, if correctly designed and implemented, a guaranteedunconditional basic income might be an important policy innovation for redistributingthe gains from automation and globalisation, building a buffer against shocks andsystemic risks, and generating positive labour supply incentives among poor people.Colombino (2015) also notes that while an unconditional basic income policy is simpleand transparent with low administration costs, financing it might require higher taxes(which however is the case of any public policy).
Aizer et al. (2016) estimate the long-run impact of cash transfers to poor families onchildren’s educational attainment, nutritional status longevity and income in adulthood.To do so, the authors have collected individual-level administrative records of applicantsto the Mothers’ Pension program—the first government-sponsored welfare programin the US (1911-1935) —and matched them to census, WWII and death records. Theresults of Aizer et al. (2016) suggest that male children of accepted applicants lived oneyear longer than those of rejected mothers. Male children of accepted mothers receivedone-third more years of schooling, were less likely to be underweight, and had higherincome in adulthood than children of rejected mothers.
Butcher (2017) surveys the empirical literature on the long-run impact on childrenof unconditional cash transfers, food and nutrition programs, health care and healthinsurance and housing initiatives. Butcher (2017) finds a mounting and dramatic evidencethat transfers to low-income families early in children’s lives greatly manifest later intheir lives. These findings lead to conclude that children’s environment in the prenatal,neonatal, and early childhood periods can profoundly affect the capacities that childrendevelop. According to Butcher (2017), these capacities persist into adulthood, affectingearnings, health, and other life outcomes.
Nikiforos et al. (2017) examine three versions of unconditional cash transfers: USD 1000 a month to all adults, USD 500 a month to all adults, and a USD 250 a month childallowance. For each of the three versions, the authors assess the macroeconomic effectsof these transfers using two different financing plans - increasing the federal debt, orfully funding the increased spending with increased taxes on households. Nikiforos et al.(2017) find that the economy can not only withstand large increases in federal spending,but could also grow thanks to the stimulative effects of cash transfers on the economy.
41

Under the smallest spending scenario, USD 250 per month for each child, the GDP is0.79% larger than under the baseline forecast after eight years. The largest cash program– USD 1 000 for all adults annually – expands the economy by 12.56% over the baselineafter eight years. These macroeconomic model-based results are directly comparable toour results.
Kela (2018) is currently evaluating the guaranteed basic income experiment in Finland.During the basic income experiment that runs from 2017 to 2018 (2019), a total of 2 000unemployed persons between 25 and 58 years of age receive a monthly payment of EUR560, unconditionally and without means testing. The policy evaluation is being doneby comparing the treated group of 2 000 persons with a control group of about 173 000.The control group is made up of persons included in the target population who werenot selected for the study. The preliminary evidence suggests that there are positiveand significant differences in employment rates between those receiving and those notreceiving a guaranteed basic income.
Pareliussen et al. (2018) at the OECD compare the currently implemented Finland’sbenefit system with two benefit reform scenarios: a uniform benefit for all (“basic income”)and a universal tapering rule (“universal credit”). The policy scenarios are modelled withthe OECD TaxBen model and the TUJA micro-simulation model. Pareliussen et al. (2018)find that replacing current benefits with a universal basic income would improve workincentives for many poor households, though may be also associated with a redistributionof income. Merging working-age benefits with similar aims and coordinating theirtapering against earnings would on the other hand consistently improve work incentivesand transparency, while preserving or improving social protection.
Jones and Marinescu (2018) study the effects of universal and permanent cash trans-fers on the labour market. Using data from the Population Survey and a synthetic controlmethod, the authors show that the universal basic income had no adverse effect on em-ployment, and increased part-time work by 1.8 percentage points (17 percent). Althoughthe economic theory suggests that individual cash transfers may decrease the householdlabour supply, Jones and Marinescu (2018) interpret their results as evidence that generalequilibrium effects of widespread and permanent transfers tend to offset this effect, atleast on the extensive margin. Consistent with their results, Jones and Marinescu (2018)provide suggestive evidence that tradeable sectors experience employment reductions,while non-tradable sectors do not.
Marinescu (2018) explore how unconditional cash transfers affect the behaviour of
42

recipients in three major natural experiments in the USA. While the amounts dispersedand time periods were distinct in each policy experiment, each of them have providedmoney without setting conditions and without a means test. As regards education,Marinescu (2018) found that the school attendance, grades, and test scores for the childrenof negative income tax recipients were typically higher than the control population,especially for younger and poorer children. An additional USD 4 000 per year for thepoorest households in the casino dividend program increased educational attainment byone year. Further, the programs analysed suggest either no effect on the labour marketsupply or a slight reduction in work. Results, however, do not suggest that an averageworker will drop out of the labour force when provided with an unconditional cashtransfer, even when the transfer is large.
6. Conclusions
The present study undertakes a comparative analysis of long-term economic, bud-getary and fiscal costs and benefits of alternative Roma integration policies in the areas ofeducation and employment in five EU Member States with the largest share of the Romapopulation – Bulgaria, the Czech Republic, Hungary, Slovakia and Romania. We employa general equilibrium approach that allows us to assess not only the direct impact ofselected Roma integration policies but also to capture all induced feedback effects.
Our simulation results suggest that, although the Roma integration (e.g. by providingeducation assistance services and a targeted professional training) would be costly forthe public budget, in the medium- to long-run, economic, budgetary and fiscal benefitsmay significantly outweigh the short- to medium-run Roma integration costs. Second,the policy status quo scenario creates higher GDP growth in the short-run, whereas theuniversal basic income scenario is more beneficial in the medium- to long-run. Thesefindings do not provide any empirical evidence for the criticism, suspicion and fearassociated with policies that provide cash directly to individuals. Depending on theintegration policy scenario and the analysed country, the annual long-run GDP effectwould be from +16.47 Million Euro to +109.93 Million Euro above the baseline GDP,and the full repayment of the integration policy investment (positive net present value)would be achieved after 7 to 9 years. Finally, our results suggest that there would be nodisplacement effects to mainstream worker employment/wages. In contrast, by fillingvacancies, the Roma workers included in the labour market would generate an additionaleconomic activity, which in turn would contribute to the growth of the GDP, exports,
43

public tax revenue, etc.Our results have important policy messages. First, these findings suggest that invest-
ing into integration policies that facilitate the inclusion of Roma into the school educationand labour markets is important not only for ethical, humanitarian and fundamentalrights reasons, but may be beneficial also for economic, budgetary and fiscal reasons inthe medium- to long-run. Second, we show that integrated Roma workers can play animportant role in filling vacancies with specific skill requirements, addressing Europe’salarming demographic challenges, improving the ratio of economically active to thosewho are inactive – a ratio that is decreasing in many Member States – and boost jobs andgrowth in the EU. In terms of the GDP, employment and earnings, the universal basicincome scenario clearly outperforms currently implemented Roma integration policies,particularly in the medium- to long-run.
Turning to limitations of our study, we recognise that in the presented analysis wehave focused solely on socio-economic impacts (both costs and benefits) of the Romaintegration. In reality, however, there are many more aspects, such as humanitarian,fairness, equality and fundamental rights, etc., which all need to be taken into account bypolicy makers, when designing Roma integration policies. Analysing all these aspectsin an integrated framework comprises a promising though also challenging avenuefor the future research. Second, our simulation results depend on a large numberof assumptions that yield uncertainties both in the scenario construction and in theunderlying simulation model. While, we have been using the best data available to date,have attempted to be as transparent as possible about all key assumptions underlyingour simulations and have been running extensive sensitivity and uncertainty analysis totest the simulation result sensitivity with respect to them, the robustness of presentedfindings would benefit significantly from complementary micro-econometric analysis(e.g. econometric estimation of the household demand for education), which invitesfor a follow-up research on Roma integration policies in future. Third, in the presentstudy we have focused on the main channels of household adjustment to policies shocks.A promising area for the future research would be, for example, to endogenise thenumber of children per household (by household type), and consequently also the costof education.
Finally, the analysis conducted on the specific group (Roma) might be expanded toother groups vulnerable to discrimination and social exclusion. Although, we intuitivelyexpect unconditional cash transfers under a basic minimum income schemes to yield
44

similar results for other vulnerable groups, additional research is required to generate asound evidence in this regard.
7. References
[1] Achim, V. (2004). The Roma in Romanian History. Central European University Press, Budapest.[2] Aizer, A., S. Eli, J. Ferrie and A. Lleras-Muney. 2016. "The Long-Run Impact of Cash Transfers to Poor
Families." American Economic Review, 106(4): 935-71.[3] Akee, R. K. Q., W. E. Copeland, G. Keeler, A. Angold and E. J. Costello. 2010. "Parents’ Incomes and
Children’s Outcomes: A Quasi-experiment Using Transfer Payments from Casino Profits." AmericanEconomic Journal: Applied Economics, 2(1): 86-115.
[4] Bassett, L. 2008. Can Conditional Cash Transfer Programs Play a Greater Role in Reducing ChildUndernutrition?, Social Protection Discussion Papers No 08/35, World Bank, Washington
[5] Becker, W. (1990) “The demand for higher education”, in Hoenack, S., and E. Collins (Eds.), TheEconomics of American Universities: Management, Operations, and Fiscal Environment. StateUniversity of New York Press: Albany, NY.
[6] Berlinschi R. and O. Stark (2018) Community cohesion and assimilation equilibria: An empiricalinquiry of the behavior of Roma, Working Paper, KU Leuven.
[7] Bonacich, E. (1975). "A Theory of Ethnic Antagnonism: The Split-Labour Market." American Sociolog-ical Review, 37(5): 547-559.
[8] Bogdanov, L. and Angelov, G. (2007). "Roma Integration in Bulgaria: Necessary Reforms and EconomicEffects." Sofia: Open Society Institute
[9] Bray, M. (1999): The Private Costs of Public Schooling: Household and Community Financing ofPrimary Education in Cambodia. Paris: UNESCO.
[10] Browne, J. and H. Immervoll (2017) Mechanics of replacing benefit systems with a basic income:comparative results from a microsimulation approach, Journal of Economic Inequality, 15(4), 325-344.
[11] Brüggemann, C. (2012). Roma Education in Comparative Perspective. Analysis of the UNDP/WorldBank/EC Regional Roma Survey 2011. Roma Inclusion Working Papers. Bratislava: United NationsDevelopment Programme.
[12] Butcher, K. (2017). Assessing the Long-Run Benefits of Transfers to Low-Income Families, HutchinsCenter on Fiscal and Monetary Policy Working Paper No 26. Brookings Institution.
[13] Caldes, N., D. Coady, and J. Maluccio 2006. The cost of poverty alleviation transfer programs: Acomparative analysis of three programs in Latin America. World Development, 34(5).
[14] Campbell R. and B. N. Siegel (1967) The Demand for Higher Education in the United States, 1919-1964,American Economic Review, 57:3, 482-494.
[15] Castelló-Climent, A. and Hidalgo-Cabrillana, A., 2012. "The role of educational quality and quantityin the process of economic development," Economics of Education Review, 31(4), 391-409.
[16] Ciaian, P. and Kancs, D. 2015."Assessing the Social and Macroeconomic Impacts of Labour MarketIntegration: A Holistic Approach," JRC Working Papers JRC99645, Joint Research Centre, EuropeanCommission.
[17] Ciaian, P. and Kancs, D. (2016). "Causes of the Social and Economic Marginalisation: The Role ofSocial Mobility Barriers for Roma", JRC Working Papers JRC100798, European Commission.
45

[18] Ciaian, P. and Kancs, D. (2018). "Social Mobility Barriers for Roma: Discrimination and InformalInstitutions", European Review, https://doi.org/10.1017/S1062798718000352.
[19] Ciaian, P. and Kancs, D. (2019). "Marginalisation of Roma: Root Causes and Possible Policy Actions",European Review, forthcoming.
[20] Colombino, U. 2015. "Is Unconditional Basic Income a Viable Alternative to Other Social WelfareMeasures?" IZA World of Labor.
[21] Cviklova, L. (2015). "Direct and indirect racial discrimination of Roma people in Bulgaria, the CzechRepublic and the Russian Federation." Ethnic and Racial Studies, 38(12): 2140-2155.
[22] de Janvry, A., and E. Sadoulet. 2004. Conditional Cash Transfer Programs: Are They Really MagicBullets? ARE Update, 7(6), 9-11.
[23] Dur, R. and C. Teulings, 2003. "Are Education Subsides an Efficient Redistributive Device?," CEEDiscussion Papers 30, Centre for the Economics of Education, LSE.
[24] European Court of Auditors (ECA). (2016). EU policy initiatives and financial support for Romaintegration: significant progress made over the last decade, but additional efforts needed on theground. Luxembourg: Publications Office of the European Union.
[25] European Commission (2004). "The Situation of Roma in an Enlarged European Union." Directorate-General for Employment and Social Affairs, European Commission.
[26] European Commission (2012). "Discrimination in the EU in 2012." Special Eurobarometer 393, 2012,Directorate-General Justice and Directorate-General for Communication, European Commission.
[27] European Commission (2014). "Report on discrimination of Roma children in education." Directorate-General for Justice, European Commission.
[28] European Parliament, (2011), ’Measures to promote the situation of Roma EU citizens in the EuropeanUnion’, PE 432.751, European Parliament, Brussels.
[29] FRA (2011). Results from the 2011 Roma survey. European Union Agency for Fundamental Rights(FRA).
[30] FRA (2012). "The situation of Roma in 11 EU Member States: Survey results at a glance." Resultsof the UNDP/ World Bank/ European Commission regional Roma 2011 survey. European UnionAgency for Fundamental Rights (FRA).
[31] FRA (2014a). "Roma survey - Data in focus; Education: the situation of Roma in 11 EU MemberStates." European Union Agency for Fundamental Rights (FRA).
[32] FRA (2014b). "Roma survey - Data in focus; Discrimination against and living conditions of Romawomen in 11 EU Member States." European Union Agency for Fundamental Rights (FRA).
[33] FRA (2014c). "Roma survey - Data in focus; Poverty and employment: the situation of Roma in 11 EUMember States." European Union Agency for Fundamental Rights (FRA).
[34] FRA (2018a). A persisting concern: anti-Gypsyism as a barrier to Roma inclusion. European UnionAgency for Fundamental Rights (FRA).
[35] FRA (2018b). Transition from education to employment of young Roma in nine EU Member States.European Union Agency for Fundamental Rights (FRA).
[36] FRA (2018c). Participation and engagement – a necessary precondition for effective Roma inclusion,European Union Agency for Fundamental Rights (FRA), forthcoming.
[37] Fraser, A. (1990). A rum lot. In M. T. Salo (Ed.), 100 years of Gypsy studies. Cheverly: The Gypsy Lore
46

Society.[38] Halasz, K. (2009). "The Rise of the Radical Right in Europe and the Case of Hungary: Gypsy crime
defines national identity?" Development 52(4): 490-494.[39] Hancock, I. (2005), "True Romanies and the Holocaust: A Re-evaluation and an overview", The
Historiography of the Holocaust, Palgrave Macmillan, 383-396.[40] Handa, S., and B. Davis. 2006. The Experience of Conditional Cash Transfers in Latin America and the
Caribbean. Development Policy Review, 24 (5): 513-536.[41] Hanushek, E. A. and Woessmann, L. 2007. "The role of education quality for economic growth," Policy
Research Working Paper Series 4122, World Bank, Washington.[42] Holocaust Encyclopedia (2016) Genocide of European Roma (Gypsies), 1939-1945". United States
Holocaust Memorial Museum (USHMM). Retrieved 19 January 2016.[43] Hum, D. and W. Simpson. 1993. "Economic Response to a Guaranteed Annual Income: Experience
from Canada and the United States." Journal of Labor Economics, 11 (1): 263-96.[44] Ivanov, A. (2012). Quantifying the Unquantifiable: Defining Roma Populations in Quantitative Surveys,
3-4, 79-95.[45] Ivanov, A., Kagin, J. (2014). Roma poverty from a human development perspective. Roma Inclusion
Working Papers. Istanbul: UNDP.[46] Jones, D. and Marinescu, I. 2018. "The Labor Market Impacts of Universal and Permanent Cash
Transfers: Evidence from the Alaska Permanent Fund" NBER Working Papers 24312, National Bureauof Economic Research.
[47] Kancs D, Lecca P. (2018), Long-term social, economic and fiscal effects of immigration into the EU:The role of the integration policy, World Economy, 1–32. https://doi.org/10.1111/twec.12637.
[48] Kela (2018), "Report on universal basic income experiment in Finland", Kela Working Papers, Helsinki.[49] Kertesi, G., Kézdi, G. (2006). Expected long-term budgetary benefits to Roma education in Hungary.
Budapest Working Papers.[50] Kertesi, G., Kézdi, G. (2011) "The Roma/Non-Roma Test Score Gap in Hungary," American Economic
Review, 101(3), 519-525.[51] Kézdi, G., and E. Suranyi. 2009. A Successful School Integration Program. Roma Education Fund,
Budapest.[52] Korando, A.M. (2012). "Roma Go Home: The Plight of European Roma." Law and Inequality, 30(1):
125-147.[53] Lutz, S. and Turrini, A. 2006. "A general equilibrium model with vertically differentiated industries,
skilled labour and trade," Economic Modelling, 23(1), 1-19.[54] Maluccio, J. A., and R. Flores. 2005. Impact Evaluation of a Conditional Cash Transfer Program.
International Food Policy Research Institute (IFPRI), Washington, DC.[55] Marcincin, A. and Marcincinová, L. (2009). Straty z vylúcenia Rómov kl’úcom k integrácii je rešpekto-
vanie inakosti.[56] Marinescu, I. 2018. "No Strings Attached: The Behavioral Effects of U.S. Unconditional Cash Transfer
Programs." NBER Working Papers 24337, National Bureau of Economic Research.[57] Mehrotra, S., A. Nigam, and A.T. Thet (1996), "Public and Private Costs of Primary Education",
UNICEF Staff Working Papers EPP-96-15, New York: UNICEF.
47

[58] Mihailov, D.. (2012). The health situation of Roma communities: Analysis of the data from theUNDP/World Bank/EC Regional Roma Survey 2011. Roma Inclusion Working Papers. Bratislava:United Nations Development Programme.
[59] Mudde, C. (2005). Racist Extremism in Central and Eastern Europe. London and New York: Taylorand Francis Group.
[60] Nikiforos, M., M. Steinbaum and G. Zezza (2017). "Modeling the Macroeconomic Effects of a UniversalBasic Income" Levy Institute Strategic Analysis. Annandale-on-Hudson, NY: Levy Ec.
[61] OECD (1986). “Applied General Equilibrium Models: An Assessment of their Usefulness for PolicyAnalysis,’ OECD Economic Studies, no. 7, Paris.
[62] OECD 2017. Basic income as a policy option: Technical Background Note Illustrating costs anddistributional implications for selected countries, Organisation for Economic Co-operation andDevelopment, Paris.
[63] O’Higgins, Niall. (2012). Roma and non-Roma in the labour market in Central and South-East Europe.Roma Inclusion Working Papers, Bratislava: United Nations Development Programme.
[64] O’Higgins, N. and A. Ivanov (2006). "Education and Employment Opportunities for the Roma."Comparative Economic Studies, 48: 6-19.
[65] Oreopoulos, P. (2007). "Do dropouts drop out too soon? Wealth, health and happiness from compulsoryschooling," Journal of Public Economics, 91(11-12), 2213-2229.
[66] Pareliussen, J.K., H. Hwang and H. Viitamäki (2018) Basic income or a single tapering rule? Incentives,inclusiveness and affordability compared for the case of Finland. OECD Working Paper No JT03429536,Organisation for Economic Co-operation and Development, Paris.
[67] Peleah, M. and A. Ivanov (2013). "Measuring Intersecting Inequalities Through the Social ExclusionIndex: A Proposal for Europe and Central Asia", United Nations Economic Commission for Europe,Working Paper No 22.
[68] Peric, Tatjana. (2012). The Housing Situation of Roma Communities: Regional Roma Survey 2011.Roma Inclusion Working Papers. Bratislava: United Nations Development Programme.
[69] Petrova, D. (2004). The Roma: Between a Myth and the Future. European Roma Rights Centre (ERRC)http://www.errc.org/cikk.php?cikk=1844
[70] Ram, M.H. (2014). "Europeanized Hypocrisy: Roma Inclusion and Exclusion in Central and EasternEurope." Journal on Ethnopolitics and Minority Issues in Europe, 13(3): 15-44.
[71] Ringold, D., M.A. Orenstein and E. Wilkens (2005). Roma in an Expanding Europe: Breaking thePoverty Cycle. The World Bank.
[72] Standing, G. 2007. How Cash Transfers Boost Work and Economic Security. DESA Working Paper 58,United Nations, New York.
[73] Stejskalova, M. (2012), ’How the Czech Educational System has Failed the Roma Children and why itKeeps Failing them’, Journal of Educational and Social Research, 2:(5) 59-68.
[74] Stewart, M. (2012). The Gypsy Menace: Populism and the new anti-Gypsy Politics. London: Hurst.[75] Tabor, S. 2002. "Direct Cash Transfers." Social Safety Net Primer Series. Washington, DC: World Bank.[76] Tanaka, R., Farre, L., Ortega, F., 2018. "Immigration, assimilation, and the future of public education,"
European Journal of Political Economy, 52, 141-165.[77] Thigpen, D. 2016. "Universal Basic Income: What Is It, and Is It Right for the U.S.?" New York, NY:
48

Roosevelt Institute.[78] Tsang, M. C. 1988. "Cost Analysis for Educational Policymaking: A Review of Cost Studies in
Education in Developing Countries," Review of Educational Research, 58(2), 190-224.[79] World Bank, (2010). Roma Inclusion: An Economic Opportunity for Bulgaria, the Czech Republic,
Romania and Serbia.[80] World Bank. (2012). Diagnostics and Policy Advice on the Integration of Roma in the Slovak Republic.
Economic Cost of Exclusion, Employment and Social Protection, Financial Inclusion, Education,Housing, Health, Monitoring and Evaluation, EU Financing.
49

Online Appendix: Long-run Economic, Budgetary andFiscal Effects of Roma Integration Policies I
Pavel Ciaiana, Andrey Ivanovb, d’Artis Kancsa,∗
aEuropean Commission, DG Joint Research Centre, Ispra, Italy.bEuropean Union Agency for Fundamental Rights, Vienna, Austria.
∗Corresponding author, Competence Centre on Modelling, European Commission.Email address: d'[email protected] (d’Artis Kancs)

A.1 Model description
The general equilibrium model adopted in the present study follows the approachof Ciaian and Kancs (2016) and Kancs and Lecca (2018). The employed model offersa flexible modelling framework containing many options that can be selected from,depending on the policy question.1 The model version that we employ in the presentstudy and describe below is tailored for the analysis of socio-economic consequences ofintegration policies, while keeping the model as tractable as possible by focussing on themain drivers and impacts of integration, without unnecessary complicating the modelthat would make results difficult to interpret. To better identify and understand the maindrivers and determinants of the outcomes generated by the model, a skeletal versionof the model representing the main mechanics and adjustment channels are presentedbelow. In their simplest form, the key optimising behaviour and equilibrium conditionscan be summarised as follows.
A.1.1 Consumption
In each country (indexed by subscript r), the representative household has a nestedutility structure. In each time period,2 consumers in country r receive utility fromconsumption, Cr.3 The household problem consists of the maximisation of a nestedConstant Elasticity of Substitution (CES) utility function by choosing optimal levels ofconsumption subject to a budget constraint. The first order condition of this optimisationproblem implies that the aggregate consumption level, Xd, is increasing in the disposableincome, Yd, (net of savings, Sd, the rate of which, sd, is a fixed share of income) butdecreasing in the general price level of consumption goods:
Xd =(1 − sd)Yd
Pd(1)
where Xd is the total consumer demand in country d, Yd is the household income incountry d and Pd is the general price index for consumption goods in country d.
The representative household is endowed with different types of labour and capital,the services of which are leased to firms. The household income, Yd, in country d is
1For example, the model incorporates several alternative forms of modelling the labour market, endoge-nous versus exogenous household investment in children education, disaggregation into several householdincome classes and others.
2For the sake of brevity, we omit time subscripts when describing static equations in this section.3Notation: we use Latin letters for variables and Greek letters for parameters. Small Latin letters refer
to varieties, capital letters denote goods (sectors). Indices o and d denote origin and destination countries,respectively. Indices i and j denote producing and consuming industries (which may overlap), respectively.
48

composed of income from all primary factors and government transfers to householdsnet of taxes, To:
Yo =F
∑f=1
w f dFo + To (2)
where w f is the factor wage (rental rate) and Fo denotes the set of factor owned byhouseholds (capital and several types of labour, see below).
The consumer price index, Pid, takes the same CES form in both sub-utility tiers,therefore spelled out only for the sectoral demand:
Pid =
[R
∑r=1
Nioλi (pioτiod)1−σ
] 11−σ
(3)
where Nio describes the mass (number) of firms exporting from the origin country o, pio
is the output price and τiod are iceberg transport costs of shipping goods produced in theorigin country, o, to the destination country, d.4
Using the price index from equation (3), consumer demand for each variety ofdifferentiated good i can be expressed as:
xiod = αidYdλi(pioτiod)
−σ
P1−σid
(4)
where xiod is country d’s demand for variety x of good Xi produced in country o.
A.1.2 Production
Each firm uses two types of inputs for producing goods: intermediate goods, Xjo, andprimary factors, Ff o. The use of intermediate inputs is determined by their relative prices.The price index for intermediate goods, Pjd, takes a CES form:
Pjd =
[I
∑i=1
λjP1−σid
] 11−σQ
(5)
where Pid is the same price index as for consumer goods, i.e. we implicitly assumethat consumers and industries demand goods in the same proportions.5 The use of
4Iceberg transportation costs, τiod, imply that (1 + τod) units of good i have to be shipped from theorigin country, o, in order for one unit to arrive at the destination country, d, (see equation 13).
5This simplifying assumption is required because of data limitations allowing to differentiate betweenintermediate inputs and consumptions goods. Modelling different consumer and industry demand shares
49

intermediates from own as well as other industries implies inter-industry and intra-industry linkages. The presence of these linkages between low-skill, medium-skill andhigh-skill manufacturing, together with country differences in the skill endowment, willgenerate an additional channel of adjustment and imply asymmetric responses to policyshocks across countries.
As above, also the price index of primary production factors takes the CES form:
Wio =
[F
∑f=1
λ f w1−σf o
] 11−σW
(6)
where Wio is the aggregate price for all primary factors used in the production by sectori’s firms in country o and, as above, w f is the factor wage (rental rate).
As usual in the monopolistic competition framework, we assume that each countrycontains a large number of firms, each producing a single variety, implying the followingconstant mark-up equation for profit maximising firms:
pio =σ
σ − 1MCio (7)
where MCio is the marginal cost of industry i producing in country o. The parameterrestriction σ > 1 ensures that the output price, po, is always positive. According toequations (5) and (6), the marginal cost, MCio, is specified as a nested CES function withtwo arguments: primary factors and intermediate inputs:
MCio = βio
[δ
σMCio P1−σMC
jd + (1 − δio)σMC W1−σMC
io
] 11−σMC (8)
where σMC is the elasticity of substitution between intermediate goods and primaryfactors, whereas parameter δio determines input shares of intermediate goods and primaryfactors.
A.1.3 Inputs: primary and intermediary
As usual, demands for primary factors and intermediate inputs are obtained by takingpartial derivatives of the marginal cost function (equation 8) with respect to input priceindexes (equations 5 and 6) according to the Shephard’s lemma:
would solely shift within industry demand ratio, which, however, would not affect our empirical results.
50

Ff o =I
∑i=1
β1−σMCio δio
[MCio
Wio
]σMC[
Wio
w f ,o
]σW
Nio (Xio + FCio) (9)
where FCio is the fixed cost.6 The labour demand for different skill levels, e, at thesecond tier of the production function and demand for labour with different ethnicalbackgrounds, m, at the lower tier of the production function takes the same CES form asdemand for primary factors and intermediate inputs at the upper tier.
The employed labour in each country is determined via a wage curve, which accountsfor labour market imperfections (see Kancs and Lecca 2018). Hence, the model incorpo-rates an imperfect competition in the labour market. The general formulation, expressedin the logarithmic form, follows Blanchflower and Oswald (1995):
woem = ξoem − ιoemuoem (10)
where ξ and ι are econometrically estimated wage curve parameters. Equation (10)describes a conventional wage curve, as defined in Blanchflower and Oswald (1995),according to which the real wage, woem, of m type workers with skills, e, is negativelyrelated to the unemployment rate, uoem.
The capital supply in each country is determined endogenously by adjusting thecapital stock such that the real rate of return to capital equals the steady state rate ofreturn: Wko
Po= ρo, where Po is the price level in country o and ρo is the steady state rate of
return.The demand for intermediate inputs is derived analogously to the primary factor
demand by applying the Shephard’s lemma:
Xjd =I
∑j=1
β1−σMCjd
(1 − δjd
) [MCjd
Pjd
]σMC [Pjd
Pid
]σQ
Njd(Xjd + FCjd
)(11)
The industry demand for individual variety x of good Xj is analogous to the consumerdemand in equation (4):7
6The fixed cost would be set to zero and the number of firms to one, if we would model some industriesas perfectly competitive industries.
7Given that workers consume only final goods, the consumer demand function, Xid, is less involvedthan Xjd, in equation (4) we have already substituted for Xid.
51

xjod = Xjdλi
(pjoτjod
)−σ
P−σjd
(12)
A.1.4 Equilibrium
The total demand for good i produced in origin country o is given by the sum ofdemand for the final consumption and demand for the intermediate use:
Xiod =R
∑r=1
(xiod + xjod
)(1 + τod) (13)
The labour market equilibrium is ensured through endogenous adjustments in theunemployment rate:
∑i
NioLioem= (1 − uoem) Loem (14)
The long-run equilibrium also requires that the number of firms in each country is nolonger changing in response to short-run profits, which implies zero profits whereverthere is a positive number of firms and negative profits (for potential, if not for actual,firms) wherever the number of firms is zero:
MCid (Xid + FCi) ≥ pidXid (15)
As usual, the firm entry and exit is free, as economic sectors are modelled as imper-fectly competitive.8 The number of manufacturing varieties produced in country r equalsthe number of firms operating in country r, which is defined by the zero profit condition:
πid =[pidXid − MCid
(Xid + FCj
)]Nid = 0 (16)
A.2 Model calibration
The model economy is represented by five EU Member States: Bulgaria, the CzechRepublic, Hungary, Slovakia and Romania, the rest of the EU and the rest of the world.Each EU Member State’s economy of the five studied countries is composed of a numberof economic sectors. In order to account for differences in the skill intensity between eco-nomic sectors and hence structural differences between the five studied countries, in the
8As noted above, if modelling some sectors as perfectly competitive, the fixed cost would be set to zeroand the number of firms would equal to one.
52

Table 1: Calibrated shares of economic sectors in the five study countries, 2014
Bulgaria Czechia Hungary Romania SlovakiaHigh-skill manufacturing 0.097 0.133 0.156 0.070 0.075Medium-skill manufacturing 0.149 0.435 0.414 0.352 0.442Low-skill manufacturing 0.051 0.086 0.041 0.073 0.081Education 0.039 0.040 0.051 0.034 0.041Rest of the economy 0.665 0.306 0.339 0.472 0.361
Source: Authors’ calibration of the model.
present study each EU Member State’s economy is disaggregated into five economic sec-tors: Low-skill manufacturing; Medium-skill manufacturing; High-skill manufacturing;Education and the Rest of the economy.
The classification of the first three economic sectors (low-skill, medium-skill and high-skill manufacturing) follows the skill and technology-intensity product definition fromthe United Nations Conference on Trade and Development (UNCTAD).9 The UNCTAD’sclassification distinguishes products according to their level of skill- and technology-intensity; all products are regrouped into seven categories: (i) High skill- and technologyintensive manufactures; (ii) Medium skill- and technology intensive manufactures; (iii)Low skill- and technology intensive manufactures; (iv) Resource-intensive manufactures;(v) Non-fuel primary commodities; (vi) Mineral fuels; and (vii) Unclassified products.For the purpose of the present study, we make use of the first three categories ((i)-(iii)),other four groups are aggregated together in a ’Rest of the economy’ aggregate. Further,SITC Revision 2 product data are converted into NACE Rev. 2 industry data using UnitedNations Statistics Division and Eurostat Ramon correspondence tables (see Tables A1-A3).The Education sector corresponds to the NACE Rev. 2 Division 85 ’Education’. In theRest of the economy sector all other economic activities and services from NACE Rev. 2Divisions 01-16, 19, 31, 33-84, 86-99 are aggregated together.
The relative importance of each of the five economic sectors in the GDP in eachstudy country is reported in Table 1. According to Table 1, the share of the high-skillmanufacturing sector in the GDP is the lowest in Romania (7%) whereas it is the highestin Hungary (15.6%). The GDP share of the medium-skill manufacturing sector variesbetween 14.9% in Bulgaria to 44.2% in Slovakia. The low-skill manufacturing sector isrelatively smaller in all five countries, ranging from 4.1% in Hungary to 8.6% in the Czech
9http://www.unctad.info/en/trade-analysis-branch/data-and-statistics/other-databases/
53

Table 2: Concordance between ISCED education levels and skill levels in the model
ISCED ModelCode Label Skill-level
0 Pre-primary education Low-skill1 Primary education or first stage of basic education Low-skill2 Lower secondary education or second stage of basic education Low-skill3 Upper secondary education Medium-skill4 Post-secondary non tertiary education Medium-skill5 First stage of tertiary education* High-skill6 Second stage of tertiary education** High-skill
Source: Based on the UNESCO’s International Standard Classification of Education (ISCED) definition. Notes: In line with the
OECD, the primary and lower secondary education (ISCED 0-2) corresponds to low-skills; the upper-secondary and post-secondary
education (ISCED 3-4) corresponds to medium-skills; and the tertiary education (ISCED 5-6) corresponds to high-skills. *not leading
directly to an advanced research qualification; **leading to an advanced research qualification.
Republic. The relative size of the education sector is rather similar across the five studycountries, ranging from 3.4% in Romania to 5.1% in Hungary. Finally, the relative size ofthe ’Rest of the economy’ sector that aggregates all other economic activities and servicesis determined by the relative size of the low-, medium- and high-skill manufacturing andeducation services in these countries (Table 1).
In order to account for differences in the education intensity between worker skilllevels and hence differences in the workforce structure between the five studied countries,in the model labour is disaggregated according to skill levels into three skill categories:low-skill, medium-skill and high-skill. The skill aggregation follows the UNESCO’sInternational Standard Classification of Education (ISCED): the primary and lowersecondary education (ISCED 0-2) corresponds to low-skills; the upper-secondary andpostsecondary education (ISCED 3-4) corresponds to medium-skills; and the tertiaryeducation (ISCED 5-6) corresponds to high-skills. See Table 2 for concordance betweenthe ISCED categories and those adopted in the model.
The calibrated shares of the labour workforce by the educational attainment level ineach study country in 2014 are reported in Table 3. According to Table 3, the highest shareof low-skill workers (ISCED 0-2) is in Romania (29.75%), followed by Bulgaria (20.55%).The lowest share of low-skill workers is in the Czech Republic (8.35%). As regardsmedium-skill workers (ISCED 3-4), they their share ranges from 54.35% in Bulgaria to71.30% in the Czech Republic. The relative size of the high-skill workforce is the most
54

Table 3: Calibrated shares of the labour workforce by the educational attainment level in the five studycountries, 2014
Bulgaria Czechia Hungary Romania SlovakiaLow-skill 0.21 0.08 0.19 0.30 0.11Medium-skill 0.54 0.71 0.59 0.56 0.69High-skill 0.25 0.20 0.22 0.14 0.20
Source: Authors’ calibration of the model.
homogenous across the five study countries. It ranges from 14.20% in Romania to 25.10%in Bulgaria (Table 3). It has to be noted that differences in the education quality are notcaptured in these statistics. They may be significant though and offer a promising areafor a future research.
In addition to the construction of the base year data (2014) base, a further importantstep of the empirical implementation of the model is model’s parameterisation, i.e. assign-ing numerical values to all model parameters. As usual in applied general equilibriummodels, part of parameter values are based on econometric estimates (either own orfrom the literature), whereas the other part is calibrated within the model. In particular,all elasticities of substitution/transformation are based on econometric estimates. Inthe present study, we assume a rather low elasticity of substitution in production (0.4)(Chirinko 2008), a relatively high elasticity of substitution in consumption (1.5) (Okagawaand Ban 2008) and a fairly high for trade between countries (6.0) (Aspalter 2016). Theelasticity of substitution between different types of skills equate to 2.0 (Krussel et al. 2000),while the elasticity of substitution between Roma and non-Roma workers equate to 6.0,which corresponds to elasticity estimates between foreign-born and native-born workersof Ottaviano and Peri (2012). As for the wage curve parameterisation, we typicallyassume a long-run wage curve, implying a wage elasticity equal to -0.1 (Nijkamp andPoot 2005).10 The interest rate (faced by producers, consumers and investors) followsthe European Commission’s Better Regulation Guidelines and is set to 0.04,11 the rate ofdepreciation to 0.15.
The rest of model parameters, notably, shift and share parameters are calibratedwithin the model such as to reproduce exactly each study country’s base year (2014) data
10Most of previous studies on the relationship between unemployment and wages find an elasticity closeto -0.1, as summarised by the meta-analysis carried out by Nijkamp and Poot (2005). This confirms theoriginal estimates of Blanchflower and Oswald (1995).
11https://ec.europa.eu/info/better-regulation-guidelines-and-toolbox_en
55

Table 4: Calibrated shares of main macro-economic variables in the five study countries, 2014
Bulgaria Czechia Hungary Romania SlovakiaExports/GDP 0.65 0.83 0.88 0.41 0.92Imports/GDP 0.66 0.76 0.81 0.42 0.88Value added/GDP 0.87 0.90 0.84 0.89 0.91Labour/GDP 0.41 0.40 0.43 0.33 0.38Investment/GDP 0.21 0.26 0.23 0.25 0.22
Source: Authors’ calibration of the model.
in national accounts. The model calibration process assumes study country economiesbeing in a steady-state equilibrium initially. This implies that the data observed shouldprovide an unbiased information about preferences and technologies in each countryand therefore relative magnitudes should not vary in the baseline. The capital stock iscalibrated to allow depreciation to be fully covered by investments.
For illustrative purposes, selected calibrated share parameters are reported in Table4. If the theoretical model is specified correctly, then the reproduction of the base yearequilibrium is ensured by construction, which is the case of the underlying model.Comparing the calibrated shares in the model with those of the Eurostat’s nationalaccount data, we can observe that the model is able to reproduce exactly the statisticalbase year data. Although not a sufficient condition, it is a necessary condition to checkthat the model is correctly specified and parameterised. The General Algebraic ModelingSystem (GAMS) programme that is used to solve the model allows to check for thisin many other ways. For example, in order to ensure that there are no errors in thecalibration of the model, we solve the model with zero iterations.
Further, it is important to note that, apart from the above explained baseline scenarioassumptions with respect to the population growth, we do not make any further assump-tions about the future development of the EU economy, i.e. how would it develop inabsence of the integration policy. Hence, all results reported above are deviations off thebaseline, i.e. we compare different policy scenarios with the baseline scenario withoutpolicy interventions; difference between the two is then attributed to the particular policythat is simulated.
In order to ensure the robustness of the underlying modelling framework, a furtherstep is the model validation. However, given that the model is designed as an impactassessment model for undertaking what if type of analysis, but not as a forecasting tool,
56

the validation of an applied general equilibrium model using historical data is extremelychallenging. Among others, because we cannot observe the true impact of a particularpolicy simulated by the model. We can only observe the historical development ofcertain variables, in which however the true policy impact is confounded by many othersimultaneous developments, such as financial crisis, oil price shock, etc. These conceptuallimitations are important to bear in mind, when considering and interpreting simulationresults produced by any applied general equilibrium model, including the present one.They suggest that, whereas these type of models can be useful for understanding thedirection and underlying mechanics of impacts, the exact magnitude of true effects maybe different from those projected in model simulations.
References[1] Aspalter, L., 2016. Estimating Industry-level Armington Elasticities For EMU Countries. Department of
Economics Working Paper No. 217[2] Blanchflower, D. G. and Oswald, A. J. (1995). An Introduction to the Wage Curve. Journal of Economic
Perspectives, 9 (3), 153-167.[3] Chirinko, R. S. (2008), The long and short of it, Journal of Macroeconomics, 30 (2), 671–686.[4] Ciaian, P. and Kancs, D. (2016), "Assessing the Social and Macroeconomic Impacts of Labour Market
Integration: A Holistic Approach," JRC Working Papers JRC99645, Joint Research Centre, EuropeanCommission.
[5] Kancs D, Lecca P. (2018), Long-term social, economic and fiscal effects of immigration into the EU: Therole of the integration policy, World Economy, 1–32. https://doi.org/10.1111/twec.12637.
[6] Krusell, P., Ohanian, L. E., Rios-Rull, J. and Violante, G.L., (2000). Capital-skill complementarity andinequality: A macroeconomic analysis. Econometrica, 68(5): 1029-1054.
[7] Nijkamp P., and Poot, J., (2005). The Last Word on the Wage Curve? Journal of Economic Surveys, vol.19.
[8] Okagawa, A. and Ban, K. (2008). Estimation of substitution elasticities for CGE models. DiscussionPapers in Economics and Business 2008/16, Osaka University, Graduate School of Economics andOsaka School of International Public Policy.
57

Table A.1: Concordance between SITC Rev. 3 products and NACE Rev. 2 industries: Low-skill manufac-turing
SITC Revision 3 NACE Revision 2Code Label Code Label511 Hydrocarbons, n.e.s., halogenated,
nitr. derivative20 Manufacture of chemicals and
chemical products512 Alcohols, phenols, halogenat., sul-
fonat., nitrat. der.20 Manufacture of chemicals and
chemical products513 Carboxylic acids, anhydrides,
halides, per.; derivati.20 Manufacture of chemicals and
chemical products514 Nitrogen-function compounds 20 Manufacture of chemicals and
chemical products515 Organo-inorganic, heterocycl.
compounds, nucl. acids20 Manufacture of chemicals and
chemical products516 Other organic chemicals 20 Manufacture of chemicals and
chemical products522 Inorganic chemical elements, ox-
ides, halogen salts20 Manufacture of chemicals and
chemical products523 Metallic salts, peroxysalts, of inor-
ganic acids20 Manufacture of chemicals and
chemical products524 Other inorganic chemicals 20 Manufacture of chemicals and
chemical products525 Radio-actives and associated ma-
terials20 Manufacture of chemicals and
chemical products531 Synth. organic colouring matter,
colouring lakes20 Manufacture of chemicals and
chemical products532 Dyeing, tanning extracts, synth.
tanning materials20 Manufacture of chemicals and
chemical products533 Pigments, paints, varnishes and
related materials20 Manufacture of chemicals and
chemical products541 Medicinal and pharmaceutical
products, excluding 54221 Manufacture of basic pharmaceu-
tical products and pharmaceuticalpreparations
542 Medicaments (incl. veterinarymedicaments)
21 Manufacture of basic pharmaceu-tical products and pharmaceuticalpreparations
551 Essential oils, perfume, flavourmaterials
20 Manufacture of chemicals andchemical products
553 Perfumery, cosmetics or toiletprepar. (excluding soaps)
20 Manufacture of chemicals andchemical products
554 Soaps, cleansing and polishingpreparations
20 Manufacture of chemicals andchemical products
562 Fertilizers (other than those ofgroup 272)
20 Manufacture of chemicals andchemical products
571 Polymers of ethylene, in primaryforms
20 Manufacture of chemicals andchemical products
572 Polymers of styrene, in primaryforms
20 Manufacture of chemicals andchemical products
573 Polymers of vinyl chloride or halo-genated olefins
20 Manufacture of chemicals andchemical products
574 Polyethers, epoxide resins; poly-carbonat., polyesters
20 Manufacture of chemicals andchemical products
575 Other plastics, in primary forms 20 Manufacture of chemicals andchemical products
579 Waste, parings and scrap, of plas-tics
20 Manufacture of chemicals andchemical products
581 Tubes, pipes and hoses of plastics 22 Manufacture of rubber and plasticproducts
582 Plates, sheets, films, foil, strip, ofplastics
22 Manufacture of rubber and plasticproducts

SITC Revision 3 NACE Revision 2Code Label Code Label583 Monofilaments, of plastics, cross-
section > 1mm22 Manufacture of rubber and plastic
products591 Insectides, similar products, for
retail sale20 Manufacture of chemicals and
chemical products592 Starche, wheat gluten; albu-
minoidal substances; glues20 Manufacture of chemicals and
chemical products593 Explosives and pyrotechnic prod-
ucts20 Manufacture of chemicals and
chemical products597 Prepared addit. for miner. oils;
lubricat., de-icing20 Manufacture of chemicals and
chemical products598 Miscellaneous chemical products,
n.e.s.20 Manufacture of chemicals and
chemical products751 Office machines 28 Manufacture of machinery and
equipment n.e.c.752 Automatic data processing ma-
chines, n.e.s.28 Manufacture of machinery and
equipment n.e.c.759 Parts, accessories for machines of
groups 751, 75228 Manufacture of machinery and
equipment n.e.c.761 Television receivers, whether or
not combined26 Manufacture of computer, elec-
tronic and optical products762 Radio-broadcast receivers,
whether or not combined26 Manufacture of computer, elec-
tronic and optical products763 Sound recorders or reproducers 26 Manufacture of computer, elec-
tronic and optical products764 Telecommunication equipment,
n.e.s.;, parts, n.e.s.26 Manufacture of computer, elec-
tronic and optical products776 Cathode valves, tubes 28 Manufacture of machinery and
equipment n.e.c.792 Aircraft, associated equipment;
spacecraft, etc.30 Manufacture of other transport
equipment871 Optical instruments, apparatus,
n.e.s.26 Manufacture of computer, elec-
tronic and optical products872 Instruments, appliances, n.e.s., for
medical, etc.26 Manufacture of computer, elec-
tronic and optical products873 Meters, counters, n.e.s. 26 Manufacture of computer, elec-
tronic and optical products874 Measuring, analysing, controlling
apparatus, n.e.s.26 Manufacture of computer, elec-
tronic and optical products881 Photographic apparatus, equip-
ment, n.e.s.26 Manufacture of computer, elec-
tronic and optical products882 Cinematographic, photographic
supplies26 Manufacture of computer, elec-
tronic and optical products883 Cinematograph films, exposed,
developed26 Manufacture of computer, elec-
tronic and optical products884 Optical goods, n.e.s. 26 Manufacture of computer, elec-
tronic and optical products885 Watches, clocks 26 Manufacture of computer, elec-
tronic and optical products891 Arms, ammunition 25 Manufacture of fabricated metal
products, except machinery andequipment
892 Printed matter 18 Printing and reproduction ofrecorded media
896 Works of art, collectors’ pieces, an-tiques
32 Other manufacturing
897 Jewellery, articles of precious ma-teria., n.e.s.
32 Other manufacturing
Source: Based on the United Nations Statistics Division and Eurostat Ramon correspondence tables.
61

Table A.2: Concordance between SITC Rev. 3 products and NACE Rev. 2 industries: Medium-skillmanufacturing
SITC Revision 3 NACE Revision 2Code Label Code Label621 Materials of rubber (pastes, plates,
sheets, etc.)22 Manufacture of rubber and plastic
products625 Rubber tyres, tyre treads or flaps,
inner tubes22 Manufacture of rubber and plastic
products629 Articles of rubber, n.e.s. 22 Manufacture of rubber and plastic
products711 Vapour generating boilers, auxil-
iary plant; parts25 Manufacture of fabricated metal
products, except machinery andequipment
712 Steam turbines, other vapourturbin., parts, n.e.s.
25 Manufacture of fabricated metalproducts, except machinery andequipment
713 Internal combustion piston en-gines, parts, n.e.s.
28 Manufacture of machinery andequipment n.e.c.
714 Engines, motors, non-electric;parts, n.e.s.
28 Manufacture of machinery andequipment n.e.c.
716 Rotating electric plant, partsthereof, n.e.s.
28 Manufacture of machinery andequipment n.e.c.
718 Other power generating machin-ery, parts, n.e.s.
28 Manufacture of machinery andequipment n.e.c.
721 Agricultural machinery (exclud-ing tractors), parts
28 Manufacture of machinery andequipment n.e.c.
722 Tractors (excluding those of 71414,74415)
28 Manufacture of machinery andequipment n.e.c.
723 Civil engineering, contractors’plant, equipment
28 Manufacture of machinery andequipment n.e.c.
724 Textile, leather machinery, partsthereof, n.e.s.
28 Manufacture of machinery andequipment n.e.c.
725 Paper mill, pulp mill machinery;paper articles man.
28 Manufacture of machinery andequipment n.e.c.
726 Printing, bookbinding machinery,parts thereof
28 Manufacture of machinery andequipment n.e.c.
727 Food-processing machines (ex-cluding domestic)
28 Manufacture of machinery andequipment n.e.c.
728 Other machinery for particular in-dustries, n.e.s.
28 Manufacture of machinery andequipment n.e.c.
731 Machine-tools working by remov-ing material
28 Manufacture of machinery andequipment n.e.c.
733 Mach.-tools for working metal, ex-cluding removing mate.
28 Manufacture of machinery andequipment n.e.c.
735 Parts, n.e.s., accessories for ma-chines of 731, 733
28 Manufacture of machinery andequipment n.e.c.
737 Metalworking machinery (exclud-ing machine-tools), parts
28 Manufacture of machinery andequipment n.e.c.
741 Heating, cooling equipment, partsthereof, n.e.s.
25 Manufacture of fabricated metalproducts, except machinery andequipment
742 Pumps for liquids 28 Manufacture of machinery andequipment n.e.c.
743 Pumps (excluding liquid), gascompressors, fans; centr.
28 Manufacture of machinery andequipment n.e.c.
744 Mechanical handling equipment,parts, n.e.s.
28 Manufacture of machinery andequipment n.e.c.
62

SITC Revision 3 NACE Revision 2Code Label Code Label745 Other non-electr. machinery, tools,
mechan. appar.28 Manufacture of machinery and
equipment n.e.c.746 Ball or roller bearings 25 Manufacture of fabricated metal
products, except machinery andequipment
747 Appliances for pipes, boiler shells,tanks, vats, etc.
25 Manufacture of fabricated metalproducts, except machinery andequipment
748 Transmis. shafts 25 Manufacture of fabricated metalproducts, except machinery andequipment
749 Non-electric parts, accessor. ofmachinery, n.e.s.
25 Manufacture of fabricated metalproducts, except machinery andequipment
771 Electric power machinery, andparts thereof
27 Manufacture of electrical equip-ment
772 Apparatus for electrical circuits;board, panels
27 Manufacture of electrical equip-ment
773 Equipment for distributing elec-tricity, n.e.s.
27 Manufacture of electrical equip-ment
774 Electro-diagnostic appa. for medi-cal sciences, etc.
27 Manufacture of electrical equip-ment
775 Household type equipment, elec-trical or not, n.e.s.
27 Manufacture of electrical equip-ment
778 Electrical machinery, apparatus,n.e.s.
27 Manufacture of electrical equip-ment
781 Motor vehicles for the transportof persons
29 Manufacture of motor vehicles,trailers and semi-trailers
782 Motor vehic. for transport ofgoods, special purpo.
29 Manufacture of motor vehicles,trailers and semi-trailers
783 Road motor vehicles, n.e.s. 29 Manufacture of motor vehicles,trailers and semi-trailers
784 Parts, accessories of vehicles of722, 781, 782, 783
29 Manufacture of motor vehicles,trailers and semi-trailers
811 Prefabricated buildings 23 Manufacture of other non-metallicmineral products
812 Sanitary, plumbing, heating fix-tures, fittings, n.e.s.
23 Manufacture of other non-metallicmineral products
813 Lighting fixtures, fittings, n.e.s. 27 Manufacture of electrical equip-ment
893 Articles, n.e.s., of plastics 22 Manufacture of rubber and plasticproducts
894 Baby carriages, toys, games, sport-ing goods
32 Other manufacturing
Source: Based on the United Nations Statistics Division and Eurostat Ramon correspondence tables.
63

Table A.3: Concordance between SITC Rev. 3 products and NACE Rev. 2 industries: Low-skill manufac-turing
SITC Revision 3 NACE Revision 2Code Label Code Label671 Pig iron, spiegeleisen, sponge
iron, powder, granu24 Manufacture of basic metals
672 Ingots, primary forms, of iron orsteel; semi-finis.
24 Manufacture of basic metals
673 Flat-rolled prod., iron, non-alloysteel, not coated
24 Manufacture of basic metals
674 Flat-rolled prod., iron, non-alloysteel, coated, clad
24 Manufacture of basic metals
675 Flat-rolled products of alloy steel 24 Manufacture of basic metals676 Iron, steel bars, rods, angles,
shapes, sections24 Manufacture of basic metals
677 Rails, railway track constructionmat., iron, steel
24 Manufacture of basic metals
678 Wire of iron or steel 24 Manufacture of basic metals679 Tubes, pipes, hollow profiles, fit-
tings, iron, steel24 Manufacture of basic metals
691 Structures, parts, n.e.s., of iron,steel, aluminium
25 Manufacture of fabricated metalproducts, except machinery andequipment
692 Metal containers for storage ortransport
25 Manufacture of fabricated metalproducts, except machinery andequipment
693 Wire products (excluding electri-cal) and fencing grills
25 Manufacture of fabricated metalproducts, except machinery andequipment
694 Nails, screws, nuts, bolts, rivets,the like, of metal
25 Manufacture of fabricated metalproducts, except machinery andequipment
695 Tools for use in the hand or inmachine
25 Manufacture of fabricated metalproducts, except machinery andequipment
696 Cutlery 25 Manufacture of fabricated metalproducts, except machinery andequipment
697 Household equipment of basemetal, n.e.s.
25 Manufacture of fabricated metalproducts, except machinery andequipment
699 Manufactures of base metal, n.e.s. 25 Manufacture of fabricated metalproducts, except machinery andequipment
785 Motorcycles, cycles 30 Manufacture of other transportequipment
786 Trailers, semi-trailers 29 Manufacture of motor vehicles,trailers and semi-trailers
791 Railway vehicles, associatedequipment
30 Manufacture of other transportequipment
793 Ships, boats, floating structures 30 Manufacture of other transportequipment
895 Office, stationery supplies, n.e.s. 17 Manufacture of paper and paperproducts
Source: Based on the United Nations Statistics Division and Eurostat Ramon correspondence tables.
64

GETTING IN TOUCH WITH THE EU
In person
All over the European Union there are hundreds of Europe Direct information centres. You can find the address of the centre nearest you at: https://europa.eu/european-union/contact_en
On the phone or by email
Europe Direct is a service that answers your questions about the European Union. You can contact this service:
- by freephone: 00 800 6 7 8 9 10 11 (certain operators may charge for these calls),
- at the following standard number: +32 22999696, or
- by electronic mail via: https://europa.eu/european-union/contact_en
FINDING INFORMATION ABOUT THE EU
Online
Information about the European Union in all the official languages of the EU is available on the Europa website at: https://europa.eu/european-union/index_en
EU publications You can download or order free and priced EU publications from EU Bookshop at:
https://publications.europa.eu/en/publications. Multiple copies of free publications may be obtained by
contacting Europe Direct or your local information centre (see https://europa.eu/european-
union/contact_en).

doi:10.2760/480218
ISBN 978-92-79-93400-1
KJ-A
E-1
8-0
07-E
N-N