evaluation of lightweight pieces in...
TRANSCRIPT

Date: March 2016
Research Project:
Evaluation of Lightweight Pieces in
Aggregates
Location: Laboratory Evaluation
Aggregate Legal Source
Location:
NA
Starting Date: August 2015
Completion Date: March 2016
Principle Investigators:
Mark Lindemann
Geotechnical Engineer Aggregate Lab:
Doug Macke
Hwy Quality Assurance Manager
Jim Wilken
Hwy Materials & Tests Technician III
John Ebito
Engineer I
Mark Hassler
Hwy Materials & Tests Technician III
P.C.C Research & Development:
Lieska Halsey
Assistant PCC Engineer
Bob Seger
Research
Nebraska Department of Roads
Introduction:
Nebraska Department of Roads (NDOR) Material and Research (M&R) Division started an evaluation to
determined injurious deleterious lightweight pieces of aggregate from a dry pit location, as a result of field
observations from a project stock pile. This brief summary presents the field observation and laboratory
testing evaluations to determine the percent of lightweight pieces in aggregate.
Field Observation:
While visiting a plant site, Materials & Research noticed the aggregate stockpile had large amounts of what
appears to be lightweight aggregates (lightweight pieces) on Phase I of the project as shown in Figures 1 and
2. This was a concern due to the large quantities observed in the stockpile.
Evaluation of Lightweight Pieces in Aggregates
Figure 1. The red circle shows the lightweight pieces observed throughout the stockpile.
Figure 2. Lightweight Pieces
Pit Site Location
2 | P a g e
Laboratory Testing:
The research in the laboratory was to compare three
different test methods of lightweight pieces, as follows:
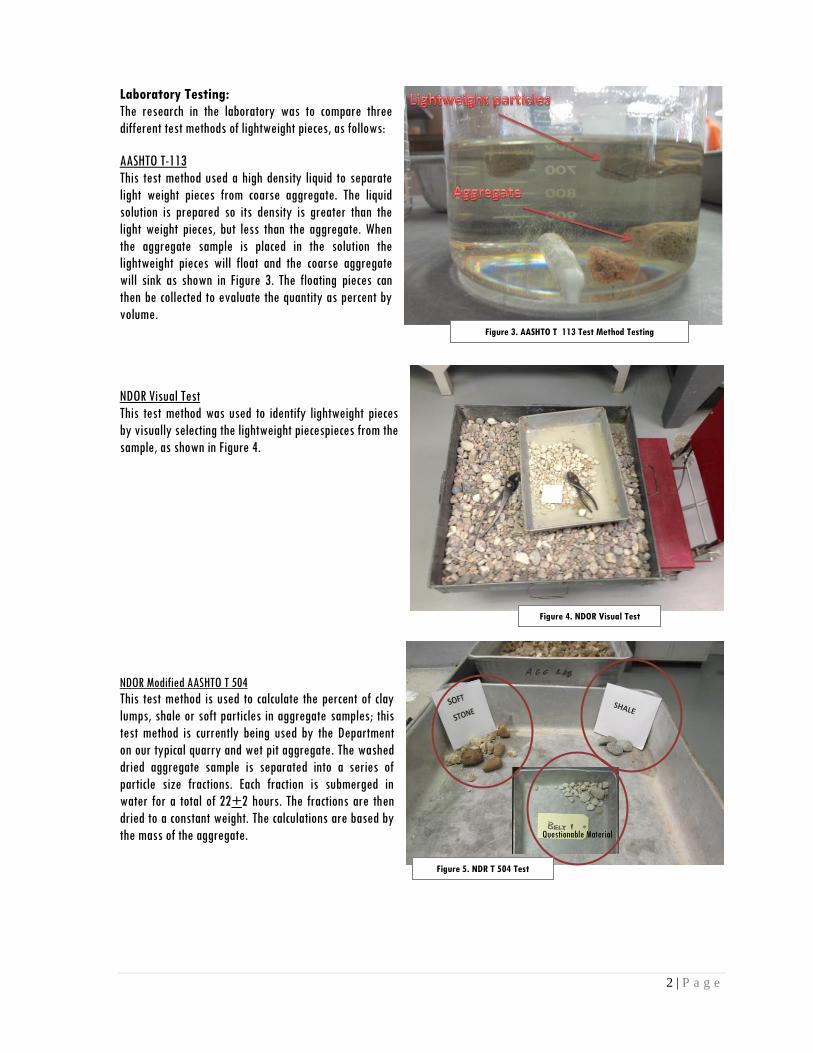
AASHTO T-113
This test method used a high density liquid to separate
light weight pieces from coarse aggregate. The liquid
solution is prepared so its density is greater than the
light weight pieces, but less than the aggregate. When
the aggregate sample is placed in the solution the
lightweight pieces will float and the coarse aggregate
will sink as shown in Figure 3. The floating pieces can
then be collected to evaluate the quantity as percent by
volume.
NDOR Visual Test
This test method was used to identify lightweight pieces
by visually selecting the lightweight piecespieces from the
sample, as shown in Figure 4.
NDOR Modified AASHTO T 504
This test method is used to calculate the percent of clay
lumps, shale or soft particles in aggregate samples; this
test method is currently being used by the Department
on our typical quarry and wet pit aggregate. The washed
dried aggregate sample is separated into a series of
particle size fractions. Each fraction is submerged in
water for a total of 22+2 hours. The fractions are then
dried to a constant weight. The calculations are based by
the mass of the aggregate.
Figure 3. AASHTO T 113 Test Method Testing
Figure 4. NDOR Visual Test
Questionable Material
Figure 5. NDR T 504 Test
Method

3 | P a g e
Laboratory Testing Summary:
This investigation compared three different test methods of measuring the percent composition of soft/lightweight particles in
an aggregate sample. The three methods examined were Lightweight Pieces in Aggregate in accordance with AASHTO T 113,
NDR Visual Test, and The Determination of Clay Lumps, Shale, and Soft Particles in Coarse Aggregate and Crushed Rock, and of
Clay Lumps in Fine Aggregate and Sand-Gravel Aggregate in accordance to Nebraska’s T 504. Figure 6 shows the stockpile with
large amount of the lightweight pieces and figure 7 demonstrates the producers change in operation which resulted in a
cleaner aggregate.
Table 1 shows results for ASHTO T-113, NDR Visual Test, and NDR T 504 , the results are in percent lightweight particle by mass
weight.
Table 1- Percent Lightweight Pieces by Mass
Observations:
The comparison of the results between test methods showed that T 113 consistently had lower values than
the Visual test and slightly greater values than NDR T 504. As expected, T 113 was more consistent than
the other two tests, as the test has less subjectivity.
The deviation of the Visual Test was expected, as the test is highly subjective with results depending on
technician’s visual examination.
The deviations of NDR T 504 may be attributed to the absorptivity of the soft particles, which may vary
depending on the type of soft particles that are found in the sample.
Sample Identification
Lightweight Pieces
AASHTO T113
%
Not Standard
Visual Test
%
Soft Particles
NDR T504
%
Old Stockpile #1 1.60 2.7 1.51
Old Stockpile #2 1.70 5.0 2.22
Old Stockpile #3 1.40 1.9 0.83
New Stockpile #1 0.78 2.2 0.62
New Stockpile #2 1.10 3.0 0.55
Project Sample CA-307 1.10 NA 1.20
Figure 6. Old Stockpile Figure 7. New Stockpile

4 | P a g e
Standard Test Method Modification
The observations from Table 1, suggested that the percent composition of lightweight pieces was higher than the test results
suggested. Since the density of the lightweight pieces is lower than the density of the aggregate; mathematically, the percent
by mass would appear low compared to field observations. It was concluded that percent by mass was not an accurate method
of calculating the percent of lightweight pieces.
The principal investigator suggested that describing the composition of soft pieces as a percent by volume would be an
accurate way to calculate the percent composition, and would correlate with field observations. Therefore, the test was
performed by volume, as shown in Table 2.
Table 2 Percent Lightweight Pieces by Volume
Lab Identification
% Lightweight
Pieces
T 113
% Soft Particles
NDR T 504
Old Stockpile #1 4.57% 2.3%
Old Stockpile #2 10.20% NA
Old Stockpile #3 NA* NA
Old Stockpile #4 NA NA
New Stockpile #1 0.85% 1.0%
New Stockpile #2 NA NA
CA-307 NA NA
* (NA) not enough split sample to re-run the test.
It was found the percent of lightweight pieces by volume was higher than corresponding percent lightweight pieces by mass.
These results correlated with the field observations. In order to test the samples by volume, AASHTO T 113 was modified. The
test procedure describing the modification by volume can be found on the Material and Research website as a Modified
Nebraska (NDR) Standard Test Method of AASTHO T 113 Lightweight Pieces in Aggregate, as shown in Figure 8 and Figure 9.
The test method NDR T 113 calculation is expressed as a percentage of volume of pieces that float, to the total volume of the
fine or coarse aggregate sample. Therefore, all plus #
4 material is classified as coarse aggregate and all minus #
4 to plus #
50
Figure 8. NDR Standard Method T 113 Figure 9. NDR Standard Method T 113

5 | P a g e
is classified as fine aggregate. The following calculations of lightweight pieces are for the fine and coarse aggregate
respectability;
Calculation of Lightweight Pieces in Fine Aggregate as follows:
Calculation of Lightweight Pieces in Coarse Aggregate as follows:
Since there was such a large amount of lightweight pieces found on one project and the Department’s current specification did
not touch on this matter, the Department changed the Nebraska Standard Specifications for aggregates in Section 1033,
Paragraph 3.b (2) and (3), to address lightweight pieces in aggregates. Section 1033.02, Paragraph 3. b. (2) was replaced by the
following:
(2) The percent of clay lumps, shale, or soft particles shall not exceed the following amounts:
(3) Any combination of clay lumps, shale and soft particles (all percent by weight values) plus the lightweight pieces (a percent
by volume value) shall not exceed 3.5%.
The quality aggregate testing results will be reported separately for the fine and coarse aggregate and there shall be no more
than 3.5% lightweight pieces in accordance to NDR T 113 by volume. The cumulative percentage of clay, shale, soft particles
in accordance to NDR T 504 and NDR T 113 lightweight pieces shall not exceed 3.5%. Coarse aggregate test results will be
reported/calculated, as shown in Table 3.
The research done prior to the change in Specification (Table 2) shows the percent cumulative total for the plus #
4 materials.
Table 3. Coarse Aggregate Percent Cumulative Total
6 | P a g e
NDR T504* NDR T113
% Clay Lumps
(0.5% Max)
A
% Shale
(1.0% Max)
B
% Soft Particles
(3.5% Max)
C
% Lightweight Pieces
(3.5% Max)
D
% Cumulative Total of
A,B,C, & D (3.5% Max)
* In order to prevent double counting of lightweight pieces, material collected from the NDR T 504 shall be placed in the High Density Solution to
check for possibility of Lightweight pieces.
Table 4 shows the report for minus #
4 to plus #
50 material expressed in percentage, where there shall be no more than 3.5%
lightweight pieces per the Departments specification for the test method NDR T 113 which is done by volume.
Table 4. Fine Aggregate Percent Cumulative Total
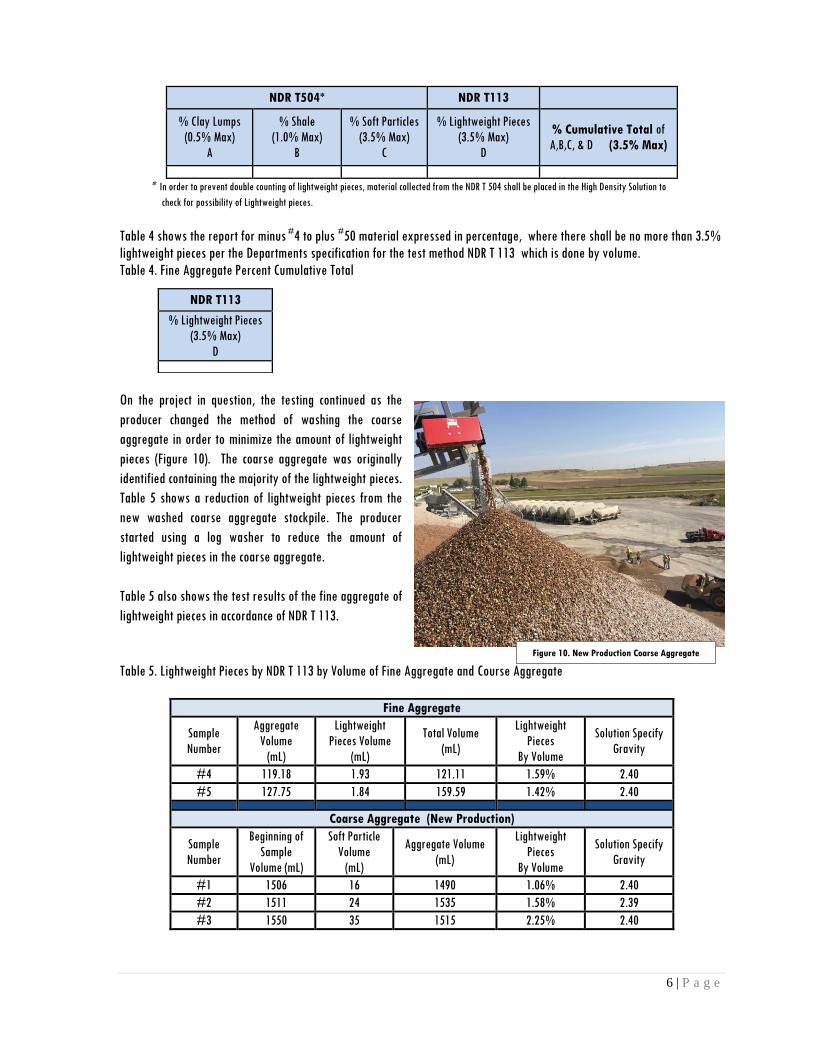
On the project in question, the testing continued as the
producer changed the method of washing the coarse
aggregate in order to minimize the amount of lightweight
pieces (Figure 10). The coarse aggregate was originally
identified containing the majority of the lightweight pieces.
Table 5 shows a reduction of lightweight pieces from the
new washed coarse aggregate stockpile. The producer
started using a log washer to reduce the amount of
lightweight pieces in the coarse aggregate.
Table 5 also shows the test results of the fine aggregate of
lightweight pieces in accordance of NDR T 113.
Table 5. Lightweight Pieces by NDR T 113 by Volume of Fine Aggregate and Course Aggregate
Fine Aggregate
Sample
Number
Aggregate
Volume
(mL)
Lightweight
Pieces Volume
(mL)
Total Volume
(mL)
Lightweight
Pieces
By Volume
Solution Specify
Gravity
#4 119.18 1.93 121.11 1.59% 2.40
#5 127.75 1.84 159.59 1.42% 2.40
Coarse Aggregate (New Production)
Sample
Number
Beginning of
Sample
Volume (mL)
Soft Particle
Volume
(mL)
Aggregate Volume
(mL)
Lightweight
Pieces
By Volume
Solution Specify
Gravity
#1 1506 16 1490 1.06% 2.40
#2 1511 24 1535 1.58% 2.39
#3 1550 35 1515 2.25% 2.40
NDR T113
% Lightweight Pieces
(3.5% Max)
D
Figure 10. New Production Coarse Aggregate
Stockpile

7 | P a g e
Since the mix design for this specific project was using 100% local aggregate, samples of both fine and coarse aggregate were combined
at the mix design ratio and split over the #4 sieve and tested according to NDR T 113 and NDR T 504. The results are provided in Table 6.
Note that NDR T 504 was not performed on the all plus #4 material for the fine (A1 & A2) due to the small particle size and inability to
accurately perform the test.
Table 6. The cumulative percentage of clay, shale, soft particles in accordance to NDR T 504 and NDR T 113 lightweight pieces
Material
NDR T 504
% Soft
Particles
NDR T 113
% Lightweight
Pieces
% Cumulative Total
(3.5% Max)
All Plus #4 from Fine A1 NA 0.8 0.8+0.6+0.91= 2.31
All Plus #4 Sample A1 0.6 0.91
All Plus #4 from Fine A2 NA 0.8 0.8+0.8+1.11= 2.71
All plus #4 Sample A2 0.8 1.11
Based on these test results, the samples tested meet the requirement for both lightweight pieces and the total combined percent of clay,
shale, soft particles, and lightweight pieces.
In August 2015, the research team performed a field evaluation on the concrete for the eastbound paving operation where some of the
high percentage of lightweight pieces was used (Figure 11). The test results of the field evaluation and laboratory testing are shown in
Table 7.
The work to evaluate the performance of lightweight pieces on concrete properties was based on the following;
Field Sampling & Testing:
1. Standard Test Method for Air Content of Freshly Mixed Concrete by the Pressure Method (ASTM C 231).
Testing Conducted in the Laboratory:
1. Standard Test Method for Microscopical Determination Parameters of the Air Void Analysis in Hardened Concrete
(ASTM C 457 – Method B)
2. Standard Test Method for Rapid Chloride Ion Penetration (AASHTO TP 65)
3. Standard Test Method for Resistance of Concrete to Rapid Freezing and Thawing (ASTM C 666)
4. Mechanical Properties:
i. Standard Test Method for Compressive Strength of Cylindrical Concrete Specimens (ASTM C39)
ii. Standard Test Method for Compressive Strength of Core Concrete Specimens (ASTM C42)
Figure 11. Paving Operation

8 | P a g e
Table 7. Mix Design and Test Results
Table 7 shows the majority of properties tested met the specification required with the exception of the NDOR Wet and Dry test and the
Freeze and Thaw test. The tests completed correlates quite well with the amounts of lightweight pieces found at the beginning of the
project (Old Stockpile) as shown in Tables 1 and 2. The initial testing showed that the amount of lightweight pieces were higher than 3.5%
which was found to be detrimental to the quality of concrete. Figure 12 shows a core taken from the section of pavement that had used
the higher percentage of lightweight pieces. Figure 13 shows the pavement surface after the grinding of bumps with a significant amount
of lightweight pieces at the surface.
Summary: Samples were collected from the field and evaluated from a project which started out with large amounts of lightweight particles. The
Department found the initial stockpile had an excess of 3.5% of lightweight particles which impacted the performance of the concrete
pavement in Phase I of the project. Therefore, the Department judged the coarse aggregate stockpile to be non-compliant due to injurious
quantities of deleterious materials. After the supplier had made changes to the production of the coarse aggregate, the Department
showed a reduction of the lightweight particles to a level that the Department considered acceptable. The pavement construction
continued as planned for the 2015 construction season. In an effort to determine a quantitative quality control method to evaluate the
effectiveness of lightweight particles and to develop quantitative acceptance criteria for the second phase of the project, the Department
developed the NDR T 113 “Lightweight Pieces in Aggregate” test method and modified the specifications of the current aggregate
acceptance criteria. The Department will continue the evaluation of the concrete placed during Phase I of the project which had high
amounts of lightweight particles and verify the long term performance of the pavement with Department’s new specification for
Perf
orm
ed
Mix Design
W/C
M r
atio
7 D
ays
Com
pres
sive
Stre
ngth
(psi
)
Cylin
der
28 d
ays
Com
pres
sive
Stre
ngth
(PSI
)
Core
Air
Con
tent
Fron
t Pav
er
Air
Con
tent
Behi
nd P
aver
ND
OR
Wet
& D
ry
18 M
onth
s
Perf
orm
ance
Tes
t
Free
ze &
Tha
w
(Per
cent
age)
Tota
l Har
dene
d
Air
Cou
nt
Perm
eabi
lity
NDOR’s Requirements Max
0.48 -
3500
min.psi
6.5%-
9.0% - -
Durability
>70% 300
cycles
- -
08/1
3/15
100% Sand & Gravel
Aggregate
S ½ Sec 13, T 13N, R-51 W
0.41 3500 4150 8.0% 5.2%
Showed
cracking
after 5
months
26% (Average of 3
samples)
4.71% Very
Low
08/2
8/20
15
0.40 4920 6710 8.7% 5.3%
Showed
cracking
after 5
months
30% (Average of 2
samples)
5.78% Very
Low
Figure 12. Old Production of Coarse Aggregate
Stockpile
Figure 13. Old Production of Coarse Aggregate
Stockpile
9 | P a g e
aggregate acceptance criteria allowing the following as acceptable material: Clay Lumps 0.5%, Shale 1.0%, Soft Particles 3.5% and
Lightweight Pieces 3.5% not exceeding accumulative value of 3.5% for quality testing of coarse aggregate. As well as, the quality of
lightweight particles in the fine aggregate not exceeding 3.5%.
References 1. AASTHO, 2015. Lightweight Pieces in Aggregate, T 113.
2. North Dakota Department of Transportation, 2015. ND T 113 Lightweight Pieces in Aggregate Standard Test Method.