field emission measurements of barge loading and … emission measurements of barge loading and...
TRANSCRIPT

Field Emission Measurements of Barge Loading and Unloading
Gregory E. Muleski and Chatten Cowherd, Jr.Midwest Research Institute, 425 Volker Boulevard, Kansas City, MO 64110
Thomas O'ConnorNational Grain and Feed Association, 1201 New York Avenue NW, Washington, DC 20005
ABSTRACT
Because of explosion hazards, much of the historical measurement database for grain elevators wasdeveloped to provide worst-case design criteria for dust collection devices (such as cyclones andbaghouses). However, from an air pollution aspect, it is the amount of dust that escapes from the elevatorand is released to the ambient atmosphere that is of interest. A 1995 testing program confirmed suspicionsthat prior factors severely overestimated the air pollution emissions from elevators and provided the basisfor the more accurate emission factors now in AP-42.
Tests discussed in this paper extend measurement methods applied at inland elevators to operationsinvolving barges and marine vessels, with the following objectives:
1. Develop scientifically defensible PM (uncontrolled) emission factors for grain handlingoperations involving barges and marine vessels.
2. Explore the effect that different operational features have on emission levels.
3. Collect information on the size distribution of PM emissions from barge/vessel operations.
Barges and marine vessels present significant challenges to successful field testing because of limitedspace in which to deploy equipment. As in 1995, this program required a coordinated planning processbetween the National Grain and Feed Association, its member companies, and EPA's Office of Air QualityPlanning and Standards.
INTRODUCTION
At present, the U. S. Environmental Protection Agency’s (EPA’s) guidance document Compilationof Air Pollutant Emission Factors1 (commonly referred to as “AP-42”) does not contain any emissionfactors referenced to barge and marine vessel operations. This paper describes a field-testing program todevelop particulate matter (PM) emission factors for grain handling operations involving barges andmarine vessels (ships).
The field program applied the same measurement methodology used in earlier field test programs atgrain facilities performed for both the U.S. Environmental Protection Agency (EPA) and the NationalGrain and Feed Foundation (NGFF). The tests for EPA were conducted in 1994 under an Emission

Measurement Center contract2 with Midwest Research Institute (MRI). Prior to the start of testing,representatives of EPA, MRI, private industry, the Nebraska Grain and Feed Association, and theNebraska Department of Environmental Quality met in Lincoln, Nebraska. A major focus of themeetings was formulation of general emission testing methodology that could be applied to grainelevator sources. In particular, the group sought to remove the bias toward overestimation evident in theAP-42 emission factors available at the time. Industry had expressed similar concerns through theNational Grain and Feed Association (NGFA) regarding the accuracy of and characterization ofemission estimates in AP-42.
The group recognized the need to distinguish between emission sources controlled with aspiratedcapture/collection systems and those not so equipped. For sources with aspirated systems, establishedEPA source testing methods can be used to determine PM concentrations from the control device. Themeasurements obtained using the EPA source testing methods reliably reflect (controlled) PM emitted tothe ambient atmosphere.
On the other hand, control device inlet measurements do not accurately reflect emissions fromuncontrolled sources because the suction applied by the control device pulls or strips additional dustfrom the grain stream. Thus, emission factors based on inlet measurements obtained using EPA-established testing methods suitable for control devices, are likely to be biased high for uncontrolledfugitive sources, as noted in the version of AP-42 Section 9.9.1 drafted in 19943.
After the 1994 scoping program, EPA's Emission Measurement Center instructed MRI to prepare a“generic” test plan4 that described testing strategies to develop grain emission factors for ambient airpollution purposes. The plan included test methods selected to best characterize the uncontrolled (i.e.,non-aspirated) emissions that escape the elevator building and contribute to ambient air particulateconcentrations. MRI applied these “generic” test strategies in a 1995 National Grain and FeedFoundation (NGFF) field testing program5 at inland elevators. The NGFF program comprised 54 testsconducted on four different grains and at three grain elevators. Testing relied on two basic equipmentdeployment schemes, one for 29 “external” source tests—such as receiving and shipping—and the otherfor the 25 “internal handling” sources. After extensive review, those tests now form the basis for almostall emission factors (rail and truck operations and internal headhouse sources) contained in AP-42 Table9.9.1-1.
Testing discussed in this paper represents an extension of the 1995 test program, with a focus on the"external" sources related to barge and vessel operations. Facilities located along navigable rivers loadbarges with grain for transfer to other river facilities including export facilities. The barges are usuallycovered with fiberglass or metal “fliptops” or with metal “rolltop” covers. Loading occurs through anopen hatch door. At the export facility, the entire barge cover is removed and the grain is unloaded witha marine leg bucket elevator or a continuous barge unloading (CBU) unit (such as those manufacturedby Heyl & Patterson, Link Belt, or others ).
The final handling step at an export facility loads grain into ships for overseas transport. Althoughseveral ship loading systems from different manufacturers are currently used in the industry, the majordistinctions deal with which portions of the system (typically far removed from the load-out point) that
are moveable. With reference to the load-out point directly above the open hold, there are two maintypes of spout geometry–inclined (“sloped”) spouts and vertical spouts.
DEVELOPMENT OF TEST MATRIX
The test program was designed to achieve the following objectives:
• Develop scientifically defensible PM (uncontrolled) emission factors for grain handlingoperations involving barges and marine vessels.
• Explore the effect that the following different operational features have on emission levels.
• Collect information on the size distribution of PM emissions from barge/vessel operations.
Overall guidelines applicable to each source operation of interest included:
• A test program following general guidelines6 for AP-42. Testing was conducted foruncontrolled sources. Thus, during test periods, control devices were to be deactivated.
• A test program that spanned common ranges of loading and unloading practices and equipment.
• A test program designed to identify potential differences in emissions during theloading/unloading cycles.
• Replicate tests.
Barge Loading Tests
For barge loading, it was important that testing take into account the following features:
• Sites along the upper and lower Mississippi River system were tested to account for anyoperational differences that might occur due to river heights or conditions.
• Testing of barge loading emissions focused on “fliptop” barges. “Rolltops” constitute arelatively small (and declining) fraction of barge covers in use. Rolltop barges are no longermanufactured for use in the grain industry due to their higher cost as well as operational andsafety concerns.
• Grain is typically loaded on barges by a spouting system fed by conveyors. This testingprogram considered a range of spout heights (approximately 20 to 40 ft) that typically occur inthe industry to account for potential variations in emissions due to this parameter.
• Because emissions may vary as the barge draft increases (i.e., depth of the barge in the water asa result of loading), testing was performed at the three points – a) near one end of the mostlyempty barge (early in the loading cycle); b) near the middle of the barge (roughly halfwaythrough the loading cycle); and c) near the other end of the mostly full barge (late in the loadingcycle).

• Because emissions may vary as the grain level rises beneath an individual door, testing wasconducted near the beginning and near the end of loading through a particular door.
Barge Unloading Tests
The barge unloading portion of the test program considered two types of systems commonly usedby the industry—the marine leg and CBU equipment. Because marine legs represent a small anddecreasing fraction of the equipment in use, more emphasis was placed on the CBU systems than onmarine legs.
Ship Loading Tests
The ship loading phase of the test program was designed to address the following points:
• Testing considered both types of loading spout geometry. Greater emphasis was placed onvertical spout systems than on sloped spouts because vertical spouts are used more frequentlyfor loading vessels.
• Because emissions may vary over the loading cycle, tests were conducted at different points inthe cycle: a) when the hold was mostly empty; b) when the hold was roughly half full; and c)near the end of the loading cycle.
Note that testing did not consider “topping-off” operations when the very last portion of grain wasplaced in the ship hold. In this way, test results are generally applicable throughout the loading cycle.Topping off represents only a very small fraction of the ship loading operation (typically the last 4 feetin a 50 to 60 foot deep ship hold). Wind interference during the topping off operation is likely togreatly hinder effective emission testing and the development of reliable test data. Furthermore, intopping off, the grain falls only a short distance and PM is emitted from only a small point rather thanover the entire horizontal area of the hold opening. To keep the sampling array close to the emissionpoint would require placing samplers within the hold area, which of course is impractical.
TEST METHODOLOGY
This program addressed "fugitive" emission sources that release air pollutants to the ambientatmosphere by means other than a stack, vent or duct. The exposure profiling concept represents ameasurement technique that is potentially applicable to any fugitive emission source, provided that thefollowing conditions are met:
1) Sampling equipment can be placed physically close to the source.
2) The contribution of the emission source can be isolated from upwind (background) levels of thepollutant.
3) There is sufficient air movement to convey the emitted pollutant to the sampling array.

The exposure profiling technique relies on simultaneous multipoint measurement of bothconcentration and air flow over the effective area of the emission plume in a mass flux measurementscheme. In this way, exposure profiling applies the same basic measurement concept as does traditionalstack sampling. In comparison to most stack sources, however, fugitive sources do not produceemissions that are thoroughly mixed in a well-defined, constant airflow. For these reasons, exposureprofiling cannot employ a single probe traversing the plume cross-sectional area.
Instead, the method relies on simultaneous multipoint sampling of mass concentration and airflowover the effective area of the emission plume because, unlike stack sources, both the emission rate andthe airflow are non-steady. Thus, the calculation scheme used with mass flux profiling requirescombining numerous measurements (concentration and air flow) taken at separated points to spatiallyencompass the plume. An integrated value of the measurements is used to represent total mass beingemitted by the source operation.
Because exposure profiling relies on ambient winds to transport the pollutant from the source to thesampling array, the measurement technique does not modify the source or affect the manner in which itwould normally operate. This situation should be compared to other measurement techniques thatattempt to: a) first enclose the fugitive source, b) actively evacuate the enclosure, and c) apply a stacksampling method to determine emission levels. Clearly, the enclosure affects the source by artificiallyshielding it from the ambient winds (which are known to influence material transfer emission levels).
FIELD TEST PROGRAM
Sixty emission tests were conducted during November and December 2000. Test site parametersfor the runs are provided in Tables 1, 2, and 3 for ship loading, barge unloading, and barge loading tests,respectively. These tables list the start time and duration of each test as well as the type of graininvolved and equipment used.
The exposure profiling method was applied to each of the three source categories. Owing to thedifferent source geometries, the method was adapted to reconcile the size of the emission source withthe space available for sampling equipment. Figure 1 illustrates the 2-dimensional sampling array usedto characterize ship loading emissions. The array consists of 6 high-volume PM-10 samplers deployedat two heights each at three positions along the downwind edge of the source. The array also includesR. M. Young Gill-type (model 27106) anemometers deployed at two heights to determine the windprofile. In addition to these two fixed-axis anemometers, an R. M. Young portable wind station (model05305) was used to record wind speed and direction at the 3.0 m height downwind. All wind data wereaccumulated into 5-min averages logged with a 26700 series R. M. Young programmable translator.
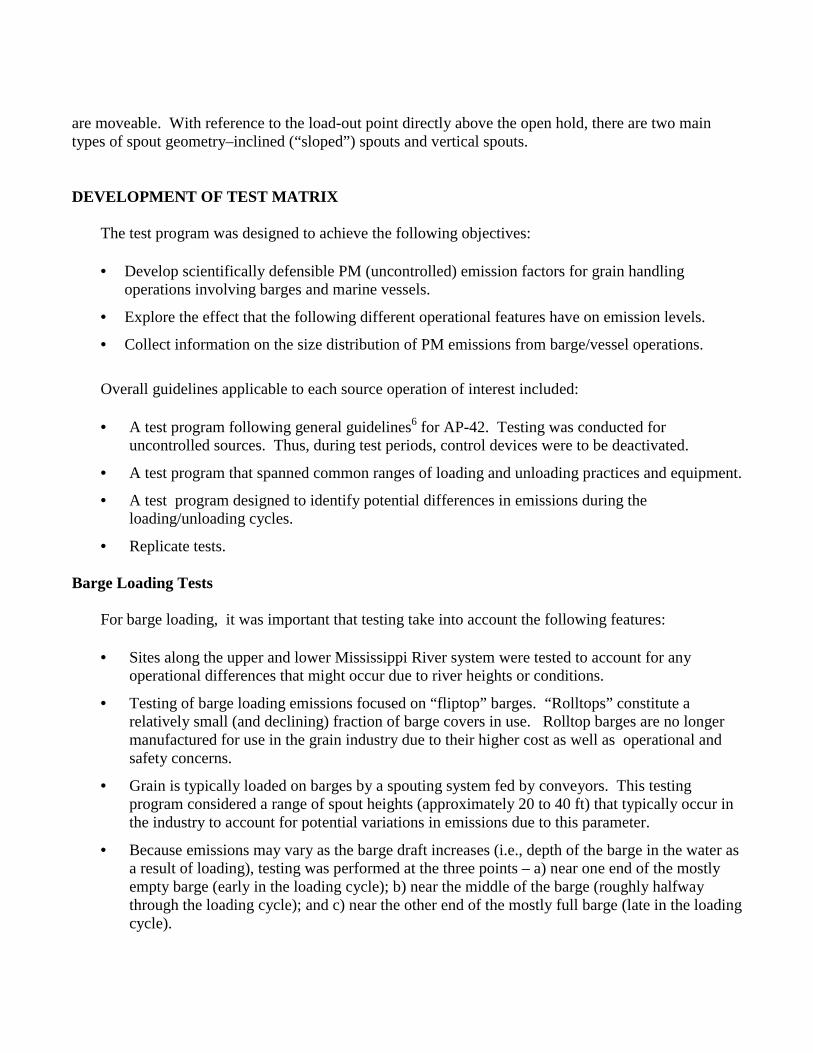
Figure 2 shows the equipment deployment for a typical barge loading test. Clearly, barges offeredfar less space to accommodate sampling equipment than did ships (Figure 1). Barge unloading testsrelied on an array of four PM-10 samplers arranged in a 2-dimensional array. Furthermore, because ofthe limited space available, wind speeds were monitored with two Davis vane anemometers. Compared

to the Gill anemometer, this device's compact size allows easier and safer deployment when only limitedspace is available.
Compared to uncovered barges and ship holds, an open hatch on a barge cover presents a muchsmaller emission source. Thus, the barge loading tests required a different sampling arrangement thandid the other two source categories. Figure 3 shows a typical barge loading emission test. In these tests,a channel (with two sides plus a top) was placed atop an open barge fliptop door Each channel wasopen to the wind and had a rectangular cross-sectional area of approximately 5 ft x 7 ft. Because of thesmall cross-sectional area, a single sampler was positioned at the center of each channel. Also, becauseof the limited space available, a Davis vane anemometer was used to measure air flow near the center ofthe opening.
At the time of this writing, data reduction of the November and December tests has not beencompleted. Additional details and results will be presented at the conference.
REFERENCES
1. Compilation of Air Pollutant Emission Factors. U. S. Environmental Protection Agency, ResearchTriangle Park, NC. AP-42.
2. Midwest Research Institute. "Tests of Oil Suppression of PM-10 at Grain Elevators," EPA ContractNo. 68-D2-0165, Work Assignment 2-32. November 1994.
3. Midwest Research Institute. "Emission Factor Documentation for AP-42 Section 9.9.1: GrainElevators and Grain Processing Facilities," EPA Contract No. 68-D2-0159, Work Assignment I-08.May 1994.
4. Midwest Research Institute. "PM-10 Test Strategies for Grain Elevators," EPA Contract No. 68-D2-0165, Work Assignments 1-30 and 2-32. January 1995.
5. Midwest Research Institute. "Emission Factors for Grain Elevators," MRI Project No. 3889 and4672. Prepared for National Grain and Feed Foundation. January 1997.
6. Procedures for Preparing Emission Factor Documents. U. S. Environmental Protection Agency,Research Triangle Park, NC. EPA-454/R-95-015. May 1997.

Table 1. Test Site Parameters – Ship Loading
Run DateLoading
Equipment Ship Name Graina Start TimeDuration
(min)
DD-01 11/7/00 Buehler Siletta No. 2 YC 11:10:30 10.00DD-02 11/7/00 Buehler Siletta No. 2 YC 12:14:30 21.00DD-03 11/7/00 Buehler Siletta No. 2 SRW 13:54:00 23.00DD-04 11/7/00 Buehler Siletta No. 2 SRW 14:42:15 12.00DD-05 11/7/00 Buehler Siletta No. 2 SRW 15:51:15 13.50DD-06 11/7/00 Buehler Siletta No. 2 SRW 16:27:30 9.00
DD-11 11/10/00 PECO Golden Harvest No. 2 YC 20:13:30 13.50DD-12 11/10/00 PECO Golden Harvest No. 2 YC 20:56:00 21.00DD-13 11/11/00 PECO Golden Harvest No. 2 YC 12:47:00 15.50DD-14 11/11/00 PECO Golden Harvest No. 2 YC 13:26:00 7.25DD-17 11/13/00 PECO Great Prestige No. 2 YC 16:52:00 15.00DD-18 11/13/00 PECO Great Prestige No. 2 YC 18:00:00 15.00
DD-21 11/19/00 Sloped spout Navios Mariner No. 2 YSB 15:07:45 15.00DD-22 11/19/00 Sloped spout Navios Mariner No. 2 YSB 15:55:00 12.75DD-23 11/19/00 Sloped spout Navios Mariner No. 2 YSB 16:25:00 22.75DD-24 11/19/00 Sloped spout Navios Mariner No. 2 YSB 18:40:15 16.00DD-25 11/19/00 Sloped spout Navios Mariner No. 2 YSB 19:23:00 13.50DD-26 11/19/00 Sloped spout Navios Mariner No. 2 YSB 20:08:15 17.50DD-27 11/20/00 Sloped spout Navios Mariner No. 2 YSB 11:50:30 18.00DD-28 11/20/00 Sloped spout Navios Mariner No. 2 YSB 12:30:30 12.00DD-29 11/20/00 Sloped spout Navios Mariner No. 2 YSB 13:13:45 14.00
a YC = yellow corn, SRW = soft red wheat, YSB = yellow soybean

Table 2. Test Site Parameters – Barge Unloading
Run DateUnloadingEquipment Barge No. Graina Start Time
Duration(min)
DD-101 11/8/00 Heyl Patterson ART 486 No 2 YC 14:16:00 10.50DD-102 11/8/00 Heyl Patterson ART 486 No 2 YC 14:38:15 10.75DD-103 11/8/00 Heyl Patterson ART 486 No 2 YC 15:07:00 10.25DD-104 11/9/00 Heyl Patterson ATM 2012 No 1 YC 10:13:45 14.50DD-105 11/9/00 Heyl Patterson ATM 2012 No 1 YC 10:48:45 11.25DD-106 11/9/00 Heyl Patterson ART 2012 No 1 YC 11:14:15 6.75
DD-111 11/12/00 Heyl Patterson CPD 9711 No. 2 YSB 12:54:00 5.00DD-112 11/12/00 Heyl Patterson CPD 9711 No. 2 YSB 13:14:00 4.50DD-113 11/12/00 Heyl Patterson CPD 9711 No. 2 YSB 13:29:30 5.50DD-114 11/12/00 Heyl Patterson CC 7832 No. 1 YSB 16:16:30 5.50DD-115 11/12/00 Heyl Patterson CC 7832 No. 1 YSB 16:38:45 10.25DD-116 11/12/00 Heyl Patterson CC 7832 No. 1 YSB 17:12:45 7.25
DD-121 11/15/00 Marine leg SUN 204 No. 3 YSB 12:30:30 2.50DD-122 11/15/00 Marine leg SUN 204 No. 3 YSB 12:54:00 2.50DD-123 11/15/00 Marine leg SUN 204 No. 3 YSB 13:09:30 2.50
a YC = yellow corn, YSB = yellow soybean

Table 3. Test Site Parameters – Barge Loading
Run Date Loading Cycle GrainaStartTime
Duration(min)
DD-201 11/30/00 Start No. 3 YSB 10:22:00 11.75DD-202 11/30/00 Start No. 3 YSB 10:38:45 9.75DD-203 11/30/00 Start No. 3 YSB 11:00:00 8.00DD-204 11/30/00 Start No. 3 YSB 11:21:00 11.00
DD-205 11/30/00 Middle No. 3 YSB 12:58:00 11.25DD-206 11/30/00 Middle No. 3 YSB b 7.25DD-207 11/30/00 Middle No. 3 YSB 13:49:00 7.75DD-208 11/30/00 Middle No. 3 YSB 14:04:00 7.25
DD-209 11/30/00 End No. 3 YSB 15:04:00 15.00DD-210 11/30/00 End No. 3 YSB 15:24:30 8.50DD-211 11/30/00 End No. 3 YSB 15:42:30 6.25DD-212 11/30/00 End No. 3 YSB 16:04:00 7.75
DD-221 12/2/00 Start No. 2 YC 9:05:00 10.50DD-222 12/2/00 Start No. 2 YC 9:23:15 6.75DD-223 12/2/00 Start No. 2 YC 10:00:00 7.50DD-224 12/2/00 Start No. 2 YC 10:13:00 3.00
DD-225 12/2/00 Middle No. 2 YC 11:49:00 7.50DD-226 12/2/00 Middle No. 2 YC 12:02:15 5.75DD-227 12/2/00 Middle No. 2 YC 12:30:00 6.00DD-228 12/2/00 Middle No. 2 YC 12:41:00 4.00
DD-229 12/2/00 End No. 2 YC 14:13:45 7.25DD-230 12/2/00 End No. 2 YC 14:25:00 7.00DD-231 12/2/00 End No. 2 YC 14:51:00 7.00DD-232 12/2/00 End No. 2 YC 15:03:15 7.75
a YC = yellow corn, YSB = yellow soybean
b Two start times because testing briefly interrupted due to unfavorable conditions.

Figure 1. Sampling array used for ship loading tests.
Figure 2. Sampler deployment for barge unloading tests.

Figure 3. Barge loading test.

Keywords
Grain dustBargeMarine vesselPM-10PM-2.5Fugitive dustEmission factor