journal of herbal drug -...
TRANSCRIPT

Refaat et al, Journal of Herbal Drugs, Vol. 5, No. 4: 193-207, 2015
193
Journal of Herbal Drug journal homepage: www.jhd.iaushk.ac.ir
Comparative polyphenol contents, free radical scavenging properties and
effects on adipogenesis of Chorisia Chodatii and Chorisia Speciosa
John Refaat1*, Samar Yehia Desoukey1, Mahmoud Ahmed Ramadan2, Mohamed Salah
Kamel1, Junkyu Han3,4 and Hiroko Isoda3,4
1Pharmacognosy Department, Faculty of Pharmacy, Minia University, 61519 Minia, Egypt;
2Pharmacognosy Department, Faculty of Pharmacy, Assiut University, 71515 Assiut, Egypt;
3Alliance for Research on North Africa (ARENA), Tsukuba University, 305-8572 Tsukuba, Japan;
4Graduate School of Life and Environmental Sciences, Tsukuba University, 305-8572 Tsukuba, Japan; *Email: [email protected]
ARTICLE INFO ABSTRACT
Background & Aim: Chorisia is an important Bombacaceous plant that is
traditionally used for a variety of ailments. Due to its richness in several
bioactive phytocompounds, some Chorisia species showed a wide range of
important biological effects. Accordingly, the present work was undertaken
to comparatively evaluate the antioxidant potential and effects on
adipogenesis of Chorisia chodatii Hassl. and Chorisia speciosa A. St.-Hil.
in relation to their phenolic contents.
Experimental: Total polyphenol contents and free radical scavenging
potentials of the total ethanol extracts of leaves, flowers, fruits and seeds of
both species, in addition to four main fractions of their leaf and flower
extracts, were evaluated using the Folin-Ciocalteu's method and the DPPH
assay, respectively. Besides, their effects on adipogenesis were studied
using the 3T3-L1 preadipocytes model. A phytochemical screening of their
different phytoconstituents was also considered.
Results & Discussion: Total ethanol extracts along with their successive
fractions of various parts of both species caused a concentration-dependent
induction of 3T3-L1 preadipocytes differentiation, but with a noticeable
reduction of the size of the lipid droplets at the lower concentrations 5 and
10 µg/ml. In addition, these extracts showed a strong evidence of their
richness in free radical scavengers. The ethyl acetate, aqueous and
chloroform fractions of different plant parts exhibited the greatest effects on
adipogenesis, substantial free radical scavenging properties and the highest
polyphenol contents, respectively.
Industrial and practical recommendations: Results collectively revealed
that the observed effects of both Chorisia species on adipogenesis as well
as their anti-radical properties are positively related to their pool of
flavonoids and other phenolics. They also suggest their potential value in
obesity-related disorders and for prevention of free radical mediated
diseases. Further studies for investigating the molecular basis of their
effects on adipogenesis accompanied by detailed phytochemical analysis,
especially of their polar and flavonoids-rich extracts, will also be strongly
recommended.
Type: Original Research
Topic: Medicinal Plants
Received November 27th 2014
Accepted April 10th 2015
Key words:
Adipogenesis
Antioxidant
Bombacaceae
Chorisia
Polyphenols
3T3-L1 cells
Refaat et al, Journal of Herbal Drugs, Vol. 5, No. 4: 193-207, 2015
194
1. Introduction
Oxidative stress represents a common and threatening
health theme that is associated with pathogenic
mechanisms of many degenerative diseases including
aging, arthritis, neurodegeneration, Alzheimer's,
atherosclerosis, cancer and inflammatory disorders
(Miller and Rice-Evans, 1997; Polterait, 1997). Free
radicals produced on disturbance of normal redox state
in biological systems can harmfully attack several
biomolecules like proteins, lipids and DNA resulting in
cell membrane damage due to lipid peroxidation, a
decrease in membrane fluidity and DNA mutations
leading to cancer (Pietta, 2000). Moreover, these
reactive oxygen species activate the nuclear factor-κB,
a nuclear transcription factor, resulting in an up-
regulation of pro-inflammatory mediators such as
interleukin-1, interleukin-8 and TNF-α. This in turn
stimulates the immune response, increases oxidants'
production and can lead to further tissue damage
(Grimble, 1994). Potent scavengers of these free radical
species may serve as a possible preventive intervention
for free radical mediated diseases (Ames et al., 1995).
Since the well-known synthetic antioxidants; butylated
hydroxyanisole (BHA) and butylated hydroxytoluene
(BHT) are reported to provoke some degree of
carcinogenicity, current research efforts are devoted to
evaluate the free radical scavenging potentials of
medicinal plants as a logic strategy for development of
new safe antioxidants of natural origin (Ito et al.,
1982).
On the other hand, obesity is another global health
problem and a worldwide epidemic that is described as
a chronic metabolic disorder caused by an imbalance
between energy intake and expenditure (Roh and Jung,
2012). It represents a major risk factor for a number of
health disorders including type-2 diabetes,
hypertension, hyperlipidemia, osteoarthritis, asthma,
cancer and cardiovascular diseases (Lee et al., 2005).
The World Health Organization estimates that by 2020,
two-thirds of the global disease burden will be
attributable to chronic diseases associated with obesity
(Chopra et al., 2002). Obesity is produced by an
increase in adipose tissue mass which results from the
multiplication of fat cells through adipogenesis and the
increased deposition of cytoplasmic triglycerides
(Lefterova and Lazar, 2009). Physiologically,
adipogenesis is described as the process by which
undifferentiated preadipocytes are converted to fully
differentiated adipocytes (Otto and Lane, 2005). That's
why; the size of adipose tissue mass is a function of
both adipocyte number and size. An increase in adipose
tissue mass can result from hyperplastic growth which
occurs primarily by mitotic activity in precursor cells
or by hypertrophic growth which occurs mainly by
lipid accumulation within the cell (Johnson and
Greenwood, 1988). Development of obesity is also
regulated by genetic, endocrine, metabolic,
neurological, pharmacological, environmental and
nutritional factors (Farmer and Auwerx, 2004). 3T3-L1
preadipocytes cell line is one of the most reliable
models to study the events during conversion of
preadipocytes into mature adipocytes. During terminal
differentiation, the fibroblast-like preadipocytes
undergo a series of morphological and biochemical
changes to eventually accumulate lipid droplets.
Besides, the in vitro differentiation of fat cells
recapitulates most of the characteristic features of in
vivo adipogenesis including morphological change,
growth arrest, high expression of lipogenic genes and
production of hormones like leptin, resistin and TNF-α
(Kirkland et al., 1990). As a sleeping giant for drug
development, a variety of natural products including
crude extracts and isolated phytocompounds from
plants can induce body weight reduction and prevent
diet-induced obesity by different mechanisms,
therefore, they have been widely tested for their anti-
obesity potentials (Yun, 2010).
Chorisia (Syn. Ceiba (Ravenna, 1998)) is a genus
of deciduous trees belongs to family Bombacaceae and
comprises about twenty species. They are commonly
known as silk floss, drunken or bottle trees (Bailey,
1976; Huxley, 1992). These plants are traditionally
used for many disorders e.g. headache, fever, diabetes,
diarrhoea, parasitic infections, hypertension, mental
troubles, peptic ulcer, rheumatism and asthma
(Adjanohoun, 1988; Ngounou et al., 2000). A few
number of Chorisia species were subjected to
phytochemical analyses that yielded a number of
flavonoids, anthocyanins, sterols, triterpenes and
carbohydrates (Refaat et al., 2013). It was also reported
that some Chorisia species showed a wide range of
useful anti-inflammatory, hepatoprotective, cytotoxic,
antioxidant, hypoglycaemic and antimicrobial effects
with high safety margins and LD50 up to 7-8 g/kg in lab
animals (Hafez et al., 2003; Hassan, 2009; El-Alfy et
al., 2010; Ashmawy et al., 2012). Consequently, this

Refaat et al, Journal of Herbal Drugs, Vol. 5, No. 4: 193-207, 2015
195
study was designed to comparatively investigate, for
the first time, the effects of different extracts and
fractions of various plant parts of Chorisia chodatii
Hassl. (CC) and Chorisia speciosa A. St.-Hil. (CS) on
lipogenesis during differentiation of 3T3-L1 cells and
their antioxidant properties in relation to their total
polyphenol contents. In addition, a preliminary
qualitative analysis of their phytochemicals was also
considered.
2. Materials and Methods
2.1. Plant Material
Leaves, flowers, fruits and seeds of both CC and CS
were collected from plants cultivated in the campus of
Minia University, Minia, Egypt. Flowers of both
species were collected in October 2009; leaves were
collected before the next flowering stage in July 2010,
whereas their fruits and seeds were collected in April
2011. Botanical authentication of both plants was
confirmed by Prof. Ahmed Abdel-Monem, Department
of Horticulture, Faculty of Agriculture, Minia
University, Minia, Egypt. Voucher specimens [Mn-Ph-
Cog-001 (for CC) and Mn-Ph-Cog-002 (for CS)] were
deposited in the herbarium of Pharmacognosy
Department, Faculty of Pharmacy, Minia University.
2.2. Chemicals and Reagents
Different chemicals and solvents used for
extraction, fractionation and phytochemical screening
procedures were purchased from El-Nasr Company for
Pharmaceuticals and Chemicals, A.R.E. Dulbecco's
modified Eagle's medium (DMEM) (no. RNBC 4111)
and 0.25% Trypsin-EDTA solution (no. SLBC1657)
were obtained from Sigma Chemical Co, St. Louis,
MO, USA. Adipogenesis assay kit (no. 10006908) was
obtained from Cayman Chemicals (Ann. Arbor, MI,
USA). Penicillin (5000 units/ml) / streptomycin (5000
μg/ml) (PS) (no. 17-603E) was obtained from Lonza
Walkersville, MD, USA. Trypan blue (no. 1525-061)
and fetal bovine serum (FBS) (no. 10437-028) were
obtained from Gibko, USA. DMSO (no. 046-21981),
ethanol (for samples dilution and preparation of
reagents, no. 057-00456), gallic acid monohydrate (no.
070-00122), 2,2-diphenyl-1-picrylhydrazyl (DPPH)
(no. ALJ 4179), and Folin-Ciocalteu reagent (no. 279-
08895) were purchased from Wako Pure Chemical
Industries, Japan. Sodium carbonate (no. 28-2170-5)
was obtained from Sigma-Aldrich, USA. Trolox (no.
440-1102-752) was purchased from Calbiochem,
Denmark. Morpholinoethanesulfonic acid monohydrate
(MES) (no. 349-01623) was obtained from Dojindo,
Japan.
2.3. Preparation of total extracts and different
fractions
The air-dried organs of both species were reduced
to coarse powders and macerated separately in ethanol
(70%). The ethanol solutions were then concentrated
independently under reduced pressure at 40°C to a
syrupy consistency. The solvent-free residues of total
extracts of CC flowers and leaves, in addition to that of
CS flowers were separately suspended in distilled water
and subjected to exhaustive fractionation steps using
light petroleum ether, chloroform and ethyl acetate,
successively. The organic layer in each step was
collected and concentrated independently to give the
corresponding fraction, whereas the aqueous fractions
were obtained by concentration of the remaining
mother liquor for each plant part (Table 1). Each total
extract and fraction (10 mg) was separately dissolved
in 500 µl DMSO to prepare a stock solution of 20
mg/ml and stored at 4°C.
2.4. Phytochemical screening
Different extracts and fractions of CC and CS were
tested for presence of carbohydrates and/or glycosides,
alkaloids and/or nitrogenous compounds, flavonoids,
anthocyanins, quinones, coumarins, steroids,
triterpenoids, saponins, cardenolides, tannins and
proteins. Phytochemical screening was performed
using chemical methods and thin layer chromatography
according to the standard procedures (Trease and
Evans, 1989; Wagner and Bladht, 1996).
2.5. Determination of total polyphenol content
Total phenolic contents were determined using
Folin-Ciocalteu's reagent according to the method
described by Lister and Wilson (2001). Five
concentrations of each sample (50, 100, 150, 250 and
500 µg/ml) were prepared by suitable dilution of the
initially prepared stock solutions with ethanol. Gallic
acid (at 0, 60, 180 and 300 µM) was used as a standard,
and results were expressed in terms of gallic acid
equivalence (GAE) in µM. Solutions of various gallic
acid concentrations (50 µl/well) and those of the tested
samples (25 µl/well, diluted with an equal volume of
Refaat et al, Journal of Herbal Drugs, Vol. 5, No. 4: 193-207, 2015
196
Milli-Q water) were oxidized with 50 µl/well of Folin-
Ciocalteu's reagent [diluted with Milli-Q water (1:1)].
After incubation for 3 min at room temperature, 50 µl
of 10% aqueous sodium carbonate solution were added
to all wells. The 96-well plates were allowed to stand in
the dark at room temperature for 30 min and the
absorbances were then read at 750 nm using a
microplate reader (Dainippon Pharmaceutical, Osaka,
Japan). Analyses were done in three replicates.
2.6. DPPH free radical scavenging assay
The free radical scavenging ability of the extracts
was tested by DPPH radical scavenging assay as
described by Blois (1958). Sample stock solutions were
diluted to final concentrations of 50, 100, 150, 250 and
500 µg/ml in ethanol. Trolox (at 600, 800, 1000, 1200
and 1400 µM) was used as a positive standard and
results were expressed in terms of trolox equivalence in
µM. Two working solutions (WS) containing MES,
ethanol and Milli-Q water either with DPPH (for WS+)
or without (for WS-) were prepared. For each 96-well
plate, a set of wells containing 10 µl/well of each trolox
concentration or the tested sample was treated with 190
µl/well of (WS+), whereas another equivalent set
containing 10 µl/well of each trolox concentration or
the tested sample was treated with 190 µl/well of (WS-
). A negative control was represented by a mixture of
(WS-, 190 µl/well) and ethanol (10 µl/well). The plates
were incubated in dark at room temperature for 3 min
and the absorbances were then read at 520 nm using a
microplate reader (Dainippon Pharmaceutical, Osaka,
Japan). Tests were carried out in triplicates.
2.7. Cell Culture
3T3-L1 preadipocytes (Riken Cell Bank, Ibaraki,
Japan) were grown to confluence in maintenance
medium comprised of DMEM supplemented with 10%
FBS and 5% penicillin/streptomycin and incubated at
37°C in 5% CO2.
2.8. Adipogenesis Assay
Based on the standard protocol (Erding et al.,
1996), an equal concentration of 3T3-L1 cells (3 x 10⁵
cells/ml) was used for seeding of 96-well plates. Two
days post confluence (Day 0), preadipocyte
differentiation was initiated using adipogenesis assay
kit by changing the maintenance medium to induction
medium containing the adipogenic cocktail; 3-
isobuthyl-1-methylxanthine (IBMX), dexamethasone
and insulin (10 µl of each in 10 ml DMEM
supplemented with 10% FBS for each plate). This
induction medium was used for differentiation of the
control group (positive control), whereas the same
medium containing the tested sample was used for the
treatment groups. On day 3, the induction medium was
replaced with insulin medium (10 µl insulin in 10 ml
DMEM containing 10% FBS for each plate) for the
control group or insulin medium containing the tested
sample for the treatment groups. Five days after
induction (Day 5), the medium was replaced with fresh
insulin medium (for the control group) or insulin
medium containing the tested sample (for the treatment
groups). The accumulation of lipid droplets was
monitored by day 7 under the microscope. A group of
undifferentiated preadipocytes served as the negative
control throughout the various steps of the test. Four
concentrations (5, 10, 50 and 100 µg/ml) of each
sample were prepared by suitable dilution of the initial
stock solutions with the induction or insulin medium
according to each step. Cells were incubated at 37°C
with 5% CO2 throughout different stages of the
experiment.
2.9. Staining of lipid droplets and quantification
After accumulation of lipid droplets, the
differentiated cells were fixed with diluted lipid
droplets assay fixative (75 µl/well) and incubated for
15 min at room temperature. The fixative was then
washed out with a wash solution (two times for 5 min,
100 µl/well). After complete drying, cells were stained
with Oil Red O dye (75 µl/well) for 20 min at room
temperature. The unbound stain was washed out
several times with distilled water and again with a wash
solution (two times for 5 min, 100 µl/well).
Microscopic images of fat accumulation were then
captured at this point. After complete drying, the bound
dye was eluted using dye extraction solution (100
µl/well) with gentle shaking for 15-30 min. The
absorbances were then read at 490 nm using a
microplate reader (Dainippon Pharmaceutical, Osaka,
Japan).
2.10. Statistical Analysis
Results were expressed as mean ± standard
deviation. The significance of data was evaluated using
Student’s t-test for comparison between two groups.
The values of p < 0.05 and p < 0.01 versus control were
considered statistically significant.
Refaat et al, Journal of Herbal Drugs, Vol. 5, No. 4: 193-207, 2015
197
3. Results and discussion
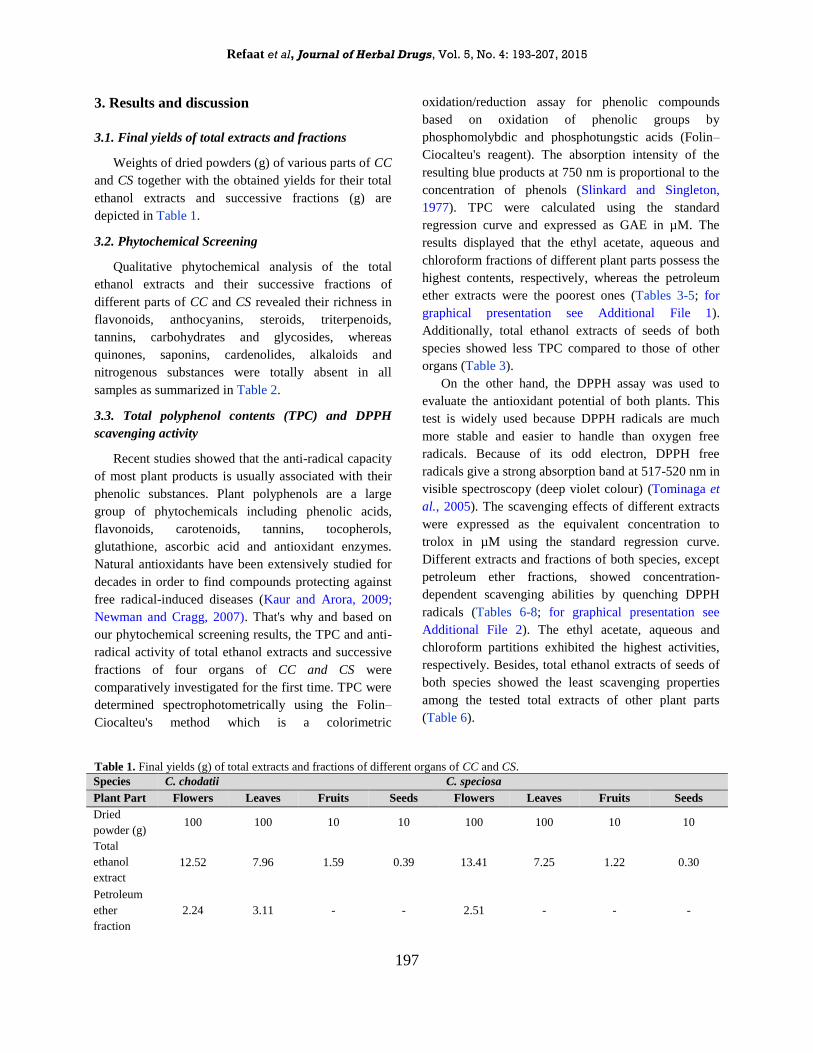
3.1. Final yields of total extracts and fractions
Weights of dried powders (g) of various parts of CC
and CS together with the obtained yields for their total
ethanol extracts and successive fractions (g) are
depicted in Table 1.
3.2. Phytochemical Screening
Qualitative phytochemical analysis of the total
ethanol extracts and their successive fractions of
different parts of CC and CS revealed their richness in
flavonoids, anthocyanins, steroids, triterpenoids,
tannins, carbohydrates and glycosides, whereas
quinones, saponins, cardenolides, alkaloids and
nitrogenous substances were totally absent in all
samples as summarized in Table 2.
3.3. Total polyphenol contents (TPC) and DPPH
scavenging activity
Recent studies showed that the anti-radical capacity
of most plant products is usually associated with their
phenolic substances. Plant polyphenols are a large
group of phytochemicals including phenolic acids,
flavonoids, carotenoids, tannins, tocopherols,
glutathione, ascorbic acid and antioxidant enzymes.
Natural antioxidants have been extensively studied for
decades in order to find compounds protecting against
free radical-induced diseases (Kaur and Arora, 2009;
Newman and Cragg, 2007). That's why and based on
our phytochemical screening results, the TPC and anti-
radical activity of total ethanol extracts and successive
fractions of four organs of CC and CS were
comparatively investigated for the first time. TPC were
determined spectrophotometrically using the Folin–
Ciocalteu's method which is a colorimetric
oxidation/reduction assay for phenolic compounds
based on oxidation of phenolic groups by
phosphomolybdic and phosphotungstic acids (Folin–
Ciocalteu's reagent). The absorption intensity of the
resulting blue products at 750 nm is proportional to the
concentration of phenols (Slinkard and Singleton,
1977). TPC were calculated using the standard
regression curve and expressed as GAE in µM. The
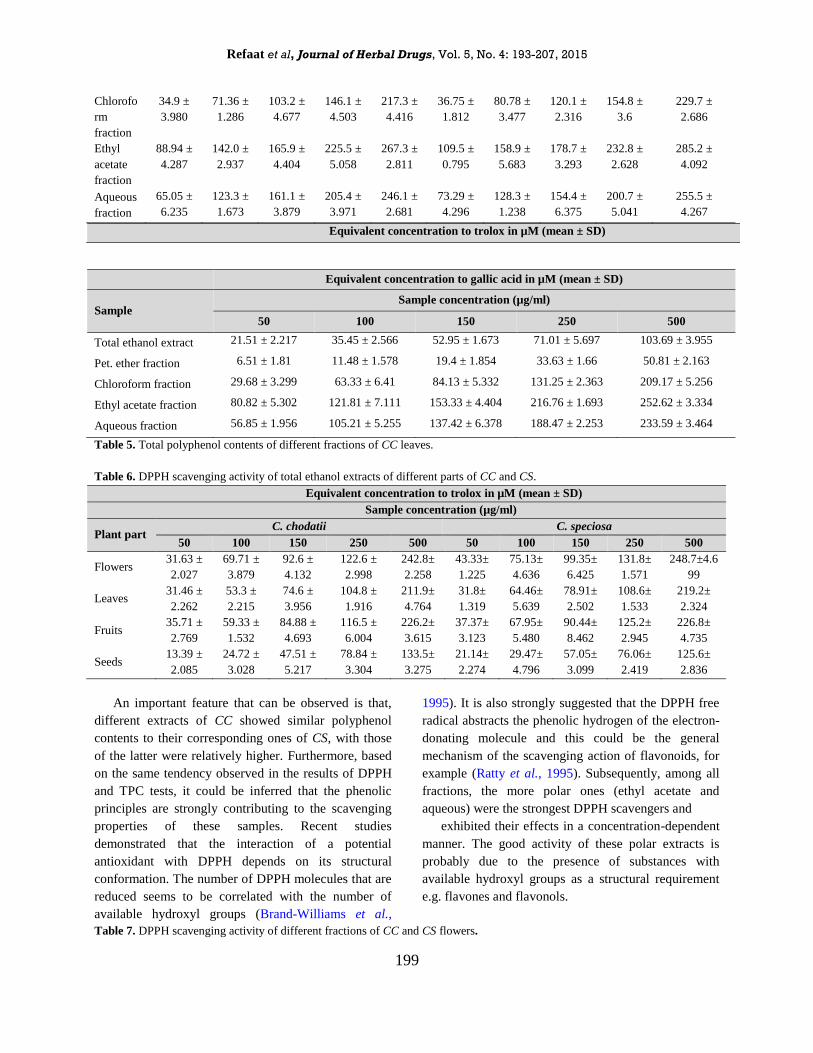
results displayed that the ethyl acetate, aqueous and
chloroform fractions of different plant parts possess the
highest contents, respectively, whereas the petroleum
ether extracts were the poorest ones (Tables 3-5; for
graphical presentation see Additional File 1).
Additionally, total ethanol extracts of seeds of both
species showed less TPC compared to those of other
organs (Table 3).
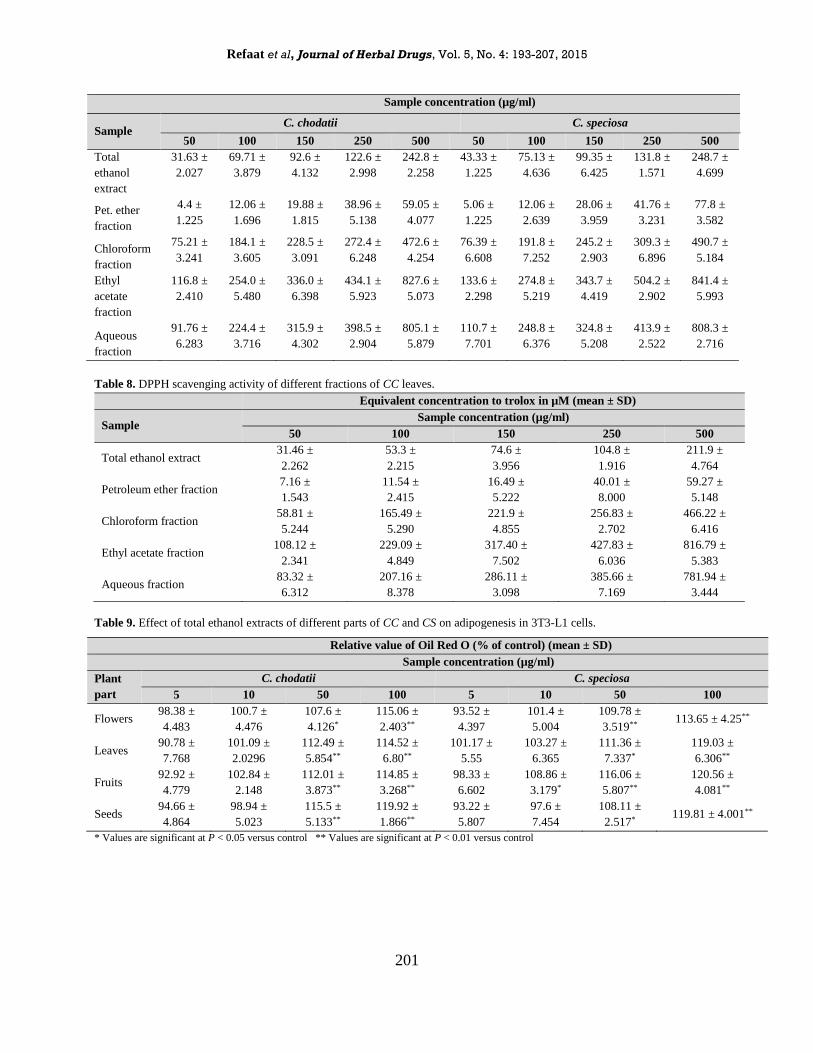
On the other hand, the DPPH assay was used to
evaluate the antioxidant potential of both plants. This
test is widely used because DPPH radicals are much
more stable and easier to handle than oxygen free
radicals. Because of its odd electron, DPPH free
radicals give a strong absorption band at 517-520 nm in
visible spectroscopy (deep violet colour) (Tominaga et
al., 2005). The scavenging effects of different extracts
were expressed as the equivalent concentration to
trolox in µM using the standard regression curve.
Different extracts and fractions of both species, except
petroleum ether fractions, showed concentration-
dependent scavenging abilities by quenching DPPH
radicals (Tables 6-8; for graphical presentation see
Additional File 2). The ethyl acetate, aqueous and
chloroform partitions exhibited the highest activities,
respectively. Besides, total ethanol extracts of seeds of
both species showed the least scavenging properties
among the tested total extracts of other plant parts
(Table 6).
Table 1. Final yields (g) of total extracts and fractions of different organs of CC and CS.
Species C. chodatii C. speciosa
Plant Part Flowers Leaves Fruits Seeds Flowers Leaves Fruits Seeds
Dried
powder (g) 100 100 10 10 100 100 10 10
Total
ethanol
extract
12.52 7.96 1.59 0.39 13.41 7.25 1.22 0.30
Petroleum
ether
fraction
2.24 3.11 - - 2.51 - - -

Refaat et al, Journal of Herbal Drugs, Vol. 5, No. 4: 193-207, 2015
198
Chloroform
fraction 0.23 0.21 - - 0.29 - - -
Ethyl
acetate
fraction
0.78 0.37 - - 0.83 - - -
Aqueous
fraction 8.51 3.92 - - 8.93 - - -
Table 2. Qualitative analysis of phytochemicals in total extracts and fractions of CC and CS *.
Species C. chodatii C. speciosa
Extract Flowers Leaves Fruits Seeds Flowers Leaves Fruits Seeds
Total ethanol
extract
F, A, St, Tr,
T, Co, G, C,
Pr
F, A, St, Tr,
T, Co, G, C
F, A, St, Tr,
T, Co, G, C,
Pr
F, A, St, Tr,
T, Co, G, C,
Pr
F, A, St, Tr,
T, Co, G, C,
Pr
F, A, St, Tr,
T, Co, G, C
F, A, St, Tr,
T, Co, G, C,
Pr
F, A, St, Tr,
T, Co, G, C,
Pr
Pet. ether
fraction
St, Tr St, Tr NT NT St, Tr NT NT NT
CHCl3 fraction F, Co, St F, Co, St NT NT F, Co, St NT NT NT
EtOAc fraction F, Co, G F, Co, G NT NT F, Co, G NT NT NT
Aqueous
fraction
F, A, T, G,
C, Pr
F, A, T, G,
C
NT NT F, A, T, G,
C, Pr
NT NT NT
* Phytoconstituents with positive results in different screening tests were only recorded for each sample. F: flavonoids, A: anthocyanins, St:
steroids, Tr: triterpenoids, T: tannins, Co: coumarins, G: glycosides, C: carbohydrates, Pr: proteins, NT: not tested.
Table 3. Total polyphenol contents of total ethanol extracts of different parts of CC and CS.
GAE in µM (mean ± SD)
Sample concentration (µg/ml)
Plant
part
C. chodatii C. speciosa
50 100 150 250 500 50 100 150 250 500
Flowers 30.36 ±
4.177
52.01 ±
2.928
65.36 ±
4.231
86.10 ±
4.988
120.2 ±
4.344
31.70±
2.815
58.76 ±
5.123
74.82 ±
2.995
104.9 ±
3.983
127.81 ±
3.24
Leaves
21.51 ±
2.217
35.45 ±
2.566
52.95 ±
1.673
71.01 ±
5.697
103.6 ±
3.955
16.38±
4.399
42.57 ±
4.045
71.93 ±
3.252
86.18 ±
1.473
110.12 ±
1.505
Fruits
21.07 ±
1.615
36.33 ±
4.058
65.47 ±
3.679
78.66 ±
2.330
109.8 ±
5.076
24.12±
1.798
52.01 ±
2.964
66.33 ±
5.629
87.65 ±
3.192
115.7 ±
4.134
Seeds
11.20 ±
1.263
21.32 ±
1.082
25.16 ±
3.286
54.48 ±
3.156
87.83 ±
3.855
13.66 ±
1.774
22.67 ±
1.723
30.64 ±
3.923
61.46 ±
3.101
87.75 ±
4.895
Table 4. Total polyphenol contents of different fractions of CC and CS flowers.
Equivalent concentration to gallic acid in µM (mean ± SD)
Sample concentration (µg/ml)
Sample C. chodatii C. speciosa
50 100 150 250 500 50 100 150 250 500
Total
ethanol
extract
30.36 ±
4.177
52.01 ±
2.928
65.36 ±
4.231
86.10 ±
4.988
120.3 ±
4.344
31.70 ±
2.815
58.76 ±
5.123
74.82 ±
2.995
104.9 ±
3.983
127.8 ± 3.24
Pet.
ether
fraction
9.099 ±
1.525
11.51 ±
1.254
18.57 ±
0.874
31.51 ±
1.543
59.51 ±
2.430
6.41 ±
1.859
11.74 ±
1.87
16.57 ±
3.821
32.69 ±
3.46
65.01 ±
3.799
Refaat et al, Journal of Herbal Drugs, Vol. 5, No. 4: 193-207, 2015
199
Table 5. Total polyphenol contents of different fractions of CC leaves.
Table 6. DPPH scavenging activity of total ethanol extracts of different parts of CC and CS.
Equivalent concentration to trolox in µM (mean ± SD)
Sample concentration (µg/ml)
Plant part C. chodatii C. speciosa
50 100 150 250 500 50 100 150 250 500
Flowers 31.63 ±
2.027
69.71 ±
3.879
92.6 ±
4.132
122.6 ±
2.998
242.8±
2.258
43.33±
1.225
75.13±
4.636
99.35±
6.425
131.8±
1.571
248.7±4.6
99
Leaves 31.46 ±
2.262
53.3 ±
2.215
74.6 ±
3.956
104.8 ±
1.916
211.9±
4.764
31.8±
1.319
64.46±
5.639
78.91±
2.502
108.6±
1.533
219.2±
2.324
Fruits 35.71 ±
2.769
59.33 ±
1.532
84.88 ±
4.693
116.5 ±
6.004
226.2±
3.615
37.37±
3.123
67.95±
5.480
90.44±
8.462
125.2±
2.945
226.8±
4.735
Seeds 13.39 ±
2.085
24.72 ±
3.028
47.51 ±
5.217
78.84 ±
3.304
133.5±
3.275
21.14±
2.274
29.47±
4.796
57.05±
3.099
76.06±
2.419
125.6±
2.836
An important feature that can be observed is that,
different extracts of CC showed similar polyphenol
contents to their corresponding ones of CS, with those
of the latter were relatively higher. Furthermore, based
on the same tendency observed in the results of DPPH
and TPC tests, it could be inferred that the phenolic
principles are strongly contributing to the scavenging
properties of these samples. Recent studies
demonstrated that the interaction of a potential
antioxidant with DPPH depends on its structural
conformation. The number of DPPH molecules that are
reduced seems to be correlated with the number of
available hydroxyl groups (Brand-Williams et al.,
1995). It is also strongly suggested that the DPPH free
radical abstracts the phenolic hydrogen of the electron-
donating molecule and this could be the general
mechanism of the scavenging action of flavonoids, for
example (Ratty et al., 1995). Subsequently, among all
fractions, the more polar ones (ethyl acetate and
aqueous) were the strongest DPPH scavengers and
exhibited their effects in a concentration-dependent
manner. The good activity of these polar extracts is
probably due to the presence of substances with
available hydroxyl groups as a structural requirement
e.g. flavones and flavonols.
Table 7. DPPH scavenging activity of different fractions of CC and CS flowers.
Chlorofo
rm
fraction
34.9 ±
3.980
71.36 ±
1.286
103.2 ±
4.677
146.1 ±
4.503
217.3 ±
4.416
36.75 ±
1.812
80.78 ±
3.477
120.1 ±
2.316
154.8 ±
3.6
229.7 ±
2.686
Ethyl
acetate
fraction
88.94 ±
4.287
142.0 ±
2.937
165.9 ±
4.404
225.5 ±
5.058
267.3 ±
2.811
109.5 ±
0.795
158.9 ±
5.683
178.7 ±
3.293
232.8 ±
2.628
285.2 ±
4.092
Aqueous
fraction
65.05 ±
6.235
123.3 ±
1.673
161.1 ±
3.879
205.4 ±
3.971
246.1 ±
2.681
73.29 ±
4.296
128.3 ±
1.238
154.4 ±
6.375
200.7 ±
5.041
255.5 ±
4.267
Equivalent concentration to gallic acid in µM (mean ± SD)
Sample Sample concentration (µg/ml)
50 100 150 250 500
Total ethanol extract 21.51 ± 2.217 35.45 ± 2.566 52.95 ± 1.673 71.01 ± 5.697 103.69 ± 3.955
Pet. ether fraction 6.51 ± 1.81 11.48 ± 1.578 19.4 ± 1.854 33.63 ± 1.66 50.81 ± 2.163
Chloroform fraction 29.68 ± 3.299 63.33 ± 6.41 84.13 ± 5.332 131.25 ± 2.363 209.17 ± 5.256
Ethyl acetate fraction 80.82 ± 5.302 121.81 ± 7.111 153.33 ± 4.404 216.76 ± 1.693 252.62 ± 3.334
Aqueous fraction 56.85 ± 1.956 105.21 ± 5.255 137.42 ± 6.378 188.47 ± 2.253 233.59 ± 3.464
Equivalent concentration to trolox in µM (mean ± SD)
Refaat et al, Journal of Herbal Drugs, Vol. 5, No. 4: 193-207, 2015
201
Table 8. DPPH scavenging activity of different fractions of CC leaves.
Equivalent concentration to trolox in µM (mean ± SD)
Sample Sample concentration (µg/ml)
50 100 150 250 500
Total ethanol extract 31.46 ±
2.262
53.3 ±
2.215
74.6 ±
3.956
104.8 ±
1.916
211.9 ±
4.764
Petroleum ether fraction 7.16 ±
1.543
11.54 ±
2.415
16.49 ±
5.222
40.01 ±
8.000
59.27 ±
5.148
Chloroform fraction 58.81 ±
5.244
165.49 ±
5.290
221.9 ±
4.855
256.83 ±
2.702
466.22 ±
6.416
Ethyl acetate fraction 108.12 ±
2.341
229.09 ±
4.849
317.40 ±
7.502
427.83 ±
6.036
816.79 ±
5.383
Aqueous fraction 83.32 ±
6.312
207.16 ±
8.378
286.11 ±
3.098
385.66 ±
7.169
781.94 ±
3.444
Table 9. Effect of total ethanol extracts of different parts of CC and CS on adipogenesis in 3T3-L1 cells.
* Values are significant at P < 0.05 versus control ** Values are significant at P < 0.01 versus control
Sample concentration (µg/ml)
Sample C. chodatii C. speciosa
50 100 150 250 500 50 100 150 250 500
Total
ethanol
extract
31.63 ±
2.027
69.71 ±
3.879
92.6 ±
4.132
122.6 ±
2.998
242.8 ±
2.258
43.33 ±
1.225
75.13 ±
4.636
99.35 ±
6.425
131.8 ±
1.571
248.7 ±
4.699
Pet. ether
fraction
4.4 ±
1.225
12.06 ±
1.696
19.88 ±
1.815
38.96 ±
5.138
59.05 ±
4.077
5.06 ±
1.225
12.06 ±
2.639
28.06 ±
3.959
41.76 ±
3.231
77.8 ±
3.582
Chloroform
fraction
75.21 ±
3.241
184.1 ±
3.605
228.5 ±
3.091
272.4 ±
6.248
472.6 ±
4.254
76.39 ±
6.608
191.8 ±
7.252
245.2 ±
2.903
309.3 ±
6.896
490.7 ±
5.184
Ethyl
acetate
fraction
116.8 ±
2.410
254.0 ±
5.480
336.0 ±
6.398
434.1 ±
5.923
827.6 ±
5.073
133.6 ±
2.298
274.8 ±
5.219
343.7 ±
4.419
504.2 ±
2.902
841.4 ±
5.993
Aqueous
fraction
91.76 ±
6.283
224.4 ±
3.716
315.9 ±
4.302
398.5 ±
2.904
805.1 ±
5.879
110.7 ±
7.701
248.8 ±
6.376
324.8 ±
5.208
413.9 ±
2.522
808.3 ±
2.716
Relative value of Oil Red O (% of control) (mean ± SD)
Sample concentration (µg/ml)
Plant
part
C. chodatii C. speciosa
5 10 50 100 5 10 50 100
Flowers 98.38 ±
4.483
100.7 ±
4.476
107.6 ±
4.126*
115.06 ±
2.403**
93.52 ±
4.397
101.4 ±
5.004
109.78 ±
3.519** 113.65 ± 4.25**
Leaves 90.78 ±
7.768
101.09 ±
2.0296
112.49 ±
5.854**
114.52 ±
6.80**
101.17 ±
5.55
103.27 ±
6.365
111.36 ±
7.337*
119.03 ±
6.306**
Fruits 92.92 ±
4.779
102.84 ±
2.148
112.01 ±
3.873**
114.85 ±
3.268**
98.33 ±
6.602
108.86 ±
3.179*
116.06 ±
5.807**
120.56 ±
4.081**
Seeds 94.66 ±
4.864
98.94 ±
5.023
115.5 ±
5.133**
119.92 ±
1.866**
93.22 ±
5.807
97.6 ±
7.454
108.11 ±
2.517* 119.81 ± 4.001**
Refaat et al, Journal of Herbal Drugs, Vol. 5, No. 4: 193-207, 2015
202
Table 10. Effect of different fractions of CC and CS flowers on adipogenesis in 3T3-L1 cells.
* Values are significant at P < 0.05 versus control ** Values are significant at P < 0.01 versus control
Table 11. Effect of different fractions of CC leaves on adipogenesis in 3T3-L1 cells.
Relative value of Oil Red O (% of control) (mean ± SD)
Sample Sample concentration (µg/ml)
5 10 50 100
Total ethanol extract 90.78 ±
7.768
101.09 ±
2.0296
112.49 ±
5.854**
114.52 ±
6.80**
Petroleum ether fraction 95.31 ±
6.041
105.18 ±
2.136
108.31 ±
2.006*
111.93 ±
4.184**
Chloroform fraction 107.91 ±
3.228
111.39 ±
7.278*
119.16 ±
3.401**
129.89 ±
5.474**
Ethyl acetate fraction 110.96 ±
8.498
112.55 ±
7.181*
125.89 ±
5.273**
150.46 ±
2.566**
Aqueous fraction 101.45 ±
5.899
113.61 ±
8.498*
131.51 ±
4.936**
135.91 ±
2.509**
* Values are significant at P < 0.05 versus control ** Values are significant at P < 0.01 versus control
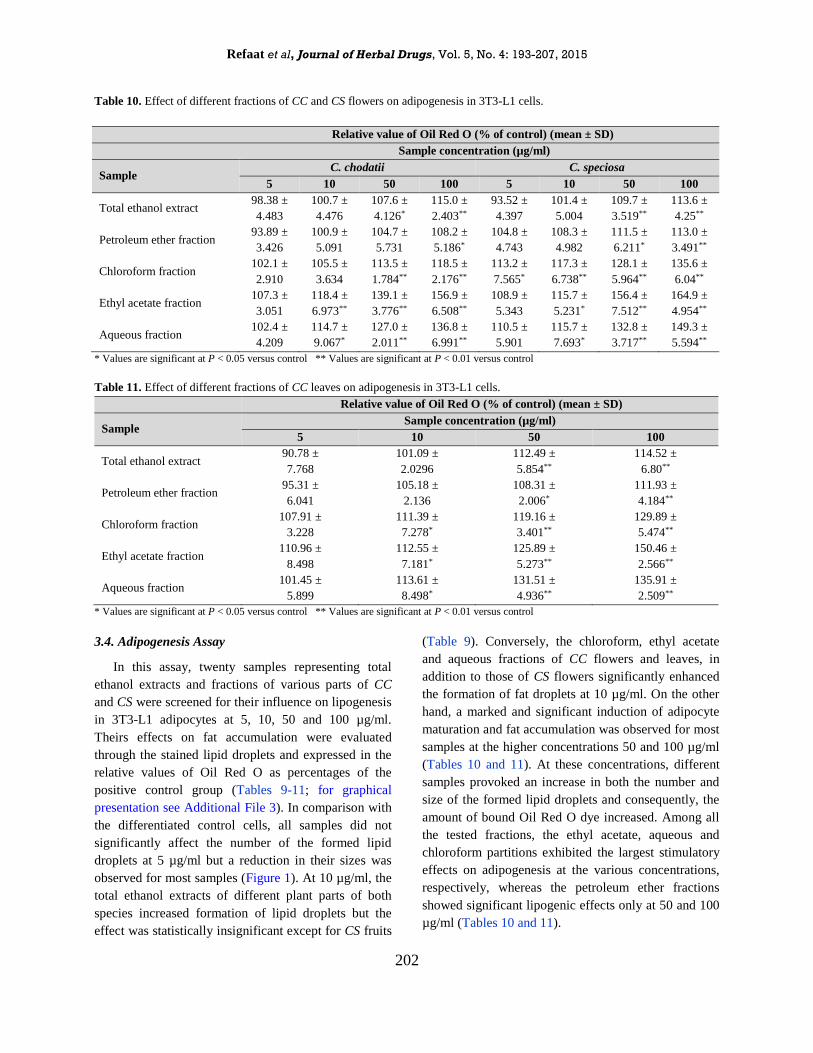
3.4. Adipogenesis Assay
In this assay, twenty samples representing total
ethanol extracts and fractions of various parts of CC
and CS were screened for their influence on lipogenesis
in 3T3-L1 adipocytes at 5, 10, 50 and 100 µg/ml.
Theirs effects on fat accumulation were evaluated
through the stained lipid droplets and expressed in the
relative values of Oil Red O as percentages of the
positive control group (Tables 9-11; for graphical
presentation see Additional File 3). In comparison with
the differentiated control cells, all samples did not
significantly affect the number of the formed lipid
droplets at 5 µg/ml but a reduction in their sizes was
observed for most samples (Figure 1). At 10 µg/ml, the
total ethanol extracts of different plant parts of both
species increased formation of lipid droplets but the
effect was statistically insignificant except for CS fruits
(Table 9). Conversely, the chloroform, ethyl acetate
and aqueous fractions of CC flowers and leaves, in
addition to those of CS flowers significantly enhanced
the formation of fat droplets at 10 µg/ml. On the other
hand, a marked and significant induction of adipocyte
maturation and fat accumulation was observed for most
samples at the higher concentrations 50 and 100 µg/ml
(Tables 10 and 11). At these concentrations, different
samples provoked an increase in both the number and
size of the formed lipid droplets and consequently, the
amount of bound Oil Red O dye increased. Among all
the tested fractions, the ethyl acetate, aqueous and
chloroform partitions exhibited the largest stimulatory
effects on adipogenesis at the various concentrations,
respectively, whereas the petroleum ether fractions
showed significant lipogenic effects only at 50 and 100
µg/ml (Tables 10 and 11).
Relative value of Oil Red O (% of control) (mean ± SD)
Sample concentration (µg/ml)
Sample C. chodatii C. speciosa
5 10 50 100 5 10 50 100
Total ethanol extract 98.38 ±
4.483
100.7 ±
4.476
107.6 ±
4.126*
115.0 ±
2.403**
93.52 ±
4.397
101.4 ±
5.004
109.7 ±
3.519**
113.6 ±
4.25**
Petroleum ether fraction 93.89 ±
3.426
100.9 ±
5.091
104.7 ±
5.731
108.2 ±
5.186*
104.8 ±
4.743
108.3 ±
4.982
111.5 ±
6.211*
113.0 ±
3.491**
Chloroform fraction 102.1 ±
2.910
105.5 ±
3.634
113.5 ±
1.784**
118.5 ±
2.176**
113.2 ±
7.565*
117.3 ±
6.738**
128.1 ±
5.964**
135.6 ±
6.04**
Ethyl acetate fraction 107.3 ±
3.051
118.4 ±
6.973**
139.1 ±
3.776**
156.9 ±
6.508**
108.9 ±
5.343
115.7 ±
5.231*
156.4 ±
7.512**
164.9 ±
4.954**
Aqueous fraction 102.4 ±
4.209
114.7 ±
9.067*
127.0 ±
2.011**
136.8 ±
6.991**
110.5 ±
5.901
115.7 ±
7.693*
132.8 ±
3.717**
149.3 ±
5.594**

Refaat et al, Journal of Herbal Drugs, Vol. 5, No. 4: 193-207, 2015
173

Refaat et al, Journal of Herbal Drugs, Vol. 5, No. 4: 193-207, 2015
203

Refaat et al, Journal of Herbal Drugs, Vol. 5, No. 4: 193-207, 2015
204
Another worth mentioning feature is that, despite of
increasing lipid accumulation in a concentration-
dependent manner, most samples showed a reduction in
the size of lipid droplets at the lower concentrations 5
and 10 µg/ml.
In the same way, the exerted effects of the two
Chorisia species on preadipocytes' differentiation
exhibited a direct correlation with their polyphenol
contents. This suggests that the phenolic mixtures of
these species are responsible for differentiation
enhancement as well as intracellular lipid
accumulation, and also explains why different samples
of both species displayed their effects in a
concentration-dependent manner. It is also worth
mentioning that total extracts of flowers and leaves of
both species exhibited lower stimulatory effects on
preadipocytes conversion and also DPPH scavenging
abilities than their corresponding fractions especially
the ethyl acetate, aqueous and chloroform parts. Such
difference in potency can be attributed to the presence
of the active principles in these partitions in a more
concentrated form than in total extracts. Comparison of
the obtained polyphenol contents of total extracts with
their fractions also comes in complete harmony with
this explanation.
Chorisia plants are known and rich sources of the
flavonoid rhoifolin (Coussio, 1964) that was found to
have no effect on cell growth of 3T3-L1 cells but with
a stimulatory action on adiponectin secretion,
phosphorylation of insulin receptor-β, and glucose
transport 4 (GLUT4) translocation in differentiated
adipocytes. Thus, it was suggested to exert such
insulin-mimetic activity in adipocytes as a target site
for this effect (Rao et al., 2011). Tiliroside, another
chief flavonoid biosynthesized by Chorisia plants
(Hassan, 2009), was found to enhance fatty acid
oxidation via stimulation of adiponectin signalling
associated with the activation of both AMP-activated
protein kinase and peroxisome proliferator-activated
receptor-α (PPARα). Besides, it can ameliorate obesity-
induced metabolic disorders such as hyper-
insulinaemia and hyper-lipidaemia although it does not
suppress body weight gain and visceral fat
accumulation in obese-diabetic model mice (Goto et
al., 2012). On the other hand, cyanidin-3-glucoside,
one of the anthocyanidins isolated from some Chorisia
species (Scogin, 1986), was proved to promote
adipocyte differentiation and glucose uptake in a dose-
dependent manner. It also enhances the mRNA
expression of peroxisome proliferator-activated
receptor-γ (PPARγ), CCAAT/enhancer binding protein
α (C/EBPα), and GLUT4 in differentiated 3T3-L1 cells
(Inaguma et al., 2011). Members of the CCAAT-
enhancer binding protein family (C/EBP-α, -β and -δ)
play important roles in adipogenesis. C/EBP-β is
expressed early in adipocyte differentiation program
and initiates mitotic clonal expansion. In response to an
adipogenic induction, C/EBP-β and -δ are first
activated to promote PPARγ and C/EBP-α expression.
The transcription factor PPARγ is a master regulator of
adipocyte differentiation, and its activation is both
necessary and sufficient for maturation of
preadipocytes (Farmer, 2005; 2006). Accordingly, the
richness of Chorisia plants in these principles may
suggest their PPARγ activating properties and/or
insulin-like effects, taking into account their anti-
hyperglycaemic potential that was previously reported
for the 70% ethanol, aqueous extracts and ethyl acetate
fraction of C. insignis leaves (El-Alfy et al., 2010). In
addition, they can increase insulin-dependent glucose
uptake in differentiated adipocytes and so may be
beneficial in the treatment of obesity-related diseases,
especially type-2 diabetes and hyperlipidaemia.
Therefore, further studies will be looked-for to
determine the molecular basis of such stimulatory
action on adipogenesis especially for the synergistic or
overall effects produced by their pool of flavonoids and
other phenolics, taking into consideration the observed
decrease in the size of droplets at the lower
concentrations.
4. Conclusion
This comparative study drew an important image
concerning the relationship between the polyphenol
contents of C. chodatii and C. speciosa and their
biological potentials including their free radical
scavenging properties and effects on adipogenesis.
Total ethanol extracts along with their successive
fractions of various parts of both species demonstrated
a concentration-dependent enhancement of 3T3-L1
preadipocyte maturation, but with a reduction of the
size of the lipid droplets at the lower concentrations. In
addition, these extracts showed a strong evidence of
their richness in free radical scavengers. The ethyl
acetate, aqueous and chloroform fractions of different

Refaat et al, Journal of Herbal Drugs, Vol. 5, No. 4: 193-207, 2015
205
plant parts exhibited the greatest polyphenol levels,
anti-radical properties and lipogenic actions,
respectively. These findings collectively were found to
be markedly correlated with their phenolic mixtures.
It was also clear that the polarity of the extractants,
represented by different fractions, distinctly influenced
the efficacy of each fraction, with the polar and
flavonoids-rich ones were the most active. Conversely,
the difference in plant species and their organs caused
only slight differences in the produced effects. Besides,
the overall results strongly suggest the potential value
of these plants in obesity-related disorders and for the
prevention of free radical induced diseases. On the
other hand, the little phytochemical attention paid to
these Chorisia species makes the detailed analysis of
their phytochemical composition, especially of their
polar extracts, along with further biological testing are
strongly recommended.
5. Acknowledgments
The authors acknowledged that this research was
supported by Japan Society of Promotion of Science
(JSPS) under the Asia Africa Science Platform
Program entitled: "Establishment of Integrative
Research Base by Humanities and Sciences on
Valorization of Useful Plants for Regional
Development in North Africa". Many thanks also due
to the Graduate School of Life and Environmental
Sciences, Tsukuba University, Japan for providing the
facilities for this study.
6. References
Adjanohoun, E.J. 1988. Contribution aux etudes
ethnobotaniques et floristiques en Republique
Populaire du Congo. ACCT, Paris, p. 605.
Ames, B.N., Gold, L.S. and Willet, W.C. 1995. The
causes and prevention of cancer. Proceedings of
The National Academy of Sciences USA, 92: 5258-
5265.
Ashmawy, A.M., Azab, S.S. and Eldahshan, O.A.
2012. Effects of Chorisia crispiflora ethyl acetate
extract on P21 and NF-κB in breast cancer cells.
Journal of American Sciences, 8: 965-972.
Bailey, L.H. 1976. Hortus Third: A Concise Dictionary
of Plants Cultivated in the United States and
Canada. Staff of the L.H. Bailey Hortorium, Cornell
University.
Blois, M.S. 1958. Antioxidant determination by the use
of stable free radicals. Nature, 181: 1199-1200.
Brand-Williams, W., Cuvelier, M.E. and Berset, C.
1995. Use of a free radical method to evaluate
antioxidant activity. Lebensm-Wiss A-Technology,
28: 25-30.
Chopra, M., Galbraith, S. and Darnton-Hill, I. 2002. A
global response to a global problem: The epidemic
of over nutrition. Bulletin of World Health
Organization, 80: 952-958.
Coussio, J.D. 1964. Isolation of rhoifolin from Chorisia
species (Bombacaceae). Experientia, 20: 562.
El-Alfy, T.S., El-Sawi, S.A., Sleem, A. and Moawad,
D.M. 2010. Investigation of flavonoidal content and
biological activities of Chorisia insignis H.B.K.
leaves. Australian Journal of Basic and Applied
Sciences, 4: 1334-1348.
Erding, H., Bum, K.J., Pasha, S. and Spiegelman, B.M.
1996. Inhibition of adipogenesis through MAP
kinase-mediated phosphorylation of PPARγ.
Science, 27: 2100-2103.
Farmer, S.R. 2005. Regulation of PPARγ activity
during adipogenesis. International Journal of
Obesity, 29: 13-16.
Farmer, S.R. 2006. Transcriptional control of adipocyte
formation. Cell Metabolism, 4: 263-273.
Farmer, S.R. and Auwerx, I. 2004. Adipose tissue: new
therapeutic targets from molecular and genetic
studies: IASO stock conference 2003 report.
Obesity Research, 5: 189-196.
Goto, T., Teraminami, A., Lee, J.Y., Ohyama, K.,
Funakoshi, K., Kim, Y.I., Hirai, S., Uemura, T., Yu,
R., Takahashi, N. and Kawada, T. 2012. Tiliroside,
a glycosidic flavonoid, ameliorates obesity-induced
metabolic disorders via activation of adiponectin
signaling followed by enhancement of fatty acid
oxidation in liver and skeletal muscle in obese-
diabetic mice. Journal of Nutrition and
Biochemistry, 23: 768-776.
Grimble, R.F. 1994. Nutritional anti-oxidants and the
modulation of inflammation: Theory and practice.
New Horizons, 2: 175-185.
Hafez, S.S., Abdel-Ghani, A.E. and El-Shazly, A.M.
2003. Pharmacognostical and antibacterial studies
of Chorisia speciosa St. Hil. flower (Bombacaceae).
Mansoura Journal of Pharmaceutical Sciences, 19:
40-43.
Refaat et al, Journal of Herbal Drugs, Vol. 5, No. 4: 193-207, 2015
206
Hassan, A.A. 2009. Phytochemical and biological
investigation of certain plants containing pigments.
A Thesis for the Doctor Degree submitted to
Faculty of Pharmacy, Mansoura University, Egypt.
Huxley, A. 1992. Dictionary of Gardening: The New
Royal Horticultural Society. The Macmillan Press
Limited, London, the Stockton Press, New York.
Inaguma, T., Han, J. and Isoda, H. 2011. Improvement
of insulin resistance by cyanidin-3-glucoside,
anthocyanin from black beans through the up-
regulation of GLUT4 gene expression. BMC
Proceedings, 5: 21.
Ito, N., Hagiwara, A., Shibata, O., Ogiso, T. and
Fukushima, A. 1982. Induction of squamous cell
carcinoma in the fore stomach of F344 rats treated
with butylated hydroxyanisole. Gann, 73, 332-334.
Johnson, P.R. and Greenwood, M.R.C. 1988. The
adipose tissue. In: cell and tissue biology: A
Textbook of Histology. In: Weiss, L., (Ed.), Sixth
ed. Urban and Schwarzenberg, Baltimore, MD, pp.
191-209.
Kaur, G.J. and Arora, D.S. 2009. Antibacterial and
phytochemical screening of Anethum graveolens,
Foeniculum vulgare and Trachyspermum ammi.
BMC Complementary and Alternative Medicines,
9: 1-10.
Kirkland, J.L., Hollenberg, C.H. and Gillon, W.S.
1990. Age, anatomic site, and the replication and
differentiation of adipocyte precursors. American
Journal of Physiology, 258 (2 Pt 1): C206-210.
Lee, W.J., Koh, E.H., Won, J.C., Kim, M.S., Park, J.Y.
and Lee, K.U. 2005. Obesity: the role of
hypothalamic AMP-activated protein kinase in
body weight regulation. International Journal of
Biochemistry and Cell Biology, 37: 2254-2259.
Lefterova, M.I. and Lazar, M.A. 2009. New
developments in adipogenesis. Trends in
Endocrinology and Metabolism, 20: 107-114.
Lister, E. and Wilson, P. 2001. Measurement of total
phenolics and ABTS assay for antioxidant activity
(personal communication), Crop Research Institute,
Lincoln, New Zealand.
Miller, N. and Rice-Evans, C. 1997. Factors
influencing the antioxidant activity determined by
the ABTS radical cation assay. Free Radical
Research, 26: 195-198.
Newman, D.J. and Cragg, G.M. 2007. Natural products
as sources of new drugs over the last 25 years.
Journal of Natural Products, 70: 461-477.
Ngounou, F.N., Melia, A.L., Lontsia, D., Sondengama,
B.L., Rahman, A.U., Choudharyb, M.I., Malik, S.
and Akhtar, F. 2000. New isoflavones from Ceiba
pentandra. Phytochemistry, 54: 107-110.
Otto, T.C. and Lane, M.D. 2005. Adipose
development: from stem cell to adipocyte. Critical
Reviews in Biochemistry and Molecular Biology,
40: 229-242.
Pietta, P.G. 2000. Flavonoids as antioxidant. Journal of
Natural Products, 63: 1035-1042.
Polterait, O. 1997. Antioxidants and free-radical
scavengers of natural origin. Current Organic
Chemistry, 1: 415-422.
Rao, Y.K., Lee, M-J., Chen, K., Lee, Y-C., Wu, W.S.
and Tzeng, Y-M. 2011. Insulin-mimetic action of
rhoifolin and cosmosiin isolated from Citrus grandis
(L.) Osbeck leaves: enhanced adiponectin secretion
and insulin receptor phosphorylation in 3T3-L1
cells. Evidence-Based Complementary and
Alternative Medicine, 624375: 1-9.
Ratty, A.K., Sunamoto, J. and Das, N.P. 1988.
Interaction of flavonols with 1,1-diphenyl-2-
picrylhydrazyl free radical, liposomal membranes
and soybean lipoxyegenase-1. Biochemical
Pharmacology, 37: 989-995.
Ravenna, P. 1998. On the identity, validity and actual
placement in Ceiba of several Chorisia species
(Bombacaceae) and description of two new South
American species. Oniro, 3: 42-51.
Refaat, J., Desoky, S.Y., Ramadan, M.A. and Kamel,
M.S. 2013. Bombacaceae: A phytochemical review.
Pharmaceutical Biology, 51: 100-130.
Roh, C. and Jung, U. 2012. Screening of crude plant
extracts with anti-obesity activity. International
Journal of Molecular Sciences, 13: 1710-1719.
Scogin, R. 1986. Reproductive phytochemistry of
Bombacaceae: floral anthocyanins and nectar
constituents. Aliso, 11: 377-385.
Slinkard, K. and Singleton, V.L. 1977. Total phenol
analysis: automation and comparison with manual
methods. American Journal of Enology and
Viticulture, 28: 49-55.
Tominaga, H., Kobayashi, Y., Goto, T., Kasemura, K.
and Nomura, M. 2005. DPPH radical-scavenging
effect of several phenylpropanoid compounds and

Refaat et al, Journal of Herbal Drugs, Vol. 5, No. 4: 193-207, 2015
207
their glycoside derivatives. Yakushigaku zasshi- The
Pharmacological Society of Japan, 125: 371-375.
Trease, E.G. and Evans, W.C. 1989. Textbook of
Pharmacognosy. Third ed., Bailliere Tindal,
London, pp. 81-90, 268-298.
Wagner, H. and Bladt, S. 1996. Plants Drug Analysis:
A Thin Layer Chromatography Atlas. Second ed.,
Springer, Berlin, pp. 306-364.
Yun, J.W. 2010. Possible anti-obesity therapeutics
from nature- A review. Phytochemistry, 71: 1625-
1641.