transport shipping insights - kpmg to our fourth publication in our “shipping insights” series...
TRANSCRIPT


b | Section or Brochure name
Corporate reporting: fi t for purpose? Page 2
Tax delivering a competitive edge Page 12
Cyber attack: a new threat Page 18
Is M&A back on the agenda? Page 22
© 2011 KPMG International Cooperative (“KPMG International”). KPMG International provides no client services and is a Swiss entity with which the independent member firms of the KPMG net work are affi liated.
Shipping Insights | 1
Introduction
Welcome to our fourth publication in our “Shipping Insights” series – our annual publication which seeks to raise awareness of key topics that affect those operating within and with the global maritime sector.
The challenges presented by the global climate – be it the sovereign debt crisis, the structural imbalance within shipping or the burgeoning regulation – have created an environment of caution, where sentiment can fl uctuate daily.
In this publication we focus on four important areas:
Corporate reporting: fit for purpose? Just over three years ago we investigated and reported on the quality and transparency of corporate reporting, and concluded that the sector was lagging best practice, with financial information often diffi cult to obtain, assess and compare.
We have refreshed this research in 2011 and looked beyond the purely financial information to consider the quality of narrative disclosures around risk and KPIs.
Tax delivering a competitive edge
Shipping is a truly global sector and managing tax risk and reducing tax exposure remains a big issue for the sector. KPMG member fi rms are frequently contacted by maritime companies trying to compare and contrast the different tax regimes across the world. In this edition of Insights we highlight the important issues to consider.
Cyber attack: a new threat
IT theft has become a billion dollar problem. In this article we outline why shipping companies should consider their vulnerability and suggest ways in which this new threat can be mitigated.
Is M&A back on the agenda?
In our final article we provide an analysis of how the global crisis of 2008 has affected the performance of companies and the associated impact on M&A within the sector.
The rate of regulatory change is diffi cult to keep pace with and there are a whole range of topics we could have covered in this publication. In the next 12 months we can expect further clarity on how European Emissions Policy will impact investments, operations and fi nancial performance in the sector. In the world of accounting we can expect more clarifi cation on proposals for leasing, revenue recognition and hedging that will have signifi cant ramifi cations. Sanctions and bribery laws are making it imperative that companies understand their entire supply chain.
In our view it has never been more important to:
• Remain alive to the forward agenda and participate in regulatory consultations to ensure the sector has a voice;
• Ensure that strategic plans are suffi ciently fl exible and consider the potential impact of change; and
• Keep stakeholders up to date with the consequences of change.
KPMG’s global shipping network has the breadth and depth of resource to provide clients with support and advice on the impact of this change. I would encourage you to keep in touch with your normal KPMG contact, or link up with our network.
John Luke KPMG, Global Head of Shipping T:+44 (0) 20 7311 6461 E: [email protected]
© 2011 KPMG International Cooperative (“KPMG International”). KPMG International provides no client services and is a Swiss entity with which the independent member firms of the KPMG net work are affi liated.

2 | Shipping Insights
Corporate reporting: fit for purpose?
We have refreshed our survey of fi nancial reporting by the world’s leading shipping companies. The sector is showing signs of becoming more transparent as stakeholders demand more regular, fulsome and comparable financial information, but the sector still lags best practice.
In October 2008 we presented our fi rst survey of the global shipping industry. At that time the results of our survey suggested that the sector was lagging best practice, with fi nancial information often difficult to obtain, diffi cult to assess and difficult to compare.
Three years on and we return to update our survey and examine whether the conclusions still reflect the status of the financial information produced by the shipping sector. We have revisited the specific areas of applicable accounting standards and impairment, and also taken the opportunity to assess risk disclosures, key performance indicators and sustainability reporting.
Our 2011 survey 1 once again refl ects the global reach of the shipping industry and the operators within it. Of greatest concern is that for many in the sector there is no information at all! We continue to find it difficult to locate publicly available 2 fi nancial information. This time around we were unable to
1 Details of companies surveyed are included in Appendix 1. 2 Our definition of ‘publicly a vailable financial inf ormation’ is whether or not financial reports are a vailable on the company’s website.
© 2011 KPMG International Cooperative (“KPMG International”). KPMG International provides no client services and is a Swiss entity with which the independent member firms of the KPMG network are affi liated.

Shipping Insights | 3
GAAPs adopted in fi nancial reporting
GAAP unknown – privately held companies 33%
US GAAP 20%
IFRS issued by IASB and as adopted by EU 18%
Japanese GAAP 6%
Taiwanese GAAP 5%
Hong Kong GAAP 8%
Singaporean GAAP 3%
Indian GAAP 4%
Malaysian GAAP 2%
Saudi Arabia GAAP 1%
GAAPs shaded blue are derivations of IFRS and accordingly are deemed equivalent
Source: KPMG analysis
locate an Annual Report (or equivalent) for 33% (2008: 44%) of those surveyed. The ownership and domicile profi le of the sector remain much as in 2008 and therefore the results are not surprising. However, the improvement is encouraging and perhaps is a refl ection of the growing demand for transparency from the sector’s supply chain and fi nanciers.
Which GAAP?
The evolution of an internationally adopted and understood set of accounting standards has been a success. Since 2001, almost 120 countries have required or permitted the use of International Financial Reporting Standards (IFRS) including almost all G20 countries. The major outlier continues to be the US (although foreign issuers can fi le IFRS accounts in the US). The US
authorities outwardly support a convergence with IFRS, and we can expect an update statement from the Securities and Exchange Commission in the next few months.
Our survey supports the convergence agenda, with far more comparability than we observed in 2008. Today we observe 9 different GAAPs, compared to 13 in 2008. Moreover, with joint projects between the accounting standard setting Boards of International Standards and the US Standards actual differences are narrowing. Perhaps the most signifi cant difference for this sector is the approach to impairments (see later).
However, whilst convergence would imply a trajectory to closer comparability between shipping businesses the key issues for the sector continue to be those associated with signifi cant judgement and estimation. We observe continued inconsistency and a lack of
transparency in the detailed application of accounting policies and estimates.
Looking ahead to the medium term we believe it is likely that the shipping sector will be split into two clear groups: those reporting under IFRS or equivalent; and those for which no GAAP can be identified. The “big unknown” in this is the pace of IFRS convergence between US GAAP and IFRS.
...we were unable to locate an Annual Report for 33% of those surveyed
© 2011 KPMG International Cooperative (“KPMG International”). KPMG International provides no client services and is a Swiss entity with which the independent member firms of the KPMG net work are affi liated.

4 | Shipping Insights
In 2010 only a half of one percent of fl eet values were impaired
Length of annual reports
350
300
250
200
150
100
50
0 Low Average High
Nu
mb
er o
f p
ages
Financial information Narrative information
Source: KPMG analysis
In depth?
The underlying GAAP of a set of fi nancial statements is only one factor in their overall usefulness and comparability. The volume of data and how it is presented have a heavy infl uence. From our survey the length of fi nancial statements ranges from 6 to 158 pages in Annual Reports of between 20 and 315 pages.
The quality and length of fi nancial reporting is a hot topic across Corporate Reporting regulators. The Integrated Reporting Project, lead by the International Integrated Reporting Committee (IIRC) is looking at ways in which companies can provide relevant information in a more dynamic manner. KPMG is a participating member of this project and recently published a report summarising the work (and initial discussion paper) of the IIRC 3.
To put our fi ndings in some context, a survey undertaken by Black Sun of 2010 FTSE 100 companies reporting in the UK 4 identifi ed an average length of 175 pages (with only 7% of its sample producing reports of less than 100
pages). It also concluded that 51% of content was allocated to narrative, rather than fi nancial, reporting.
Clearly this simple page analysis does not take into consideration the complexity of the surveyed companies’ business models. However with an average length of 130 pages, it would appear that shipping companies provide less in-depth information than other sectors.
Understanding impairments
The turmoil in the shipping markets since our 2008 survey has brought the issue of impairments to the very fore of the industry and the fi nancial information published. We assessed the practical challenges and key areas of judgement surrounding impairment reviews in Shipping Insights 2: Insights arising from the economic downturn.
Perhaps the biggest surprise across the sector has been the general lack of impairments recognised by the major companies.
In 2010 we have identifi ed an aggregated fl eet impairment charge
of USD 1.0 billion against a fleet value of circa USD 195 billion (in other words, only a half of one percent fl eet values were impaired). In 2009 the total impairment charge recognised by our sample was USD 780 billion.
There is a signifi cant difference between the major relevant GAAPs – IFRS and US – in this area.
US GAAP requires a two step approach by which firstly the undiscounted projected future cashflows are examined for an indication of impairment. Should this indicate a potential impairment issue then the fair value is assessed with fair value defi ned as the price that would be received to sell an asset or paid to transfer a liability in an orderly transaction between market participants at the measurement date.
This contrasts with IFRS which employs a single step approach by which the carrying value is compared to the higher of fair value less costs to sell and value in use.
Neither approach requires a company to revalue its fleet at market value (ie mark-to-market), but rather hold it at a value that is supported by future cashflows (either crystalised through a sale or through ongoing use). Perhaps most readers of this report would think that there should not be any difference between the two values – at least in principle – or if there are differences then these should be identifi able. In our view, a higher value in use can arise through:
• Taking into account the charter agreements of the individual asset (and depending upon when they were entered into, these could be considerably higher than today’s market rate);
• A more optimistic view of daily running costs;
3 Integrated Reporting: Performance insight through Better Business Reporting, Issue 1 4 Telling the story: Annual analysis of FTSE 100 corporate reporting trends 2010 published by Black Sun Plc
© 2011 KPMG International Cooperative (“KPMG International”). KPMG International provides no client services and is a Swiss entity with which the independent member firms of the KPMG network are affi liated.

Shipping Insights | 5
With an average length of 130 pages, it would appear that shipping companies provide less in-depth information than other sectors
• High residual values driven by good scrapping prices (particularly for assets coming to the end of their lives) and views over useful economic lives;
• Different views on discount rates;
• A more bullish view of market sentiment – when and by how much will rates recover; or
• The level of liquidity in the market created by scarcity of available fi nance.
The other conclusion readers may draw is that perhaps the sector is prudent in its approach to depreciation (and therefore higher depreciation charges in the boom years has provided a degree of income statement protection in the downturn), or, when the vessel was acquired (new build prices rose throughout the 1990s and 2000s, peaking in 2008, before falling by of circa 40%).
It is clear from the above that the value in use assessment has become a critical estimate for the shipping sector, providing the cornerstone to the value attributed to the asset base of many
companies. Had impairments been booked to market values then the scale of impairments would most certainly have been an order of magnitude higher than actually observed. No company in our sample voluntarily discloses market values.
It is obvious that the composition of projected cashflows in impairment assessments is a critical estimate. We would expect companies to recognise and discuss this in some detail within Annual Reports – unfortunately this is rarely the case.
Estimation snapshot Number of companies
Further detail
Sample size 53 67% of those surveyed
Disclosure of Cash Generating Units provided 9 4 on a vessel (or asset) basis 5 on a fleet (or operating unit) basis
Disclosure of discount rates provided 7 Ranging from 6.5% to 13.0%
© 2011 KPMG International Cooperative (“KPMG International”). KPMG International provides no client services and is a Swiss entity with which the independent member firms of the KPMG net work are affi liated.

6 | Shipping Insights
Our fi rms’ experience across both the shipping sector and more widely across globalised industries is that the failure of a critical IT system could threaten the very existence of a business
Company Policy
Diana Shipping By comparing the carrying value with the recoverable amount. Recoverable amount depends on undiscounted cash flow generated by the asset. If there is an
impairment, the asset would be written to its fair value.
In determining the undiscounted cash flow, the following is considered: a) Consideration of the historical and estimated vessels’ performance and utilization, the charter revenues from existing time charters for the fi xed fl eet days
and an estimated daily time charter equivalent for the unfixed days (based on the most recent 10 year average historical one year time charter rates available for each type of vessel, considering also current market rates) over the remaining estimated life of each vessel, net of brokerage commissions, expected outfl ows for the scheduled vessels’ maintenance and vessel operating expenses assuming an
average inflation rate of 3%. Effective fleet utilization is assumed to be 98% in the Company’s exercise, taking into account the period(s) each vessel is expected to
undergo her scheduled maintenance (dry docking and special surveys), as well as an estimate of 1% off hire days each year, assumption in line with the Company’s historical performance.
Frontline Comparing carrying value with recoverable amount (undiscounted future cash flows expected from the use of the vessel and its eventual disposition). Market
value is not used as the fair value of the vessels have been fl uctuating.
Farstad Comparing carrying value with recoverable amount (greater of net selling price and utility value). Net selling price is the value estimate obtained from three independent Norwegian shipbrokers. The brokers’ estimates assume the vessels are without any charter contracts and available for immediate sale on the market.
Standard practice for IFRS value in use assessment is the use of a discounted future cashflow model that the asset or cash-generating unit is expected to generate over its remaining life. In addition to the composition of the cashfl ows the discount rate is a critical variable.
The appropriate discount rate for a value in use calculation is that which refl ects the risks specific to the asset or CGU.
This should not be the cost of capital of the asset holder but rather a market assessment of the asset risk and the time value of money. One may therefore expect, as a globalised industry, that the discount rates disclosed would be in a relatively narrow range with all the major industry players having access to similar market data.
We have had some diffi culty in assessing this, or any other hypothesis with respect to discount rates due to the lack of disclosure in this key area. As highlighted in our snapshot table on page 5, only seven of the 53 entities for which we found publically available data disclosed numerical information about the discount rates used.
The table below presents the range:
Survey Low Average High
2010 results 6.5% 8.2% 13.0%
2008 results 6.0% 8.0% 13.0%
Note: Pre and post tax rates assumed broadly equivalent for purposes of our sample, as majority of vessels will be operating within a tonnage tax regime
© 2011 KPMG International Cooperative (“KPMG International”). KPMG International provides no client services and is a Swiss entity with which the independent member firms of the KPMG network are affi liated.
Shipping Insights | 7
The lack of movement in discount rates over the period may reflect the broad uncertainty that continues in both market and economic conditions and (certainly in terms of the underlying inputs that build up an appropriate discount rate) there are likely to be offsetting factors that are likely to have resulted in no signifi cant movement.
Similarly there is a lack of disclosure surrounding longer term growth rates used in value in use calculations. The vast majority of our sample was silent on this, a few provided an indication of how growth rates are arrived at (without quantifying) and only two provided specifi c rates.
In assessing the robustness of a shipping company, and its ability to survive a prolonged recession stakeholders need to understand the estimates being used to support fl eet values, together with an understanding of sensitivity. Of our sample, no stress testing information to support vessel carrying values was provided and it was difficult to establish what proportion of the fleets were exposed to spot rates.
Allied to this, is the quality of disclosure around the nature and terms of debt (and major obligations).
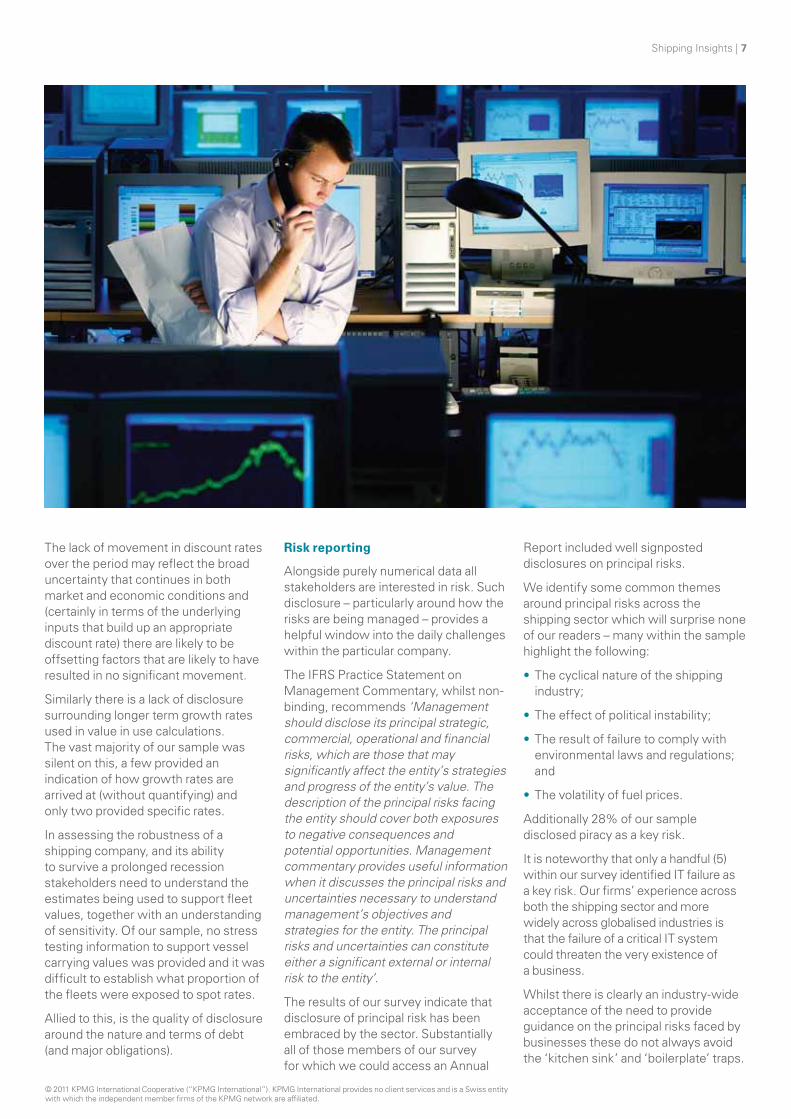
Risk reporting
Alongside purely numerical data all stakeholders are interested in risk. Such disclosure – particularly around how the risks are being managed – provides a helpful window into the daily challenges within the particular company.
The IFRS Practice Statement on Management Commentary, whilst nonbinding, recommends ‘Management should disclose its principal strategic, commercial, operational and fi nancial risks, which are those that may significantly affect the entity’s strategies and progress of the entity’s value. The description of the principal risks facing the entity should cover both exposures to negative consequences and potential opportunities. Management commentary provides useful information when it discusses the principal risks and uncertainties necessary to understand management’s objectives and strategies for the entity. The principal risks and uncertainties can constitute either a significant external or internal risk to the entity’.
The results of our survey indicate that disclosure of principal risk has been embraced by the sector. Substantially all of those members of our survey for which we could access an Annual
Report included well signposted disclosures on principal risks.
We identify some common themes around principal risks across the shipping sector which will surprise none of our readers – many within the sample highlight the following:
• The cyclical nature of the shipping industry;
• The effect of political instability;
• The result of failure to comply with environmental laws and regulations; and
• The volatility of fuel prices.
Additionally 28% of our sample disclosed piracy as a key risk.
It is noteworthy that only a handful (5) within our survey identifi ed IT failure as a key risk. Our fi rms’ experience across both the shipping sector and more widely across globalised industries is that the failure of a critical IT system could threaten the very existence of a business.
Whilst there is clearly an industry-wide acceptance of the need to provide guidance on the principal risks faced by businesses these do not always avoid the ‘kitchen sink’ and ‘boilerplate’ traps.
© 2011 KPMG International Cooperative (“KPMG International”). KPMG International provides no client services and is a Swiss entity with which the independent member firms of the KPMG net work are affi liated.

8 | Shipping Insights
The IFRS Practice Statement is clear that ‘Management should distinguish the principal risks and uncertainties facing the entity, rather than listing all possible risks and uncertainties’. Therefore:
• Can over 20 different identifi ed risks genuinely offer the stakeholder clear and unambiguous information on the principal issues facing a company?
• Are generic disclosures such as ‘volatility of the global economy’ really an insightful disclosure as a company’s only key risk?
In our view, sector participants should take risk reporting to the next level, ensuring the disclosure is:
• Consistent with the organisations’ internal risk assessment, and management reporting
• Sufficient for stakeholders to gain an understanding of the risk environment and the manner in which risks are being managed by the organisation; and
• Consistent with the rest of the Annual Report – in other words messages in the narrative reporting and fi nancial reporting is joined up.
Company Disclosure
U-Ming • Industry linked to global economy;
• Commodity demand driven industry;
• Financing risk;
• High rate of unemployment in developed country;
• Inflation risk in China’s economy growth;
• Commodity pricing moving away from annual to quarterly spot pricing;
• Large delivery volume of vessels in 2010 and 2011;
• Customer selection risk;
• Taxation risk; and
• Operational risk (operational structure, replacement).
CMB • Strategic risks – macro-economic environment, financial circumstances, the Group’s reputation, political and legal developments;
• Operational risks – changes in the market condition, credits, relationship with business partners, human resources, IT Infrastructure, safety of assets and data; and
• Financial risks – Cash management, taxes, forecasts and budgets, correct and timely reporting, compliance with accounting rules, interest rate and exchange rate fl uctuations, coverage.
Norden Commercial (freight rate), vessel price risk, operational risk; and Financial Risks (credit risk, liquidity risk).
© 2011 KPMG International Cooperative (“KPMG International”). KPMG International provides no client services and is a Swiss entity with which the independent member firms of the KPMG net work are affi liated.

Shipping Insights | 9
Measuring success: KPIs
KPIs need to refl ect the way management run the business and are used to measure performance against strategy. Too often companies have numerous KPIs dotted throughout the narrative – KPIs which are neither explained, nor used to interpret performance with a heavy bias towards fi nancial rather than nonfi nancial measures.
Only a few in our sample specifi cally reported its KPIs in a simple and well-defi ned section of the Annual Report. Indeed identifying the full set of a Company’s KPIs from a thorough review of all the various elements of the Annual Report is not often possible.
A signifi cant number (43) of the Annual Reports surveyed do present ‘key fi gures’ (particularly those reporting under US GAAP) although there is little explanation as to which of these are being regularly monitored. The graph indicates those fi nancial measurements that appear most regularly in the summary key fi gures presented.
Of the other measures, cost was an area of particular focus, perhaps refl ecting the extent of cost-saving measures being undertaken by the big ship owning and operating companies.
Non-fi nancial measurements generally relate to information regarding the size and utilisation of the fl eet.
The lack of basic information about fl eet size (either owned or under management) and its utilisation does, however, seem surprising.
Only three companies in our sample provided detailed targets against which performance could be measured in the future. Investors would be able to assess the performance of management if the Company:
• Links KPIs to the strategic challenges;
• Clearly discloses the KPIs against which it should be measured, and
• Provides targets against which performance can be measured.
Frequency of key fi nancial measures
Revenue
before tax
Operating
profit EPS
Gearing
ROCE ROE
EBITDA Other
measures
35
Nu
mb
er o
f co
mp
anie
s
30
25
20
15
10
5
0
Profit
Frequency of key non-fi nancial measures
12
Nu
mb
er o
f co
mp
anie
s
10
8
6
4
2
0Size of fleet Fleet Average time Average daily Lost time
utilisation charter equivalent running cost accidents measure measure (or equivalent
measure)Source: KPMG analysis
© 2011 KPMG International Cooperative (“KPMG International”). KPMG International provides no client services and is a Swiss entity with which the independent member firms of the KPMG net work are affi liated.

10 | Shipping Insights
Sustainability reporting
The reality for many companies is that environmental, social and governance issues are having an increasing impact on their ability to operate and generate a profit. Stakeholders have a valid interest in how these issues are being managed and the impact they have on the value and sustainability of the business.
Left unabated, the emissions of greenhouse gases from international shipping are projected to double by 2030. This situation is becoming politically and socially unacceptable and mechanisms to address this are inevitable. The nature of future regulation is both a risk and an opportunity for sector participants and stakeholders wish to understand how organisations will meet this challenge.
The results of our survey suggest there is a signifi cant gap between what stakeholders want and the information being provided.
Sample
Sustainability information provided
Subject to independent assurance
53
25
2
To bridge this gap, sustainability reporting (and more broadly corporate responsibility reporting) needs to become like any other aspect of operational reporting and better refl ect the business objectives of the organisation. As a major polluting sector, shipping companies ignore this key aspect of stakeholder engagement at their peril.
Future impacts: Lease accounting
Readers regularly in touch with their local KPMG member firm contacts are likely to have received regular updates on the progress to changes to lease accounting.
The deliberations by standard setters are almost over and we can expect a much changed exposure draft in the near future.
We have quantified the potential impact of the leasing proposals on the balance sheets of our surveyed sample.
We identified from our sample total lease commitments (as lessee) of circa USD 80.0 billion. Whilst we await the standard setters’ conclusions and in the absence of further information, the off balance sheet lease disclosures are a
[Changes to lease accounting] increases our sample’s combined net debt from USD 87 billion to USD 167 billion
© 2011 KPMG International Cooperative (“KPMG International”). KPMG International provides no client services and is a Swiss entity with which the independent member firms of the KPMG net work are affi liated.

Shipping Insights | 11
good proxy for the adjustment required to bring operating leases on balance sheet (with a corresponding adjustment to gross assets), albeit this represents an undiscounted amount. This increases our sample’s combined net debt 4 from USD 87 billion to USD 167 billion.
Of course this analysis is simplistic and we certainly have not tried to assess the compensating impact where companies are lessors of assets. Our calculation is therefore likely to be double counting “debt” relating to the same asset. In the scenario where an owner debt finances the purchase of a new vessel which is then chartered on a bareboat arrangement to an operator for half its life, our calculation is likely to include both the original debt and the bareboat “debt” in our headline fi gure.
However, this remains a signifi cant shift in the size of organisation’s balance sheets and highlights the importance of off-balance sheet arrangements in assessing the financial position of companies. Our analysis does show the deep pockets of the companies within it though – certainly when compared to other sectors. Combined equity of our sample is circa USD 160 billion, and therefore the gearing of the sector is relatively low (on an aggregated basis at least) and headroom on asset covenants is in relatively good shape, especially when you consider that our sample asset base of USD 195 billion (as identified on page 4) is held at cost, rather than at market value.
With revised lease accounting proposals due in early 2012, companies should follow developments closely and remember that as well as the impact to balance sheets, companies can expect an increase in EBITDA 5 but a decrease in net profit during the early years of arrangements (as charter payments under operating leases are replaced by higher depreciation and interest).
Contact:
Ian Griffi ths Transport Group, KPMG in the UK T: +44 (0) 20 7311 6379 E: ian.griffi [email protected]
4 Net debt is balanced between liabilities less cash and cash equivalents 5 Earnings before interest, tax, depreciation and amortisation
© 2011 KPMG International Cooperative (“KPMG International”). KPMG International provides no client services and is a Swiss entity with which the independent member firms of the KPMG network are affi liated.

12 | Shipping Insights
Tax delivering a competitive edge
Shipping and taxation – you might think they make strange bedfellows. Few industries have such an attractive taxing environment, perhaps precisely because few are so truly global.
© 2011 KPMG International Cooperative (“KPMG International”). KPMG International provides no client services and is a Swiss entity with which the independent member firms of the KPMG net work are affi liated.
Shipping Insights | 13
The key assets are inherently mobile; shipping expertise is available in major maritime cities, and because large corporate groups often have locations in many major centres, management are accustomed to working across time differences and may sometimes elect to relocate as the business dictates.
This mobility is what makes shipping a perfect field for tax planning, as there may be a virtually blank sheet as to where a new business could be created or where an existing one can be moved to.
KPMG firms’ tax professionals are often asked where it makes sense to establish a shipping operation. There are many answers, but no silver bullet – the right answer is always specific to the individual circumstances. This article features our refl ections on the tax factors which infl uence a decision, and touches on topical tax issues shipping clients are facing around the world.
The tax landscape
For ship owners who are keen to preserve privacy and who may also be seeking light regulation and freedom to dispose of assets tax free, a company incorporated in a tax haven combined with a flag of convenience – possibly the same country’s register – may suit best. The usual locations are well known – the choice between (say) Liberia, Panama and the Marshall Islands is likely to depend on the costs of establishing and maintaining fl agging and on socio-political factors.
Actually operating a ship from a tax haven (as the location of a company’s tax residence) may be inefficient from a tax perspective. Tax havens are unlikely to have an adequate network of double tax treaties, although some of them have limited agreements applying to international shipping activities. Tax exposures may arise in a number of
higher tax jurisdictions globally, where there are trading activities outside the low tax jurisdiction of establishment.
Therefore a popular option is for the owner to be a tax haven company that charters the vessel to an operator based in a non-tax haven jurisdiction so that:
• the owner has the privacy and other benefits alluded to above;
• the operator may benefit from the treaty network of the jurisdiction where it is established, ensuring the operator is taxed on profi ts only where they are established; and
• depending on the availability of special tax regimes, the operator may also pay very low levels of tax in that jurisdiction.
The owner of the ship as bareboat lessor faces some risk that (based on the activity of the ships) the jurisdictions where they operate may seek to tax the owner as bareboat lessor. Certain countries (for example Australia and Norway) take a harder line than others in this regard. The UK, for example, will not treat a ship as a permanent establishment as it is not a fi xed place of business (if it operates on the UK designated area of continental shelf in oil and gas activities the UK may be able to tax it but in practice it will not do so provided the lessor is a third party bareboat charterer).
In choosing the location for the operator, the key questions to be answered will include:
• Is there a suitable maritime infrastructure – lawyers, brokers, banks, accountants, tax advisers?
• Is there a suitable source of shipping expertise – people with relevant commercial knowledge?
• Is the management team content to be based there?
• What is the domestic tax regime? Is there an exemption or low tax regime for shipping?
• How good is the international tax treaty network? Will it apply if there is a shipping exemption? and
• If vessels are also to be fl agged in the operator’s jurisdiction, it will be relevant to ask questions as to the relative cost of fl agging.
Relocating a business
KPMG member firms regularly work with businesses that are making the transition from one country to another. We see businesses moving away from higher into lower tax jurisdictions; moving into countries where exemptions are available, or responding to commercial needs by co-locating management nearer to key markets. Europe’s tonnage taxes have proved attractive over the past decade but there is a trend towards the East, with Singapore’s tax regime, among others, increasingly finding favour. The ever increasing role of China in world trade – as a user of inbound and outbound ships, as a ship-builder, and now as a ship financier – has also proved a major factor.
In moving businesses across borders we see companies having to deal with various tax exit charges – capital gains may arise on assets or goodwill and there may be a clawback of tax depreciation. There may be ways to avoid some of these costs depending on the availability of reliefs. Within the EU there are mechanisms intended to make it more straightforward to move a business. Of course, a strategic move across the border at a time when ship values dip – as occurred in 2009 – can also be highly effective in minimising tax charges.
© 2011 KPMG International Cooperative (“KPMG International”). KPMG International provides no client services and is a Swiss entity with which the independent member firms of the KPMG net work are affi liated.

14 | Shipping Insights
Tonnage tax regime No regime
Belgium Italy Austria
Bulgaria Latvia Czech Republic
Cyprus Lithuania Estonia
Denmark Malta Hungary
Finland Netherlands Luxembourg
France Poland Portugal
Germany Slovenia Romania
Greece Spain Slovakia
Ireland UK Sweden
Of the non-EU EEA countries, Norway has a tonnage tax regime.
Insight into EU tonnage tax regimes
“The European Union needs a maritime sector that is competitive at international level and hence allows, for that purpose, favourable taxation based on tonnage to prevent companies from relocating.” Joaquín Almunia, EU Competition Commissioner, 1 July 2011
The vast majority of EU countries operate some form of tonnage tax regime with many similar characteristics.
Developments
Community fl agging The European Commission (“EC”) guidelines were revised in 2004 to strengthen the “flag link”, i.e. the requirement for tonnage tax groups to flag ships in EU/EEA registers. Even with the strengthened fl ag link some regimes still permit wholly non-Community fleets to continue within tonnage tax. The requirement to operate “at sea” was also added (previously harbour tugs had qualifi ed).
Types of ship Towards the end of the last decade the EC was understood to be reviewing the type of ship which should benefi t
from tonnage tax regimes. The issue was whether service vessels such as cable layers and anchor-handlers should be included. In 2008 the UK announced controversial proposals to exclude many specialised vessels altogether, but these proposals were withdrawn after lobbying and because of the EC’s parallel review. The EC ultimately concluded such vessels were acceptable – moving away from their old definition of maritime transport as “port to port” or “port to offshore facility” towards “the carriage of goods or passengers at sea”. At around the same time the UK tax authorities helpfully acknowledged that the profi ts of specialised vessels from all activity at sea should be fully exempt, not merely the transport element 6.
Ship management In June 2009 the EC issued specifi c guidance on crew management and technical management 7. It noted that the bulk of ship management in the EU is carried on in Cyprus. Cyprus historically had a favourable tax regime applicable to ship management (which was outside the EC guidelines). Cyprus had been lobbying for the guidelines to be extended.
In the 2009 guidance the EC authorised state aid for ship management companies which provide crew management or technical management or both. There are fl agging, training and other tests. It was anticipated that the tax burden for a ship manager might be approximately 25% that of the operator of a given ship, taking into account the manager’s typically lower margins. Commercial management was not addressed.
As yet only some EU jurisdictions with tonnage tax regimes have responded by extending their regimes to ship managers. The UK for example still requires ships to be operated by a tonnage tax company (as well as strategically and commercially managed in the UK).
Chartered in test Although not in the EC guidelines, approved regimes have set a maximum of 75% or 80% chartered in tonnage. Ireland removed this test however the EC recently ruled against this, creating a new EC requirement that there should be a minimum of 1:10 (owned to chartered) tonnage.
Insight into the UK tonnage tax regime
It has been rumoured that companies which originally were cleared as qualifying have been subjected to scrutiny and that some might be forced to exit the regime (without necessarily having suffered a change in circumstances). However, while our recent experience is that it is becoming harder to enter UK tonnage tax, under the coalition government there have been positive and welcome developments.
6 Revenue & Customs Brief 42/09, 21 July 2009 7 OJEU 2009/C 132/06, 11 June 2009
© 2011 KPMG International Cooperative (“KPMG International”). KPMG International provides no client services and is a Swiss entity with which the independent member firms of the KPMG network are affi liated.

Shipping Insights | 15
On 12 October 2011 HMRC published revised guidance, returning the guidance on management and control to its pre 2009 state. This is most welcome as the 2009 changes were unpopular. Other changes to the guidance strengthen the linkage between the UK regime and the EU framework.
In the case of interest free loans, the interaction of UK-UK transfer pricing and the finance cost adjustment can give unfair results. This is a continuing area of complexity and practical diffi culty.
Territorial taxation The UK has recently announced a shift towards a more territorial basis of taxation in an effort to attract global groups to the UK and if possible to reverse the trend of business emigrations. Key changes include:
• Foreign and UK dividends received by UK companies have been mostly tax exempt since 1 July 2009;
• Foreign branches of UK companies can elect out of UK taxation from 2011/12; however, the exemption will not apply to a shipping company whose non-UK branches benefi t from treaty protection (otherwise they would escape tax); and
• The UK CFC (controlled foreign companies) rules are being adapted in two stages (2011 and 2012). The proposed 2012 change will allow CFCs to qualify for exemption where their trade is operating leasing of assets with an individual asset value over £10 million. There is a proposed group finance company partial exemption which covers intra-group finance leasing. These measures may help some ship owning groups.
While our recent experience is that it is becoming harder to enter UK tonnage tax, under the coalition government there have been positive and welcome developments
© 2011 KPMG International Cooperative (“KPMG International”). KPMG International provides no client services and is a Swiss entity with which the independent member firms of the KPMG net work are affi liated.
16 | Shipping Insights
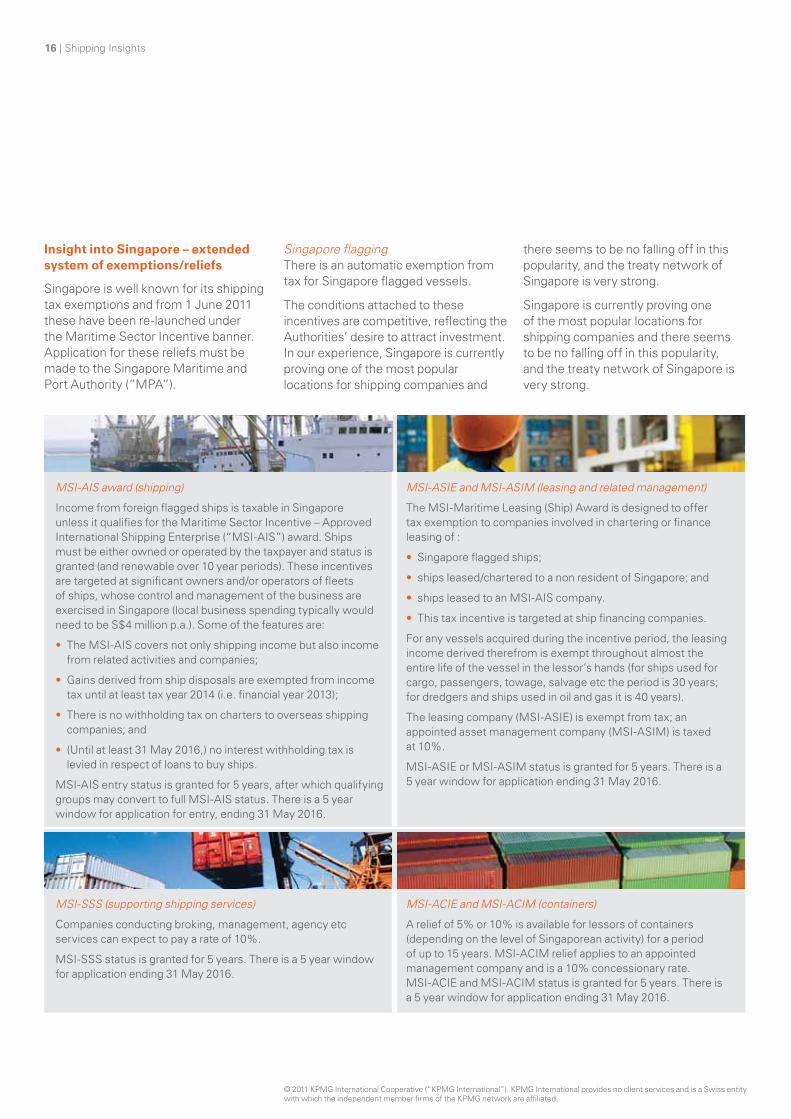
Insight into Singapore – extended system of exemptions/reliefs
Singapore is well known for its shipping tax exemptions and from 1 June 2011 these have been re-launched under the Maritime Sector Incentive banner. Application for these reliefs must be made to the Singapore Maritime and Port Authority (“MPA”).
Singapore fl agging There is an automatic exemption from tax for Singapore fl agged vessels.
The conditions attached to these incentives are competitive, refl ecting the Authorities’ desire to attract investment. In our experience, Singapore is currently proving one of the most popular locations for shipping companies and
there seems to be no falling off in this popularity, and the treaty network of Singapore is very strong.
Singapore is currently proving one of the most popular locations for shipping companies and there seems to be no falling off in this popularity, and the treaty network of Singapore is very strong.
MSI-AIS award (shipping)
Income from foreign fl agged ships is taxable in Singapore unless it qualifi es for the Maritime Sector Incentive – Approved International Shipping Enterprise (“MSI-AIS”) award. Ships must be either owned or operated by the taxpayer and status is granted (and renewable over 10 year periods). These incentives are targeted at signifi cant owners and/or operators of fl eets of ships, whose control and management of the business are exercised in Singapore (local business spending typically would need to be S$4 million p.a.). Some of the features are:
• The MSI-AIS covers not only shipping income but also income from related activities and companies;
• Gains derived from ship disposals are exempted from income tax until at least tax year 2014 (i.e. fi nancial year 2013);
• There is no withholding tax on charters to overseas shipping companies; and
• (Until at least 31 May 2016,) no interest withholding tax is levied in respect of loans to buy ships.
MSI-AIS entry status is granted for 5 years, after which qualifying groups may convert to full MSI-AIS status. There is a 5 year window for application for entry, ending 31 May 2016.
MSI-ASIE and MSI-ASIM (leasing and related management)
The MSI-Maritime Leasing (Ship) Award is designed to offer tax exemption to companies involved in chartering or fi nance leasing of :
• Singapore fl agged ships;
• ships leased/chartered to a non resident of Singapore; and
• ships leased to an MSI-AIS company.
• This tax incentive is targeted at ship fi nancing companies.
For any vessels acquired during the incentive period, the leasing income derived therefrom is exempt throughout almost the entire life of the vessel in the lessor’s hands (for ships used for cargo, passengers, towage, salvage etc the period is 30 years; for dredgers and ships used in oil and gas it is 40 years).
The leasing company (MSI-ASIE) is exempt from tax; an appointed asset management company (MSI-ASIM) is taxed at 10%.
MSI-ASIE or MSI-ASIM status is granted for 5 years. There is a 5 year window for application ending 31 May 2016.
MSI-SSS (supporting shipping services)
Companies conducting broking, management, agency etc services can expect to pay a rate of 10%.
MSI-SSS status is granted for 5 years. There is a 5 year window for application ending 31 May 2016.
MSI-ACIE and MSI-ACIM (containers)
A relief of 5% or 10% is available for lessors of containers (depending on the level of Singaporean activity) for a period of up to 15 years. MSI-ACIM relief applies to an appointed management company and is a 10% concessionary rate. MSI-ACIE and MSI-ACIM status is granted for 5 years. There is a 5 year window for application ending 31 May 2016.
© 2011 KPMG International Cooperative (“KPMG International”). KPMG International provides no client services and is a Swiss entity with which the independent member firms of the KPMG net work are affi liated.

Shipping Insights | 17
Insight into USA tonnage tax
U.S. income tax treaties for shipping companies generally provide for exclusive income taxation by the country of the taxpayer’s residence with respect to qualifying income derived from the operation of vessels in international traffic. U.S. domestic law also contains a reciprocal statutory exemption from federal income tax with respect to qualifying income from the international operation of vessels where there is a reciprocal agreement in effect and other requirements are satisfi ed.
The American Jobs Creation Act of 2004 introduced important tax provisions related to income derived from the international operation of vessels by enacting an elective (alternative) tonnage tax regime for certain operators of U.S. fl agged vessels.
The tonnage tax provisions were intended to help revitalize the U.S. fl ag vessel industry by allowing U.S. fl ag operators to better compete against foreign flag operators who may be subject to lower rates of tax. As with the EC regimes, the U.S. tonnage tax regime provides for a fictional tax base on which the normal income tax rate is applied.
A qualifying vessel operator may elect application of this alternate tonnage tax regime. By so electing, the company’s tax is determined into two parts. The first part is its regular tax under normal U.S. tax rules, excluding income from “qualified shipping activities”. The second part of the tax is equal to 35 percent of the company’s “notional shipping income.” In fact, “notional shipping income” is not actually income, rather a formula based on a vessel’s net tonnage is used to calculate it.
An electing company’s notional shipping income from the operation of a qualifying vessel is equal to 40 cents for each 100 tons of the vessel’s net tonnage up to 25,000 net tons, plus 20 cents for each
100 tons of the vessel’s net tonnage that exceeds 25,000 net tons.
Vessels qualifying for the tonnage tax must be a minimum of 6,000 deadweight tons. They must also be registered under a U.S. flag and be engaged exclusively in “U.S. foreign trade,” (defined as the transportation of goods or passengers between a place in the U.S. and a foreign place, or between two foreign places).
A qualifying vessel operator is any company that operates one or more qualifying vessels and satisfi es certain shipping activity requirements. The vessel must be owned by, or chartered to, the company, or the company must provide services for the vessel pursuant to an operating agreement. Generally, a company will meet the shipping activity requirements for any tax year only if, during each of the preceding two tax years, on average, at least 25% of the aggregate tonnage of qualifying vessels used by the company were owned by or chartered to it on bareboat charter terms.
Multiple operators of a single vessel can qualify for this regime. In these cases, the notional income for each party from the vessel will be allocated based upon the parties’ respective interest in the vessel.
If a company elects into the tonnage tax regime, deductions, credits, and losses are generally disallowed with respect to income excluded from the income tax under this alternative regime. Moreover, no deduction is permitted for any net operating losses attributable to qualified shipping activities (subject to the tonnage tax) to the extent that such loss is carried forward from a taxable year preceding the first taxable year for which the tonnage tax election is in effect. As such, it might be prudent for such a company to fully utilise its net operating losses prior to electing into the tonnage tax regime.
Consistent with the treatment of deductions and credits, the interest expense of an electing company is disallowed in the same proportion that the fair market value of the company’s qualifying vessels bears to the fair market value of the company’s total assets. In the case where a company is a member of an electing controlled group, the disallowance ratio with respect to interest expense is the fair market value of the company’s qualifying vessels over the fair market value of the electing group’s total assets.
Once the tonnage tax election is made, it remains effective for all subsequent tax years until the election is terminated. If the election is terminated – either by reason of revocation or by ceasing to be a qualifying vessel operator – another election into this regime cannot be made for fi ve years without the consent of the Internal Revenue Service.
Concluding remarks
In recent years specific low-tax regimes have been established that enable shipping companies to operate on a low tax basis in higher tax jurisdictions. This has been particularly valuable in countries where tax depreciation for ships has become less attractive. Such regimes have been granted as Governments and policy makers appreciate the value a thriving shipping sector brings to local economies. By carefully selecting the right locations, shipping companies should continue to be able to enjoy low or no taxation.
Contact:
Michael Everett Tax Director, Transport Group, KPMG in the UK T: +44 (0) 20 7311 6587 E: [email protected]
© 2011 KPMG International Cooperative (“KPMG International”). KPMG International provides no client services and is a Swiss entity with which the independent member firms of the KPMG net work are affi liated.

18 | Shipping Insights
Cyber attack: a new threat
The annual financial cost of cyber-attacks worldwide is currently estimated at USD 114 billion 8, with time lost in dealing with such crime thought to equate to USD 288 billion. And the problem is only expected to get bigger, and bigger.
8 2011 Norton Cybercrime report
© 2011 KPMG International Cooperative (“KPMG International”). KPMG International provides no client services and is a Swiss entity with which the independent member firms of the KPMG network are affi liated.

Shipping Insights | 19
The approach to protecting information is changing signifi cantly. Threats and the methods attackers use are far more sophisticated and complex, and are increasingly driven by competition, business ethics and politics
Incidents of data breach can occur across all industries, not just those typically thought to be “high risk”. Companies which deal with large numbers of client and employee personal information such as credit card numbers and other personal data, are prime targets. And the fi nancial cost is only half the story – such breaches can have an enormous impact on society and this quickly translates into negative brand impact on the affected organisation. Following a breach, the rectification work is enormous, with companies having to deal with identity theft investigations, analysis, government scrutiny, and data breach notification to affected individuals.
The problem
So how does this affect the shipping industry? Most large shipping organisations now offer online services for placing and tracking orders, viewing account statements, viewing packages, and more. These services require the storage of extremely sensitive personal information of customers. The rise of “big data”, the sale of personal information globally, makes services such as these legitimate targets for cyber criminals. The cost of a breach to a shipping organisation can be significant. It is not simply the loss of the information, but all the associated costs mentioned previously.
In addition, many organisations now provide services that integrate directly into their customers networks. The data security challenge here is self-evident. If a breach occurs in a Business-to-Business environment, then there is a real chance that the relationship will end there. Electronic Data Interchange (EDI), for example, has long been utilised in the shipping industry, but as technology becomes smarter and EDI is incorporated as part of an automated
business process, the security implications become much more pronounced.
Today’s shipping companies place huge reliance on Information Technology (IT) to complete daily tasks and global projects. The strength of IT in a maritime business is an imperative and can quickly become a competitive advantage. With the advent of this technological era has come an entirely new set of challenges. Electronic information has become the most valuable company asset after its fl eet and its people, making information protection one of the most signifi cant routes to maintaining that success.
The approach to protecting information is changing significantly. Threats and the methods attackers use are far more sophisticated and complex, and are increasingly driven by competition, business ethics and politics. Security typically struggles to keep up with the needs of the business and new ways of collaborating. Whilst the threat level is increasing, external regulators, the media, shareholders and the public are expecting greater transparency in relation to security incidents – there is little tolerance for those organisations that suffer significant breaches. As a result, managing the reputation of the organisation and delivering business
efficiency are challenges that must be met. Security risk has now been driven right up to the board level.
Securing your information is not an easy job. What is becoming clearer by the day is that attackers have often infiltrated your organisation long before you realise – siphoning off sensitive corporate data at their leisure – and once you do notice, it is usually too late, as they have covered their tracks and moved onto the next organisation.
It’s not hard to pick up a newspaper and find a story on data security – whether it’s Wikileaks threatening to bring down a major US bank or a global organisation losing millions of customers’ credit card numbers. Professional gangs are investing in online crime and committing global resources and time to make long term returns on their investment. Organised criminals no longer take the low hanging fruit from poorly managed or confi gured online applications. Instead they develop extensive strategies which include both technological and social attacks to yield longer term results. Unfortunately the threat doesn’t stop there. Organisations and governments are increasingly at risk from cyber attacks and hackers motivated not only by fi nancial gain but by ideology alone.
© 2011 KPMG International Cooperative (“KPMG International”). KPMG International provides no client services and is a Swiss entity with which the independent member firms of the KPMG net work are affi liated.

20 | Shipping Insights
The solution
Part of protecting your organisation is having a basic awareness of what sensitive data you have, what would happen if it was stolen or corrupted (maliciously or accidentally) and what the effect would be on your brand and assets if an attack was to happen. Our view is that companies should adopt an holistic approach to the issue. For instance, data tampering and data stealing should not be treated as separate issues. If malicious people can gain access to your organisation’s data, they can certainly steal it, as has happened to organisations across the globe. This makes deterrence and detection a combined objective that can be achieved by executing flexible techniques to strengthen data protection in an organisation.
For sensitive industries such as shipping, potential attackers should be presented with as secure a system as possible in order to increase the chance they will either fail or move on and attack somewhere else.
After defining security objectives, an organisation should typically next move into the security implementation phase which should not only include common perimeter security measures such as anti-malware and firewalls but also deploy customised solid security techniques coupled with a fully-confi gurable monitoring system. This should be based on a well-designed access authorisation policy platform to ensure that inside the organisation the right people have the right access to the right data, either onboard or onshore.
In the shipping industry, Business Continuity is crucial. This is the ability a company possesses to avoid a system failure during a crisis, to retrieve information quickly, and to return to business as usual. To achieve this, an across-the-board appraisal of a company’s possible vulnerabilities is essential to construct and maintain the required infrastructure to ease those risks. In some organisations, Business Continuity and information security awareness is next to unknown. This is sadly true for many companies and should be of paramount importance.
To successfully tackle the information security challenge, shipping companies should look to specialists with the goal of constructing a robust system where every process and operation is
© 2011 KPMG International Cooperative (“KPMG International”). KPMG International provides no client services and is a Swiss entity with which the independent member firms of the KPMG net work are affi liated.
Shipping Insights | 21
controlled from top to bottom. This, combined with employee security awareness training, can lead to the effective defence of an organisation’s assets.
Tampering with booking systems, stealing proprietary security algorithms, publishing thousands of customer credit card details, editing pricing quotations, and changing sensitive data in a shipping company are all real results of determined and skilled hackers. The reality of attacks is that they can actually cost billions of dollars in global industries, especially when you consider that 90 percent of trade is done by sea. The issues mentioned concerning information security should be discussed at board level, and action must be taken to mitigate the risks that
exist, for the investment involved in the shipping industry is immense.
The shipping industry has proven it can rise to security challenges before in areas such as the International Ship and Port Facility Security (ISPS) code (which delivered a huge step forward in enhancing the security of vessels and port facilities). Sadly it may now have to rise to a new challenge in the area of data security.
Contact:
Tim Ayling Senior Manager, Information Protection and Business Resilience, KPMG in the UK T: +44 20 7694 4071 E: [email protected]
For sensitive industries such as shipping, potential attackers should be presented with as secure a system as possible
© 2011 KPMG International Cooperative (“KPMG International”). KPMG International provides no client services and is a Swiss entity with which the independent member firms of the KPMG net work are affi liated.

22 | Shipping Insights
Is M&A back on the agenda?
In this article we assess the development of the maritime sector since the economic crisis in 2008. There has been an improvement in valuation levels and a hesitant return of transaction activity.
Our view
The maritime sector was signifi cantly hit by the economic crisis of 2008. Shipping companies suffered both from fi nancial results and in share price performance driven by a huge drop in demand and a growing realisation that too many ships were available or in the pipeline.
Port and terminal operators showed more stable financial results and share price underlying their “infrastructure” nature. Infrastructure (particularly regulated infrastructure) has remained an attractive asset class.
Since the economic crisis the capital market performance of the sector has rebounded, but not to pre-crisis levels. Capital market investors remain concerned at the capacity issues in the sector which has weighed on share price. Asset values have recovered well, despite rates still being low.
The future of the industry depends on the successful implementation of measures to decrease and remove overcapacity.
© 2011 KPMG International Cooperative (“KPMG International”). KPMG International provides no client services and is a Swiss entity with which the independent member firms of the KPMG net work are affi liated.

Shipping Insights | 23
Within the shipping sector, tanker companies’ valuations show a high correlation to the oil price and consequently show greater volatility than the container or bulk shipping peer groups. The valuation of port and terminal operators is mainly driven by capital market sentiment, as the development of fi nancial performance has proven steady.
The multiples for transactions in the Asia-Pacifi c region are developing more favourably, underlying the region’s dynamic. Deal volumes and numbers have been growing more modestly in Europe.
The rebound of valuation and deal activity indicates a returning confi dence in the sector. However freight rates remain low and macro-economic factors such as sovereign debt and low growth continue to weigh heavily on the global economy.
Capital market and earnings development
During the economic upswing from 2003 to 2007, shipping companies, backed by high demand for seaborne trade, placed record orders with shipyards. Demand was strongly outgrowing supply.
Share prices of maritime sector companies signifi cantly outperformed the S&P 500 index during 2007 (see graph 1).
When the global fi nancial crisis broke, world trade plummeted in 2008 and 2009. The industry was hit harder than most, as it met a rapidly decreasing demand coupled with growing supply (the long yard lead times meant orders were being delivered at precisely the wrong time). This imbalance resulted in the collapse of freight rates.
Shipping companies reacted by introducing several measures to decrease supply – including slow
Graph 1: Average share price performance vs. S&P 500 during the economic crisis
300
Sh
are
pri
ce/
ind
ex p
erfo
rman
ce(r
ebas
ed t
o 1
00)
250
200
150
100
50
0
Jan ‘07
Mar
‘07
May
‘07
Jul ‘
07
Sep ‘07
Nov
‘07
Jan ‘08
Mar
‘08
May
‘08
Jul ‘
08
Sep ‘08
Nov
‘08
Jan ‘09
Mar
‘09
May
‘09
Jul ‘
09
Sep ‘09
Nov
‘09
Avg. shipping Avg. ports and terminals S&P 500
Graph 2: Decline in sales and EBITDA during the economic crisis
0
20
40
60
80
100
140
120
Sal
es a
nd
EB
ITD
A fi
gu
res
(reb
ased
to
100
)
2007 2008 2009
(73.8%)
(16.7%)
(12.9%)
+4.6%
Sales avg. shipping
Sales avg. ports and terminals
EBITDA avg. shipping
EBITDA avg. ports and terminals
Source: KPMG analysis
steaming, floating storage, lay-ups and scrapping. However many (particularly smaller owners) were reluctant to withdraw supply as long as freight rates were sufficient to service debt repayments.
As a result, the industry suffered dramatic losses by the end of 2009, with the top 20 companies (by capacity) recording approximately USD20 billion of collective losses (see graph 2).
Port and terminal operators handled the crisis far better than shipping companies. Whilst they also suffered declines in revenue, they were less severe and recovered more quickly. Whilst port and terminal operator share prices managed to perform positively from the beginning of 2007 to the end of 2009, shipping companies lost one fourth of their value and underperformed the S&P 500 throughout this period.
© 2011 KPMG International Cooperative (“KPMG International”). KPMG International provides no client services and is a Swiss entity with which the independent member firms of the KPMG net work are affi liated.

24 | Shipping Insights
Graph 3: Average share price performance vs. MSCI World/ MSCI World Transport Index
60
70
80
100
90
120
110
130
140
Sh
are
pri
ce/i
nd
ex p
erfo
rman
ce(r
ebas
ed t
o 1
00)
Nov
‘09
Jan ‘10
Mar
‘10
May
‘10
Jul ‘
10
Sep ‘10
Nov
‘10
Jan ‘11
Mar
‘11
May
‘11
Jul ‘
11
Sep ‘11
Nov
‘11
Avg. shipping Avg. ports and terminals
MSCI World Transport MSCI World
Graph 4: Average EV/Sales multiples and market capitalization by business segments
0.0x
0.5x
1.00x
2.00x
1.50x
3.00x
2.50x
4.00x
3.50x
4.50x
Sh
are
pri
ce/i
nd
ex p
erfo
rman
ce(r
ebas
ed t
o 1
00)
800
700
600
500
400
300
200
100
MarketC
ap (reb
ased to
100)
0
2000 2002 2004 2006 2008 2010 2012e
EV/Sales avg. Maritime sector EV/Sales avg. ports and terminals
EV/Sales avg. shipping Avg. market cap ports and terminals
Avg. market cap shipping
Source: KPMG analysis
The container shipping industry recovered quickly in 2010, although the impact of oversupply was evident – fi rstly rates increased swiftly as demand came back, and then as idled containers were reintroduced rates fell back again.
The situation was even worse for tanker companies as supply will continue to outgrow demand well into 2012 and rates are already near a ten year low.
Graph 3 compares sector participants with the MSCI World index and World Transportation index and highlights a good correlation with port and terminal operators, however shipping companies been underperforming dramatically. Since 2009, the sector has lost on average 5.9%, underperforming the MSCI World index by 44%. This demonstrates the extent of concern for overcapacity, pressure on freight rates and limited fi nancing options.
Capital market valuations
Overall, the EV/sales multiples of the maritime sector are expected to reach 2.63x in 2012. In 2007, the EV/sales multiple reach its peak driven by the general bullish mood of the international stock markets. After the 2008 crisis multiples have recovered quickly and have almost reached pre-crisis levels (see graph 4).
© 2011 KPMG International Cooperative (“KPMG International”). KPMG International provides no client services and is a Swiss entity with which the independent member firms of the KPMG net work are affi liated.
Shipping Insights | 25
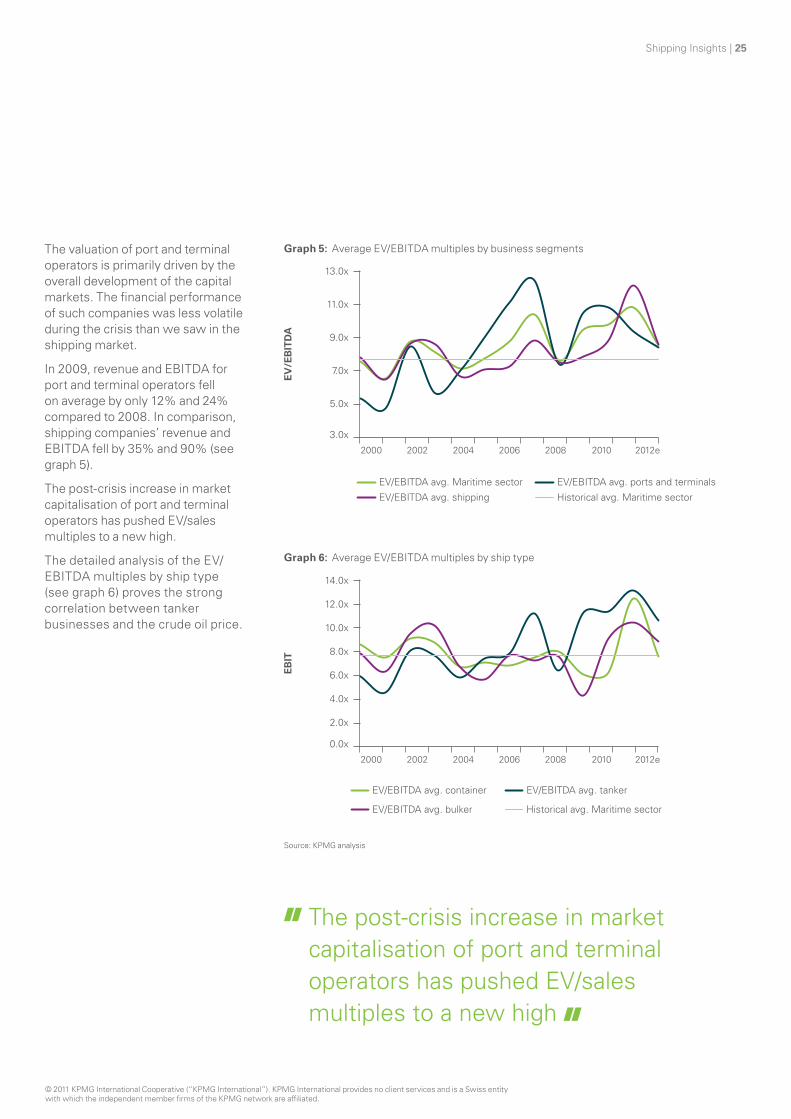
The valuation of port and terminal operators is primarily driven by the overall development of the capital markets. The fi nancial performance of such companies was less volatile during the crisis than we saw in the shipping market.
In 2009, revenue and EBITDA for port and terminal operators fell on average by only 12% and 24% compared to 2008. In comparison, shipping companies’ revenue and EBITDA fell by 35% and 90% (see graph 5).
The post-crisis increase in market capitalisation of port and terminal operators has pushed EV/sales multiples to a new high.
The detailed analysis of the EV/ EBITDA multiples by ship type (see graph 6) proves the strong correlation between tanker businesses and the crude oil price.
Graph 5: Average EV/EBITDA multiples by business segments
13.0x
11.0x
2000 2002 2004 2006 2008 2010 2012e
EV/EBITDA avg. Maritime sector EV/EBITDA avg. ports and terminals
EV/EBITDA avg. shipping Historical avg. Maritime sector
EV
/EB
ITD
A
9.0x
7.0x
5.0x
3.0x
Graph 6: Average EV/EBITDA multiples by ship type
14.0x
12.0x
10.0x
2000 2002 2004 2006 2008 2010 2012e
EV/EBITDA avg. container EV/EBITDA avg. tanker
EV/EBITDA avg. bulker Historical avg. Maritime sector
EB
IT
8.0x
6.0x
4.0x
2.0x
0.0x
Source: KPMG analysis
The post-crisis increase in market capitalisation of port and terminal operators has pushed EV/sales multiples to a new high
© 2011 KPMG International Cooperative (“KPMG International”). KPMG International provides no client services and is a Swiss entity with which the independent member firms of the KPMG net work are affi liated.

26 | Shipping Insights
Graph 7: Average EV multiples of selected Maritime transactions compared by years
0.0x
2.0x
4.0x
6.0x
8.0x
10.0x
12.0x
16.0x
14.0x
EV
/Mu
ltip
les
EV/Sales
2.17x 2.13x 1.82x
6.5x
9.8x
6.1x
9.1x
EV/EBITDA EV/EBIT
14.0x
12.2x
2009 2010 2011
Graph 8: Average EV multiples of selected Maritime transactions in Europe and Asia-Pacifi c
10.0x
EV/Sales EV/EBITDA
Europe 2009 Europe 2010 Asia-Pacific 2009 Asia-Pacific 2010
2.32x 1.61x
2.00x 1.28x
7.6x 7.9x
8.9x
6.8x
8.0x
EV
/Mu
ltip
les
6.0x
4.0x
2.0x
0.0x
Source: KPMG analysis
Transaction multiples in the maritime sector
Valuation multiples on profi tability levels have broadly increased from 2009 and 2010, with the EV. Only the EV/sales multiple has not recovered, indicating a rising willingness by acquirers to pay more for lower margins.
In 2011, all valuation multiples have increased on 2010, suggesting a rebound in confi dence and competition although this may soften again as we move into 2012. Looking at regional trends, multiples for Asia-Pacifi c deals have been increasing whilst European deals remain depressed.
Whilst the overall trend has been positive, the market has yet to recover to levels witnessed in 2007 and 2008 when EV/sales was at 4.2x and EV/ EBITDA at 16.0x (see graphs 7 and 8).
© 2011 KPMG International Cooperative (“KPMG International”). KPMG International provides no client services and is a Swiss entity with which the independent member firms of the KPMG net work are affi liated.

Shipping Insights | 27
M&A activity in the maritime sector
After the depressed period from 2H2009 to 1H2010 the number of deals has recovered, with deal volume jumping up two thirds in 1H2011 and showing strength across both our sub-sectors.
Although Europe’s share of total deal volume has been declining, it still accounts for the highest number of deals. We can expect the general shift from Europe to Asia to continue (see graphs 9, 10 and 11).
As 2011 draws to a close pressures on rates are returning to 2008 levels and as yet little tonnage has been laid up. The sector was quick to respond in 2008 and without a reduction in supply it may mean that not everyone survives this time around.
Contact:
Dr Steffen Wagner Partner, Corporate Finance/M&A, KPMG in Germany T: +49 69 9587 1507 E: [email protected]
Graph 9: Deal value by sector
300 25,000
1H2009 2H2009 1H2010 2H2010 1H2011
Deal value (USDM) of shipping sector
Deal value (USDM) of port and terminal sector
Deal value (USDM) of other maritime sectors
Number of total deals worldwide
11,067
204 207
6,349 7,111
13,493
19,382 194
239 23720,000
No. o
f deals
15,000
10,000 US
Dm
5,000
0 0
50
100
150
200
250
Graph 10: Deal value by region
No. o
f deals
25,000
1H2009 2H2009 1H2010 2H2010 1H2011
Deal value (USDM) Europe Deal value (USDM) Asia-Pacific
Deal value (USDM) Americas Deal value (USDM) Rest of World
11,067
204 207
6,349 7,111
13,493
19,382 194
239 237
Number of worldwide deals
20,000
200 15,000
US
Dm
10,000
5,000
0 0
50
100
150
300
250
Graph 11: Number of deals by region
CAGR 140
1H2009 2H2009 1H2010 2H2010 1H2011
110 110 121 119
89
50 57
66 68 60
31
13 23
17
37
15
37
13
37
8 0.0%
4.5%
2.0%
8.0%
120
100
80
60
40
20
0
No.
of
dea
ls
Europe Asia-Pacific
Americas Rest of World
Source: KPMG analysis
© 2011 KPMG International Cooperative (“KPMG International”). KPMG International provides no client services and is a Swiss entity with which the independent member firms of the KPMG net work are affi liated.

28 | Shipping Insights
Appendix 1 – Information sources
We outline below the companies within our survey.
Companies were chosen based upon league tables published in Lloyds List and Clarkson (Clarkson Research Services Limited – Shipping Review and Outlook), being:
• Top 50 companies by market capital;
• Top 20 companies by size of fl eet: – B ulk; – Container; and – T anker.
Clearly, some shipping companies are placed in more than one category, resulting in a total sample of 79.
Our defi nition of ‘publicly available fi nancial information’ was whether or not such information was available on the company’s website. In addition our survey was restricted to fi nancial information published in 2011.
We did not contact any company directly as part of this survey.
KPMG’s global shipping practice has taken direct extracts from relevant publicly available fi nancial information. No comment is made by KPMG member fi rms in regard to the adequacy or otherwise of these policies, rather the examples used are to demonstrate current accounting and disclosure practice.
© 2011 KPMG International Cooperative (“KPMG International”). KPMG International provides no client services and is a Swiss entity with which the independent member firms of the KPMG net work are affi liated.

Shipping Insights | 29
Aegean Marine Petroleum General Maritime Corporation OOCL
Alexander & Baldwin General Ore Corporation Orient Overseas International
Angelicoussis Group Golar LNG Overseas Shipholding Group
AP Moller – Maersk A/S Golden Ocean Corp Pacific Basin Shipping Limited
Bonheur ASA Great Eastern Shipping Co Pacific International Lines
BW Maritime Grindrod Petroleum Geo-Services ASA
China COSCO Holdings Hamburg -Sud SCF Group
China Shipping (Group) Company Hanjin Shipping SEACOR Holdings Inc
China Shipping Container Lines Hapag Lloyd Ship Finance International
China Shipping Development Co HOSCO Group Shipping Corp of India
CIA Sud Americana de Vapores SA Hyundai Merchant Marine Shoei Kisen K.K
Cie Maritime Belge SA Kawasaki Kisen Kaisha Stolt-Nielsen
CMA – CGM KG Jebsen STX Pan Ocean Co
Cosco Corp Singapore Kirby Corp Teekay Corp
COSCO Pacifi c Koninklijke Boskalis Teekay LNG Partners LP
CSC Nanjing Tanker Corp Malaysian Bulk Carriers Bhd Teekay Offshore Parners LP
D/S Norden Meditteranean Shipping Company Tidewater
Diana Shipping MISC Bhd Tsakos Group
Dryships Mitsubishi Heavy Industries U-Ming Marine Transport
Dynacom Tankers Management Mitsui OSK Lines United Arab Shipping Company
Enterprise National Shipping of Saudi Arabia Vela International
Essar Shipping Navios Group Wan Hai Lines
Euronav NV Neptune Orient Lines Yang Ming Marine Transport Corp
Evergreen Marine Corp Nippon Yusen Kaisha ZIM Integrated Shipping Services
Excel Maritime Carriers Nordic American Tanker Shipping Zodiac Maritime
Farstad Shipping ASA NS United Kaiun Kaisha
Frontline Ocean Tankers Pte
© 2011 KPMG International Cooperative (“KPMG International”). KPMG International provides no client services and is a Swiss entity with which the independent member firms of the KPMG net work are affi liated.

30 | Shipping Insights
Appendix 2 – KPMG’s Insights series
Shipping Insights 1
Accounting and financial reporting in the shipping industry
In this publication we surveyed the publically available fi nancial information of the largest shipping companies to assess the usefulness and comparability of reported results. We looked at critical accounting policies relevant to the sector, including revenue recognition, pool arrangements and fixed asset accounting. The survey concluded that financial reporting in the sector was lagging best practice and that financial information was diffi cult to obtain, assess and compare.
Shipping Insights 2
Insights arising from the economic downturn
Issued at the height of the 2009 economic crisis, this publication looked at the measures being taken by shipping companies to survive the downturn and the cash flow and profit impact of such decisions. We also reflected on the challenges of assessing impairment of vessels when reliable cash flow forecasting was difficult. The publication also looked at more complex accounting issues such as cost capitalisation policies and borrowing costs, together with a first view on emerging accounting issues such as lease accounting and revenue recognition where changes to accounting standards were expected.
Shipping Insights 3
Thriving in a changing world
Recognising that the range of topics being covered in the Boardrooms of shipping companies was ever expanding, this publication considered anti-bribery and corruption laws, sustainability and raising new finance. We also looked at the pace of recovery in the Far East and provided a more in depth assessment of the proposals around changes to the accounting for operating and fi nance leases.
© 2011 KPMG International Cooperative (“KPMG International”). KPMG International provides no client services and is a Swiss entity with which the independent member firms of the KPMG net work are affi liated.

Shipping Insights | 31
© 2011 KPMG International Cooperative (“KPMG International”). KPMG International provides no client services and is a Swiss entity with which the independent member firms of the KPMG net work are affi liated.

KPMG contacts For more information, please contact a professional from the following KPMG member fi rms
Global Leadership
Dr Ashley Steel Global Chair – Transport 15 Canada Square London E14 5GL, UK T: +44 20 7311 6633 E: [email protected]
John Luke Global Head of Shipping 15 Canada Square London E14 5GL, UK T: +44 20 7311 6461 E: [email protected]
Argentina Eduardo H Crespo +54 11 4891 5673 [email protected]
Australia Mal Ramsay + 61 2 9335 8228 [email protected]
Belgium Serge Cosijns +32 3 821 18 07 [email protected]
Brazil Manuel Fernandes +55 21 3515 9412 [email protected]
Canada Jim Pickles +1 604 691 3572 [email protected]
Chile Alejandro Cerda +56 2 798 1201 [email protected]
China and Hong Kong Andrew Weir +852 2826 7243 [email protected]
Cyprus Demetris Vakis +357 222 0900 [email protected]
Czech Republic Eva Rackova +420 222 123 121 [email protected]
Denmark Jesper Ridder Olsen +45 3818 3593 [email protected]
Finland Pauli Salminen +358 20 760 3683 [email protected]
France Philippe Arnaud +33 1 5568 6477 [email protected]
Germany Nicholaus Schadeck +49 421 33557-7109 [email protected]
Greece Dimitra Caravelis +30 210 6062188 [email protected]
Hungary Zoltan Szekely +36 1 887 7394 [email protected]
India Manish Saigal +91 22 3090 2410 [email protected]
Indonesia David East +622 15 740877 [email protected]
Ireland Michele Connolly +353 1 410 1546 [email protected]
Israel Guy Aharoni +972 4 861 4804 [email protected]
Italy Alessandro Guiducci +39 010 553 1913 [email protected]
Japan Kazunori Hamamura +81 3 3266 7001 [email protected]
© 2011 KPMG International Cooperative (“KPMG International”). KPMG International provides no client services and is a Swiss entity with which the independent member firms of the KPMG net work are affi liated.

Korea Ha Kyoon Kim +82 2 2112 0271 [email protected]
Malaysia Hasmanyusri Yusoff +603 7721 3388 [email protected]
Malta Pierre Portelli +35 6 256 31010 [email protected]
Mexico Luis Carrero +52 818 122 1818 [email protected]
Netherlands Herman van Meel +31 20 656 7222 [email protected]
New Zealand Paul Herrod +64 9 367 5323 [email protected]
Norway John Thomas Sørhaug +47 4063 9293 [email protected]
Portugal João Augusto +351 210 110 000 [email protected]
Russia Alexei Romanenko +7 495 663 8490 ext. 12694 [email protected]
Saudi Arabia, Kuwait and Jordan Jonathan Barnes +966 (2) 258 1616 [email protected]
Singapore Wah Yeow Tan +65 6411 8338 [email protected]
South Africa Dean Wallace +27 11 647 6960 [email protected]
Spain David Hohn +34 91 456 3886 [email protected]
Sweden Bjorn Hallin +46 8 723 9626 [email protected]
Switzerland Marc Ziegler +41 44 249 20 77 [email protected]
Taiwan Fion Chen +886 2 8101 6666 fi [email protected]
Thailand John Sim +66 2 677 2288 [email protected]
Turkey Fikret Cetinkaya +90 221 317 745 0437 [email protected]
U.A.E. Robert Hall +971 4 403 0300 [email protected]
UK John Luke +44 20 7311 6461 [email protected]
U.S.A. Chris Xystros +1 757 616 7009 [email protected]
Uruguay Rodrigo Ribeiro +598 290 24546 [email protected]
Vietnam John Ditty +848 3821 9266 [email protected]
© 2011 KPMG International Cooperative (“KPMG International”). KPMG International provides no client services and is a Swiss entity with which the independent member firms of the KPMG net work are affi liated.

www.kpmg.com
The information contained herein is of a general nature and is not intended to address the circumstances of any particular individual or entity. Although we endeavour to provide accurate and timely information, there can be no guarantee that such information is accurate as of the date it is received or that it will continue to be accurate in the future. No one should act on such information without appropriate professional advice after a thorough examination of the particular situation.
© 2011 KPMG International Cooperative (“KPMG International”), a Swiss entity. Member firms of the KPMG net work of independent fi rms are affiliated with KPMG International. KPMG International pro vides no client services. No member firm has an y authority to obligate or bind KPMG International or any other member fi rm vis-à-vis third parties, nor does KPMG International have any such authority to obligate or bind any member firm. All rights reserved. Printed in the United Kingdom.
The KPMG name, logo and “cutting through complexity” are registered trademarks or trademarks of KPMG International.
RR Donnelley | RRD-261794 | November 2011