peanut cost and returns outlook for 2017 - clemson university - sc... · peanut cost and returns...
TRANSCRIPT

Peanut Cost and Returns Outlook for 2017
January 26, 2017
Nathan B. Smith, Ph.D.
Extension Professor and Economist

2017 Budgeting Considerations
• Yield Expectation • Two down years in SC,
• US down in 2016. Weather vs Rotation effects on yield?
• Fuel prices down but may ease up during the year.
• Fertilizer prices down in 2017
• Seed prices? Budgeted an increase.
• Updated machinery size and prices
• Updated chemical inputs
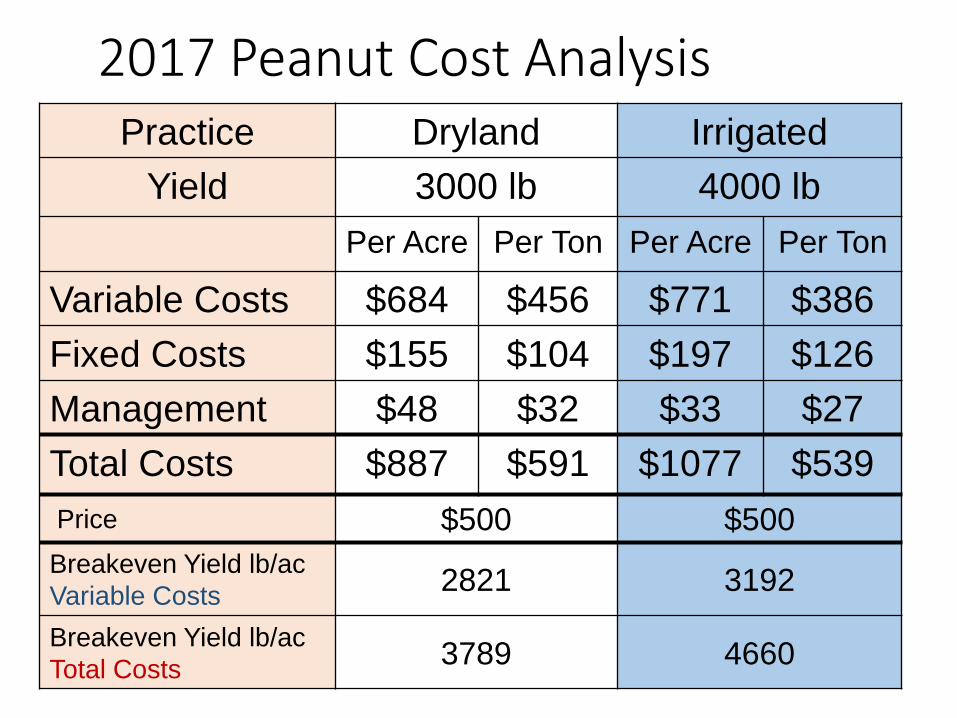
2017 Peanut Cost Analysis Practice Dryland Irrigated
Yield 3000 lb 4000 lb
Per Acre Per Ton Per Acre Per Ton
Variable Costs $684 $456 $771 $386
Fixed Costs $155 $104 $197 $126
Management $48 $32 $33 $27
Total Costs $887 $591 $1077 $539
Price $500 $500
Breakeven Yield lb/ac
Variable Costs2821 3192
Breakeven Yield lb/ac
Total Costs3789 4660

PRELIMINARY SUMMARY OF SOUTH CAROLINA CROP ENTERPRISE ESTIMATES, 2017
Conservation Tillage
EXPECTED YIELD per ACRE 750 lbs 3,000 lbs 120 bu 35 bu 80 bu
EXPECTED SEASON AVG PRICE $0.72 /lb $500 /ton $4.25 /bu $10.00 /bu $4.04 /bu
GROSS RETURN per ACRE
TOTAL VARIABLE COSTS per ACRE
RETURN ABOVE VARIABLE COST per ACRE
BREAKEVEN PRICE (Variable Cost) $0.69 /lb $456 /ton $3.73 /bu $9.57 /bu $3.75 /bu
TOTAL SPECIFIED FIXED COSTS per ACRE
TOTAL COST EXCL. MGT per ACRE
RETURN TO MGT per ACRE
BREAKEVEN PRICE (Total Costs) $0.98 /lb $591 /ton $4.90 /bu $14.09 /bu $5.88 /bu
BREAKEVEN YIELD per ACRE 1025 lbs 3,548 lbs 138 bu 49 bu 116 bu
$470
-$198 -$137 -$78 -$143 -$147
$738 $887 $588 $493
$224 $203 $140 $158 $170
$26 $66 $62 $15 $23
$514 $684 $448 $335 $300
$750 $510 $350 $323$540
Cotton
NON-IRRIGATED
Peanuts Corn Soybeans Sorghum
Grain

PRELIMINARY SUMMARY OF SOUTH CAROLINA CROP ENTERPRISE ESTIMATES, 2017
Conservation Tillage IRRIGATED
Cotton Peanuts Corn SoybeansEXPECTED YIELD per ACRE 1,000 lbs 4,000 lbs 200bu 55bu
EXPECTED SEASON AVG PRICE $0.72/lb $500/ton $4.25/bu $10.00/bu
GROSS RETURN per ACRE $720 $1,000 $850 $550
TOTAL VARIABLE COSTS per ACRE $580 $771 $660 $430RETURN ABOVE VARIABLE COST per ACRE $140 $229 $190 $120BREAKEVEN PRICE (Variable Cost) $0.58/lb $386/ton $3.30/bu $7.82/bu
TOTAL SPECIFIED FIXED COSTS per ACRE $332 $307 $285 $258TOTAL COST EXCL. MGT per ACRE $912 $1,078 $945 $688RETURN TO MGT per ACRE -$192 -$78 -$95 -$138
BREAKEVEN PRICE (Total Costs) $0.91/lb $539/ton $4.73/bu $12.51/bu
BREAKEVEN YIELD per ACRE 1,267 lbs 4,312 lbs 222bu 69bu

Corn vs Peanut
1)
2)
3)
4)
Irrigated corn is compared to irrigated peanut and non-irrigated corn is compared to non-irrigated peanut.
Irrigated corn yield is 160 bu. and irrigated peanut yield is 4000 lbs.
Non-irrigated corn yield is 120 bu. and non-irrigated peanut yield is 3000 lbs.
Prices shown are those needed to cover budgeted operating costs for conventional till production listed in the crop comparison tool.
* The above chart is based on the following assumptions:
$3.41 $3.53
$3.66 $3.78
$3.91 $4.03
$4.16 $4.28
$4.41 $4.53
$4.66 $4.78
$4.91 $5.03
$5.16
$2.00
$2.50
$3.00
$3.50
$4.00
$4.50
$5.00
$5.50
$6.00
$6.50
$7.00
$43
0
$44
0
$45
0
$46
0
$47
0
$48
0
$49
0
$50
0
$51
0
$52
0
$53
0
$54
0
$55
0
$56
0
$57
0
Co
rn P
rice
($/b
u)
Peanut Price ($/ton)
Corn Price Needed to Give Equal Returns Above Variable Costs to Peanuts at Budgeted Yields *
Non Irrigated Corn
Irrigated Corn

Cotton vs. Peanut
1)
2)
3)
4)
* The above chart is based on the following assumptions:
Irrigated cotton is compared to irrigated peanut and non-irrigated cotton is compared to non-irrigated peanut.
Irrigated cotton yield is 1000 lbs. and irrigated peanut yield is 4000 lbs.
Non-irrigated cotton yield is 750 lbs. and non-irrigated peanut yield is 3000 lbs.
Prices shown are those needed to cover budgeted operating costs for conventional till production listed in the crop comparison tool.
$0.63 $0.65
$0.67 $0.69
$0.71 $0.73
$0.75 $0.77
$0.79 $0.81
$0.83 $0.85
$0.87 $0.89
$0.91
$0.50
$0.55
$0.60
$0.65
$0.70
$0.75
$0.80
$0.85
$0.90
$0.95
$1.00
$43
0
$44
0
$45
0
$46
0
$47
0
$48
0
$49
0
$50
0
$51
0
$52
0
$53
0
$54
0
$55
0
$56
0
$57
0
Co
tto
n P
rice
($/
lb)
Peanut Price ($/ton)
Cotton Price Needed to Give Equal Returns Above Variable Costs to Peanuts at Budgeted Yields *
Non Irrigated Cotton
Irrigated Cotton

Soybean vs. Peanut
1)
2)
3)
4)
* The above chart is based on the following assumptions:
Irrigated soybean is compared to irrigated peanut and non-irrigated soybean is compared to non-irrigated peanut.
Irrigated soybean yield is 55 bu. and irrigated peanut yield is 4000 lbs.
Non-irrigated soybean yield is 35 bu. and non-irrigated peanut yield is 3000 lbs.
Prices shown are those needed to cover budgeted operating costs for conventional till production listed in the crop comparison tool.
$8.46 $8.89
$9.31 $9.74
$10.17 $10.60
$11.03 $11.46
$11.89 $12.31
$12.74 $13.17
$13.60 $14.03
$14.46
$4.00
$6.00
$8.00
$10.00
$12.00
$14.00
$16.00
$43
0
$44
0
$45
0
$46
0
$47
0
$48
0
$49
0
$50
0
$51
0
$52
0
$53
0
$54
0
$55
0
$56
0
$57
0
Soyb
ean
Pri
ce (
$/b
u)
Peanut Price ($/ton)
Soybean Price Needed to Give Equal Returns Above Variable Costs to Peanuts at Budgeted Yields *
Non Irrigated Soybean
Irrigated Soybean

Crop Insurance Prices
2014 2015 20162017Proj*
Corn $4.49 $3.68 $3.81 $3.87
Cotton $0.78 $0.63 $0.62 $0.71
Grain Sorghum $4.38 $3.64 $3.75 $3.80
Peanut, Runner $532.00 $416.20 $407.80 $395
Peanut, Virginia $532.00 $482.80 $493.40 $439
Soybean $11.19 $8.66 $8.91 $10.28
*2017 as off 1/25/17, South Carolina (Feb 28 Closing Date)

Compiled by Nathan Smith, Clemson Extension Economist, Source: NASS USDA, QuickStats*January 12, 2017 USDA NASS Annual Crop Production
2011 2012 2013 2014 2015 2016
Corn 360 330 350 295 295 375
Cotton 303 299 258 280 235 190
Peanuts 77 110 81 112 112 110
Soybeans 370 380 320 450 475 420
Tobacco (harvested) 15.5 12 14.5 15.8 13 13
Wheat 190 235 280 230 170 60
Total 1316 1366 1304 1383 1300 1168
South Carolina Major Row Crops Planted Acres*(1,000 Acres)

2017 Expectations
• Corn acres switch over to soybeans.
• Cotton Acres up, 5%-10%.
• Peanut up some.
• Soybean acres expected to increase.
• Spring wheat down
2017
CORN
COTTON
GRN.SORGHUM
PEANUT
SOYBEAN
WHEAT

Thank You
Nathan Smith
Sandhill Research and Education Center
803-788-5700 (o)
229-392-3948 (m)