pecos river ecosystem monitoring project
TRANSCRIPT

TR- 273 2004
Pecos River Ecosystem Monitoring Project
C. Hart A. McDonald
Texas Water Resources Institute Texas A&M University

- 146 -
2003
Pecos River Ecosystem Monitoring Project
Charles R. Hart, Extension Range Specialist, Fort Stockton
Alyson McDonald, Extension Assistant – Hydrology, Fort Stockton SUMMARY The Pecos River Ecosystem Project is attempting to minimize the negative impacts of saltcedar on the river ecosystem, and improve the efficiency of water delivery and stream flow. The project is designed to decrease the number of saltcedar with aerial application of herbicide along the banks of the river. The project is concerned with the effect of saltcedar on both quality and quantity of the water of the Pecos River as a result of mortality of the plant from along the banks. Specifically, the study is mainly interested in water delivery efficiency and salinity of the river. The effects of saltcedar on water quality are observed through a series of annual water samples taken along the river from Red Bluff Reservoir to Girvin, hourly electrical conductivity measurements at two sites, and comparison of this data to historical water quality data. Any change in water quantity is determined by comparing historical release/delivery schedules to current schedules from the Red Bluff Water and Power Control District. Water salvage from control of saltcedar is being estimated using a series of shallow groundwater monitoring wells. OBJECTIVES Saltcedar is the most widely and evenly distributed non-native invasive phreatophyte in Texas. It was introduced to the United States in the early 1800's and in 1925 saltcedar was planted to improve streambank stabilization. Since its introduction, saltcedar has dominated native vegetation and developed into a monoculture along riverbanks. Saltcedar has been documented to cause enormous impacts on river ecosystems including increased salinity of the soil and water, increased flooding from increased sedimentation and decreased channel width, and increased water loss due to high evapotranspiration rates. The specific objectives of the monitoring aspects of the Pecos River Ecosystem Project are: 1. Document acreage treated and mortality achieved 2. Monitor native vegetation recovery 3. Economics of saltcedar control 4. Current vs. historical release/delivery data 5. Measuring water quality (salinity) changes 6. Estimating water salvage a. Shallow groundwater wells b. Sap flow measurements c. Seepage runs and flow nets to estimate fate

- 147 -
MATERIALS AND METHODS Water quality Salinity of river water is measured from water samples taken annually at ten locations from the Red Bluff Reservoir to Girvin (Figure 1). Total Dissolved Solids (TDS) and Total Suspended Solids were measured for each sample taken in 1999-2001. The procedures involved with determining TDS and TSS are described. TDS analysis starts with washing the filter disk with 500 ml of reagent-grade water. This is accomplished by placing the filter disk into a filtration apparatus attached to a vacuum. The 500 ml of water is gradually added as the vacuum is applied and suction is continued until all traces of water are removed. The filter is then transferred to a heat cleaned dish and placed in a drying oven at 180°C for 24 hours. The filter is cooled in a desiccator and the oven dry weight recorded. The filter is stored in desiccator until needed. The next step is to filter the water sample. The cleaned and dried filter is again placed in the filtration apparatus. A 500 ml sample is then poured gradually onto the filter as the vacuum is applied. Reagent-grade water is then used to rinse the inside of the filtration apparatus to insure all the sample has gone through the filter. The filtrate is then poured into a 100 ml flask and then transferred into heat cleaned 125 ml flask, for which the weight has been recorded and placed in a desiccator until needed. A duplicate for each of the ten water samples taken was also prepared, as well as a control using filtered reagent-grade water. The flask is then placed in the drying oven at 100°C until the filtrate is completely evaporated. Then the flask is dried for an additional 24 hours at 180°C. The flask is cooled in the desiccator and then weighted. The difference between the original weight and the weight after drying of the flask multiplied by two gives the TDS (g/l) of the water sample. Total Suspended Solids is determined from the before and after weight of the filter disk following filtration. After filtration, the filter is placed back into the dish and dried in the oven for 24 hours at 103° - 105°C. A filter used in reagent grade water TDS analysis served as a control. The difference between the original weight and the weight after filtration and drying multiplied by ten results in the TSS (g/l) of the water sample. Electrical conductivity was measured with a conductivity meter from water samples taken in 1999-2003. An unfiltered sample of water in placed in a 50 ml beaker. The conductivity meter is placed in the sample up to the maximum immersion level without touching the bottom of the beaker. The meter is gently stirred around in the solution and then read from the conductivity from the meter when it stabilizes. The reading is in µS/cm. This reading can then be converted to parts per million (ppm) by dividing the reading in µS/cm by 1000 converting it to dS/m. The number is then multiplied by 640 making the number equivalent to ppm. A control using reagent-water was also performed here. Additionally, electrical conductivity measurements were made at two sites near Mentone, Texas with continuous monitoring loggers placed in the river. Measurements are taken each second and an hourly average (µS/cm) recorded. The loggers were placed in PVC pipe secured to the bottom of the river. Logging began in February 2001 and continues through 2003.

- 148 -
Water quantity/flow Water quantity is monitored through release and delivery data from Red Bluff Water and Power Control District and with shallow groundwater monitoring wells. Water released from Red Bluff Reservoir and delivered to seven local irrigation districts along the Pecos River is recorded daily during the irrigation season. Release and delivery data is obtained from weirs located at point of release from Red Bluff Lake and at each irrigation turnout point on the river. Historical release and delivery data have also been provided by the Red Bluff Water and Power Control District, with pre-treatment averaged from 1988 through 1999. Flow data is obtained from United States Geological Survey (USGS) Gauging Station 13257 located at Girvin. This gauging station is the southern end of the Red Bluff Water and Power Control District boundary. Water released from Red Bluff Reservoir that is not delivered to upper districts is captured at Imperial Reservoir, located upstream from the USGS gauging station. Estimating Water Salvage Water salvage from saltcedar control is estimated by monitoring groundwater diurnal fluctuations within saltcedar sites. Shallow groundwater monitoring wells were installed at a study site located on the Pecos River near Mentone to provide data on the fluctuation of the groundwater table. The wells were constructed by hand auguring through the soil profile into the water table until gravel or a thick clay layer was encountered. Each well consisted of a 7.62 cm hand bored opening in which a 5.08 cm diameter PVC pipe with a 1.22m long well screen attached was inserted to the bottom of the boring. The slots in the well screen were 0.01 mm. The PVC pipe extended approximately 0.9 m above the soil surface. Blasting sand was used to fill the annular space around the well casing to within 0.3 m of the soil surface. The last 0.3 m of annular space was capped with pre mix cement to prevent overland flow entering the annular space around the well casing. During the coring process, soil samples were taken for each 0.3 m interval for laboratory analysis to determine soil particle size distribution. River depth monitors were also installed by placing a PVC pipe down the bank of the river to the bottom of the river. Detailed vegetation analysis is also conducted within the river sites. For more detailed information of this procedure, see Hays 2003. Water level loggers (Global Water Instrumentation, Inc. Model WL14X) were used to measure hourly water levels in the wells. The sensor on the WL14X is a submersible pressure transducer that is amplified and temperature and barometric pressure compensated with an accuracy of 0.2%. Loggers used in this study had an accuracy of 0.0091 m. The loggers were battery powered, stored 6000 readings and were downloadable in the field. The loggers were calibrated prior to being placed in the wells, and the data was downloaded and the batteries changed twice per year. Additionally, wells are cleaned annually to remove silt and root accumulation. The

- 149 -
loggers were set to record water levels in feet every hour. Data is then subject to an empirical modeling procedure to smooth the data, remove unusable days, and calculate total daily water loss. Daily water losses are averaged by month and used to estimate total water loss for the month and year.
A paired plot design was used, with 4 monitoring wells and a river monitor at each of two sites. Each site was monitored for an entire growing season (Dec.1999 through September 2001). The relationship between wells across sites was established through simple linear regression. In September 2001, one site was treated with Arsenal herbicide and the saltcedar killed. Comparisons are made between sites before and after treatment, and between untreated and “predicted” untreated sites.
RESULTS AND DISCUSSION Water quality Water quality, TDS and TSS, was determined from samples that were obtained in 1999 through 2001. Electrical conductivity was measured in August 1999-2003. As of this writing, the August 2003 data was not yet available. A map showing the area and location of the ten water sampling sites is given (Figure 1). August samples are presented graphically in Figure 2. Electrical conductivity (salinity) of Pecos River water doubled from 7,300µS/cm at Red Bluff Lake Dam to 15,460µS/cm at Girvin, Texas during pre-treatment samples taken in August 1999. Samples taken during August 2000 indicate salinity levels were still increasing down river, but not to the extent of pre-treatment levels. By the August 2001 sampling date, approximately 60 river miles of the Pecos River had been chemically treated for saltcedar control. During this sampling period, similar down river increases were not seen, but salinity levels were higher at Red Bluff Dam. This can be attributed to lower lake levels during the 2001 irrigation season. Samples taken during the 2002 growing season show a high variability among sites. This is due to the fact that no irrigation water was released from Red Bluff during the 2002 or 2003 growing seasons. Changes in salinity, then, were influenced by natural inputs into the river at various locations. We cannot say conclusively that saltcedar control has any effect on water salinity. Electrical conductivity measurements were also recorded hourly from two sites near Mentone, Texas during 2001 through 2003. Corresponding measurements of river level are taken to explain sudden drops in salinity after rain events swell the river and dilute the salts. Figures 3 through 8 show hourly electrical conductivity and river levels for the two sites during 2001 through 2003. It should be noted that Red Bluff was releasing during 2001 growing season but did not release irrigation water during the entire 2002 and 2003 growing seasons.

- 150 -
Figure 1. Water sampling sites from Red Bluff Lake to Girvin, Tx along the Pecos River.
Figure 2. Electrical conductivity of Pecos River water at 10 sites from Red Bluff Lake to Girvin, Texas sampled annually from 1999-2002.
0
5000
10000
15000
20000
25000
30000
Red Bl
uff 2 3 4 5 6 7 8 9Girv
in
µs/c
m
Aug-99 Aug-00 Aug-01 Aug-02

- 151 -

152

153

154
Water Quantity The first step taken was to determine if a relationship existed between water released at Red Bluff Lake and the amount of flow measured at Girvin. A coefficient of determination was performed on flow (ac-ft) measured at Girvin and the volume of water (ac-ft) released from Red Bluff Reservoir, where r2 = 0.15 (p<0.05). The low correlation provides evidence that release from Red Bluff Reservoir is not related to flow through the USGA station at Girvin. Once it was determined that loss occurring from release and delivery were not related to Girvin, release and delivery data were analyzed and the Girvin data was not utilized in the analysis. It was observed that during certain time periods within a delivery year, percent loss changes considerably. This pattern precipitated dividing the irrigation delivery year into three categories, first month of release and delivery, release and delivery during the growing season and release and delivery during late season. First month releases during this time period did not occur during the same month each year but varied between March and April. Delivery months were then numbered consecutively from the first month of release each year. The three categories allowed for a characterization of when changes in percent loss occurred during the delivery year. A monthly average was calculated for each of the three delivery categories (Table 1, Figures 9-11). The first month of release (7,862 ac-ft) with a delivery of 2,927 ac-ft resulted in an average percent loss of 68%. Monthly releases increased during the growing season to an average of 11,015 ac-ft, but losses decreased to 39%. Average release for late season showed to be the lowest, 3,534 ac-ft, and had a loss of 43%. It is obvious that much of the release during the first month is used to “re-charge” the banks that were naturally “drained” during the non-irrigation winter months. This first month can account for a significant amount of the water lost during the irrigation delivery year (Figure 9).
Table 1. Average monthly release, delivery and percent loss for three release and delivery periods for the Pecos River from 1988-1999.
Average Monthly
Delivery Period Release Delivery
Percent Loss
First Month 7,862 2,927 68%
Growing Season 11,105 6,648
39%
Late Season 3,534 2,074 43%

155

156

157
An average pattern of release and percent loss was also determined for each month from 1988 through 1999 during the period of a delivery year (Figure 10). The highest average loss occurred during the first month (67%) of release. Percent loss decreased during the second month of release, and for the next five months of release the loss ranged from 32% to 47%. However, when the amount of water released begins to decrease in month seven, the percent loss begins to increase (46%) and by month nine, the loss increased to 64%. Ultimately, this release and delivery data from pre-treatment years will be compared to post-treatment years to determine if control of saltcedar increases the delivery efficiency thereby decreasing the loss of water during the irrigation period. While the project is on-going, only two years delivery data post-treatment (2000-2001) is available for comparison. Only a small portion of the Red Bluff District had been treated during those delivery years. During the 2002 delivery season, no water was released from Red Bluff Lake for delivery to irrigation districts. It is uncertain if deliveries will be made in 2003 at this time. As irrigation delivery resumes, comparisons of pre-treatment to post-treatment will be made. Estimating Water Salvage The drawdown-recharge method of calculation (Fig. 13) was used to estimate water use from hourly measurement of diurnal fluctuations of the water table (Hays, 2003). This method assumes little evapotranspiration occurs during the nighttime (21:00 to 8:00 hours) and that the period from the low point of the water table during daylight hours to the nighttime high can be used to calculate a recharge rate for the drawdown period. This method requires a drawdown and recharge diurnal cycle; hence, days when the water table rapidly rises or falls through out the diurnal cycle were excluded from the calculations. A standardized procedure-analysis software program was developed for the calculations. Shallow groundwater wells have been monitored during the 2001 through 2003 growing seasons. Total water loss is calculated for each of the two sites for each year monitored. During the 2001 growing season, irrigation was released as normal from Red Bluff Lake, but no irrigation was released during the 2002 and 2003 seasons. Figure 14 shows river level across the 2001 through 2003 growing seasons. Due to the lack of river flow during the 2002 and 2003 growing seasons, several of the wells were dry during the year; hence only the wells closest to the river are reported at this time. Water loss varied from 5.6 acre-feet at well location B1 to 9.7 acre-feet at well location A1 for the 2001 growing season. Herbicide treatment was applied to site A at the end of the 2001 growing season. Nearly 100% control of all vegetation was observed at the end of the 2002 growing season. Figure 15 shows the diurnal fluctuations in the groundwater table during July of each of the years for well locations A1 and B1. Note that on site B1 (untreated site), the diurnal fluctuations are evident for all three years. However, on site A1 (treated after the 2001 growing season), the diurnal fluctuations disappear during the 2002 and 2003 growing season. This is attributed to the fact that the saltcedar was killed on this site after the 2001 growing season.

158
Figure 13. Diurnal fluctuation in groundwater and representation of drawdown-recharge method of calculation water loss.
Figure 14. River level of the Pecos River at the groundwater well monitoring sites during the 2001 through 2003 growing seasons, showing higher river flow during the 2001 irrigation season compared to 2002 or 2003.
3
4
5
6
7
8
9
10
11
Wat
er L
evel
(ft
.)
B4r 2001 B4r 2002 B4r 2003
JuneMayApril July August September October November

159
Figure 15. Graphs showing shallow groundwater levels at sites A1 (Treated) and B1 (Untreated) during the month of July for the 2001 through 2003 growing seasons. Saltcedar on the treated site was killed after the 2001 growing season. Note the absence of diurnal fluctuations on the treated site during the 2002 and 2003 growing season.
Untreated Site, July 2001-2003
0
1
2
3
4
5
6W
ater
Lev
el (
ft.)
2001
2002
2003
Treated Site, July 2001-2003
0
1
2
3
4
5
6
Wat
er L
evel
(ft
.)
2001
2002
2003
160
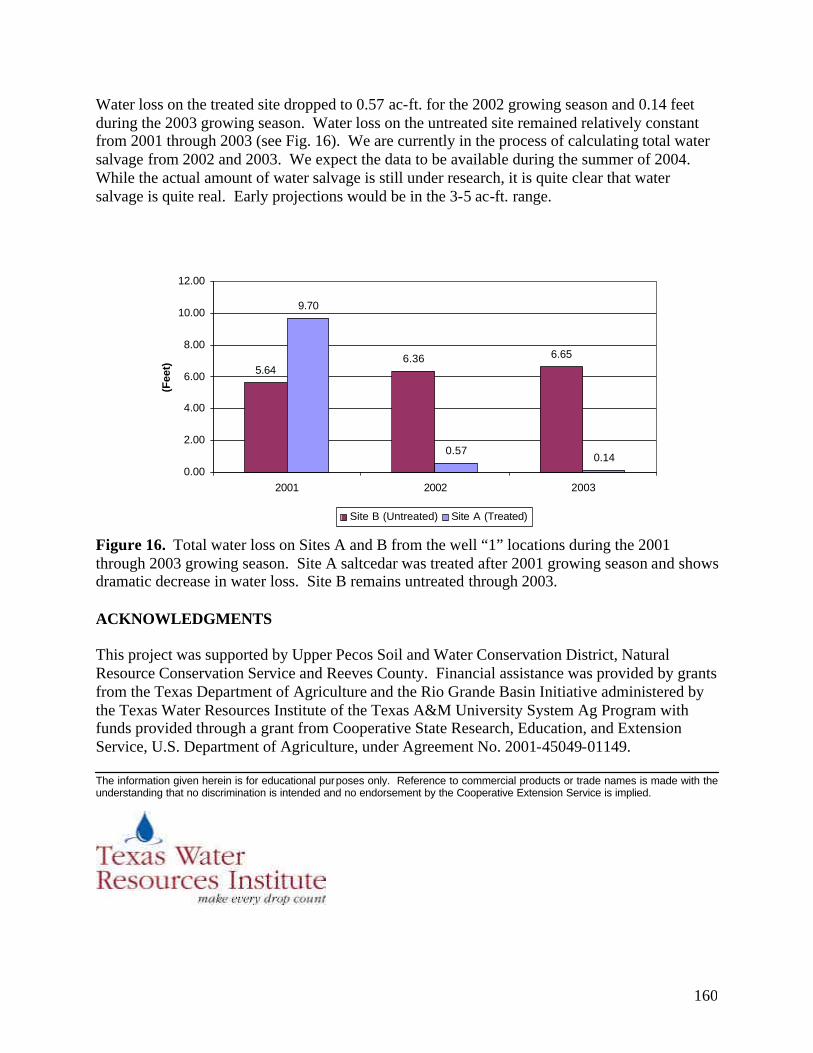
Water loss on the treated site dropped to 0.57 ac-ft. for the 2002 growing season and 0.14 feet during the 2003 growing season. Water loss on the untreated site remained relatively constant from 2001 through 2003 (see Fig. 16). We are currently in the process of calculating total water salvage from 2002 and 2003. We expect the data to be available during the summer of 2004. While the actual amount of water salvage is still under research, it is quite clear that water salvage is quite real. Early projections would be in the 3-5 ac-ft. range. Figure 16. Total water loss on Sites A and B from the well “1” locations during the 2001 through 2003 growing season. Site A saltcedar was treated after 2001 growing season and shows dramatic decrease in water loss. Site B remains untreated through 2003. ACKNOWLEDGMENTS This project was supported by Upper Pecos Soil and Water Conservation District, Natural Resource Conservation Service and Reeves County. Financial assistance was provided by grants from the Texas Department of Agriculture and the Rio Grande Basin Initiative administered by the Texas Water Resources Institute of the Texas A&M University System Ag Program with funds provided through a grant from Cooperative State Research, Education, and Extension Service, U.S. Department of Agriculture, under Agreement No. 2001-45049-01149. The information given herein is for educational purposes only. Reference to commercial products or trade names is made with the understanding that no discrimination is intended and no endorsement by the Cooperative Extension Service is implied.
5.646.36 6.65
9.70
0.570.14
0.00
2.00
4.00
6.00
8.00
10.00
12.00
2001 2002 2003
(Fee
t)
Site B (Untreated) Site A (Treated)