pediatric nutrition surveillance of missouri
TRANSCRIPT
PPeeddiiaattrriicc NNuuttrriittiioonn SSuurrvveeiillllaannccee ooff MMiissssoouurrii
22000022 SSuummmmaarryy RReeppoorrtt
MMiissssoouurrii DDeeppaarrttmmeenntt ooff HHeeaalltthh aanndd SSeenniioorr SSeerrvviicceess

2
Missouri Department of Health and Senior Services In accordance with Federal law and U.S. Department of Agriculture policy, this institution is prohibited from discriminating on the basis of race, color, national origin, sex, age, or disability. To file a complaint of discrimination, write to USDA, Director, Office of Civil Rights, 1400 Independence Ave. SW, Washington, DC, 20250-9410, or call (800) 795-3272 (voice) or (202) 720-6382 (TDD). Persons with disabilities who require alternative means for communication of program information (Braille, large print, audiotape, etc.) should contact USDA's TARGET Center at (202) 720-2600 (voice and TDD).

3
TTAABBLLEE OOFF CCOONNTTEENNTTSS
Executive Summary … 4
2002 Pediatric Nutrition Surveillance of Missouri … 6
CHARACTERISTICS OF THE PEDNSS PARTICIPANTS … 7 INFANT HEALTH INDICATORS … 9
Birthweight Indicators Low Birthweight High Birthweight
INDICATORS OF NUTRITIONAL STATUS OF CHILDREN … 13 Growth Indicators
Short Stature Underweight Overweight and ‘at Risk of Overweight’ Low Hemoglobin
BREASTFEEDING PRACTICE … 19
Initiation Duration
Conclusions and Recommendations … 22
Literature Cited …. 23

4
EExxeeccuuttiivvee SSuummmmaarryy
The Pediatric Nutrition Surveillance System (PedNSS) is a public health data system providing monitoring of indicators of nutritional health of low-income children enrolled in public nutrition programs. Missouri collects this information from participants in the Special Supplemental Nutrition Program for Women, Infants, and Children (WIC). Indicators of nutritional and health status reported include birthweight, stature, underweight, overweight, and low hemoglobin, as well as initiation and duration of breastfeeding.
In 2002, the racial/ethnic composition of the WIC participants in Missouri was higher for all races/ethnicities than the U.S. Decennial Census 2000 of the populous of the state, except for White. Greater rates of increase in Hispanic and ‘Other/Unknown’ races/ethnicities have been observed for WIC participants than for the general population. Most of the infants and children certified are 2-4 years old (40.9%), while fewer are infants 0-11 months old (32.4%) and 1-2 years old (26.7%).
• Low Birthweight
Infants born less than 2,500g (5lb. 8oz.) are categorized as low birthweight (LBW) and are susceptible to increased morbidity and mortality. The percentage of WIC infants born in Missouri with low birthweight (9.3%) has held fairly steady for the past 10 years. The Healthy People goal for 2010 is 5.0%. As in past years, low birthweight is more common among Black/African Americans (13.3%) than other races/ethnicities and least common among Asian/Pacific Islanders (5.3%).
• High Birthweight
Infants are considered high birthweight if they weigh greater than 4000g (8 lbs. 12 oz.) at birth. The percent of infants born of WIC participants in Missouri with high birthweight (HBW) has been decreasing steadily for the past 5 years. The percentage of infants born with high birthweight in WIC in Missouri was similar to the proportion of infants born with high birthweight reported nationally (7.3% high birthweight in Missouri (WIC) and 7.6% high birthweight for the Nation in 2002).
• Short Stature
Children and infants with stunting from impaired growth, i.e., 5th percentile of a standardized population are at increased risk for infections and lowered resistance to disease. Short stature occurs among all WIC participants in Missouri at 6.7%, nearly the anticipated rate of 5.0%. Short stature was most common among Black/African American children at 7.4%.
• Underweight The percentage of children 2-4 years of age that are categorized as underweight, i.e., the
lower 5th percentile of the growth chart, has continued to decline over most age groups and most races/ethnicities in WIC in Missouri, except for Asian/Pacific Islander. Underweight among Asian/Pacific Islander children has reached the highest percentage in 9 years (7.6%). In 2002, underweight among Asian/Pacific Islanders equals the rate for Black/African American children who have consistently had the highest rates since 1994.
• Overweight and At Risk of Overweight
Overweight among children is reaching unprecedented levels in the United States, affecting both their health and self-esteem.1 For the PedNSS, CDC assigns a child to the ‘at risk for overweight’ category if his/her weight-for-length or body mass index (BMI) equals or

5
exceeds the 85th percentile, but is less than the 95th percentile of the CDC 2000 growth chart for his/her age. The overweight category is assigned to children greater than or equal to the 95th percentile. Overweight has steadily increased over the past 10 years in Missouri as well. In 2002, 17.4% of the children 1-2 years old were overweight. The problem of overweight spans all races/ethnicities and in this surveillance becomes more common with increasing age for children aged over 2 years.
• Low Hemoglobin
Low hemoglobin is an indicator of iron deficiency anemia, primarily reflecting low or biologically unavailable iron content in the diet, but it is also an indicator of overall diet quality. Reduced levels of hemoglobin (<11ug/dL) contribute to developmental abnormalities in infants and children. Prevalence of low hemoglobin among children in PedNSS has decreased 3.0 percentage points or 18.6% over the past 10 years Nationally. Among Missouri WIC participants, rates have decreased 9.5 percentage points or 36% over the past 10 years but still ranks among the worst (40th of 46 states/tribes/territories) in the National surveillance in the rate of low hemoglobin.
The Healthy People 2010 goal is to reduce the rate of iron deficiency among children 1-2 years old of low-income families to 12%. The rate for 1-2 year old children in Missouri WIC is 19.0% in 2002. Among the races/ethnicities, Black/African American (26.8%), Asian/Pacific Islander (19.3%), and Other/Unknown (20.7%) had the highest rates of low hemoglobin.
• Breastfeeding Practice
Feeding exclusively breast milk for the first 6 months of life is recommended by the American Academy of Family Physicians and by the American Academy of Pediatrics.2 Breast milk provides resistance to infectious diseases such as diarrhea, ear infections, respiratory tract infections and otitis media by enhancing the infant’s immune system.3 Breastfeeding has also been shown to lower the risk of childhood obesity.4 To promote health among the American public, the Healthy People goal for 2010 is for 75% of all infants to be breastfed early postpartum and for 50% to be breastfed at least 6 months. Although improvements from 2001 were smaller than past increments, increasing trends were observed among all races/ethnicities in prevalence of breastfeeding among women participating in WIC in Missouri. Over the past 10 years there has been an increase of 15.3 percentage points or a 47% increase in breastfeeding initiation rates in Missouri WIC.
CONCLUSION
The greatest improvements among the WIC population for Missouri are observed in the prevalence of breastfeeding and the participation of minorities in nutrition programs. Nutritional deficiencies that continue to be displayed among the pediatric population served by WIC in Missouri include low birthweight among Black/African American infants, short stature among infants, and low hemoglobin among age and race categories aged <3 years. Developments of interest include the increase in underweight among Asian/Pacific Islander children and overweight among all children. All race and age groups over 12 months of age are experiencing high and increasing rates of overweight and ‘risk of overweight’. More information, perhaps an inquiry of infant/child feeding practices, is needed to understand the onset of overweight among these very young children.

6
22000022 PPeeddiiaattrriicc NNuuttrriittiioonn SSuurrvveeiillllaannccee ooff MMiissssoouurrii DDeeppaarrttmmeenntt ooff HHeeaalltthh aanndd SSeenniioorr SSeerrvviicceess
The Centers for Disease Control and Prevention (CDC) established the Pediatric Nutrition Surveillance System (PedNSS) to assist the public health care system in monitoring long-term trends during their efforts to improve nutritional status among low-income, high-risk infants and children.
The CDC is the federal bureau charged with monitoring and improving the health of the American public. In the late 1960’s, President Johnson waged a “War on Poverty”. Subsequently, many public health programs began to emerge including Head Start, Medicare, Medicaid, and Community and Migrant Health Centers. The “Ten State Nutrition Survey (1968-1970)” conducted by the U.S. Department of Agriculture (USDA) was among the early initiatives. The “Ten State Nutrition Survey” became the basis for an assessment of nutritional health of children based on height and weight.5 It was determined that children of low-income families displayed evidence of poor nutrition and delayed development. Henceforth, CDC’s mission was expanded from exclusively communicable diseases to a broader one of prevention, and was charged with establishing a nationwide program-based health and nutrition surveillance system. As of 2001, 40 states, 2 territories, and 6 tribes contributed to the PedNSS (herein Nation or National). Data from many programs across the country are combined into one dataset. Height, weight, and a measure of red blood cell volume, are collected to assess the nutritional status of the child; maternal behaviors that influence health are also surveyed, such as breastfeeding practices and smoking. These are recognized as having associations with health risks. Descriptive data are collected for each participant such as race/ethnicity, age of child, household income, and location (clinic, county, region, state). States provide the data to the CDC and in return, the CDC provides a compilation of tables and figures. The results reflect only the behaviors and health status of the specific population studied. Nevertheless, the PedNSS has provided a means of characterizing populations with highest nutritional health risks and tracking trends over time. The PedNSS has provided feedback that has allowed development of more effective health care and nutrition programs over the years.
The data for Missouri are collected in coordination with administration of the Special
Supplemental Nutrition Program for Women, Infants, and Children (WIC) funded by the USDA. To be categorically eligible for WIC, the family member must meet the income guidelines and have a nutritional/health risk. Supplemental foods specific to their nutritional needs are provided to prenatal mothers, breastfeeding and non-breastfeeding mothers, infants, and children up to 5 years of age.
The annual PedNSS report summarizes the nutritional health status of infant and child
participants. Indicators of nutritional and health status monitored include birthweight, stature, underweight, overweight, low hemoglobin, and breastfeeding practices. Missouri results are compared to the National results gathered from programs similar to WIC. In traditional epidemiologic format, results are presented with regard to race/ethnicity and age.
The “Healthy People in 2010” objectives are goals set forth by the U.S. Department of
Health and Human Services for all public health agencies working toward improving the health of the U.S. citizens.6 The goals of Healthy People 2010 provide a common target for all health practitioners, thus unifying efforts across diverse populations and disciplines.

7
The PedNSS report provides the following measures of nutritional health for the
participants in WIC in Missouri: • nutritional status of low-income children aged 0-4 years; • trends of nutrition and health indicators from 1992 to 2002; • comparison of nutrition and health indicators between 2001 and 2002; and • progress toward the 2010 Healthy People goals for public health.
Changes for 2002 Analyses
Each year, CDC strives to improve the analyses and data handling process. In 2002, two changes have been made to data handling processes. First, breastfeeding analyses at the National level previously used the first visit of each participant, but beginning this year (2002), the last recorded visit of the participant was used. This has resulted in more records for the breastfeeding duration analyses Nationally. In particular, more location entities (clinics, counties, region, state) have fulfilled the minimum 100 records required to publish breastfeeding initiation rates. The revision has also slightly impacted National breastfeeding rates. When applied to 2001 data for the Nation, the rate of ‘ever-breastfed’ shifted up 0.2%, ‘breastfed-6 months or more’ shifted down –0.5%, and the rate of ‘breastfed-12 months or more’ shifted down –0.3%. The shifts for individual states are expected to be slight as well, but are unknown. Missouri has always used the last recorded visit, so statewide values will not be affected by this change. Second, new tables were made available from data compiled for 3 years of data, as well as data compiled by local agency. Three-year data compilations are provided to increase the availability of results for agencies and categories that typically are unreported due to fewer than 100 participants.7 Though these data were not incorporated into this report, they are available upon request. Due to concerns about the completeness of the 2002 data report, this report was delayed. Missouri data presented for 2002 are from the trend tables from the 2003 PedNSS report. Following a brief overview of the composition of the populations to be compared, each of the indicators of nutritional status and health of infants and children will be reviewed. The trend of prevalence of the condition for the WIC participants in the state of Missouri over the past decade will be examined followed by a comparison by race/ethnicity and age and with the surveillance compilation at the ‘National’ level. Results for Missouri-WIC in 2002 will be compared to observations for the previous year. CHARACTERISTICS OF THE PEDNSS PARTICIPANTS
Race/Ethnicity
The racial/ethnic composition of the population served by WIC in Missouri is different from that of the Nation (Fig. 1). Most notably, Missouri serves a greater proportion of White children and a lesser proportion of Hispanic and Asian/Pacific Islander children than the Nation.

8
Racial/Ethnic Composition
21.77.2
66.6
39.120.8
32.2
0.2 1.2 3.31 3.53.20
20
40
60
80
100
Missouri Nation
Perc
ent
White Black/African American Hispanic American Indian/Nat ive Alaskan Asian/Pacif ic Islander Other/Unknown
Figure 1. Racial/Ethnic composition of participants in the PedNSS in Missouri and the Nation, 2002. (Source: CDC. 2002 PedNSS, Table 1D, CDC. 2003 PedNSS, Table 4C). Although racial/ethnic composition of the 2002 population remained similar to 2001 for
Missouri, changes are evident long term. The proportion of the population served by WIC that are of Hispanic ethnicity has more than doubled in the last 5 years (N=4,418, 3.0% in 1997 to N=9,586, 7.2% in 2002) while “Other/Unknown” has tripled (N=1,472, 1.0% in 1997 to N=4,270, 3.2% in 2002) (Fig. 2).
Race/Ethnic Trends in Missouri
1.00.80.23.0
24.9
70.1
3.21.00.27.2
21.7
66.6
0
20
40
60
80
100
Whi
te, N
otH
ispa
nic
Bla
ck/A
frica
nAm
eric
an
His
pani
c
Amer
ican
Indi
an/A
lask
aN
ativ
e
Asia
n Pa
cific
Isla
nder
Oth
er/U
nkno
wn
Perc
ent
Figure 2. Racial/Ethnic composition of participants in the PedNSS in Missouri, 2002 and 1997. (Source: CDC. 2003 PedNSS, Table 18C)
1997
2002

9
Age
The age distribution of PedNSS in Missouri in 2002 was similar to that for Missouri in 2001 and to the Nation in 2002 (Fig. 3). As is normally the case, more children are certified in
Age
24.2 25.5 25.9
36.633.132.4
21.725.426.7
15.816.016.7
0
20
40
60
80
100
Missouri '02 Missouri '01 Nation
Perc
enta
ge
0-11 mo. 12-23 mo. 24-35 mo. 36<60 mo.
Figure 3. Comparison of distribution of Age of Children in the Nation 2002 (N=5,333,226) and when certified in the WIC program in Missouri in 2002 (N=133,450) and 2001 (N=135,205)(Source: CDC 2002 PedNSS, Table 1C, 1D; CDC 2001 PedNSS, Table 1C).
WIC agencies in Missouri the first 0-5 months (30.4%) than 6-11 months (2.0%) of the first year of life. In Missouri in 2002, 40,569 infants 0-5 months of age were assessed and certified at WIC agencies, whereas only 2,612 infants (1/15 as many) were assessed and certified during the 6-11 months of life. Infants are certified in WIC for 1 year and are recertified after their first birthday. This policy is reflected in the data by reduced numbers in the 6-11 month age category. INFANT HEALTH INDICATORS
Birthweight Indicators Low birthweight (LBW) is highly correlated with infant mortality. Disorders related to
short gestation and LBW ranked second in the cause of all infant deaths (16%) in 2000 nationally 8. Maternal behaviors/characteristics associated with infants with LBW include drinking, smoking, substance abuse, low pregnancy weight gain, low prepregnancy weight, teenaged-mothers, mothers aged over 44, and pre-term birth.6 Premature or multiple birth infants may require two years or more to reach normal size.9 A LBW infant weighs less than 2,500 grams (5 lbs. 8 oz.) when born. A high birthweight (HBW) infant weighs greater than 4,000 grams (8 lbs. 12 oz.) when born. A HBW infant may have suffered a more difficult delivery and has an increased risk of perinatal morbidity and mortality, as well.
26.7 %

10
Low Birthweight
The percent of infants in WIC born with low birthweight (LBW), i.e., less than 2,500 g (5 lbs. 8 oz.) has held steady for the past 10 years (Fig. 4). The percentage of WIC infants born with LBW in Missouri was similar to the proportion of infants born with LBW reported Nationally (9.3% LBW in Missouri and 8.9% LBW for the Nation). Prevalence of LBW among infants enrolled in the WIC Program has increased slightly from last year but is not outside the tolerance limits of the mean (Fig. 5). Prevalence of LBW infants in WIC in Missouri (9.3%) far exceeds the Healthy People 2010 objective to reduce the prevalence of LBW to 5.0% of all live births. More Black/African American infants were born of LBW than the other races/ethnicities (Fig. 5).
Low Birthweight
8.9
9.3 9.2 9.1 9.3
8.9
9.19.29.29.29.0
8.9
9.3
9.2 9.2 9.0 8.7 8.8 8.9 8.9 8.9
9.0
0
5
10
15
20
1992 1993 1994 1995 1996 1997 1998 1999 2000 2001 2002
Perc
ent
Missouri Low BirthweightNational Low Birthweight
Figure 4. Percentage of live births in WIC with low birthweight (<2,500 g) in Missouri and the Nation from 1992 to 2002. The Healthy People 2010 target is to reduce the prevalence of low birthweight among all live births to 5.0%. (Source: CDC. 2003 PedNSS, Table 12C, CDC. 2002 PedNSS, Table 18D). (Please note, scale has been truncated).
2010 Target 5.0%

11
Low Birthweight
9.3
7.15.3
6.3
13.3
8.3
0
5
10
15
20
Whi
te, N
otH
ispa
nic
Blac
k/Af
rican
Amer
ican
His
pani
c
Amer
ican
Indi
an/A
lask
anN
ativ
e
Asia
n/Pa
cific
Isla
nder
Oth
er/U
nkno
wn
Ove
r Al
lRac
es/E
thni
city
Perc
ent
*insufficient number of participants available to establish a reliable estimate.
Figure 5. Prevalence (percentage) of low birthweight infants (<2,500g) among the race/ethnic groups participating in WIC in Missouri. The Healthy People 2010 target is to reduce the rate of low birthweight to 5.0% of all live births by the year 2010. (Source: 2003 MO PedNSS Table 18C). (Please note, scale has been truncated).
High Birthweight
Infants are considered high birthweight (HBW) if they weigh greater than 4,000g (8 lbs. 12 oz.) at birth. The percentage of infants born in Missouri with HBW has been decreasing steadily for the past 5 years (Fig. 6). The percentage of infants born with HBW in WIC in Missouri was
High Birthweight
7.37.67.98.18.48.58.68.28.3
8.5
8.4
8.48.4
8.5 8.6 8.7 8.5 8.5 8.4 8.3 7.9 7.6
0
5
10
15
20
1992 1993 1994 1995 1996 1997 1998 1999 2000 2001 2002
Perc
ent
Missouri High BirthweightNational High Birthweight
Figure 6. Prevalence (percentage of live births in WIC) of high birthweight (>4,000g) among WIC children in Missouri and the Nation from 1992 to 2002. (Source: CDC. 2003 PedNSS, Table 12C, CDC. 2002 PedNSS Table 18D). (Please note, scale has been truncated).
*
2010 Target 5.0%

12
similar to the proportion of infants born with HBW reported Nationally (7.3% HBW in Missouri and 7.6% HBW for the Nation 2002). Missouri had the same rate of decrease (3%) as the Nation from 2001 to 2002. Incidence of HBW infants has been declining and continues to decline for all races/ethnicities. HBW continues to be more common for Hispanic and Other/Unknown races/ethnicities (Fig. 7). More Asian/Pacific Islander infants have birth weights within the normal weight range than other races/ethnicities.
At Risk Birthweight
9.3
7.15.36.3
13.3
8.37.3
8.3
5.3
9.3
4.9
8.0
0
5
10
15
20
Whi
te
Blac
k/Af
rican
Amer
ican
His
pani
c
Amer
ican
Indi
an/A
lask
anN
ativ
e
Asia
n/Pa
cific
Isla
nder
Oth
er/U
nkno
wn
Ove
r Al
lRac
es/E
thni
city
Perc
ent
Low BirthweightHigh Birthweight
* insufficient number of participants available to establish a reliable estimate.
Figure 7. Prevalence of low birthweight infants (<2,500g) and high birthweight infants (>4000g) among the race/ethnic groups participating in WIC in Missouri. Healthy People 2010 target is to reduce Low Birthweight among all live births to 5.0%. (Source: CDC. 2003 PedNSS, Table 18C). (Please note, scale has been truncated).
*
2010 Target for Low Birthweight 5.0%

13
INDICATORS OF NUTRITIONAL STATUS OF CHILDREN
Growth Indicators
A child’s growth is an indication of the status of the child’s dietary intake and health. Children with inadequate nutrition and recurring illness are likely to have lower weights and shorter stature than other children their age. In addition to genetic influences and correlation with low birthweight, short stature is also an indication of repeated illness or inadequate nutrition.
In practice, the extremes for each measured parameter (height, weight) are determined in
relation to the distribution of measurements for other children of that age. The CDC revised the standard population used for comparisons in the year 2000. PedNSS compares 3 measurements to the standard population: short stature, underweight and overweight. Short stature and underweight are defined as the lower 5% of the population, and overweight is defined as the upper 15% or the 85th percentile of the distribution of measurements. Overweight is divided into 2 categories: ‘At risk of Overweight’, which is the 85th up to the 95th percentile, and ‘Overweight’, which is equal to and greater than the 95th percentile. Five percent of the population is expected to fall above the 95th percentile and 10% is expected to fall between the 85th and 95th percentile.
Short Stature
A child is assigned to the short stature category and may be nutritionally stunted if his/her height (length) falls into the lower fifth percentile of the growth chart for children of his/her age. Among the children in the WIC program in the state of Missouri, the percentage assigned to the short stature category has been increasing slightly during the late 1990’s. Five percent would be expected for this parameter and the Healthy People 2010 target is to reduce the rate of growth retardation among low-income infants and children under 5 years old to 5%. Short stature was only slightly more prevalent in Missouri (6.7%) than in the Nation (6.3%), though more so in 2002 than in 2001 (6.5%)(Fig. 8).
Short Stature
7.77.0 6.5 6.4 6.1 6.2 6.1 6.2 6.5 6.7
6.36.05.96.06.16.26.66.86.8 6.5
0
5
10
15
20
1993 1994 1995 1996 1997 1998 1999 2000 2001 2002
Perc
ent
Missouri Short Stature Nation Short Stature
Figure 8. Prevalence of short stature (<5th percentile height for age) among infants 0-11 mo. old, in WIC in Missouri (MO Short Stature) and the Nation (Nation Short Stature) 1993-2002. (Source: CDC. 2003 PedNSS, Table 12C, 2002 PedNSS Table 12D). (Please note, scale has been truncated).

14
There was a greater tendency for infants less than 12 months to be of short stature than
older age groups of all races/ethnicities (Fig. 9). Some begin life smaller (LBW, preterm, and multiple births), while others face growth-retarding factors (illness, anemia, poor nutrition). Genetics also play a role. More infants/children of short stature were born among participants of the Black/African American and White races/ethnicities (7.4% and 6.5%, respectively) (Fig. 10).
Short Stature by Age
5.2 4.6
9.6
6.24.5
6.7
0
5
10
15
20
Age
Perc
ent
< 1 Yr. 1-2 Yr. 2-3 Yr.3-4 Yr. 4-5 Yr. Over all Ages
Figure 9. Prevalence of short stature (<5th Percentile) among children in WIC in Missouri by age. The Healthy People 2010 target is to reduce the rate of growth retardation among low-income infants and children under 5 years old to 5%. (Source: CDC. 2003 PedNSS, Table 20C). (Please note, scale has been truncated).
Short Stature by Race/Ethnicity
6.76.15.86.25.97.46.5
0
5
10
15
20
Whi
te
Bla
ck/A
frica
nAm
eric
an
His
pani
c
Amer
ican
Indi
an/ A
lask
anN
ativ
e
Asia
n/ P
acifi
cIs
land
er
Oth
er/U
nkno
wn
All R
ace/
Ethn
icG
roup
s
Perc
ent
Figure 10. Prevalence of short stature (<5th Percentile) among races/ethnicities of WIC participants in Missouri. (Source: CDC. 2002 PedNSS, Table 16C). (Please note, scale has been truncated).
Underweight
A child was assigned to the underweight category, if his/her weight-for-length ratio or body mass index (BMI) falls into the lower fifth percentile of the growth chart for children of his/her age, according to the CDC growth chart as revised in 2000. Underweight occurred at a lower rate among children in Missouri (4.8%) than in the Nation (5.4%) and only slightly lower
2010 Target is 5.0%

15
than last year (4.9%). The percent of children categorized as underweight has continued to decline over most age groups and races/ethnicities. However, the percentage of Asian/Pacific Islander children underweight has risen from 6.7% of 1,290 children in 2001 to 7.6% of 1,295 children in 2002; the highest percentage in 9 years. The percentage of Black children underweight has decreased from 8.3% in 2000 to 7.7% in 2001 to 7.6% in 2002, though steadily remaining the highest among the races/ethnicities (Fig. 11).
Underweight
0
5
10
15
20
1994 1995 1996 1997 1998 1999 2000 2001 2002
Perc
ent
White, Not HispanicBlack/African AmericanHispanicAsian/Pacific IslanderOver All Races/Ethnicities
Data for the Hispanic race/ethnicity for 1999-2001 were missing or considered unreliable.
Figure 11. Rate of underweight among children by race/ethnicity in Missouri-WIC, 1993-2002. (Source: CDC. 2002 PedNSS, Table 18C). (Please note, scale has been truncated).
Among children under 5, underweight is most common among infants less than 12 months of age (8.2%). Unlike other age groups, the infant age group has been showing a steady increase in underweight for the past 3 years (Fig. 12).
Underweight
8.1 7.6 7.5 7.2 6.8 7.0 7.0 7.38.1 8.2
0
5
10
15
20
1993 1994 1995 1996 1997 1998 1999 2000 2001 2002
Perc
ent
< 1 Yrs.1 - 2 Yrs.2 - 3 Yrs.3 - 4 Yrs.4 - 5 Yrs.
Figure 12. Trend of prevalence of underweight by age group in Missouri-WIC, 1993-2002. (Source: CDC. 2003 PedNSS, Table 20C). (Please note, scale has been truncated).

16
Overweight and ‘At Risk of Overweight’
A child is assigned to the ‘at risk for overweight’ category, if his/her weight-for-length or BMI equals or exceeds the 85th percentile but is less than the 95th percentile of the CDC 2000 growth chart for his/her age. The incidence of ‘at risk of overweight’ has increased steadily over the past 10 years: from 12.6% in 1993 to 14.4% in 1997 to 15.0 in 1999 to 15.5% in 2002. This is an average increase of 0.29% per year or 1% every 3 years. Among the age groups, overweight among children aged 2 to 5 has increased at a greater rate: 0.40% per year or 2% every 5 years. In 2002 in Missouri, 12.4% of 53,243 children were overweight compared to 11.7% of 54,672 in 2001. This trend is observed Nationally as well (14.3% of 2,069,605 children 2<5 years old in 2002, 13.5% of 2,057,742 in 2001)(Fig. 13).
Overweight
8.49.4
10.912.4
12.714.3
11.610.7
0
2.5
5
7.5
10
12.5
15
17.5
20
1993
1994
1995
1996
1997
1998
1999
2000
2001
2002
Perc
ent
Missouri 2<5 Yrs.Overweight
Nation 2<5 Yrs.Overweight
Figure 13. Trend of Overweight among children 2<5 years of age in WIC in Missouri and the Nation. (Source: CDC. 2003 PedNSS, Table 12C; 2002 PedNSS, Table 12D). (Please note, scale has been truncated).
Prevalence of overweight is of concern among all races/ethnicities, occurring at 2 to 3 times the rate of a standard population of 5% (Fig. 14). Prevalence of overweight varies with the child’s age as well. For children under age 2, overweight was most prevalent among children aged 12<24 months (Fig. 15). For children 2<5 years old, prevalence of overweight and ‘at risk of overweight‘ increase with age (Fig. 16).

17
Overweight by Race and Age
11.512.311.7
14.715.6
10.811.312.4
14.013.1
16.316.8
11.612.1
0
5
10
15
20
Whi
te
Bla
ck/A
frica
nAm
eric
an
His
pani
c
Amer
ican
Indi
an/A
lask
aN
ativ
e
Asia
n/Pa
cfic
Isla
nder
Oth
er/U
nkno
wn All
Perc
ent
Overweight 0<5 years Overweight 2<5 years
Figure 14. Percentage of WIC participants overweight (>= 95th%) by race/ethnicity in Missouri (2002). (Source: CDC. 2003 PedNSS, Table 18C). (Please note, scale has been truncated).
Overweight
5.3
17.4
0
5
10
15
20
< 12 Mos. 12 < 24 Mos.
Perc
ent
Overweight >95th %
Figure 15. Percentage of WIC participants under 2 years old that are overweight (>=95th%ile) by age (months) in Missouri (2002). (Source: CDC. 2003 PedNSS, Table 20C). (Please note, scale has been truncated).
14.7
10.9
15.813.3
16.4
13.5
0
5
10
15
20
Perc
ent
2 < 3 Yrs. 3 < 4 Yrs. 4 < 5 Yrs.
Overweight Children
At Risk of Overweight Overweight
Figure 16. Prevalence of overweight (>=95th%ile) and ‘at risk of overweight’ (85th<95th%ile) in children over 2 years old by age, (Missouri-WIC 2002). (Source: CDC. 2003 PedNSS, Table 20C). (Please note, scale has been truncated).

18
Low Hemoglobin
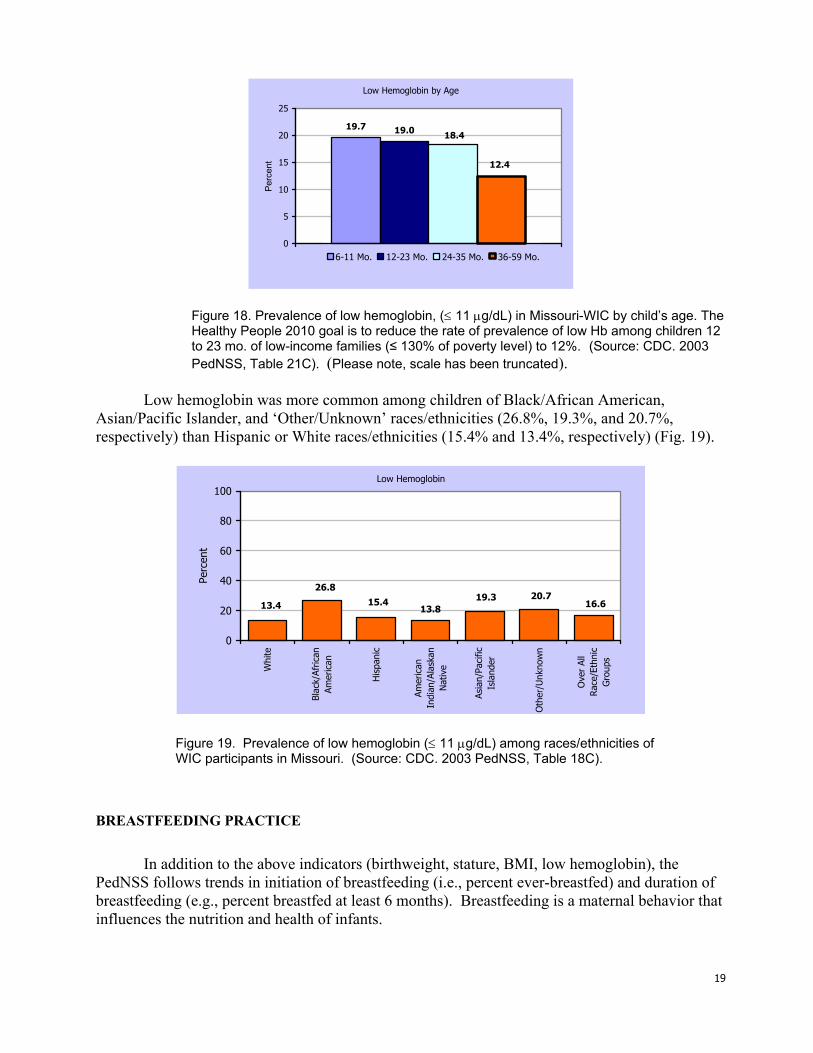
Iron deficiency is the most common micronutrient deficiency in growing children. Iron deficiency results in anemia, a condition of reduced red blood cell volume and hemoglobin production. When an infant is given foods other than breast milk, the ability of the gut to absorb iron is reduced. Iron deficiency anemia is more common among the impoverished because of the restricted amount and variety of foods and sometimes from feeding cow’s milk (gastric bleeding) instead of breast milk. Intestinal parasites can worsen the problem.10 Additionally, iron-deficiency increases a child’s susceptibility to lead toxicity. Iron-deficiency anemia reduces the ability of the gut to exclude heavy metals including lead.11 Missouri still mines 60% of the lead in the U.S.12 Children with anemia are also prone to illness, fatigue, and irritability13 and may exhibit mental and motor impairments10. The extent of reversibility of these impairments is not known, thus prevention and treatment are more important than detection 13. Children are screened for anemia as an indication of the child’s nutritional status. The tests most commonly used to screen for iron-deficiency anemia are hemoglobin concentration and hematocrit. Although low hemoglobin has decreased among children participating in WIC (Fig. 17), rates have not changed in three years. In 2002, low hemoglobin continues to be more prevalent among children in Missouri (16.6%, N=85,831) than it is in the National surveillance (13.1%, N=3,295,974). In 2000, Missouri ranked 36th among all 48 states/tribes/territories in prevalence of low hemoglobin and in 2001 Missouri ranked 41st out of 48; in 2002 Missouri ranks 40th of 46. The Healthy People 2010 goal is to reduce the rate of prevalence of low Hb among children 1 to 2 years old of low-income families (≤ 130% of poverty level) to 12%. Low hemoglobin affects nearly 1 in 5 infants (19%) under aged 3 (36 months of age) (Fig. 18). The prevalence of low hemoglobin seems to diminish with age, being most prevalent among children under 3 years of age (Fig. 18).
Low Hemoglobin
26.124.6
21.119.7
18.1 17.4 17.6 16.7 16.8 16.6
0
5
10
15
20
25
30
1993 1994 1995 1996 1997 1998 1999 2000 2001 2002
Perc
ent
Over All Age Groups
Figure 17. Trend in prevalence of low hemoglobin, (≤ 11 µg/dL) Missouri-WIC 1993-2002. (Source: CDC. 2003 PedNSS, Table 12C). (Please note, scale has been truncated).
19
Low Hemoglobin by Age
19.7 19.0 18.4
12.4
0
5
10
15
20
25
Per
cent
6-11 Mo. 12-23 Mo. 24-35 Mo. 36-59 Mo.
Figure 18. Prevalence of low hemoglobin, (≤ 11 µg/dL) in Missouri-WIC by child’s age. The Healthy People 2010 goal is to reduce the rate of prevalence of low Hb among children 12 to 23 mo. of low-income families (≤ 130% of poverty level) to 12%. (Source: CDC. 2003 PedNSS, Table 21C). (Please note, scale has been truncated).
Low hemoglobin was more common among children of Black/African American,
Asian/Pacific Islander, and ‘Other/Unknown’ races/ethnicities (26.8%, 19.3%, and 20.7%, respectively) than Hispanic or White races/ethnicities (15.4% and 13.4%, respectively) (Fig. 19).
Low Hemoglobin
13.813.4
26.8
15.4 19.3 20.716.6
0
20
40
60
80
100
Whi
te
Blac
k/Af
rican
Amer
ican
His
pani
c
Amer
ican
Indi
an/A
lask
anN
ativ
e
Asia
n/Pa
cific
Isla
nder
Oth
er/U
nkno
wn
Ove
r Al
lRac
e/Et
hnic
Gro
ups
Perc
ent
Figure 19. Prevalence of low hemoglobin (≤ 11 µg/dL) among races/ethnicities of WIC participants in Missouri. (Source: CDC. 2003 PedNSS, Table 18C).
BREASTFEEDING PRACTICE
In addition to the above indicators (birthweight, stature, BMI, low hemoglobin), the PedNSS follows trends in initiation of breastfeeding (i.e., percent ever-breastfed) and duration of breastfeeding (e.g., percent breastfed at least 6 months). Breastfeeding is a maternal behavior that influences the nutrition and health of infants.

20
Breastfeeding is known to have many positive benefits for the health and development of infants. Breast milk is the best nutritional fluid available for infants. Breast milk changes in composition during the breastfeeding session and changes over the development of the child specifically for the needs of the child 14,15. In addition to nutritional benefits, breast milk provides protection against illness. Immunity to illness is transferred from mother to infant through breast milk, providing a passive immunity; one that does not have to be activated by the infant’s system. This includes immunoglobulins, interferon, enzymes, and macrophages, lactoferrin, lymphocytes, and Lactobaillus bifidus factor.10
The Healthy People goal for the year 2010 has been set for 75% of all women to
breastfeed early postpartum. Four states/tribes/territories in PedNSS currently meet or exceed the goal. In 1993 in Missouri, only 32.3% of WIC mothers breastfed their infants compared to 47.6% in 2002 (Fig. 20). Greatest progress has been made among the Black/African American participants. Breastfeeding has more than doubled in the Black/African American race in Missouri in just 10 years, increasing from 15.6% in 1993 to 36.4% in 2002.
Though rates of breastfeeding seem to differ by race/ethnicity, rates observed in Missouri are comparable to rates observed for the Nation (Fig. 21). Ideally, at least 50% of mothers would breastfeed 6 months or more and 25% would breastfeed 12 months or more. In WIC in Missouri, fewer White and Black/African American mothers breastfed the recommended duration of an infant’s development than other races/ethnicities (Fig. 22).
Ever Breastfed
32.3 35.8 38.0 39.2 40.7 43.8 44.6 45.7 47.3 47.638.9 39.2 41.6 43.7 45.1 47.8 47.8 48.0 51.4 52.5
0
20
40
60
80
100
1993 1994 1995 1996 1997 1998 1999 2000 2001 2002
Perc
ent
Missouri Nation
Figure 20. Trend of percentage initiation of breastfeeding (1993-2002, Nation and Missouri PedNSS). The Healthy People 2010 target rate is for 75% of all women to breastfeed early postpartum. (Source: CDC Pediatric Nutrition Surveillance Survey. 2002, 2003. Table 13C, Table 13D.)
2010 Target is 75%

21
Ever Breastfed
47.658.356.3
66.4
36.4
49.2 52.558.8
51.060.3
67.4
39.951.0
0
25
50
75
100
Whi
te
Bla
ck/A
frica
nAm
eric
an
His
pani
c
Amer
ican
Indi
an
Asia
n/Pa
cific
Isla
nder
Oth
er/U
nkno
wn All
Perc
ent
Missouri Nation
* insufficient number of participants available to provide a reliable estimate. Figure 21. Rate of initiation of breastfeeding among mothers in WIC in Missouri and the Nation by race/ethnicity. (Source: CDC Pediatric Nutrition Surveillance Survey. 2002, Table 9D; 2003, Table 19C.)
Breastfed at 6 months
26.9 26.6
43.935.4
40.6
28.7
0
20
40
60
80
100
Whi
te
Bla
ck/A
frica
nAm
eric
an
His
pani
c
Am
eric
anIn
dian
/Ala
ska
Nat
ive
Asi
an/P
acifi
cIs
land
er
Oth
er/U
nkno
wn All
Perc
ent
* insufficient number of participants available to provide a reliable estimate. Figure 22. Percentage of mothers in WIC in Missouri (2002) breastfeeding 6 months or more. (Source: PedNSS. 2003. Table 19C).
*
*

22
CCoonncclluussiioonnss aanndd RReeccoommmmeennddaattiioonnss
The PedNSS data demonstrates noticeable improvements in the health of Missouri infants and children served by WIC. Missouri has been successful in promoting breastfeeding of infants, among population served by WIC. Initiation of breastfeeding has risen from a low of 32.3% in 1993 to 47.6% in 2002. Initiation of breastfeeding has more than doubled in the Black/African American race in Missouri in just 10 years, increasing from 15.6% in 1993 to 36.4% in 2002. However, in recent years, the rate of increase among years has not been as great as in the past.
Additional attention is required for improvement of the nutritional health of the infants and
children in low-income families. Infants were twice as likely to have short stature and underweight than other age groups. Conversely, children were overweight at 3 times the anticipated rate for a standard population. Missouri participants continue to display high and increasing rates of overweight and ‘at risk of overweight’.
The predominance of formula feeding may account for at least some of the observed
overweight among infants and children, because formula-fed infants tend to gain weight faster than length.16 One theory is that children who were formula-fed do not self-regulate dietary intake as well as those who were breastfed, and would then have a greater tendency to become overweight in childhood.17
The problems of low hemoglobin and underweight among infants arriving at WIC and
prior to receiving WIC benefits suggest that a greater need exists for nutritional education and parenting resources within the community than can be addressed by WIC alone. More community resources need to be enjoined with the WIC education mission so that fewer infants arrive at WIC with low hemoglobin and poor nutritional histories. These efforts should include effective advocacy for breastfeeding as well as training in meal planning, i.e., frequency and content of an age appropriate diet.
The WIC program in Missouri has reached people of many races/ethnicities. Growing
Hispanic and other populations necessitate efforts to provide translated material, education, and services for Missouri’s growing diversity in a culturally appropriate and compelling manner.
Suggested focus areas for practice and research:
• Continue to encourage breastfeeding.
• Examine the diets and feeding practices of young children and infants in WIC.
• Address low hemoglobin (≤ 11 µg/dL) through referral to physicians.
• Be aware of increasing prevalence of underweight of Asian/Pacific Islander infants.
• Continue to provide support to diverse races and ethnicities through translation and culturally
compatible education.
• Consider identifying the races/ethnicities composing ‘Other/Unknown’ category.

23
LLiitteerraattuurree CCiitteedd
1. Dietz WH. Health consequences of obesity in youth: Childhood predictors of adult disease. Pediatrics 1998 Mar;101(3) Suppl:518-525.
2. Gartner, L.M., Morton, J.L., Naylor, A.J., O’Hare, D., Schanler, R.J., Eidelman, A.I.. 2005.
Breastfeeding and the use of human milk. Pediatrics 115(2): p. 496-506. Retrieved 9/1/2005 from http://pediatrics.aappublications.org/cgi/content/full/115/2/496
3. Satcher, D.S., DHHS blueprint for action on breastfeeding. Public Health Rep., 2001. 116(1):
p. 72-3. 4. Armstrong, J. and J.J. Reilly, Breastfeeding and lowering the risk of childhood obesity.
Lancet, 2002. 359(9322): p. 2003-4. 5. Center for Disease Control, Ten State Nutrition Survey 1968-1970, U. S. Department of
Health, Education and Welfare, DHEW Publication No. (HSM) 72-8130 to 8134, Atlanta, Georgia, 1972.
6. U.S. Department of Health and Human Services. Healthy People 2010. 2nd ed. With
Understanding and Improving Health and Objectives for Improving Health. 2 vols. Washington, DC: U.S. Government Printing Office, November 2000.
7. Correspondence from Karen Dalenius, MPH, RD, P.H. Nutritionist Maternal and Child
Nutrition Branch, NCCDPHP, CDC and Ellen Borland, PedNSS Data Manager Maternal and Child Nutrition Branch, NCCDPHP, CDC to Pediatric Nutrion Surveillance Coordinators Subject: 2002 Annual PedNSS Data Tables.
8. Kochanek KD, Smith BL. Deaths: Preliminary data for 2002. National vital statistics reports;
vol 52 no 13. Hyattsville, Maryland: National Center for Health Statistics. 2004. 9. deRegnier, Raye-Ann, M.D. n.d. Will My Baby “Catch Up”? Growth and Prematurity.
Comeunity Retrieved 9/1/2005 from http://www.comeunity.com/premature/child/growth/catchup.html
10. Guthrie, H.A. and M.F. Picciano. 1995. Chapter 16 IN Human Nutrition. Mosby:New York.
p.579-584. 11. Centers for Disease Control and Prevention. Recommendations to Prevent and Control Iron
Deficiency in the United States. MMWR 1998;47(No. RR-3):[inclusive page numbers]. Accessed 9/1/2005 from ftp://ftp.cdc.gov/pub/Publications/mmwr/rr/rr4703.pdf
12. Stephenson, Kristen. n.d. Ozarks History Course Syllabus. The History of the Lead and
Timber Industry. Retrieved 8/09/05 from http://www.republic.k12.mo.us/highschool/teachers/kstephen/oz6a.htm

24
13. Centers for Disease Control and Prevention, National Center for Chronic Disease Prevention and Health Promotion. Nutrition & Physical Activity. Anemia and Iron Status, Available at: http://www.cdc.gov/nccdphp/dnpa/anemiron.htm.
14. Centers for Disease Control and Prevention. Pediatric nutrition surveillance, 1997 full report.
Atlanta: U.S. Department of Health and Human Services, Centers for Disease Control and Prevention, 1998. Retrieved from: http://www.cdc.gov/nccdphp/dnpa/pdf/pednss.pdf
15. March of Dimes. 2005. Breastfeeding. Retrieved from:
http://www.marchofdimes.com/professionals/14332_9148.asp 16. Sweeney, Marlene. Weighing in Growth Charts – Infant growth rates differ from
breastfeeding to formula – Brief Article. Look Smart Articles. Retrieved 8/10/2005 from http://www.findarticles.com/p/articles/mi_m0838/is_2002_May-June/ai_76587480/print
17. Dewey KG. Is breastfeeding protective against childhood obesity? Journal of Human
Lactation 2003; 19 (1): 9-18. Retrieved from: http://nutrition.ucdavis.edu/briefs/Issues/MayJun03.htm