pengumuman equity research pt duta graha indah tbk …
TRANSCRIPT
PENGUMUMAN
Equity Research PT Duta Graha Indah Tbk (DGIK)
(Tercatat Di Papan : Utama) No.Peng-ER-00011/BEI.PPJ/08-2011
(dapat dilihat di internet : http://www.idx.co.id) PT Bursa Efek Indonesia telah menerima surat melalui email dari PT Pemeringkat Efek Indonesia dengan No. 1114/PEF-DIR/VIII/2011 tanggal 24 Agustus 2011 mengenai Publikasi Laporan Penilaian Target Harga Referensi Saham PT Duta Graha Indah Tbk sebagaimana terlampir (lampiran 23 lembar). Demikian agar maklum.
Jakarta, 25 Agustus 2011
Umi Kulsum Andre P.J. Toelle Kepala Divisi Penilaian Perusahaan Sektor Jasa Kepala Divisi Perdagangan Saham Tembusan Yth. : 1. Ketua Badan Pengawas Pasar Modal dan LK; 2. Kepala Biro Transaksi dan Lembaga Efek Bapepam dan LK; 3. Kepala Biro PKP Sektor Jasa Bapepam dan LK; 4. Pusat Referensi Pasar Modal; 5. Direksi PT Duta Graha Indah Tbk.
lau_DGIK_er_20110825_11
PEFINDO CREDIT RATING INDONESIA
1114/PEF-DIR/VIII/2011
Jakarta, 24 Agustus 2011
Kepada Yth.1. PT Duta Graha Indah, Tbk
JI. Sultan Hasanuddin No. 69Jakarta Selatan 12160
u.p. Bapak Laurensius Teguh, DirekturBapak Djohan Halim, Corporate Secretary
2. PT Bursa Efek IndonesiaGedung Bursa Efek IndonesiaJI. Jend. Sudirman Kav 52-53Jakarta Selatan, 12190
u.p. Bapak Ito Warsito, Direktur UtamaBapak Eddy Sugito, Direktur Penilaian Perusahaan
Perihal: Publikasi Laporan Penilaian Target Harga Referensi Saham PT Duta GrahaIndah Tbk.
Dengan hormat,
Sehubungan dengan penugasan yang kami peroleh untuk melakukan Penilaian Target HargaReferensi Saham, dengan ini kami sampaikan hasil penilaian kami atas saham PT Duta Graha IndahTbk (DGIK) dalam versi Bahasa Indonesia dan Bahasa Inggris.
Apabila masih ada hal-hal yang memerlukan penjelasan lebih lanjut, mohon agar menghubungi kami.Atas perhatian dan kerjasamanya, kami ucapkan terima kasih.
Hormat kami,
Ronald T. Andi Kasim, CFADirektur Utama
Rizalirektur
Tembusan : Ibu Umi Kulsum, Kepala Divisi Pencatatan Sektor Jasa, PT Bursa Efek Indonesia
PT. Pemeringkat Efek IndonesiaPanin Tower Senayan City 1ih FloorJI. Asia Afrika Lot. 19, Jakarta 10270, INDONESIAPhone: (62-21) 72782380' Fax: (62-21) 7278 2370
Halaman ke 1 dari 11 halaman
Kontak: Equity & Index Valuation Division Phone: (6221) 7278 2380 [email protected]
“Pernyataan disclaimer pada halaman akhir
merupakan bagian yang tidak terpisahkan dari
dokumen ini”
www.pefindo.com
Duta Graha Indah, Tbk Laporan Kedua
Equity Valuation
23 Agustus 2011
Target Harga
Terendah Tertinggi 176 235
Konstruksi
Property
Kinerja Saham
0
20
40
60
80
100
120
140
160
180
0.00
500.00
1,000.00
1,500.00
2,000.00
2,500.00
3,000.00
3,500.00
4,000.00
4,500.00
8/23/2010 10/11/201011/23/2010 1/7/2011 2/22/2011 4/5/2011 5/19/2011 7/4/2011 8/15/2011
DGIKIHSG
IHSG DGIK
Sumber : Bloomberg
Informasi Saham Rp
Kode Saham DGIK
Harga Saham per 23 Agustus 2011 103
Harga Tertinggi 52 minggu terakhir 157
Harga Terendah 52 minggu terakhir 80
Kapitalisasi Pasar Tertinggi 52 minggu
(miliar) 869,9
Kapitalisasi Pasar Terendah 52 minggu
(miliar) 443,3
Penilaian Saham Sebelumnya Saat Ini
Tertinggi 200 235
Terendah 133 176
Market Value Added & Market Risk
0
0.2
0.4
0.6
0.8
1
1.2
1.4
-120
-100
-80
-60
-40
-20
0
2008 2009 2010
Market RiskMVA
MVA Market Risk
Sumber : Bloomberg, Pefindo Divisi Valuasi Saham & Indexing
Pemegang Saham (%)
PT Lintas Kebayoran Kota 33,03
PT Lokasindo Aditama 7,35
Hudson River Group Pte Ltd 15,00
PT Rezeki Segitiga Emas 9,02
Dudung Purwadi 2,71
Ongky Abdulrahman 0,09
Sutiono Teguh 0,09
Publik (kepemilikan dibawah 5%) 32,71
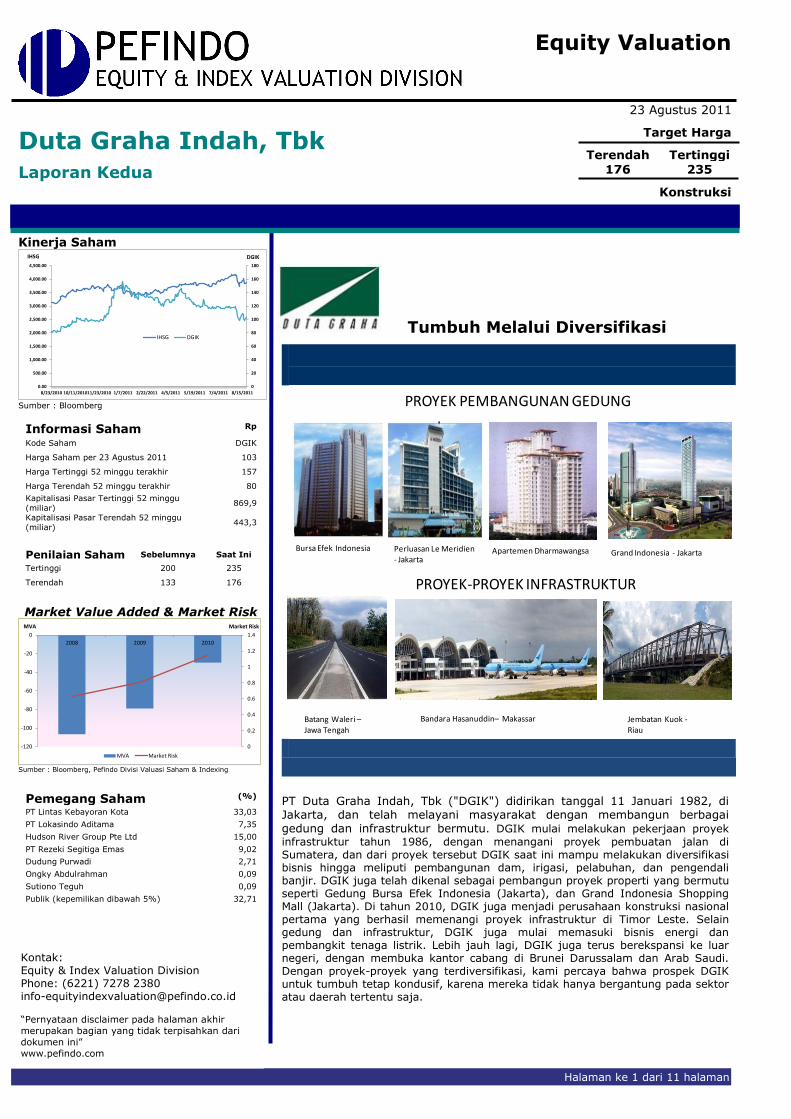
Tumbuh Melalui Diversifikasi
PROYEK PEMBANGUNAN GEDUNG
PROYEK-PROYEK INFRASTRUKTUR
Bursa Efek Indonesia Perluasan Le Meridien- Jakarta
Apartemen Dharmawangsa Grand Indonesia - Jakarta
Batang Waleri –Jawa Tengah
Bandara Hasanuddin– Makassar Jembatan Kuok -Riau
PT Duta Graha Indah, Tbk ("DGIK") didirikan tanggal 11 Januari 1982, di Jakarta, dan telah melayani masyarakat dengan membangun berbagai gedung dan infrastruktur bermutu. DGIK mulai melakukan pekerjaan proyek
infrastruktur tahun 1986, dengan menangani proyek pembuatan jalan di Sumatera, dan dari proyek tersebut DGIK saat ini mampu melakukan diversifikasi bisnis hingga meliputi pembangunan dam, irigasi, pelabuhan, dan pengendali banjir. DGIK juga telah dikenal sebagai pembangun proyek properti yang bermutu seperti Gedung Bursa Efek Indonesia (Jakarta), dan Grand Indonesia Shopping Mall (Jakarta). Di tahun 2010, DGIK juga menjadi perusahaan konstruksi nasional pertama yang berhasil memenangi proyek infrastruktur di Timor Leste. Selain gedung dan infrastruktur, DGIK juga mulai memasuki bisnis energi dan pembangkit tenaga listrik. Lebih jauh lagi, DGIK juga terus berekspansi ke luar negeri, dengan membuka kantor cabang di Brunei Darussalam dan Arab Saudi. Dengan proyek-proyek yang terdiversifikasi, kami percaya bahwa prospek DGIK untuk tumbuh tetap kondusif, karena mereka tidak hanya bergantung pada sektor atau daerah tertentu saja.

“Pernyataan disclaimer pada halaman akhir merupakan bagian yang tidak
terpisahkan dari dokumen ini”
www.pefindo.com
Duta Graha Indah, Tbk
23 Agustus 2011 Halaman ke 2 dari 11 halaman
Penyesuaian Target Harga Kami melakukan beberapa penyesuaian terhadap proyeksi kami sebelumnya dan menyesuaikan target harga ke kisaran Rp 176 - Rp 235 per saham, berdasarkan beberapa pertimbangan berikut :
Peningkatan kinerja di tahun 2010, dimana pendapatan DGIK mencapai Rp 1.355 miliar, atau naik 5,16% YoY. Peningkatan kinerja aktual ini lebih baik dari proyeksi kami sebelumnya, yaitu Rp 1.337 miliar. Peningkatan kinerja ini berlanjut di 1H11, dimana pendapatan DGIK naik 6,6% YoY.
Semakin banyaknya proyek infrastruktur yang akan ditawarkan Pemerintah Indonesia, yang dibuktikan dengan peningkatan anggaran untuk sektor infrastruktur di tahun 2011 menjadi 63,2% dari total anggaran APBN tahun
2011, lebih baik dari APBN tahun 2010 yang hanya mencapai 27,2%.
Perkiraaan realisasi nilai proyek konstruksi selama tahun 2011, yang diprediksi naik sebanyak 40,25% YoY, dari total realisasi nilai proyek konstruksi di tahun 2010. Kami perkirakan sektor properti akan menjadi sektor utama yang mendorong pertumbuhan industri konstruksi, dengan 24,05% kontribusi. Pertumbuhan industri properti yang tinggi ini didukung oleh meningkatnya jumlah kredit properti dari perbankan.
Asumsi Risk free rate, equity premium, dan beta yang berubah menjadi 6,81% 7,69%, dan 0,72x.
Memasuki Sektor EPC Sejak tahun 2011, DGIK menambah ruang lingkup jasanya sebagai kontraktor
Engineering, Procurement, dan Construction (“EPC”) pembangkit listrik tenaga hidro, khususnya pembangunan pembangkit listrik skala menengah. Sebagai awal, saat ini DGIK sedang berusaha merealisasikan 2 proyek pembangkit listrik hidro di Sumatera dan Jawa. Bisnis EPC ini akan memberikan marjin yang lebih baik bagi DGIK. Lebih jauh lagi, peluang untuk mengembangkan bisnis pembangunan pembangkit tenaga listrik hidro ini cukup besar, karena banyak daerah di Indonesia yang masih kekurangan supply listrik tetapi memiliki supply air yang cukup untuk mengoperasikan pembangkit listrik tenaga hidro. Mengurangi Jumlah Hutang Berbunga Per 30 Juni 2011, DGIK mampu mengurangi jumlah hutang berbunga yang dimilikinya menjadi hanya Rp 136 miliar, dari Rp 273,7 miliar per 31 Desember
2010. Berdasarkan hal ini, kami percaya DGIK akan lebih sehat di kuartal-kuartal berikutnya, karena beban bunga DGIK akan menjadi lebih rendah dan modal kerjanya akan menjadi lebih kuat. Prospek Bisnis Seiring dengan usaha Pemerintah Indonesia untuk memfasilitasi pertumbuhan infrastruktur dengan cara meningkatkan anggaran infrastruktur di tahun 2011, ditambah dengan kuatnya pertumbuhan sektor properti, menyebabkan industri konstruksi tumbuh 40,25% YoY selama Januari – April 2011. DGIK juga telah menyelesaikan perjanjian dengan Gulf Power International, untuk mendirikan PT Duta Graha Arabia, sebuah perusahaan konstruksi di Saudi Arabia. Diiringi
dengan strategi yang tepat dengan memasuki industri EPC, yang memberikan marjin lebih besar, serta kondisi keuangan yang lebih sehat, membuat kami percaya bahwa pendapatan DGIK dapat tumbuh 8,4% YoY di tahun 2011, dan CAGR 7,2% selama periode tahun 2010 – 2015.
Table 1: Ringkasan Kinerja
2008 2009 2010 2011P 2012P
Pendapatan [Rp Miliar] 1.353 1.289 1.355 1.468 1.583
Laba sebelum pajak
[Rp Miliar] 98 104 111 129 143
Laba bersih [Rp Miliar] 61 67 71 85 95
EPS [Rp] 11,0 12,1 12,8 15,4 17,2
Pertumbuhan EPS [%] (20,2) 9,7 5,7 20,2 12,3
P/E [x] 4,5 7,2 11,4 6,7* 6,0*
PBV [x] 0,3 0,5 0,8 0,5* 0,5*
Sumber: PT Duta Graha Indah Tbk., Estimasi Pefindo Divisi Valuasi Saham & Indexing *) Berdasarkan harga saham DGIK per tanggal 23 Agustus 2011– Rp 103/saham
PARAMETER INVESTASI

Duta Graha Indah, Tbk
23 Agustus 2011 Halaman ke 3 dari 11 halaman
“Pernyataan disclaimer pada
halaman akhir merupakan
bagian yang tidak terpisahkan
dari dokumen ini”
www.pefindo.com
Kondisi Makroekonomi yang Menguntungkan Guna Mendorong
Pertambahan Proyek Konstruksi Di tengah ketidakseimbangan pemulihan ekonomi dunia, kinerja perekonomian nasional selama tahun 2010 terus menunjukkan peningkatan. Hal ini terlihat dari pertumbuhan Produk Domestik Bruto (“PDB”) yang cukup tinggi, surplus Neraca Pembayaran yang cukup besar, dan relatif stabilnya suku bunga Bank Indonesia (“BI Rate”).
Tabel 2: Indikator Makroekonomi Indonesia,
2007 - 2010
2007 2008 2009 2010Pertumbuhan PDB (%) 6,35% 6,01% 4,55% 6,1%
PDB per Kapita (US$) 1.923 2.245 2.349 3.005
BI Rate 8,00% 9,25% 6,50% 6,50%
Nilai Tukar Rupiah terhadap US Dollar 9.419 10.950 9.400 8.991
IHSG 2.745 1.355 2.534 3.704
Cadangan Devisa (US$ juta) 56.920 51.639 66.104 96.207
Ekspor (US$ juta) 114.023 136.761 116.490 157.730
Import (US$ juta) 74.403 129.197 96.856 135.610 Sumber: Biro Pusat Statistik, Pefindo Divisi Valuasi Saham & Indexing
Kondisi makroekonomi tersebut terus berlanjut di 1Q11, sejalan dengan pemulihan ekonomi yang mendorong naiknya jumlah ekspor produk Indonesia. Dan sebagai hasil dari pemulihan tersebut, ditambah BI Rate yang hanya naik menjadi 6,75%, membuat PDB tumbuh positif di segala sektor di 1Q11, termasuk sektor konstruksi yang tumbuh 5,3% YoY, sementara total PDB tumbuh 6,5% YoY.
Gambar 1: Pertumbuhan PDB, Sektor Konstruksi & BI Rate
4.5
6.16.5
7.1 7
5.3
6.50 6.50
6.75
6.35
6.40
6.45
6.50
6.55
6.60
6.65
6.70
6.75
6.80
0
1
2
3
4
5
6
7
8
2009 2010 1Q11
BI RatePertumbuhan
Pertumbuhan total GDP (%, YoY) Pertumbuhan GDP Konstruksi (%, YoY) BI Rate (%)
Sumber: Biro Pusat Statistik, Pefindo Divisi Valuasi Saham & Indexing
Semakin Banyak Proyek Infrastruktur dari Pemerintah
Perbaikan infrastruktur menjadi hal yang terdepan bagi Pemerintah Indonesia, setelah sukses menciptakan stabilitas politik, kebijakan moneter dan fiskal yang aman dan hati-hati, yang memfasilitasi terbentuknya kondisi pertumbuhan ekonomi yang sehat selama beberapa tahun terakhir. Pada beberapa tahun ke depan, perbaikan infrastruktur oleh Pemerintah Indonesia akan difokuskan pada
beberapa koridor ekonomi di enam daerah, yaitu : - Koridor 1 di Perairan Utara Pulau Jawa - Koridor 2 di Wilayah Timur Sumatra - Koridor 3 di Wilayah Selatan Kalimantan - Koridor 4 di Trans Sulawesi - Koridor 5 di Bali – Nusa Tenggara, dan - Koridor 6 di Papua.
Enam koridor ini merupakan daerah dengan potensi terbesar untuk memberikan kontribusi bagi pertumbuhan ekonomi Indonesia. Melihat pentingnya infrastruktur
INFORMASI BISNIS
“Pernyataan disclaimer pada halaman akhir merupakan bagian yang tidak
terpisahkan dari dokumen ini”
www.pefindo.com
Duta Graha Indah, Tbk
23 Agustus 2011 Halaman ke 4 dari 11 halaman
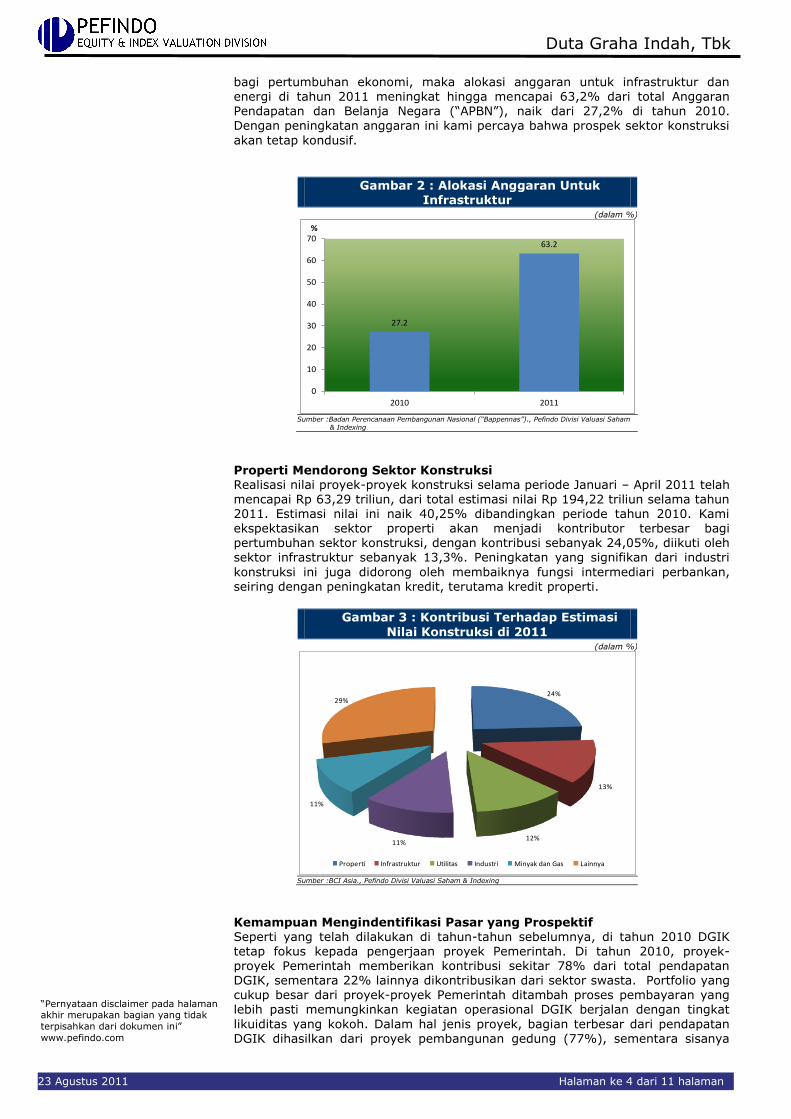
bagi pertumbuhan ekonomi, maka alokasi anggaran untuk infrastruktur dan energi di tahun 2011 meningkat hingga mencapai 63,2% dari total Anggaran Pendapatan dan Belanja Negara (“APBN”), naik dari 27,2% di tahun 2010.
Dengan peningkatan anggaran ini kami percaya bahwa prospek sektor konstruksi
akan tetap kondusif.
Gambar 2 : Alokasi Anggaran Untuk Infrastruktur
(dalam %)
27.2
63.2
0
10
20
30
40
50
60
70
2010 2011
%
Sumber :Badan Perencanaan Pembangunan Nasional (“Bappennas”)., Pefindo Divisi Valuasi Saham
& Indexing
Properti Mendorong Sektor Konstruksi Realisasi nilai proyek-proyek konstruksi selama periode Januari – April 2011 telah mencapai Rp 63,29 triliun, dari total estimasi nilai Rp 194,22 triliun selama tahun 2011. Estimasi nilai ini naik 40,25% dibandingkan periode tahun 2010. Kami ekspektasikan sektor properti akan menjadi kontributor terbesar bagi pertumbuhan sektor konstruksi, dengan kontribusi sebanyak 24,05%, diikuti oleh sektor infrastruktur sebanyak 13,3%. Peningkatan yang signifikan dari industri
konstruksi ini juga didorong oleh membaiknya fungsi intermediari perbankan, seiring dengan peningkatan kredit, terutama kredit properti.
Gambar 3 : Kontribusi Terhadap Estimasi
Nilai Konstruksi di 2011 (dalam %)
24%
13%
12%11%
11%
29%
Properti Infrastruktur Utilitas Industri Minyak dan Gas Lainnya
Sumber :BCI Asia., Pefindo Divisi Valuasi Saham & Indexing
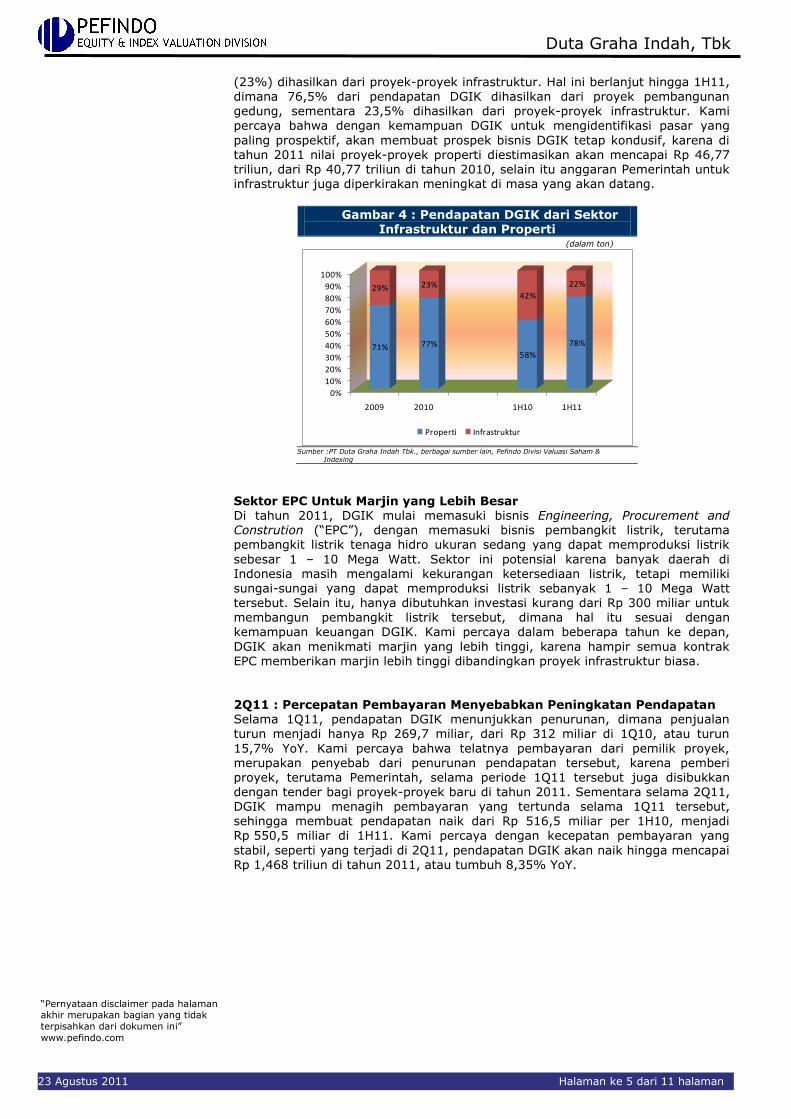
Kemampuan Mengindentifikasi Pasar yang Prospektif Seperti yang telah dilakukan di tahun-tahun sebelumnya, di tahun 2010 DGIK tetap fokus kepada pengerjaan proyek Pemerintah. Di tahun 2010, proyek-proyek Pemerintah memberikan kontribusi sekitar 78% dari total pendapatan DGIK, sementara 22% lainnya dikontribusikan dari sektor swasta. Portfolio yang cukup besar dari proyek-proyek Pemerintah ditambah proses pembayaran yang lebih pasti memungkinkan kegiatan operasional DGIK berjalan dengan tingkat
likuiditas yang kokoh. Dalam hal jenis proyek, bagian terbesar dari pendapatan DGIK dihasilkan dari proyek pembangunan gedung (77%), sementara sisanya
“Pernyataan disclaimer pada halaman akhir merupakan bagian yang tidak
terpisahkan dari dokumen ini”
www.pefindo.com
Duta Graha Indah, Tbk
23 Agustus 2011 Halaman ke 5 dari 11 halaman
(23%) dihasilkan dari proyek-proyek infrastruktur. Hal ini berlanjut hingga 1H11, dimana 76,5% dari pendapatan DGIK dihasilkan dari proyek pembangunan gedung, sementara 23,5% dihasilkan dari proyek-proyek infrastruktur. Kami
percaya bahwa dengan kemampuan DGIK untuk mengidentifikasi pasar yang
paling prospektif, akan membuat prospek bisnis DGIK tetap kondusif, karena di tahun 2011 nilai proyek-proyek properti diestimasikan akan mencapai Rp 46,77 triliun, dari Rp 40,77 triliun di tahun 2010, selain itu anggaran Pemerintah untuk infrastruktur juga diperkirakan meningkat di masa yang akan datang.
Gambar 4 : Pendapatan DGIK dari Sektor Infrastruktur dan Properti
(dalam ton)
0%
10%
20%
30%
40%
50%
60%
70%
80%
90%
100%
2009 2010 1H10 1H11
71% 77%58%
78%
29% 23%42%
22%
Properti Infrastruktur
Sumber :PT Duta Graha Indah Tbk., berbagai sumber lain, Pefindo Divisi Valuasi Saham &
Indexing
Sektor EPC Untuk Marjin yang Lebih Besar Di tahun 2011, DGIK mulai memasuki bisnis Engineering, Procurement and Constrution (“EPC”), dengan memasuki bisnis pembangkit listrik, terutama pembangkit listrik tenaga hidro ukuran sedang yang dapat memproduksi listrik
sebesar 1 – 10 Mega Watt. Sektor ini potensial karena banyak daerah di Indonesia masih mengalami kekurangan ketersediaan listrik, tetapi memiliki sungai-sungai yang dapat memproduksi listrik sebanyak 1 – 10 Mega Watt
tersebut. Selain itu, hanya dibutuhkan investasi kurang dari Rp 300 miliar untuk membangun pembangkit listrik tersebut, dimana hal itu sesuai dengan kemampuan keuangan DGIK. Kami percaya dalam beberapa tahun ke depan,
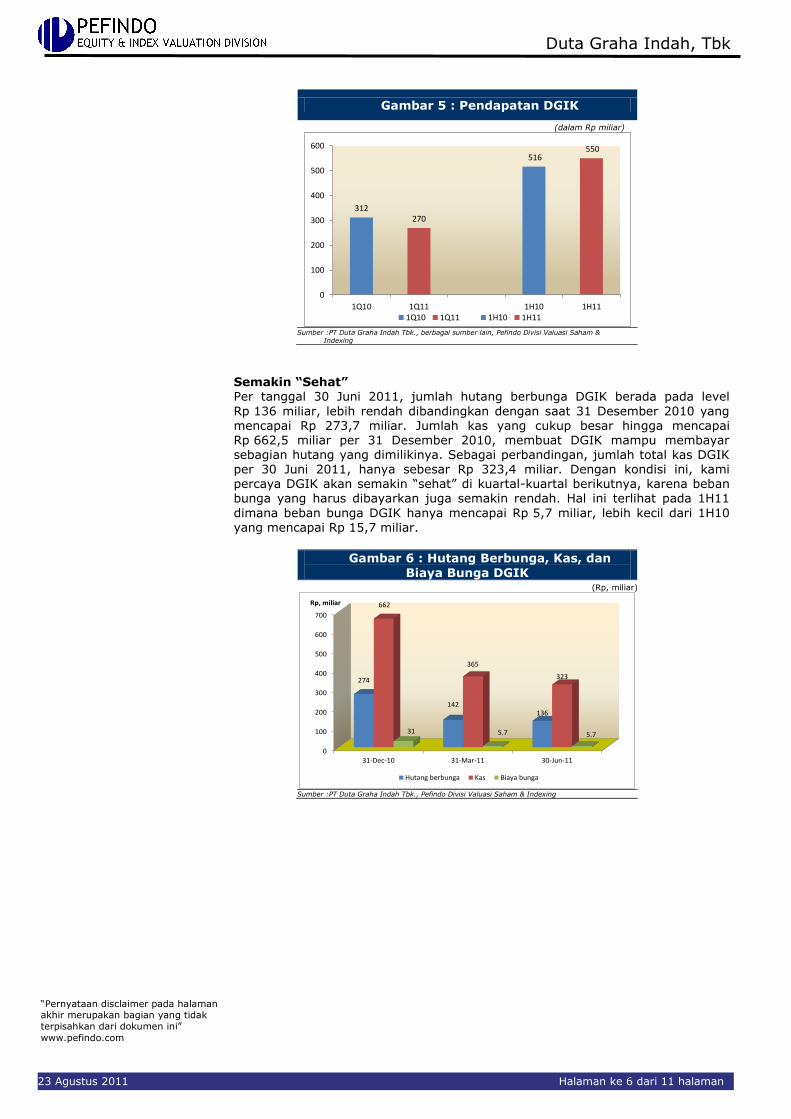
DGIK akan menikmati marjin yang lebih tinggi, karena hampir semua kontrak EPC memberikan marjin lebih tinggi dibandingkan proyek infrastruktur biasa. 2Q11 : Percepatan Pembayaran Menyebabkan Peningkatan Pendapatan Selama 1Q11, pendapatan DGIK menunjukkan penurunan, dimana penjualan turun menjadi hanya Rp 269,7 miliar, dari Rp 312 miliar di 1Q10, atau turun
15,7% YoY. Kami percaya bahwa telatnya pembayaran dari pemilik proyek, merupakan penyebab dari penurunan pendapatan tersebut, karena pemberi proyek, terutama Pemerintah, selama periode 1Q11 tersebut juga disibukkan dengan tender bagi proyek-proyek baru di tahun 2011. Sementara selama 2Q11, DGIK mampu menagih pembayaran yang tertunda selama 1Q11 tersebut, sehingga membuat pendapatan naik dari Rp 516,5 miliar per 1H10, menjadi Rp 550,5 miliar di 1H11. Kami percaya dengan kecepatan pembayaran yang
stabil, seperti yang terjadi di 2Q11, pendapatan DGIK akan naik hingga mencapai Rp 1,468 triliun di tahun 2011, atau tumbuh 8,35% YoY.
“Pernyataan disclaimer pada halaman akhir merupakan bagian yang tidak
terpisahkan dari dokumen ini”
www.pefindo.com
Duta Graha Indah, Tbk
23 Agustus 2011 Halaman ke 6 dari 11 halaman
Gambar 5 : Pendapatan DGIK
(dalam Rp miliar)
312270
516 550
0
100
200
300
400
500
600
1Q10 1Q11 1H10 1H111Q10 1Q11 1H10 1H11
Sumber :PT Duta Graha Indah Tbk., berbagai sumber lain, Pefindo Divisi Valuasi Saham &
Indexing
Semakin “Sehat” Per tanggal 30 Juni 2011, jumlah hutang berbunga DGIK berada pada level
Rp 136 miliar, lebih rendah dibandingkan dengan saat 31 Desember 2010 yang mencapai Rp 273,7 miliar. Jumlah kas yang cukup besar hingga mencapai Rp 662,5 miliar per 31 Desember 2010, membuat DGIK mampu membayar sebagian hutang yang dimilikinya. Sebagai perbandingan, jumlah total kas DGIK per 30 Juni 2011, hanya sebesar Rp 323,4 miliar. Dengan kondisi ini, kami percaya DGIK akan semakin “sehat” di kuartal-kuartal berikutnya, karena beban bunga yang harus dibayarkan juga semakin rendah. Hal ini terlihat pada 1H11
dimana beban bunga DGIK hanya mencapai Rp 5,7 miliar, lebih kecil dari 1H10 yang mencapai Rp 15,7 miliar.
Gambar 6 : Hutang Berbunga, Kas, dan
Biaya Bunga DGIK (Rp, miliar)
0
100
200
300
400
500
600
700
31-Dec-10 31-Mar-11 30-Jun-11
274
142136
662
365
323
31 5.7 5.7
Rp, miliar
Hutang berbunga Kas Biaya bunga
Sumber :PT Duta Graha Indah Tbk., Pefindo Divisi Valuasi Saham & Indexing

“Pernyataan disclaimer pada halaman akhir merupakan bagian yang tidak
terpisahkan dari dokumen ini”
www.pefindo.com
Duta Graha Indah, Tbk
23 Agustus 2011 Halaman ke 7 dari 11 halaman
Prospek Bisnis DGIK Seiring dengan usaha Pemerintah Indonesia memfasilitasi pertumbuhan infrastruktur dengan cara meningkatkan anggaran infrastruktur di tahun 2011, ditambah dengan kuatnya pertumbuhan sektor properti, menyebabkan industri konstruksi tumbuh 40,25% YoY selama Januari – April 2011. Diiringi dengan strategi yang tepat dengan memasuki industri EPC, yang memberikan marjin lebih besar, serta kondisi keuangan
yang lebih sehat, membuat kami percaya bahwa pendapatan DGIK dapat tumbuh
8,4% YoY di tahun 2011, dan CAGR 7,2% selama periode tahun 2010 – 2015.
Gambar 7: Pendapatan & Laba Bersih DGIK
(dalam Rp miliar)
-
10
20
30
40
50
60
70
80
90
1,150
1,200
1,250
1,300
1,350
1,400
1,450
1,500
2008 2009 2010 2011P
Rp miliarRp miliar
Pendapatan (Rp, miliar) Laba bersih (Rp, miliar)
Sumber: PT Duta Graha Indah Tbk. Estimasi Pefindo Divisi Valuasi Saham & Indexing

“Pernyataan disclaimer pada halaman akhir merupakan bagian yang tidak
terpisahkan dari dokumen ini”
www.pefindo.com
Duta Graha Indah, Tbk
23 Agustus 2011 Halaman ke 8 dari 11 halaman
VALUASI
Metodologi yang Digunakan
Kami mengaplikasikan metode discounted cash flow (DCF) sebagai metode penilaian utama dengan pertimbangan bahwa pertumbuhan pendapatan adalah merupakan faktor yang sangat mempengaruhi nilai (value driver) jika dibandingkan dengan pertumbuhan aset.
Selain itu kami menggunakan metode Guideline company method (GCM) sebagai metode pembanding. Penilaian ini didasarkan pada Nilai 100% saham DGIK per tanggal 23 Agustus 2011, menggunakan laporan keuangan tanggal 30 Juni 2011 sebagai dasar
dilakukannya analisa fundamental.
Estimasi Nilai
Kami menggunakan Cost of Capital 13,84% dan Cost of Equity sebesar 14,35% berdasarkan asumsi-asumsi berikut :
Tabel 3 : Asumsi
Risk free rate (%)* 6,81 Risk premium (%)* 7,69
Beta (x)* 0,72 Cost of Equity (%) 14,35 Marginal tax rate (%) 25,0 Debt to Equity Ratio 0,14 WACC (%) 13,84
Sumber: Bloomberg, Estimasi Pefindo Divisi Valuasi Saham & Indexing Catatan: * per tanggal 23 Agustus 2011
Estimasi Target harga referensi saham untuk 12 bulan berdasarkan posisi penilaian pada tanggal 23 Agustus 2011 adalah sebagai berikut:
Dengan menggunakan metode DCF dan asumsi tingkat diskonto
13,84%, adalah Rp 180 – Rp 195 per saham.
Dengan menggunakan metode GCM (PBV 1,74X and P/E 10,93X) adalah Rp 168 – Rp 330 per saham.
Untuk mendapatkan nilai yang mewakili kedua indikasi nilai tersebut dilakukan rekonsiliasi dengan dilakukan pembobotan terhadap kedua metode tersebut sebesar 70% untuk DCF dan 30%untuk metode GCM.
Berdasarkan hasil perhitungan diatas maka Estimasi Target harga referensi saham untuk 12 bulan adalah Rp Rp 176 - Rp 235 per lembar saham.
Tabel 4: Ringkasan Penilaian dengan Metode DCF
Konservatif Moderat Optimis
PV of Free Cash Flows – [Rp, miliar]
98 103 109
PV Terminal Value – [Rp, miliar] 706 743 780
Cash and Cash Equivalent – [Rp, miliar]
323 323 323
Net Debt – [Rp miliar] (136) (136) (136) Total Equity Value – [Rp miliar] 992 1.034 1.076 Number of Share, [juta saham] 5.522 5.522 5.522 Fair Value per Share, [Rp] 180 187 195
Sumber: Estimasi Pefindo Divisi Valuasi Saham & Indexing
TARGET HARGA

“Pernyataan disclaimer pada halaman akhir merupakan bagian yang tidak
terpisahkan dari dokumen ini”
www.pefindo.com
Duta Graha Indah, Tbk
23 Agustus 2011 Halaman ke 9 dari 11 halaman
Tabel 5 : Pembanding GCM
ADHI JKON TOTL DGIK Rata-Rata
Valuasi, 23 Agustus 2011
P/E, [x] 5,42 20,36 9,88 8,06 10,93
P/BV, [x] 1,24 3,16 1,98 0,59 1,74
Sumber: Bloomberg, Estimasi Pefindo Divisi Valuasi Saham & Indexing
Tabel 6 : Ringkasan Penilaian dengan Metode GCM
Multiples (x)
Est. EPS (Rp)
Est. BV/Share (Rp)
Value (Rp)
P/BV 1,74 - 188 330 P/E 10,93 15 - 168
Source: Bloomberg, Pefindo Equity & Index Valuation Division Estimates
Tabel 7: Rekonsiliasi Nilai Wajar
Nilai Wajar per Saham [Rp]
DCF GCM Rata-Rata
Batas atas 195 330 235
Batas bawah 180 168 176
Bobot 70% 30%
Sumber: Estimasi Pefindo Divisi Valuasi Saham & indexing

“Pernyataan disclaimer pada halaman akhir merupakan bagian yang tidak
terpisahkan dari dokumen ini”
www.pefindo.com
Duta Graha Indah, Tbk
23 Agustus 2011 Halaman ke 10 dari 11 halaman
Tabel 8: Laporan Laba (Rugi)
[Rp miliar]
Laporan Laba(Rugi) 2008 2009 2010 2011P 2012P
Penjualan 1.353 1.289 1.355 1.468 1.583
Harga pokok penjualan (1.197) (1.123) (1.180) (1.286) (1.389)
Laba kotor 156 166 175 182 194
Laba proyek kerjasama
operasi (KSO) 7 12 16 18 19
Laba kotor setelah proyek KSO 163 178 191 200 213
Beban Usaha (44) (51) (57) (58) (57)
Laba Operasional 119 127 134 141 157
Penghasilan (beban) lain-
lain (21) (22) (23) (13) (14)
Laba sebelum pajak 98 104 111 129 143
Pajak (37) (38) (41) (44) (47)
Laba bersih 61 67 71 85 95
Sumber: PT Duta Graha Indah Tbk., Estimasi Pefindo Divisi Valuasi Saham & Indexing
Tabel 9: Neraca
[Rp miliar]
Neraca 2008 2009 2010 2011P 2012P
Aset
Aset lancar
Kas dan setara kas 299 352 662 423 455
Piutang 82 73 213 84 91
Persediaan - - 1 - -
Tagihan bruto kepada pemberi kerja
489 533 442 599 646
Aset lain-lain 118 135 168 117 126
Jumlah Aset lancar 986 1.094 1.487 1.223 1.318
Aset Tetap 59 54 83 85 87
Aset lain-lain 333 346 389 351 379
Total Aset 1.378 1.495 1.959 1.660 1.784
Kewajiban
Hutang usaha 114 177 543 123 133
Kewajiban jk. pendek 161 210 269 237 255
Hutang jk pdk lainnya 187 149 161 207 223
Hutang jangka panjang 45 33 4 47 51
Hutang jk. Panjang
lainnya 6 8 10 7 8
Total Kewajiban 513 577 988 620 669
Hak Minoritas 0,3 1,3 1,3 - -
Total Ekuitas 865 916 970 1,039 1,115
Sumber: PT Duta Graha Indah Tbk., Estimasi Pefindo Divisi Valuasi Saham & Indexing
0.00
0.10
0.20
0.30
0.40
0.50
0.60
0.70
0.80
0.90
0.00
2.00
4.00
6.00
8.00
10.00
12.00
2008 2009 2010
P/BVP/E
P/E P/BV
0.00
0.20
0.40
0.60
0.80
1.00
1.20
0.00
1.00
2.00
3.00
4.00
5.00
6.00
7.00
8.00
2008 2009 2010
TATROA (%), ROE (%)
ROA (%) ROE (%) TAT (x)
Tabel 10: Rasio Kunci
Rasio 2008 2009 2010 2011P 2012P
Pertumbuhan [%]
Penjualan 35,1 (4,8) 5,2 8,4 7,8
Laba Operasional 0,7 6,4 6,1 5,1 10,8
EBITDA (2,0) 16,3 10,0 7,8 12,1
Laba Bersih (20,2) 9,7 5,7 20,2 12,3
Profitabilitas [%]
Marjin Laba Kotor 11,5 12,9 12,9 12,4 12,3
Marjin Laba Operasi 8,8 9,8 9,9 9,6 9,9
Marjin EBITDA 9,5 11,6 12,2 12,1 12,6
Marjin Laba Bersih 4,5 5,2 5,2 5,8 6,0
ROA 4,4 4,5 3,6 5,1 5,3
ROE 7,0 7,3 7,3 8,2 8,5
Solvabilitas [X]
Debt to Equity 0,6 0,6 1,0 0,6 0,6
Debt to Asset 0,4 0,4 0,5 0,4 0,4
Likuiditas [X]
Rasio Lancar 2,1 2,0 1,5 2,2 2,2
Quick Ratio 0,8 0,8 0,9 0,9 0,9
Sumber: PT Duta Graha Indah Tbk. Estimasi Pefindo Divisi Valuasi Saham & Indexing
“Pernyataan disclaimer pada halaman akhir merupakan bagian yang tidak
terpisahkan dari dokumen ini”
www.pefindo.com
Duta Graha Indah, Tbk
23 Agustus 2011 Halaman ke 11 dari 11 halaman
DISCLAIMER
Laporan ini dibuat berdasarkan sumber-sumber yang kami anggap terpercaya dan dapat diandalkan. Namun kami tidak menjamin kelengkapan, keakuratan atau kecukupannya. Dengan demikian kami tidak bertanggung jawab atas segala keputusan investasi yang diambil berdasarkan laporan ini. Adapun asumsi,
opini, dan perkiraan merupakan hasil dari pertimbangan internal kami per tanggal penilaian (cut off date), dan kami dapat mengubah pertimbangan diatas sewaktu-waktu tanpa pemberitahuan terlebih dahulu. Kami tidak bertanggung jawab atas kekeliruan atau kelalaian yang terjadi akibat penggunaan laporan ini. Kinerja dimasa lalu tidak selalu dapat dijadikan acuan hasil masa depan. Laporan ini bukan merupakan rekomendasi penawaran, pembelian atau menahan suatu saham tertentu. Laporan ini mungkin tidak sesuai untuk beberapa investor. Seluruh opini dalam laporan ini telah disampaikan dengan itikad baik, namun sewaktu-waktu dapat berubah tanpa pemberitahuan terlebih dahulu, dan disajikan dengan benar per tanggal diterbitkan laporan ini. Harga, nilai, atau pendapatan dari setiap saham Perseroan yang disajikan dalam laporan ini kemungkinan dapat lebih rendah dari harapan pemodal, dan pemodal juga mungkin mendapatkan pengembalian yang lebih rendah dari nilai investasi yang ditanamkan. Investasi didefinisikan sebagai pendapatan yang kemungkinan besar diterima dimasa depan, namun nilai dari pendapatan yang akan diterima tersebut kemungkinan besar juga akan berfluktuasi. Untuk saham Perseroan yang penyajian laporan keuangannya didenominasi dalam mata uang selain Rupiah, perubahan nilai tukar mata uang tersebut kemungkinan dapat menurunkan nilai, harga, atau pendapatan investasi pemodal. Informasi dalam laporan ini bukan merupakan pertimbangan pajak dalam mengambil suatu keputusan investasi. Target harga saham dalam Laporan ini merupakan nilai fundamental, bukan merupakan Nilai Pasar Wajar, dan bukan merupakan harga acuan transaksi yang diwajibkan oleh peraturan perundang-undangan yang berlaku. Laporan target harga saham yang diterbitkan oleh Pefindo Divisi Valuasi Saham dan Indexing bukan merupakan rekomendasi untuk membeli, menjual, atau menahan suatu saham tertentu, dan tidak dapat dianggap sebagai nasehat investasi oleh Pefindo Divisi Valuasi Saham dan Indexing yang behubungan dengan cakupan Jasa Pefindo kepada, atau kaitannya kepada, beberapa pihak, termasuk emiten, penasehat keuangan, pialang saham, investment banks, institusi keuangan dan perantara keuangan, dalam kaitannya menerima imbalan atau keuntungan lainnya dari pihak tersebut, Laporan ini tidak ditujukan untuk pemodal tertentu dan tidak dapat dijadikan bagian dari tujuan investasi terhadap suatu saham dan juga bukan merupakan rekomendasi investasi terhadap suatu saham tertentu atau suatu strategi investasi. Sebelum melakukan tindakan dari hasil laporan ini, pemodal disarankan untuk mempertimbangkan terlebih dahulu kesesuaian situasi dan kondisi dan, jika dibutuhkan, mintalah bantuan penasehat keuangan. PEFINDO memisahkan kegiatan Valuasi Saham dengan kegiatan Pemeringkatan untuk menjaga independensi dan objektivitas dari proses dan produk kegiatan analitis. PEFINDO telah menetapkan kebijakan dan prosedur untuk menjaga kerahasiaan informasi non-publik tertentu yang diterima sehubungan dengan proses analitis. Keseluruhan proses, metodologi dan databse yang digunakan dalam penyusunan Laporan Target Harga Referensi Saham ini secara keseluruhan adalah berbeda dengan proses, metodologi dan database yang digunakan PEFINDO dalam melakukan pemeringkatan. Laporan ini dibuat dan disiapkan Pefindo Divisi Valuasi Saham & Indexing dengan tujuan untuk meningkatkan transparansi harga saham yang tercatat di Bursa Efek Indonesia. Laporan ini juga bebas dari pengaruh tekanan atau paksaan dari Bursa maupun Perseroan yang dinilai. Pefindo Divisi Valuasi Saham & Indexing akan menerima imbalan sebesar Rp.20.000.000,- masing-masing dari Bursa Efek
Indonesia dan Perseroan yang dinilai untuk 2 (dua) kali pelaporan per tahun. Untuk keterangan lebih lanjut, dapat mengunjungi website kami di http://www.pefindo.com Laporan ini dibuat dan disiapkan oleh Pefindo Divisi Valuasi Saham dan Indexing. Di Indonesia Laporan ini dipublikasikan pada website kami dan juga pada website Bursa Efek Indonesia.

Page 1 of 11 pages
Contact: Equity & Index Valuation Division Phone: (6221) 7278 2380 [email protected]
“Disclaimer statement in the last page is an
integral part of this report” www.pefindo.com
Duta Graha Indah, Tbk Secondary Report
Equity Valuation
August 23rd, 2011
Target Price
Low High 176 235
Construction
Property
Historical Chart
0
20
40
60
80
100
120
140
160
180
0.00
500.00
1,000.00
1,500.00
2,000.00
2,500.00
3,000.00
3,500.00
4,000.00
4,500.00
8/23/2010 10/11/201011/23/2010 1/7/2011 2/22/2011 4/5/2011 5/19/2011 7/4/2011 8/15/2011
DGIKIHSG
IHSG DGIK
Source : Bloomberg
Stock Information Rp
Ticker code DGIK
Market price as of August 23rd, 2011 103
Market price – 52 week high 157
Market price – 52 week low 80
Market cap – 52 week high (bn) 869.9
Market cap – 52 week low (bn) 443.3
Stock Valuation Last Current
High 200 235
Low 133 176
Market Value Added & Market Risk
0
0.2
0.4
0.6
0.8
1
1.2
1.4
-120
-100
-80
-60
-40
-20
0
2008 2009 2010
Market RiskMVA
MVA Market Risk
Source : Bloomberg, Pefindo Equity & Index Valuation Division
Shareholders (%)
PT Lintas Kebayoran Kota 33.03
PT Lokasindo Aditama 7.35
Hudson River Group Pte Ltd 15.00
PT Rezeki Segitiga Emas 9.02
Dudung Purwadi 2.71
Ongky Abdulrahman 0.09
Sutiono Teguh 0.09
Public (each below 5%) 32.71
Grow Through Diversification
BUILDINGS PROJECTS
INFRASTRUCTURE PROJECTS
Indonesia Stock Exchange
Le Meridien Expansion - Jakarta
Dharmawangsa Apartment Grand Indonesia - Jakarta
Batang Waleri –Central Java
Hasanuddin Airport – Makassar Kuok Bridge - Riau
PT Duta Graha Indah, Tbk ("DGIK"), was established on January 11th, 1982, in Jakarta, and has been faithfully serving the country by erecting first-class buildings and infrastructures. DGIK began to take up infrastructure projects in 1986, by undertaking road construction projects
in Sumatra, and from that project DGIK is now able to diversify its business to include construction of dams, irrigation, ports, and flood
control. DGIK is also widely recognized for its well accomplished projects such as Indonesia Stock Exchange building (Jakarta), and Grand Indonesia Shopping Mall (Jakarta). In 2010, DGIK is the first national construction company that obtained infrastructure projects in Timor Leste. Beside building and infrastructure, DGIK now also entering energy and power plan sector. Furthermore, DGIK continues striving to expand
to foreign countries, as their opened branch offices in Brunei Darussalam and Saudi Arabia. With such projects diversification, we believe that DGIK prospect to grow is still conducive, since they are not relying on particular sectors or geographic area.

“Disclaimer statement in the last page
is an integral part of this report”
www.pefindo.com
Duta Graha Indah, Tbk
August 23rd, 2011 Page 2 of 11 pages
Target Price Adjustment
We make some adjustments to our previous forecast and adjust our Target Price to the range of Rp 176 - Rp 235 per share, based on the following considerations:
Improving performance in 2010, as DGIK revenue stood at Rp 1,355
billion, or increased by 5.16% YoY. This actual performance is better than our previous forecast which only reached Rp 1,337 billion. This improvement continues in 1H11, as DGIK’s revenue grows by 6.6% YoY.
More infrastructure projects from the Indonesian Government, as proved by the increase of budget for infrastructure sectors in 2011 to 63.2% from the total budget of APBN in 2011, better than just 27.2% of total
APBN in 2010.
Expected realization on the value of construction project during 2011 period, which predicted to rise by 40.25% YoY from total realized value of construction projects in 2010. We expect that property sectors will become the major sector to support the growth of construction industry,
with 24.05% of contribution. This high growth of property industry is supported by the increasing amount of mortgage financing from banks.
Risk free rate, equity premium, and beta assumption are 6.81%, 7.69%, and 0.72x respectively.
Entering EPC Sector Since 2011, DGIK adds its scope of services as hydro power Engineering, Procurement and Construction (“EPC”) contractor, especially to build medium size hydro power plants. As a start, currently DGIK is working on 2
hydro power projects in Sumatra and Java. It is believed that Energy, Procurement, and Construction (“EPC”) business will provide better margin for DGIK. Moreover, there are huge opportunities to develop medium size hydro power plant at various region in Indonesia due to many regions still facing lack of electricity supply but have enough water supply to operate hydro power plant.
Reducing Its Interest Bearing Debt As of June 30th, 2011, DGIK is able to reduce its interest bearing debt to Rp 136 billion from Rp 273.7 billion as of December 31st, 2010, using their internal cash. With this action, we believe DGIK will be healthier in following quarters, since DGIK’s interest expense will also be lower and its working capital will also be stronger.
Business Prospects
As the Indonesian Government facilitates the growth of infrastructure industry by raising its budget for infrastructure projects in 2011, plus the strong growth of property sectors, caused construction industry to grow by 40.25% YoY during January – April 2011. DGIK also has completed the agreement with Gulf Power International, to established PT Duta Graha Arabia, a construction company in Saudi Arabia. Augmented with
appropriate strategy to enter EPC industry which provides higher margin, and healthier financial conditions, we believe that DGIK’s revenue could grow by 8.4% YoY in 2011, and CAGR 7.2% during 2010 – 2015 periods.
Table 1: Performance Summary
2008 2009 2010 2011P 2012P
Revenue [Rp bn] 1,353 1,289 1,355 1,468 1,583
Pre-tax Profit [Rp bn] 98 104 111 129 143
Net Profit [Rp bn] 61 67 71 85 95
EPS [Rp] 11.0 12.1 12.8 15.4 17.2
EPS Growth [%] (20.2) 9.7 5.7 20.2 12.3
P/E [x] 4.5 7.2 11.4 6.7* 6.0*
PBV [x] 0.3 0.5 0.8 0.5* 0.5*
Source: PT Duta Graha Indah Tbk., Pefindo Equity & Index Valuation Division Estimates *) Based on DGIK’s share price as of August 23
rd, 2011 – Rp 103/share
INVESTMENT PARAMETER
Duta Graha Indah, Tbk
August 23rd, 2011 Page 3 of 11 pages
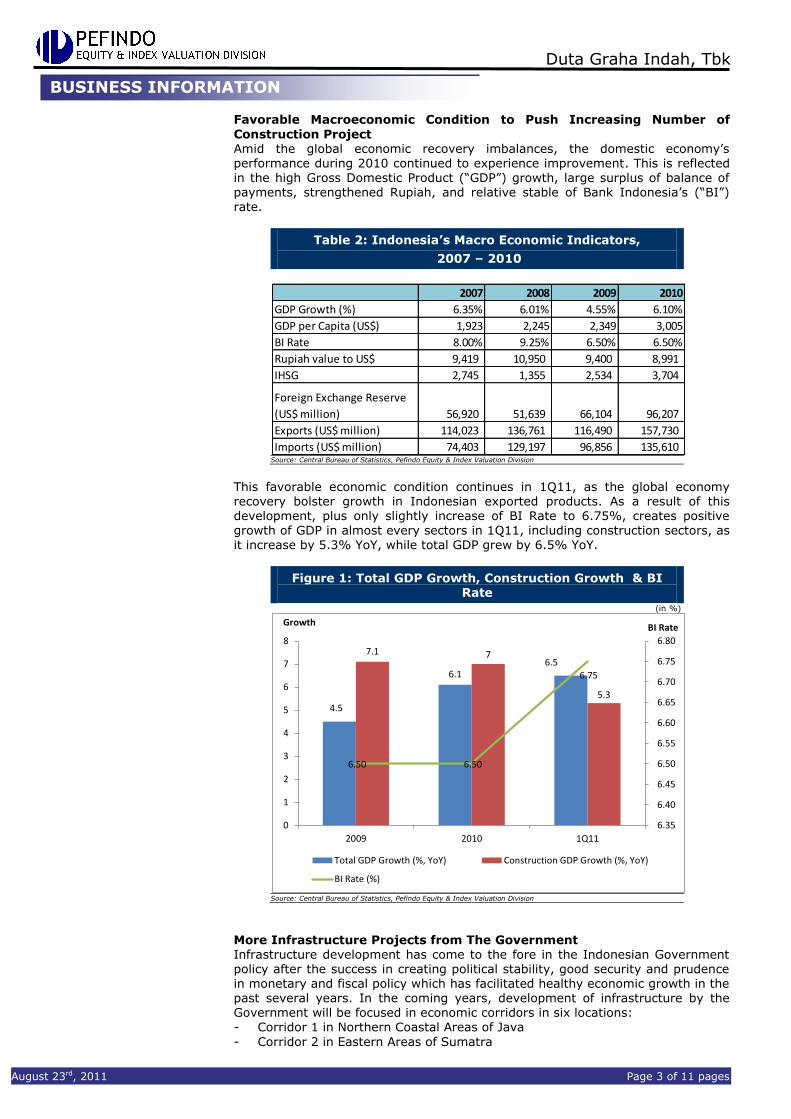
Favorable Macroeconomic Condition to Push Increasing Number of
Construction Project Amid the global economic recovery imbalances, the domestic economy’s performance during 2010 continued to experience improvement. This is reflected in the high Gross Domestic Product (“GDP”) growth, large surplus of balance of payments, strengthened Rupiah, and relative stable of Bank Indonesia’s (“BI”) rate.
Table 2: Indonesia’s Macro Economic Indicators,
2007 – 2010
2007 2008 2009 2010
GDP Growth (%) 6.35% 6.01% 4.55% 6.10%
GDP per Capita (US$) 1,923 2,245 2,349 3,005
BI Rate 8.00% 9.25% 6.50% 6.50%
Rupiah value to US$ 9,419 10,950 9,400 8,991
IHSG 2,745 1,355 2,534 3,704
Foreign Exchange Reserve
(US$ million) 56,920 51,639 66,104 96,207
Exports (US$ million) 114,023 136,761 116,490 157,730
Imports (US$ million) 74,403 129,197 96,856 135,610 Source: Central Bureau of Statistics, Pefindo Equity & Index Valuation Division
This favorable economic condition continues in 1Q11, as the global economy recovery bolster growth in Indonesian exported products. As a result of this development, plus only slightly increase of BI Rate to 6.75%, creates positive growth of GDP in almost every sectors in 1Q11, including construction sectors, as it increase by 5.3% YoY, while total GDP grew by 6.5% YoY.
Figure 1: Total GDP Growth, Construction Growth & BI Rate
(in %)
4.5
6.16.5
7.1 7
5.3
6.50 6.50
6.75
6.35
6.40
6.45
6.50
6.55
6.60
6.65
6.70
6.75
6.80
0
1
2
3
4
5
6
7
8
2009 2010 1Q11
BI RateGrowth
Total GDP Growth (%, YoY) Construction GDP Growth (%, YoY)
BI Rate (%)
Source: Central Bureau of Statistics, Pefindo Equity & Index Valuation Division
More Infrastructure Projects from The Government Infrastructure development has come to the fore in the Indonesian Government policy after the success in creating political stability, good security and prudence in monetary and fiscal policy which has facilitated healthy economic growth in the past several years. In the coming years, development of infrastructure by the Government will be focused in economic corridors in six locations: - Corridor 1 in Northern Coastal Areas of Java
- Corridor 2 in Eastern Areas of Sumatra
BUSINESS INFORMATION
“Disclaimer statement in the last page
is an integral part of this report”
www.pefindo.com
Duta Graha Indah, Tbk
August 23rd, 2011 Page 4 of 11 pages
- Corridor 3 in Southern Kalimantan - Corridor 4 in Trans Sulawesi
- Corridor 5 in Bali – Nusa Tenggara, and - Corridor 6 in Papua. These six corridors are considered most potential to contribute to boosting the
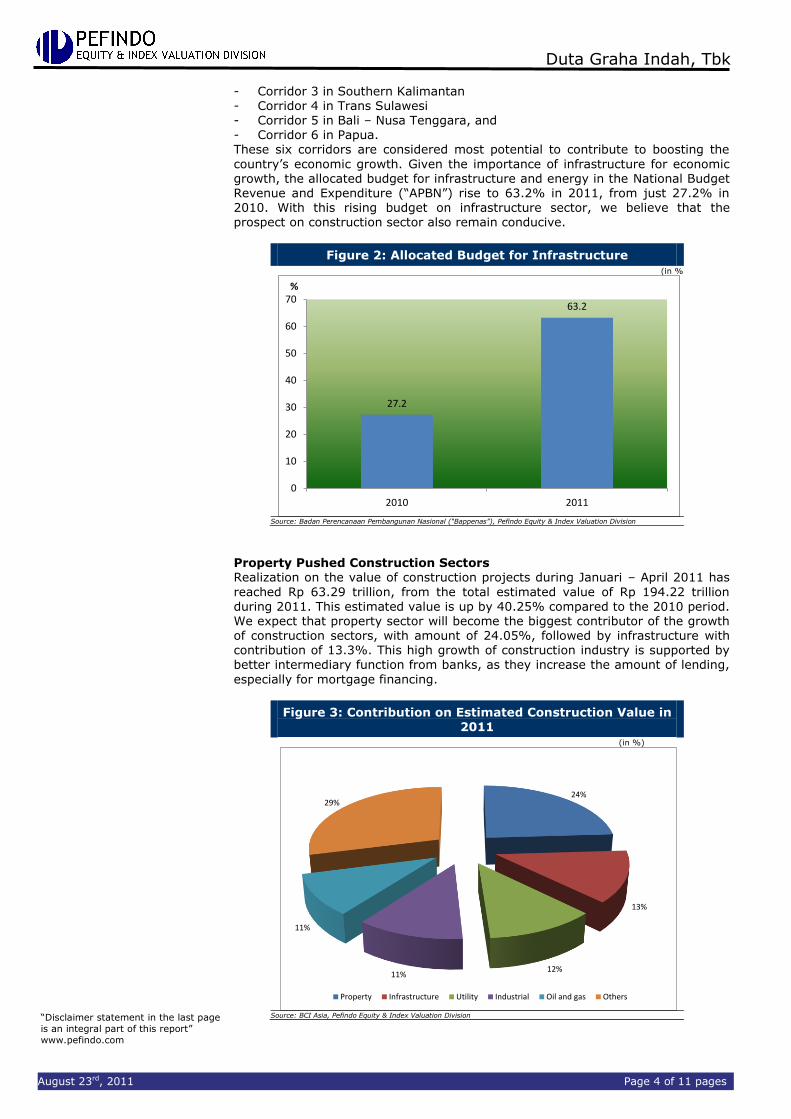
country’s economic growth. Given the importance of infrastructure for economic growth, the allocated budget for infrastructure and energy in the National Budget Revenue and Expenditure (“APBN”) rise to 63.2% in 2011, from just 27.2% in 2010. With this rising budget on infrastructure sector, we believe that the prospect on construction sector also remain conducive.
Figure 2: Allocated Budget for Infrastructure (in %)
27.2
63.2
0
10
20
30
40
50
60
70
2010 2011
%
Source: Badan Perencanaan Pembangunan Nasional (“Bappenas”), Pefindo Equity & Index Valuation Division
Property Pushed Construction Sectors Realization on the value of construction projects during Januari – April 2011 has
reached Rp 63.29 trillion, from the total estimated value of Rp 194.22 trillion
during 2011. This estimated value is up by 40.25% compared to the 2010 period. We expect that property sector will become the biggest contributor of the growth of construction sectors, with amount of 24.05%, followed by infrastructure with contribution of 13.3%. This high growth of construction industry is supported by better intermediary function from banks, as they increase the amount of lending,
especially for mortgage financing.
Figure 3: Contribution on Estimated Construction Value in 2011
(in %)
24%
13%
12%11%
11%
29%
Property Infrastructure Utility Industrial Oil and gas Others
Source: BCI Asia, Pefindo Equity & Index Valuation Division

“Disclaimer statement in the last page
is an integral part of this report”
www.pefindo.com
Duta Graha Indah, Tbk
August 23rd, 2011 Page 5 of 11 pages
Ability to Identify Prospective Markets As it had done in previous years, in 2010, DGIK remained focused on
Government projects. In 2010, the Government projects contribute around 78% of DGIK’s revenues, whereas the remaining 22% came from private projects. Bigger portfolio of Government projects coupled with more secure payments
allowed DGIK to operate with stronger liquidity. In terms of projects types, the largest part of revenues earned by DGIK was generated from building construction (77%) and the remaining (23%) are came from infrastructure projects. It continues in 1H11, in which 76.5% of DGIK’s revenue comes from building construction, and 23.5% comes from infrastructure projects. We believe that with DGIK’s ability to see the most prospective markets, keeps DGIK’s business prospects bright, since the value from property projects is expected to
reach Rp 46.7 trillion in 2011, from Rp 40.77 trillion in 2010, while the Government’s budget for infrastructure also expected to rise in the future.
Figure 4 : DGIK’s Revenue from
Infrastructure and Property (%)
0%
10%
20%
30%
40%
50%
60%
70%
80%
90%
100%
2009 2010 1H10 1H11
71% 77%58%
78%
29% 23%42%
22%
Property Infrastructure
Source :PT Duta Graha Indah Tbk., Pefindo Equity & Index Valuation Division
EPC Sectors for Higher Margin
In 2011, DGIK set its step to enter the Engineering, Procurement and Construction (“EPC”) business, by way of entering into power plant sector, particularly middle sized hydro power plant that can produce around 1 – 10 Mega Watt of electricity. This sector is potential since many Indonesian regions still
facing lack of electricity supply but possessed many rivers that can produce such amount of electricity. Besides, it only needs less than Rp 300 billion of investment to build the power plant, which is within range of DGIK’s financial ability. We believe that in years to come, DGIK will experience higher margin since most of the EPC contract used to provide higher margin than common infrastructure projects.
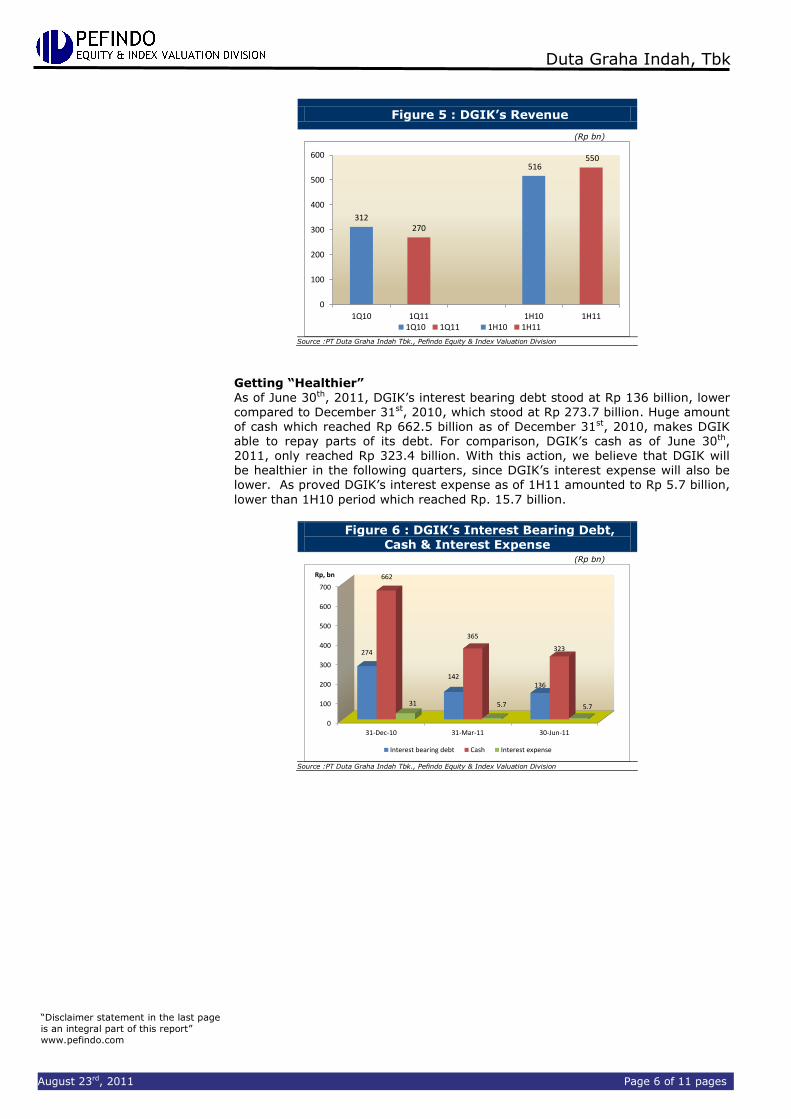
2Q11 : Acceleration of Payments Led to Increase of Revenue During 1Q11, DGIK’s sales depicts a decreasing performance, as it drops to just Rp 269.7 billion, from Rp 312.0 billion in 1Q10, or decreased by 15.7% YoY. We believe that delayed payments from the project owners caused this decreasing of revenue, since during 1Q11 the projects owner, especially the Government, also
occupied with new projects tenders for 2011 period. During 2Q11, DGIK able to collect late payments that occurred in 1Q11, which made their revenue go up from Rp 516.5 billion as of 1H10, to Rp 550.5 billion in 1H11. We believe that with stable speed of payment, as happened in 2Q11, DGIK revenue could reach Rp 1.468 trillion in 2011, or grow by 8.35% YoY.
“Disclaimer statement in the last page
is an integral part of this report”
www.pefindo.com
Duta Graha Indah, Tbk
August 23rd, 2011 Page 6 of 11 pages
Figure 5 : DGIK’s Revenue
(Rp bn)
312270
516 550
0
100
200
300
400
500
600
1Q10 1Q11 1H10 1H111Q10 1Q11 1H10 1H11
Source :PT Duta Graha Indah Tbk., Pefindo Equity & Index Valuation Division
Getting “Healthier”
As of June 30th, 2011, DGIK’s interest bearing debt stood at Rp 136 billion, lower compared to December 31st, 2010, which stood at Rp 273.7 billion. Huge amount of cash which reached Rp 662.5 billion as of December 31st, 2010, makes DGIK able to repay parts of its debt. For comparison, DGIK’s cash as of June 30th, 2011, only reached Rp 323.4 billion. With this action, we believe that DGIK will be healthier in the following quarters, since DGIK’s interest expense will also be lower. As proved DGIK’s interest expense as of 1H11 amounted to Rp 5.7 billion,
lower than 1H10 period which reached Rp. 15.7 billion.
Figure 6 : DGIK’s Interest Bearing Debt, Cash & Interest Expense
(Rp bn)
0
100
200
300
400
500
600
700
31-Dec-10 31-Mar-11 30-Jun-11
274
142136
662
365
323
31 5.7 5.7
Rp, bn
Interest bearing debt Cash Interest expense
Source :PT Duta Graha Indah Tbk., Pefindo Equity & Index Valuation Division
“Disclaimer statement in the last page
is an integral part of this report”
www.pefindo.com
Duta Graha Indah, Tbk
August 23rd, 2011 Page 7 of 11 pages
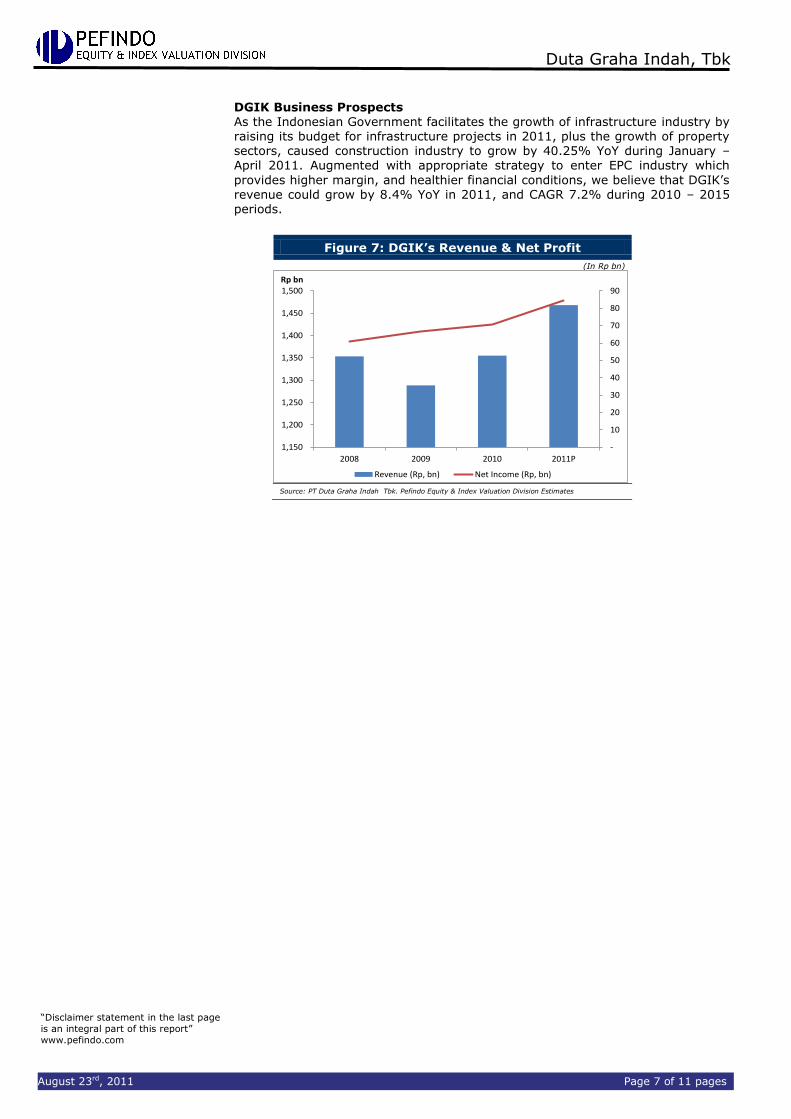
DGIK Business Prospects
As the Indonesian Government facilitates the growth of infrastructure industry by raising its budget for infrastructure projects in 2011, plus the growth of property sectors, caused construction industry to grow by 40.25% YoY during January – April 2011. Augmented with appropriate strategy to enter EPC industry which
provides higher margin, and healthier financial conditions, we believe that DGIK’s revenue could grow by 8.4% YoY in 2011, and CAGR 7.2% during 2010 – 2015 periods.
Figure 7: DGIK’s Revenue & Net Profit
(In Rp bn)
-
10
20
30
40
50
60
70
80
90
1,150
1,200
1,250
1,300
1,350
1,400
1,450
1,500
2008 2009 2010 2011P
Rp bn
Revenue (Rp, bn) Net Income (Rp, bn) Source: PT Duta Graha Indah Tbk. Pefindo Equity & Index Valuation Division Estimates

“Disclaimer statement in the last page
is an integral part of this report”
www.pefindo.com
Duta Graha Indah, Tbk
August 23rd, 2011 Page 8 of 11 pages
VALUATION
Methodology We apply Discounted Cash Flow (DCF) method as the main valuation approach considering the income growth is a value driver in DGIK instead of asset growth. Furthermore, we also apply Guideline Company Method (GCM) as comparison
method. This valuation is based on 100% shares price as of August 23rd, 2011, using DGIK’s financial report as of June 30th, 2011, for our fundamental analysis.
Value Estimation
We use Cost of Capital of 13.84% and Cost of Equity of 14.35% based on the following assumptions: Table 3 : Assumption
Risk free rate (%)* 6.81 Risk premium (%)* 7.69 Beta (x)* 0.72 Cost of Equity (%) 14.35 Marginal tax rate (%) 25.0 Debt to Equity Ratio 0.14 WACC (%) 13.84
Source: Bloomberg, Pefindo Equity & Index Valuation Division Estimates Notes: * As of August 23
rd, 2011
Target price for 12 months based on valuation as per August 23rd, 2011 is as
follows:
Using DCF method with discount rate assumption 13.84%, is Rp 180 - Rp 195 per share.
Using GCM method (PBV 1.74X and P/E 10.93X) is Rp 168 – Rp 330 per share.
In order to obtain a value which represents both value indications, we have weighted both DCF and GCM methods by 70%:30%. Based on the above calculation, target price of DGIK for 12 month is Rp 176 - Rp 235 per share.
Table 4: Summary of DCF Method Valuation
Conservative Moderate Aggressive
PV of Free Cash Flows – [Rp bn] 98 103 109
PV Terminal Value – [Rp bn] 706 743 780
Cash and Cash Equivalent – [Rp bn]
323 323 323
Net Debt – [Rp bn] (136) (136) (136) Total Equity Value – [Rp bn] 992 1,034 1,076 Number of Share, [mn shares] 5,522 5,522 5,522 Fair Value per Share, [Rp] 180 187 195
Source: Pefindo Equity & Index Valuation Division Estimates
TARGET PRICE

“Disclaimer statement in the last page
is an integral part of this report”
www.pefindo.com
Duta Graha Indah, Tbk
August 23rd, 2011 Page 9 of 11 pages
Table 5 : GCM Comparison
ADHI JKON TOTL DGIK Average
Valuation, August 23rd, 2011
P/E, [x] 5.42 20.36 9.88 8.06 10.93
P/BV, [x] 1.24 3.16 1.98 0.59 1.74
Source: Bloomberg, Pefindo Equity & Index Valuation Division Estimates
Table 6 : Summary of GCM Method Valuation
Multiples (x)
Est. EPS (Rp)
Est. BV/Share (Rp)
Value (Rp)
P/BV 1.74 - 188 330 P/E 10.93 15 - 168
Source: Bloomberg, Pefindo Equity & Index Valuation Division Estimates
Table 7: Fair Value Reconciliation
Fair Value per Share [Rp]
DCF GCM Average
Upper limit 195 330 235
Bottom limit 180 168 176
Weight 70% 30%
Source: Pefindo Equity & Index Valuation Division Estimates

“Disclaimer statement in the last page
is an integral part of this report”
www.pefindo.com
Duta Graha Indah, Tbk
August 23rd, 2011 Page 10 of 11 pages
Table 8: Income Statement
(Rp bn)
Income Statement 2008 2009 2010 2011P 2012P
Net Sales 1,353 1,289 1,355 1,468 1,583
COGS (1,197) (1,123) (1,180) (1,286) (1,389)
Gross Profit 156 166 175 182 194
Income from Joint
Operation (JO) projects 7 12 16 18 19
Gross Profit After Income From JO
Projects 163 178 191 200 213
Operating Expense (44) (51) (57) (58) (57)
Operating Profit 119 127 134 141 157
Other Income (Charges) (21) (22) (23) (13) (14)
Pre-tax Profit 98 104 111 129 143
Tax (37) (38) (41) (44) (47)
Net Profit 61 67 71 85 95
Source: PT Duta Graha Indah Tbk., Pefindo Equity & Index Valuation Division Estimates
Table 9: Balance Sheet
(Rp bn)
Balance Sheet 2008 2009 2010 2011P 2012P
Assets
Current Assets
Cash and cash
equivalents 299 352 662 423 455
Receivables 82 73 213 84 91
Inventory - - 1 - -
Gross amount due from project owners
489 533 442 599 646
Other Assets 118 135 168 117 126
Total Current Assets 986 1,094 1,487 1,223 1,318
Fixed Assets 59 54 83 85 87
Other Assets 333 346 389 351 379
Total Assets 1,378 1,495 1,959 1,660 1,784
Liabilities
Trade payables 114 177 543 123 133
Short term liabilities 161 210 269 237 255
Other short term
liabilities 187 149 161 207 223
Long term loan 45 33 4 47 51
Other long-term payables 6 8 10 7 8
Total Liabilities 513 577 988 620 669
Minority Interest 0.3 1.3 1.3 - -
Total Equity 865 916 970 1,039 1,115
Source: PT Duta Graha Indah Tbk., Pefindo Equity & Index Valuation Division Estimates
0.00
0.10
0.20
0.30
0.40
0.50
0.60
0.70
0.80
0.90
0.00
2.00
4.00
6.00
8.00
10.00
12.00
2008 2009 2010
P/BVP/E
P/E P/BV
0.00
0.20
0.40
0.60
0.80
1.00
1.20
0.00
1.00
2.00
3.00
4.00
5.00
6.00
7.00
8.00
2008 2009 2010
TATROA (%), ROE (%)
ROA (%) ROE (%) TAT (x)
Table 10: Key Ratios
Ratio 2008 2009 2010 2011P 2012P
Growth [%]
Sales 35.1 (4.8) 5.2 8.4 7.8
Operating Profit 0.7 6.4 6.1 5.1 10.8
EBITDA (2.0) 16.3 10.0 7.8 12.1
Net Profit (20.2) 9.7 5.7 20.2 12.3
Profitability [%]
Gross Margin 11.5 12.9 12.9 12.4 12.3
Operating Margin 8.8 9.8 9.9 9.6 9.9
EBITDA Margin 9.5 11.6 12.2 12.1 12.6
Net Margin 4.5 5.2 5.2 5.8 6.0
ROA 4.4 4.5 3.6 5.1 5.3
ROE 7.0 7.3 7.3 8.2 8.5
Solvability [X]
Debt to Equity 0.6 0.6 1.0 0.6 0.6
Debt to Asset 0.4 0.4 0.5 0.4 0.4
Liquidity [X]
Current Ratio 2.1 2.0 1.5 2.2 2.2
Quick Ratio 0.8 0.8 0.9 0.9 0.9
Source: PT Duta Graha Indah Tbk. Pefindo Equity & Index Valuation Division Estimates
“Disclaimer statement in the last page
is an integral part of this report”
www.pefindo.com
Duta Graha Indah, Tbk
August 23rd, 2011 Page 11 of 11 pages
DISCLAIMER
This report was prepared based on the trusted and reliable sources. Nevertheless, we do not guarantee its completeness, accuracy and adequacy. Therefore we do not responsible of any investment decision making based on this report. As for any assumptions, opinions and predictions were solely our internal judgments as per reporting date, and those judgments are subject to change without further notice. We do not responsible for mistake and negligence occurred by using this report. Last performance could not always be used as reference for future outcome. This report is not an offering recommendation, purchase or holds particular shares. This report might not be suitable for some investors. All opinion in this report has been presented fairly as per issuing date with good intentions; however it could be change at any time without further notice. The price, value or income from each share of the Company stated in this report might lower than the investor expectation and investor might obtain lower return than the invested amount. Investment is defined as the probable income that will be received in the future; nonetheless such return may possibly fluctuate. As for the Company which its share is denominated other than Rupiah, the foreign exchange fluctuation may reduce the value, price or investor investment return. This report does not contain any information for tax consideration in investment decision making. The share price target in this report is a fundamental value, not a fair market value nor a transaction price reference required by the regulations. The share price target issued by Pefindo Equity & Index Valuation Division is not a recommendation to buy, sell or hold particular shares and it could not be considered as an investment advice from Pefindo Equity & Index Valuation Division as its scope of service to, or in relation to some parties, includ ing listed companies, financial advisor, broker, investment bank, financial institution and intermediary, in correlation with receiving rewards or any other benefits from that parties. This report is not intended for particular investor and cannot be used as part of investment objective on particular shares and neither an investment recommendation on particular shares or an investment strategy. We strongly recommended investor to consider the suitable situation and condition at first before making decision in relation with the figure in this report. If it is necessary, kindly contact your financial advisor. PEFINDO keeps the activities of Equity Valuation separate from Ratings to preserve independence and
objectivity of its analytical processes and products. PEFINDO has established policies and procedures to maintain the confidentiality of certain non-public information received in connection with each analytical process. The entire process, methodology and the database used in the preparation of the Reference Share Price Target Report as a whole is different from the processes, methodologies and databases used PEFINDO in doing the rating. This report was prepared and composed by Pefindo Equity & Index Valuation Division with the objective to enhance shares price transparency of listed companies in Indonesia Stock Exchange (IDX). This report is also free of other party’s influence, pressure or force either from IDX or the listed company which reviewed by Pefindo Equity & Index Valuation Division. Pefindo Equity & Index Valuation Division will earn reward amounting to Rp 20 mn each from IDX and the reviewed company for issuing report twice per year. For further information, please visit our website at http://www.pefindo.com This report is prepared and composed by Pefindo Equity & Index Valuation Division. In Indonesia, this report is published in our website and in IDX website.