pepco merilllynchpower&gasconferencesept2007(final)
TRANSCRIPT
1
Positioned for Success Today…
Building for Success Tomorrow
Merrill LynchPower & Gas Leaders Conference
September 25 & 26, 2007 [Insert Logo]
2
Safe Harbor Statement
Some of the statements contained in today’s presentation are forward-looking statements within the meaning of Section 21E of the Securities Exchange Act of 1934 and are subject to the safe harbor created by the Private Securities Litigation Reform Act of 1995. These statements include all financial projections and any declarations regarding management’s intents, beliefs or current expectations. In some cases, you can identify forward-looking statements by terminology such as “may,” “will,” “should,” “expects,” “plans,” “anticipates,” “believes,”“estimates,” “predicts,” “potential” or “continue” or the negative of such terms or other comparable terminology. Any forward-looking statements are not guarantees of future performance, and actual results could differ materially from those indicated by the forward-looking statements. Forward-looking statements involve estimates, assumptions, known and unknown risks, uncertainties and other factors that may cause actual results, levels of activity, performance or achievements to be materially different from any future results, levels of activity, performance or achievements expressed or implied by such forward-looking statements. Each forward-looking statement speaks only as of the date of the particular statement, and we undertake no obligation to publicly update or revise any forward-looking statement, whether as a result of new information, future events or otherwise. A number of factors could cause actual results or outcomes to differ materially from those indicated by the forward-looking statements contained in this presentation. These factors include, but are not limited to, prevailing governmental policies and regulatory actions affecting the energy industry, including with respect to allowed rates of return, industry and rate structure, acquisition and disposal of assets and facilities, operation and construction of plant facilities, recovery of purchased power expenses, and present or prospective wholesale and retail competition; changes in and compliance with environmental and safety laws and policies; weather conditions; population growth rates and demographic patterns; competition for retail and wholesale customers; general economic conditions, including potential negative impacts resulting from an economic downturn; growth in demand, sales and capacity to fulfill demand; changes in tax rates or policies or in rates of inflation; rules and changes in accounting standards or practices; changes in project costs; unanticipated changes in operating expenses and capital expenditures; the ability to obtain funding in the capital markets on favorable terms; restrictions imposed by Federal and/or state regulatory commissions, PJM and other regional transmission organizations (NY ISO, ISO New England), the North American Electric Reliability Council and other applicable electric reliability organizations; legal and administrative proceedings (whether civil or criminal) and settlements that affect our business and profitability; pace of entry into new markets; volatility in market demand and prices for energy, capacity and fuel; interest rate fluctuations and credit market concerns; and effects of geopolitical events, including the threat of domestic terrorism. Readers are referred to the most recent reports filed with the Securities and Exchange Commission.

3
PHI Overview
$8.8B LTM Revenues $14.5B Total Assets$5.5B Market Cap
1.8 Million Electric Customers121,000 Gas Customers
Regulated Electric & Gas
DeliveryBusiness
Regulated Electric & GasDeliveryBusiness
CompetitiveEnergy/Other
66% of Operating Income
34% of Operating Income
Financial and customer data as of June 30, 2007. Operating Income percentage calculations are for the twelve months ended June 30, 2007, net of special items. See appendix for details.
PHI Investments
Note:
4
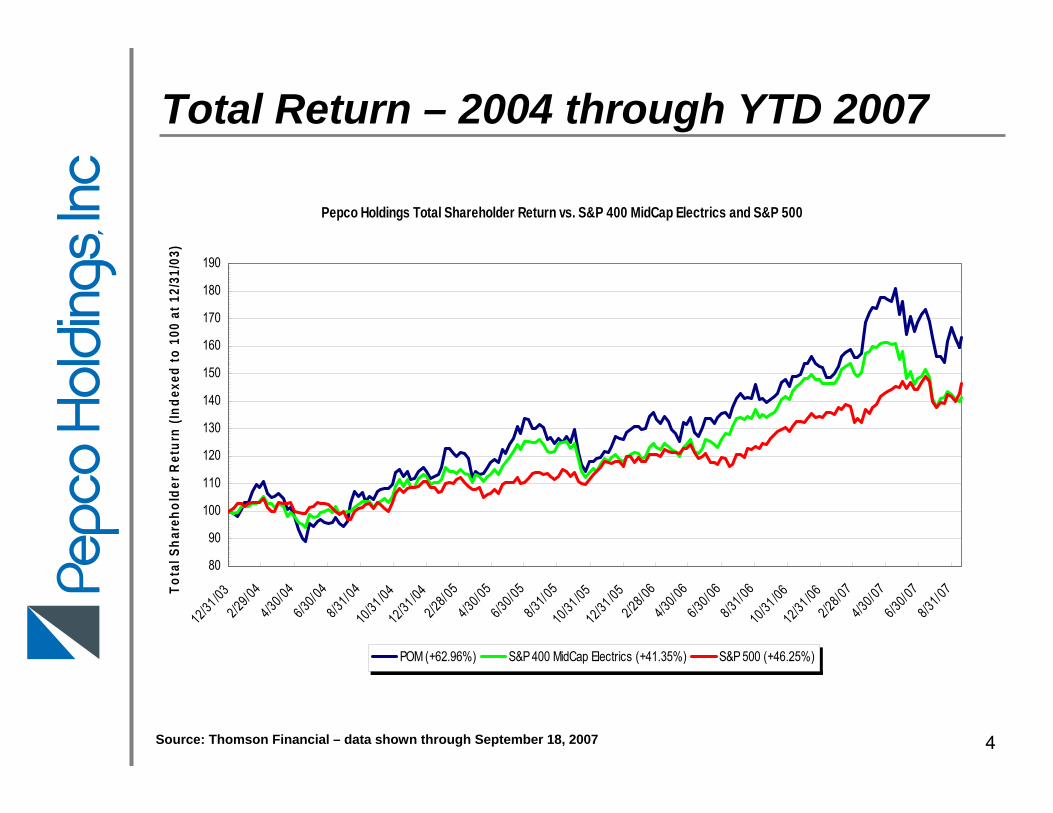
Total Return – 2004 through YTD 2007
Source: Thomson Financial – data shown through September 18, 2007
Pepco Holdings Total Shareholder Return vs. S&P 400 MidCap Electrics and S&P 500
80
90
100
110
120
130
140
150
160
170
180
190
12/31 /032/29/044/30/046/30/048/31/04
10/31 /0412/31 /04
2/28/054/30/056/30/058/31/05
10/31 /0512/31 /05
2/28/064/30/066/30/068/31/06
10/31 /0612/31 /06
2/28/074/30/076/30/078/31/07To
tal S
hare
hold
er R
etur
n (In
dexe
d to
100
at 1
2/31
/03)
POM (+62.96%) S&P 400 MidCap Electrics (+41.35%) S&P 500 (+46.25%)
5
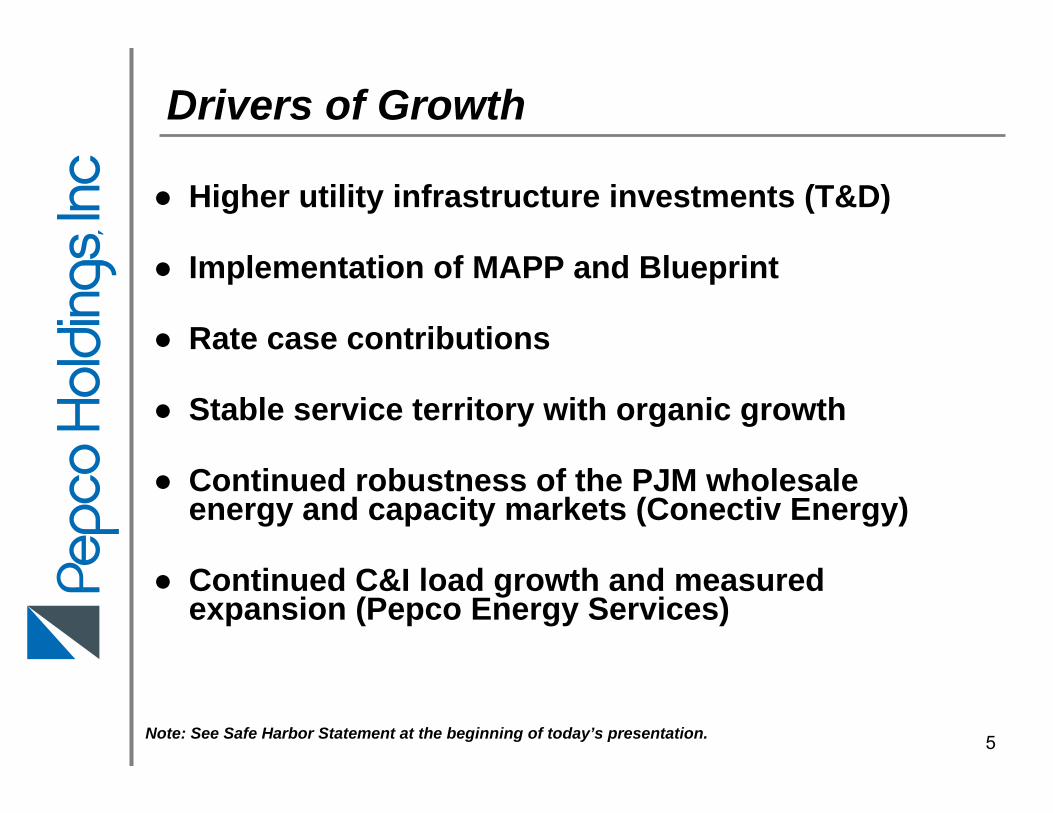
● Higher utility infrastructure investments (T&D)
● Implementation of MAPP and Blueprint
● Rate case contributions
● Stable service territory with organic growth
● Continued robustness of the PJM wholesale energy and capacity markets (Conectiv Energy)
● Continued C&I load growth and measured expansion (Pepco Energy Services)
Drivers of Growth
Note: See Safe Harbor Statement at the beginning of today’s presentation.

6
Power Delivery - Business Overview
Commercial 46%
Diversified Customer Mix*
Residential 35%
Government 10%
Industrial 9%
* Based on 2006 MWh Sales
Regulatory Diversity*
District of Columbia 23%
New Jersey 20%Virginia 1%
Delaware 17%
Maryland 39%
Combined Service Territory

7
PHI’s Proposed Mid-Atlantic Power Pathway (MAPP) Project
• PJM has recommended the 500kV portion of the project be approved by the PJM Board
• PJM still evaluating the 230kV portion of the project
• Decision expected at the next PJM Board meeting after receiving comments from stakeholders
• 230 mile, 500 kV line originating in northern Virginia, crossingMaryland, traveling up the Delmarva Peninsula and into southern New Jersey
• Significant 230 kV lines that support Maryland, Delaware and New Jersey
• Cost estimate as proposed - $1.2 billion; completion by 2014
• ROE authorized in FERC formula rate settlement – 11.3% for new facilities
Status of the MAPP Project
500kV
230kV
8
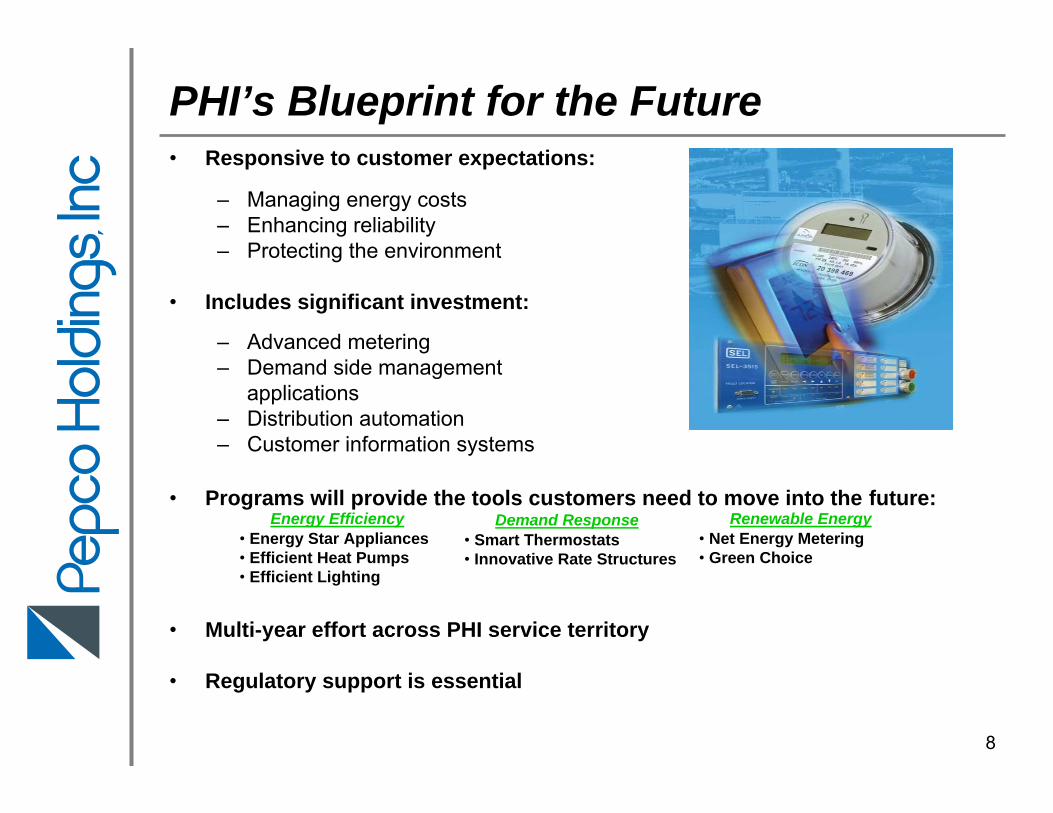
PHI’s Blueprint for the Future• Responsive to customer expectations:
– Managing energy costs– Enhancing reliability– Protecting the environment
• Includes significant investment:
– Advanced metering– Demand side management
applications– Distribution automation– Customer information systems
• Programs will provide the tools customers need to move into the future:
• Multi-year effort across PHI service territory
• Regulatory support is essential
Energy Efficiency• Energy Star Appliances• Efficient Heat Pumps• Efficient Lighting
Demand Response• Smart Thermostats• Innovative Rate Structures
Renewable Energy• Net Energy Metering• Green Choice

9
Power Delivery –Infrastructure Investment Strategy
Construction Forecast *Construction Forecast *
* The MAPP and Blueprint construction costs reflected above are preliminary estimates and are not included aspart of the projection of construction expenditures reflected in PHI’s filed Forms 10-K and 10-Q.
Note: See Safe Harbor Statement at the beginning of today’s presentation.
5 Year(Dollars in Millions) 2007 2008 2009 2010 2011 TotalsDistribution: Customer Driven (new service connections, 175$ 156$ 161$ 162$ 168$ 822$ meter installations, highway relocations) Reliability 109 167 151 141 181 749 (facility replacements/upgrades for system reliability) Load 98 72 59 92 122 443 (new/upgraded facilities to support load growth)
Transmission 156 117 73 58 50 454
Gas Delivery 19 20 20 21 20 100
Information Technology 16 17 17 17 17 84 Corporate Support and Other 8 11 8 13 15 55
Total Power Delivery 581$ 560$ 489$ 504$ 573$ 2,707$
Mid-Atlantic Power Pathway (MAPP) 4 52 186 215 233 690
Blueprint - 62 148 157 142 509
Total Including MAPP and Blueprint 585$ 674$ 823$ 876$ 948$ 3,906$
10
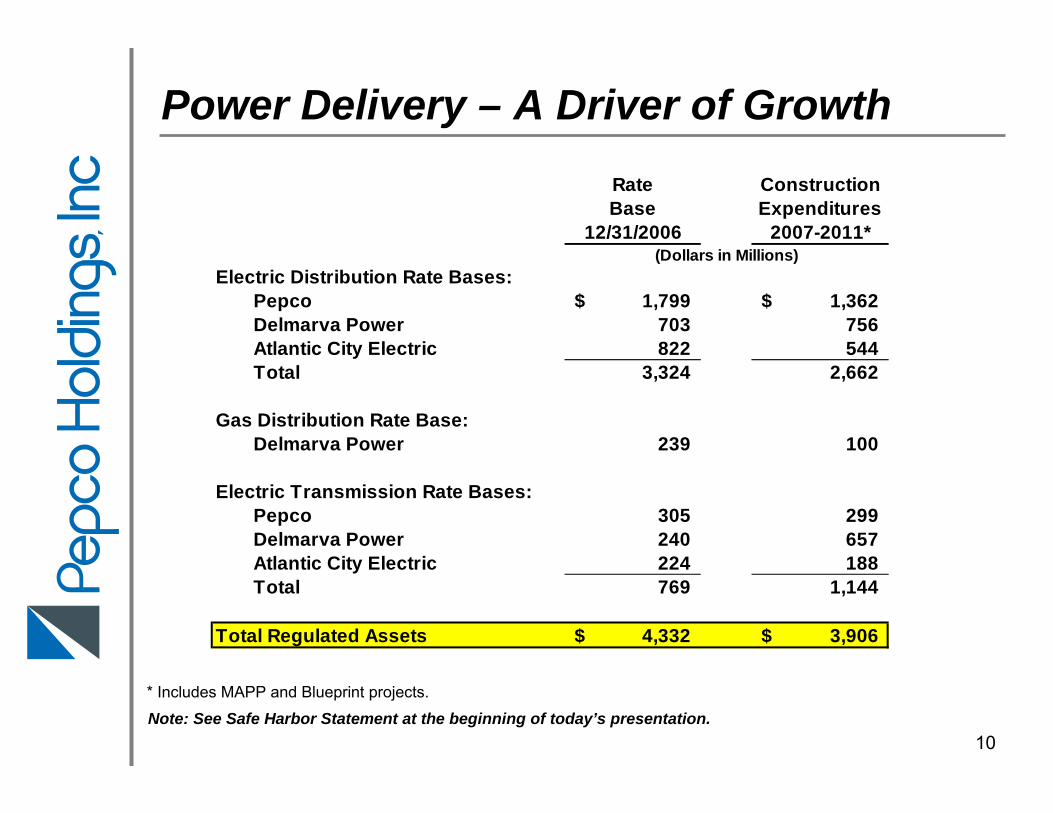
Power Delivery – A Driver of Growth
Note: See Safe Harbor Statement at the beginning of today’s presentation.
Rate ConstructionBase Expenditures
12/31/2006 2007-2011*
Electric Distribution Rate Bases:Pepco 1,799$ 1,362$ Delmarva Power 703 756 Atlantic City Electric 822 544 Total 3,324 2,662
Gas Distribution Rate Base:Delmarva Power 239 100
Electric Transmission Rate Bases:Pepco 305 299 Delmarva Power 240 657 Atlantic City Electric 224 188 Total 769 1,144
Total Regulated Assets 4,332$ 3,906$
(Dollars in Millions)
* Includes MAPP and Blueprint projects.

11
Distribution Rate Case Status
(Dollars in Millions) Pending
DPL DPL Pepco PepcoGas Electric Electric ElectricDE MD MD Total DC (3)
Rate Base N/A $267 $896 $980 Equity Ratio 46.90% 48.63% 47.69% 46.55%
ROE 10.25% 10.00% 10.00% 10.75% (4)
BSA No (1) Yes Yes Yes
Rate Increase $9.0 (2) $14.9 $10.6 $34.5 $43.5 (4)
Depreciation Expense Reduction $2.1 $0.9 $30.7 $33.7
Effective Date 4/1/2007 6/16/2007 6/16/2007
Orders Received
Notes:
(1) Parties to the settlement are participating in a generic statewide proceeding initiated by the Commission for the purpose of investigating decoupling mechanisms for electric and gas distribution utilities.
(2) Includes the $2.5 million increase that was put into effect on November 1, 2006.
(3) Pepco’s position.
(4) Requested with adoption of the BSA; without the BSA, the requested ROE is 11.0% and the revenue requirement is $47.9 million.

12
Return to more stable regulatory and legislative environments in MD and DE
Reasonable outcome in settled Delmarva Power gas distribution case in DE
Orders received in Pepco and Delmarva Power MD cases, rate increases approved and Bill Stabilization Adjustment mechanism adopted
DC distribution rate case on track for resolution in Sept. 2007
Annual formula rate process in place for transmission rates, newinvestments earn 11.3% ROE
Filings made in DE, MD and DC to implement PHI Blueprint
Transition to competitive default supply markets complete in MD, DC, DE and NJ
Reasonable default service deferral programs in place in MD and DE
Regulatory Summary
Note: See Safe Harbor Statement at the beginning of today’s presentation.
13
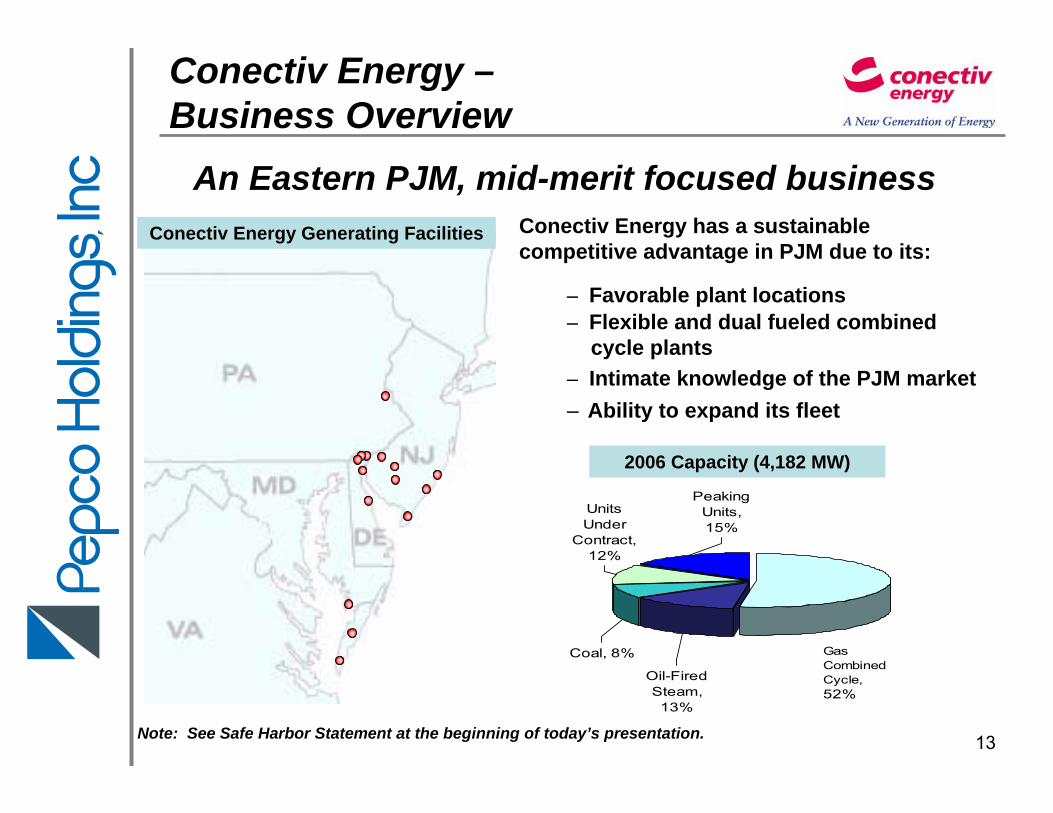
Conectiv Energy –Business Overview
Conectiv Energy Generating Facilities
An Eastern PJM, mid-merit focused business
2006 Capacity (4,182 MW)
Conectiv Energy has a sustainable competitive advantage in PJM due to its:
– Favorable plant locations– Flexible and dual fueled combined
cycle plants– Intimate knowledge of the PJM market– Ability to expand its fleet
Units Under
Contract, 12%
Coal, 8%
Oil-Fired Steam, 13%
Gas Combined Cycle, 52%
Peaking Units, 15%
Note: See Safe Harbor Statement at the beginning of today’s presentation.
14
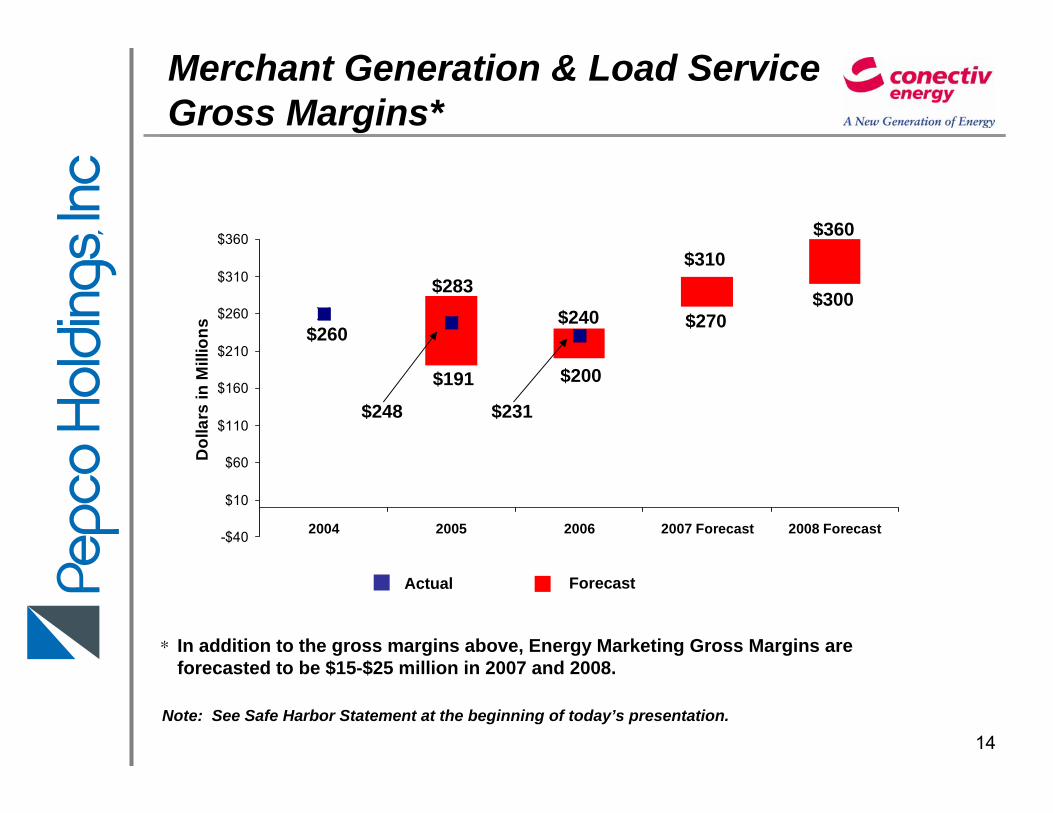
Merchant Generation & Load ServiceGross Margins*
Note: See Safe Harbor Statement at the beginning of today’s presentation.
-$40
$10
$60
$110
$160
$210
$260
$310
$360
2004 2005 2006 2007 Forecast 2008 Forecast
Dol
lars
in M
illio
ns
$283
$360$310
$240$300
$200$191
$231$248
$260
Actual Forecast
$270
In addition to the gross margins above, Energy Marketing Gross Margins are forecasted to be $15-$25 million in 2007 and 2008.
*
15
Pepco Energy Services –Business Overview
PES RetailElectric Supply Markets
Independent System Operator
PJM
New York ISO
New England ISO
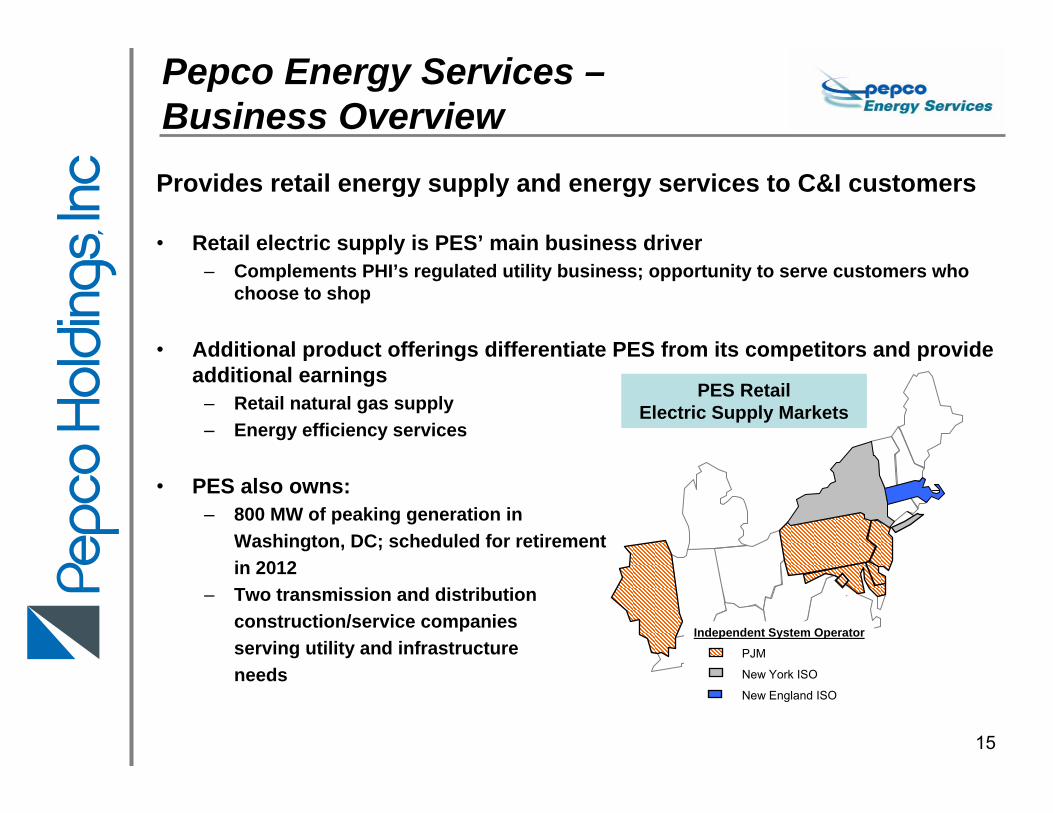
Provides retail energy supply and energy services to C&I customers
• Retail electric supply is PES’ main business driver– Complements PHI’s regulated utility business; opportunity to serve customers who
choose to shop
• Additional product offerings differentiate PES from its competitors and provide additional earnings
– Retail natural gas supply– Energy efficiency services
• PES also owns:– 800 MW of peaking generation in
Washington, DC; scheduled for retirementin 2012
– Two transmission and distribution construction/service companies serving utility and infrastructure needs
PES RetailElectric Supply Markets

16
PHI - Financial ObjectivesDeliver Value
Achieve average annual utility earnings growth of at least 4%Continue growth of competitive energy businesses to supplement utility earningsGrow dividend commensurate with utility earnings growth
Strengthen Financial PositionAchieve and maintain an equity ratio in mid-40% area by the end of 2008Achieve and maintain a PHI corporate credit rating of BBB+/Baa1 or higherMaintain liquidity position to provide financial flexibility
Note: See Safe Harbor Statement at the beginning of today’s presentation.

17
● Stable Earnings Base - Derived primarily from regulated T&D utility businesses
● Earnings Growth Potential - Driven by T&D utility infrastructure investments, constructive regulatory outcomes and competitive energy businesses
● Secure Dividend - Current dividend yield is 23% higher than the average dividend yield for companies in the S&P Electric Utilities index*
Why Invest in PHI?
Note: See Safe Harbor Statement at the beginning of today’s presentation.* Pricing data as of September 17, 2007

Positioned for Success Today…
Building for Success Tomorrow

19
Appendix

20
Preliminary Timeline
PHI Mid-Atlantic Power Pathway
● Most of the line would be built either on, or parallel to, existing right of way● 52 miles would use existing towers ● Much of the route is along established transmission corridors through
relatively rural areas
Note: See Safe Harbor Statement at the beginning of today’s presentation.
21
PHI Mid-Atlantic Power Pathway
Note: See Safe Harbor Statement at the beginning of today’s presentation.
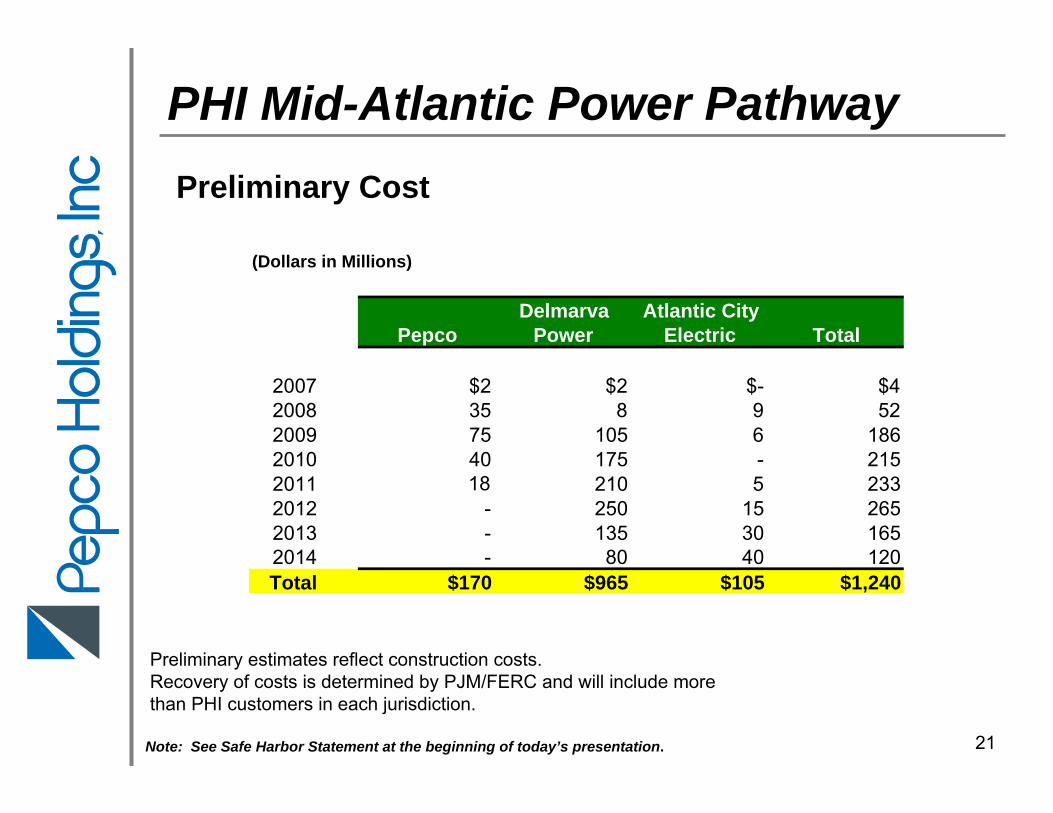
Preliminary Cost
(Dollars in Millions)
Delmarva Atlantic CityPepco Power Electric Total
2007 $2 $2 $- $42008 35 8 9 522009 75 105 6 1862010 40 175 - 2152011 18 210 5 2332012 - 250 15 2652013 - 135 30 1652014 - 80 40 120Total $170 $965 $105 $1,240
Preliminary estimates reflect construction costs.Recovery of costs is determined by PJM/FERC and will include morethan PHI customers in each jurisdiction.

22
● “Blueprint for the Future” filed in Delaware, Maryland and the District of Columbia
● Filing in New Jersey later this year in conjunction with the energy master plan process
● In Delaware, an order was issued March 20 opening a proceeding to consider the filing● Application includes demand-side management programs, advanced metering and
distribution automation● Workshop meetings held ● Docket number 07-28
● In Maryland, an order was issued on June 8 for a “two track approach”● Established a Pepco/DPL collaborative on near-term DSM initiatives● Created a state-wide collaborative on advanced metering and DSM initiatives● Initial reports have been filed with the commission on both collaborations● Hearing held on July 25 for Pepco/DPL collaborative; decision pending● Case number 9111● Maryland distribution rate case orders issued July 19 included the approval of a
decoupling mechanism for Pepco and DPL
● In the District of Columbia, an order was issued on April 23 opening a proceeding to consider the filing● Initial comments received August 10 ● Case number 1056
PHI Blueprint for the Future - Status
Note: See Safe Harbor Statement at the beginning of today’s presentation.
23
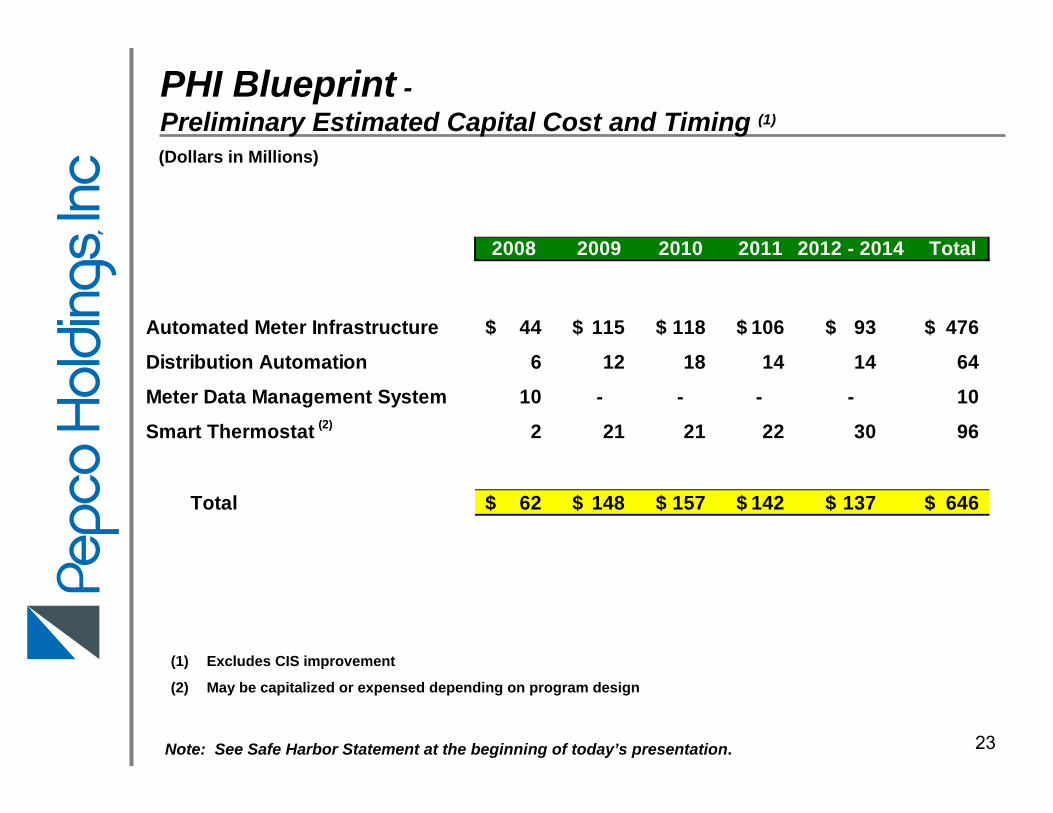
PHI Blueprint -Preliminary Estimated Capital Cost and Timing (1)
Note: See Safe Harbor Statement at the beginning of today’s presentation.
2008 2009 2010 2011 2012 - 2014 Total
Automated Meter Infrastructure 44$ 115$ 118$ 106$ 93$ 476$
Distribution Automation 6 12 18 14 14 64
Meter Data Management System 10 - - - - 10
Smart Thermostat (2) 2 21 21 22 30 96
Total 62$ 148$ 157$ 142$ 137$ 646$
(Dollars in Millions)
(1) Excludes CIS improvement
(2) May be capitalized or expensed depending on program design
24
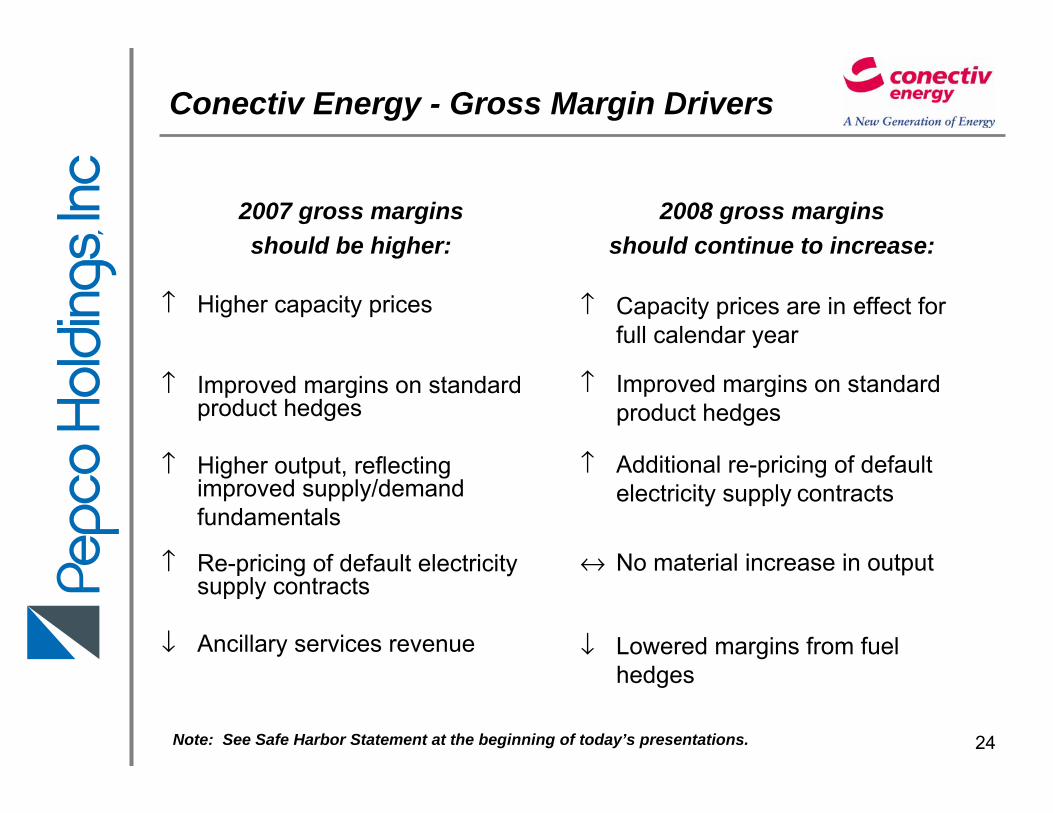
Conectiv Energy - Gross Margin Drivers
2008 gross marginsshould continue to increase:
↑ Capacity prices are in effect for full calendar year
↑ Improved margins on standard product hedges
↑ Additional re-pricing of default electricity supply contracts
↔ No material increase in output
↓ Lowered margins from fuel hedges
2007 gross marginsshould be higher:
↑ Higher capacity prices
↑ Improved margins on standard product hedges
↑ Higher output, reflecting improved supply/demandfundamentals
↑ Re-pricing of default electricity supply contracts
↓ Ancillary services revenue
Note: See Safe Harbor Statement at the beginning of today’s presentations.
25
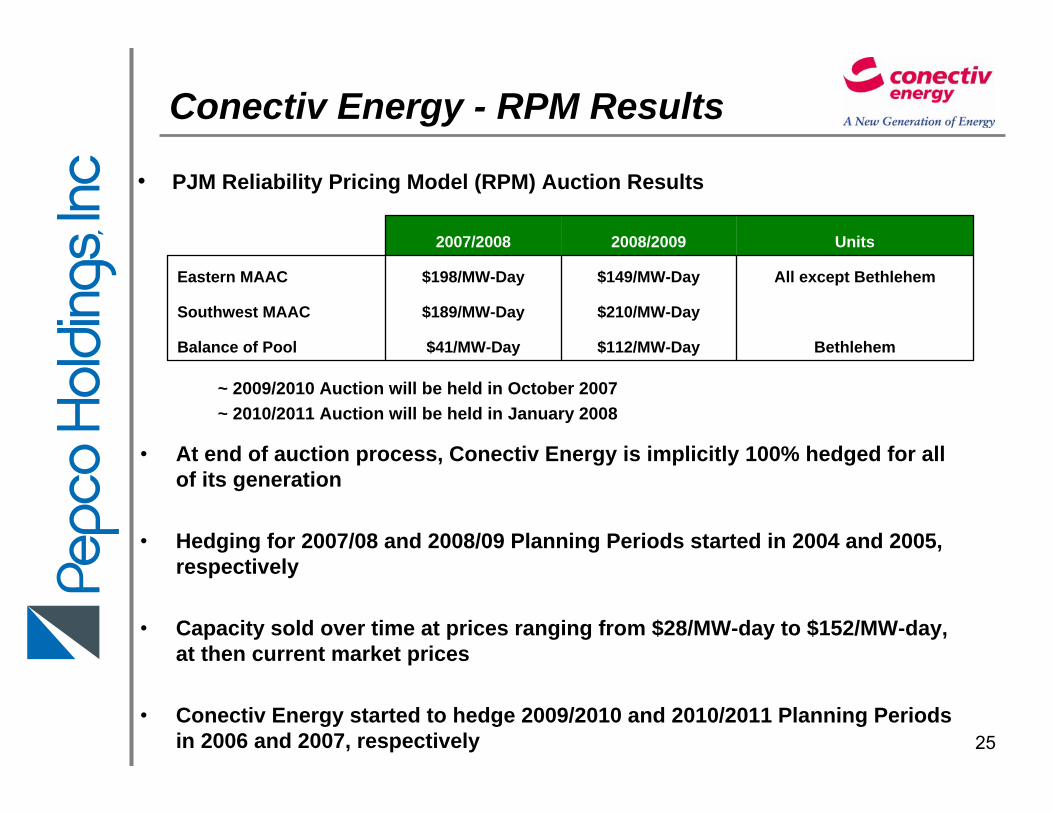
Conectiv Energy - RPM Results
~ 2009/2010 Auction will be held in October 2007~ 2010/2011 Auction will be held in January 2008
• At end of auction process, Conectiv Energy is implicitly 100% hedged for all of its generation
• Hedging for 2007/08 and 2008/09 Planning Periods started in 2004 and 2005, respectively
• Capacity sold over time at prices ranging from $28/MW-day to $152/MW-day, at then current market prices
• Conectiv Energy started to hedge 2009/2010 and 2010/2011 Planning Periods in 2006 and 2007, respectively
• PJM Reliability Pricing Model (RPM) Auction Results
Bethlehem$112/MW-Day$41/MW-DayBalance of Pool
$210/MW-Day$189/MW-DaySouthwest MAAC
All except Bethlehem$149/MW-Day$198/MW-DayEastern MAAC
Units2008/20092007/2008
26
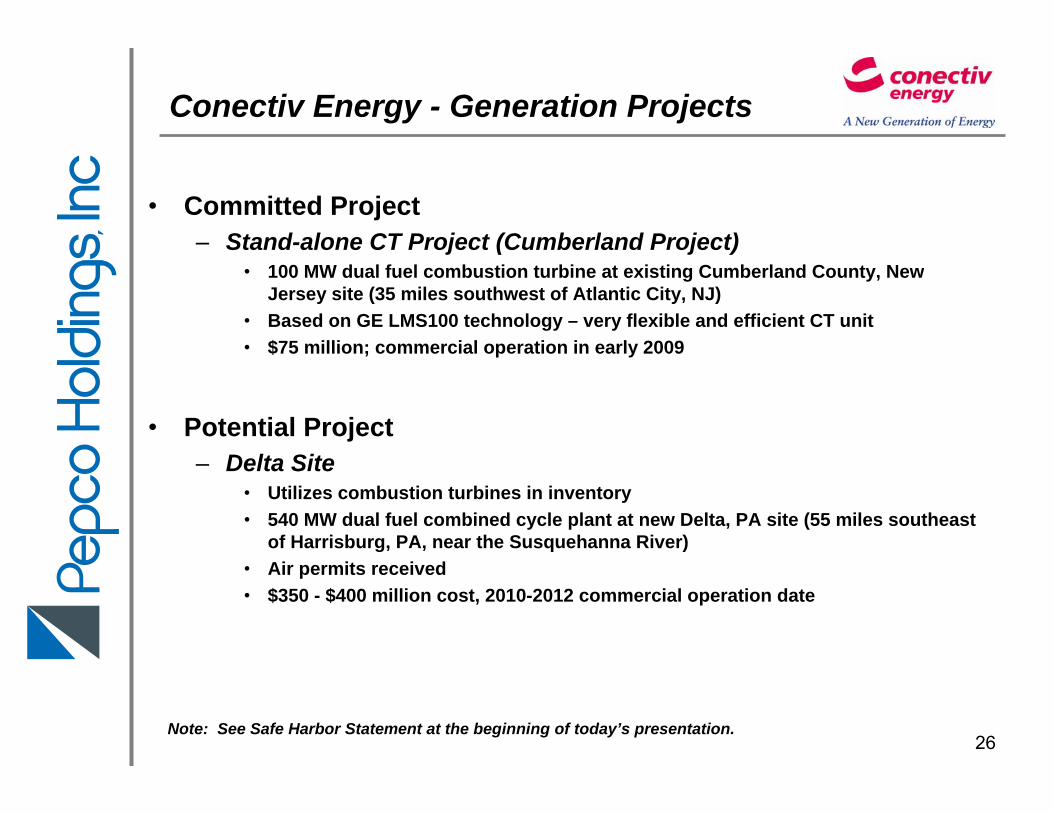
Conectiv Energy - Generation Projects
Note: See Safe Harbor Statement at the beginning of today’s presentation.
• Committed Project– Stand-alone CT Project (Cumberland Project)
• 100 MW dual fuel combustion turbine at existing Cumberland County, New Jersey site (35 miles southwest of Atlantic City, NJ)
• Based on GE LMS100 technology – very flexible and efficient CT unit• $75 million; commercial operation in early 2009
• Potential Project– Delta Site
• Utilizes combustion turbines in inventory• 540 MW dual fuel combined cycle plant at new Delta, PA site (55 miles southeast
of Harrisburg, PA, near the Susquehanna River) • Air permits received• $350 - $400 million cost, 2010-2012 commercial operation date

27
Conectiv Energy –Projected Capital Expenditures
Note: See Safe Harbor Statement at the beginning of today’s presentation.
$15$19$16$15$13"Base" Amount
$93
4612
173
2008
$175$90$39$53Total
-147
-61
415
24-
Growth- New Combustion Turbine- Delta Site (Total Cost - $350)
85
10-
13
142
Environmental- DE Multi-Pollutant *- Other
2011201020092007Dollars in Millions
* Current capital cost estimates range from $50M - $80M.
28
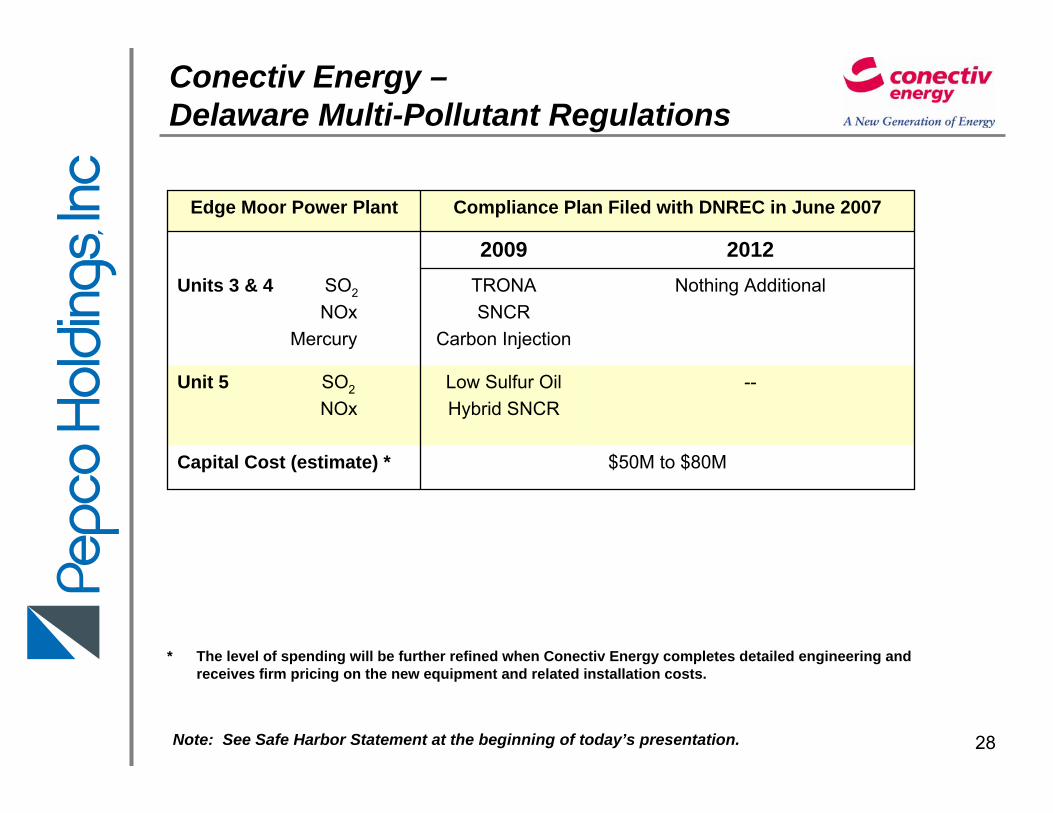
Conectiv Energy –Delaware Multi-Pollutant Regulations
$50M to $80MCapital Cost (estimate) *
--Low Sulfur OilHybrid SNCR
Unit 5 SO2
NOx
Nothing AdditionalTRONASNCR
Carbon Injection
Units 3 & 4 SO2
NOxMercury
20122009
Compliance Plan Filed with DNREC in June 2007Edge Moor Power Plant
* The level of spending will be further refined when Conectiv Energy completes detailed engineering and receives firm pricing on the new equipment and related installation costs.
Note: See Safe Harbor Statement at the beginning of today’s presentation.
29
0
5
10
15
20
25
30
2004 2005 2006 2007 YTD
13
3
9
13
19
8
12
0
5
10
15
20
2004 2005 2006 2007 2008 2009 2010
BacklogDelivered
0
1,000
2,000
3,000
4,000
Q22005
Q32005
Q42005
Q12006
Q22006
Q32006
Q42006
Q12007
Q22007
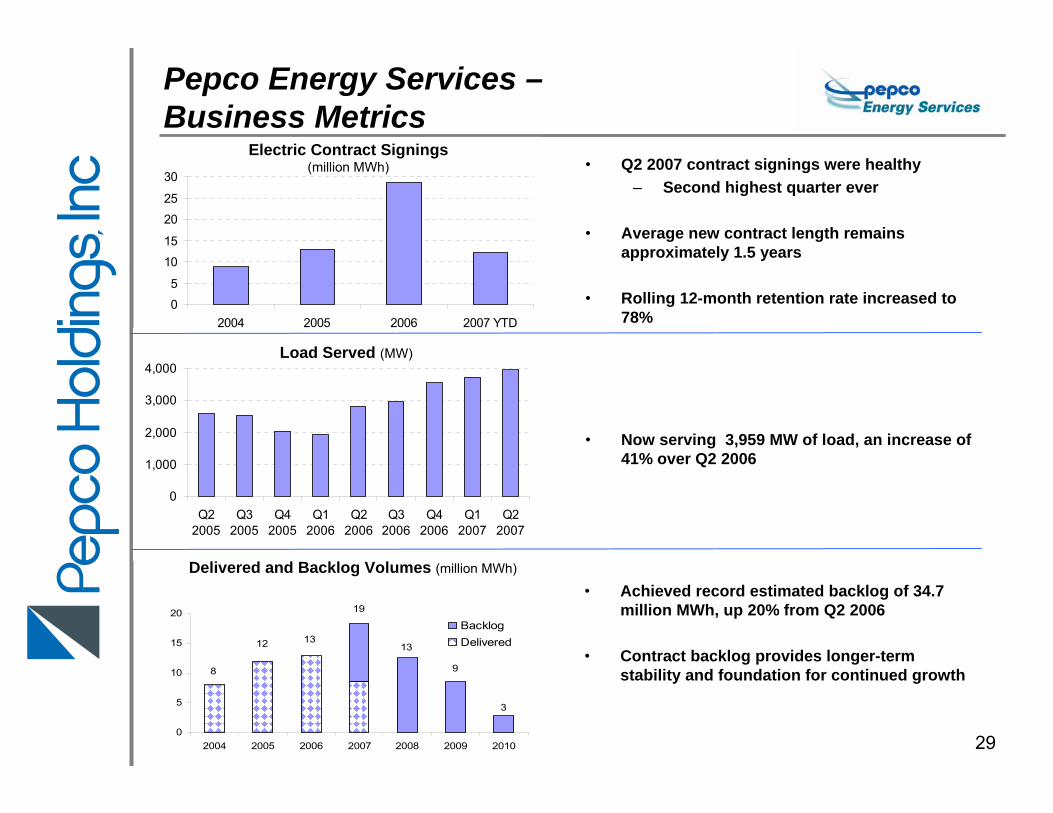
• Q2 2007 contract signings were healthy– Second highest quarter ever
• Average new contract length remains approximately 1.5 years
• Rolling 12-month retention rate increased to 78%
• Now serving 3,959 MW of load, an increase of 41% over Q2 2006
Electric Contract Signings(million MWh)
Load Served (MW)
• Achieved record estimated backlog of 34.7 million MWh, up 20% from Q2 2006
• Contract backlog provides longer-term stability and foundation for continued growth
Pepco Energy Services –Business Metrics
Delivered and Backlog Volumes (million MWh)
13
3
9
13
19
8
12
0
5
10
15
20
2004 2005 2006 2007 2008 2009 2010
BacklogDelivered

30
$116 $156 $117$73 $58 $50
$365
$425$443
$416 $446$523
$26
$74 $104
$50$99
$185
$0
$100
$200
$300
$400
$500
$600
$700
$800
2006 Actual 2007 2008 2009 2010 2011
Mill
ions
Transmission Distribution Competitive
Construction Expenditures (1)
Note: See Safe Harbor Statement at the beginning of today’s presentation.
$655 $664
$539$603
$758
PHI Construction Expenditures –Driver of Earnings Growth
$507
Excludes Mid-Atlantic Power Pathway (MAPP) and Blueprint projects. Includes increased capital spending approved in the 1st quarter 2007 for new combustion turbine power plant at Conectiv Energy.
Construction expenditures include cash and accruals.
(2)
(1)
(2)

31
$603$539
$664$655
$507
$0
$100
$200
$300
$400
$500
$600
$700
$800
$900
2006 Actual 2007 2008 2009 2010
Mill
ions
Net Cash from Operating Activities vs.Construction Expenditures and Dividends
$600 - $700 (2)
Net Cash from Operations Dividends (3)
$594(1)
(1) Adjusted cash from operations. See additional appendix slide for reconciliation.
(2) Cash from operations reflects various inputs, including regulatory and energy price assumptions that impact the utilities and competitive energy businesses.
(3) Dividend amount is based on the current annualized dividend rate of $1.04 per share. The dividend level is reviewed quarterly by PHI’s Board of Directors.
NOTE: See Safe Harbor Statement at the beginning of today’s presentation.
$200 $200 $200 $200 $200
Construction Expenditures
$700 - $800 (2)

32
2007 2006 2007 2006
$0.41 $0.45 Power Delivery $0.41 $0.45
$0.11 $0.10 Conectiv Energy $0.11 $0.06
$0.07 $0.07 Pepco Energy Services $0.07 $0.09
$0.14 $0.15 Other Non-Regulated $0.14 $0.15
($0.17) ($0.21) Corporate & Other ($0.17) ($0.21)
Actual Earnings Per Share Excluding Special Items
$0.56 $0.54$0.56 $0.56 Total PHI
Year-to-Date June 30,
Year-to-Date June 30,
Management believes the special items are not representative of the Company’s ongoing business operations. See additional appendix slide for details.
PHI Financial Performance
Note:

33
Power Delivery• Higher kWh sales due to weather 0.09• Network Transmission Rate True-up (0.06)• Operation and Maintenance Expense (0.04)• Standard Offer Service Margin (0.02)• Other, net (0.01)
Conectiv Energy• Merchant Generation & Load Service 0.06• Energy Marketing 0.02• Operating Costs, net (0.03)
Pepco Energy Services• Retail Energy Supply (0.04)• Energy Services 0.02
Other, net 0.03
June 2007 YTD Financial Performance - Drivers
June 2006 YTD Earnings Per Share* $0.54
June 2007 YTD Earnings Per Share $0.56
* Excluding special items. See additional appendix slide for details.
34
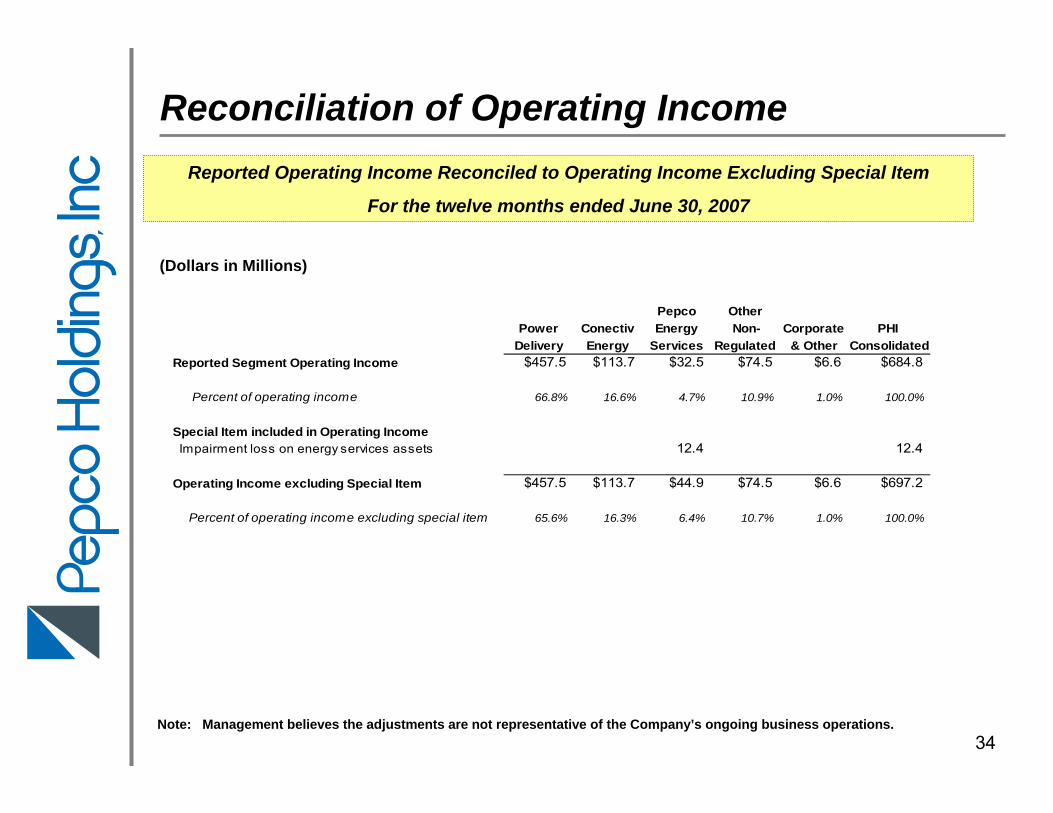
Reconciliation of Operating IncomeReported Operating Income Reconciled to Operating Income Excluding Special Item
For the twelve months ended June 30, 2007
Pepco OtherPower Conectiv Energy Non- Corporate PHI
Delivery Energy Services Regulated & Other ConsolidatedReported Segment Operating Income $457.5 $113.7 $32.5 $74.5 $6.6 $684.8
Percent of operating income 66.8% 16.6% 4.7% 10.9% 1.0% 100.0%
Special Item included in Operating Income Impairment loss on energy services assets 12.4 12.4
Operating Income excluding Special Item $457.5 $113.7 $44.9 $74.5 $6.6 $697.2
Percent of operating income excluding special item 65.6% 16.3% 6.4% 10.7% 1.0% 100.0%
(Dollars in Millions)
Note: Management believes the adjustments are not representative of the Company’s ongoing business operations.
35
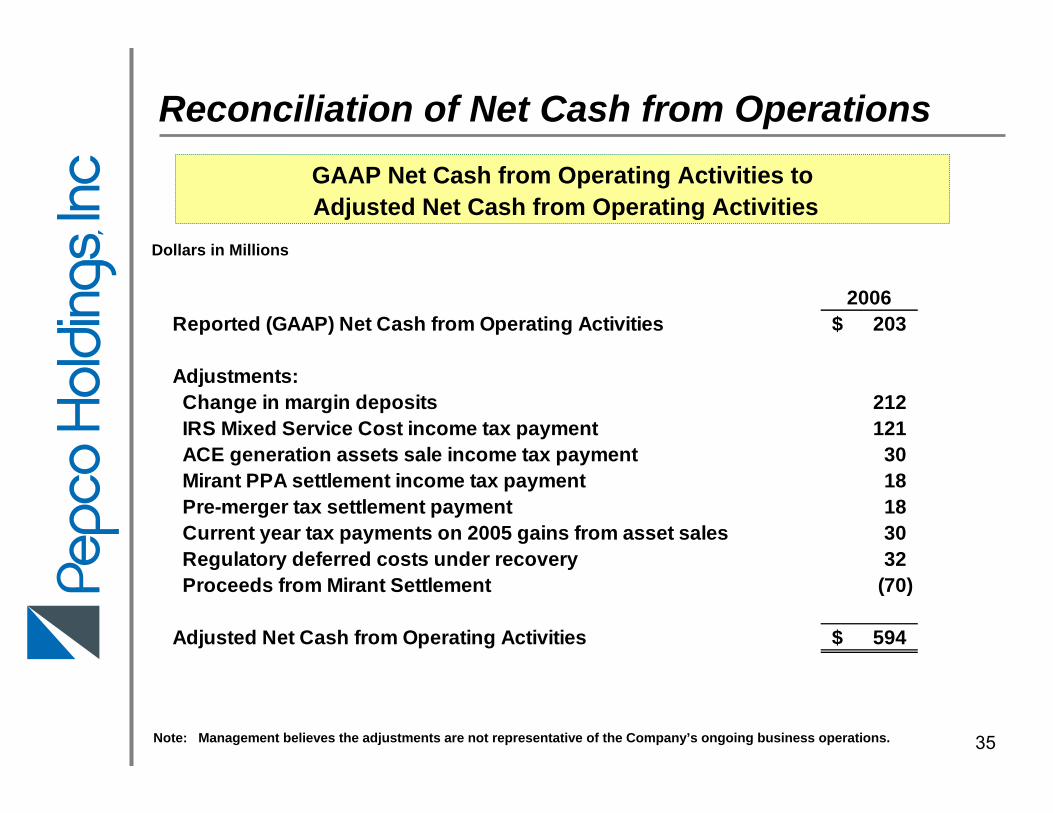
Reconciliation of Net Cash from Operations
2006Reported (GAAP) Net Cash from Operating Activities 203$
Adjustments: Change in margin deposits 212 IRS Mixed Service Cost income tax payment 121 ACE generation assets sale income tax payment 30 Mirant PPA settlement income tax payment 18 Pre-merger tax settlement payment 18 Current year tax payments on 2005 gains from asset sales 30 Regulatory deferred costs under recovery 32 Proceeds from Mirant Settlement (70)
Adjusted Net Cash from Operating Activities 594$
GAAP Net Cash from Operating Activities toAdjusted Net Cash from Operating Activities
Note: Management believes the adjustments are not representative of the Company’s ongoing business operations.
Dollars in Millions

36Note: Management believes the special items are not representative of the Company’s ongoing business operations.
Reconciliation of Earnings Per Share
2007 2006
Reported (GAAP) Earnings per Share 0.56$ 0.56$
Special Items:
Gain on disposition of interest in a co-generation facility - (0.04)
Impairment loss on energy services assets - 0.02
Net Earnings per Share, excluding Special Items 0.56$ 0.54$
Six Months EndedJune 30,
GAAP EPS to EPS Excluding Special Items