perf: performance of governance - eupan · • to study and discuss concrete performance indicators...
TRANSCRIPT
1
PERF: Performance of Governance
Results of the 2011 spring semester
v1.0 (June 2011)
MINISTRY OF PUBLIC
ADMINISTRATION AND JUSTICE
2
Researchers and editors of the report
Dr. Krisztián Kádár, senior advisor, Ministry of Public Administration and Justice
Email: [email protected]
Web: http://www.kormany.hu/en/ministry-of-public-administration-and-justice
The Ministry of Public Administration and Justice is responsible for the harmonisation of government work, for
the development of central and regional public administration – which forms the basis of the functioning of the
Hungarian state – and for quality and staffing policy related to public administration. Among the Ministry’s
priority tasks are the preparation, coordination and implementation of the Government’s justice policy.
Norbert Kiss, assistant professor, Corvinus University of Budapest, Institute of Management,
Performance Management Research Centre
Email: [email protected]
Web: http://mgmt.uni-corvinus.hu
Éva Révész, assistant professor, Corvinus University of Budapest, Institute of Management,
Performance Management Research Centre
Email: [email protected]
Web: http://mgmt.uni-corvinus.hu
The Performance Management Research Centre is a unit of the Corvinus University of Budapest, Faculty of
Business Administration, aiming at enhancing multidisciplinary research on organizational performance.
Research activities of the Centre are focused on planning, measuring, reporting and evaluating organizational
performance both in the private and public sector.

3
Content
1. Introduction ..................................................................................................................................... 5
2. Using performance indicators in governance ................................................................................. 6
3. The process: what happened in this semester? .............................................................................. 8
4. Capacity to innovate ...................................................................................................................... 10
4.1. What is innovation in the public sector and public administration? .................................... 10
4.2. Aims of measurement ........................................................................................................... 11
Relationship with other facets ...................................................................................................... 11
Factors enhancing innovation capacity ......................................................................................... 13
4.3. Appearance and use of the facet .......................................................................................... 15
Objectives about public sector innovation .................................................................................... 15
Objectives about developing innovation capacity ........................................................................ 16
4.4. Indicators ............................................................................................................................... 17
4.5. Best practice cases ................................................................................................................ 19
4.6. Conclusions, recommendations ............................................................................................ 20
5. Openness of government .............................................................................................................. 22
5.1. Aims of measurement ........................................................................................................... 22
Relationship with other facets ...................................................................................................... 23
Openness in the PERF and other frameworks ............................................................................... 24
5.2. Appearance and use of the facet .......................................................................................... 25
5.3. Indicators ............................................................................................................................... 26
5.4. Best practice case .................................................................................................................. 28
5.5. Conclusions, recommendations ............................................................................................ 29
6. Motivation of civil servants ........................................................................................................... 30
6.1. Aims of measurement ........................................................................................................... 30
Relationship with other facets ...................................................................................................... 30
Understanding motivation of civil servants .................................................................................. 31
6.2. Appearance and use of the facet .......................................................................................... 32
6.3. Indicators ............................................................................................................................... 33
6.4. Best practice case .................................................................................................................. 34
6.5. Conclusions, recommendations ............................................................................................ 35
7. Client satisfaction .......................................................................................................................... 36
7.1. Aims of measurement ........................................................................................................... 36
Relationship with other facets ...................................................................................................... 37

4
Understanding client satisfaction .................................................................................................. 38
7.2. Appearance and use of the facet .......................................................................................... 39
7.3. Indicators ............................................................................................................................... 39
7.4. Best practice case .................................................................................................................. 39
7.5. Conclusions, recommendations ............................................................................................ 41
8. Reducing administrative burdens .................................................................................................. 42
8.1. Aims of measurement ........................................................................................................... 42
Relationship with other facets ...................................................................................................... 43
Categorizing administrative costs and burdens ............................................................................ 44
8.2. Appearance and use of the facet .......................................................................................... 46
8.3. Indicators ............................................................................................................................... 47
8.4. Best practice cases ................................................................................................................ 48
8.5. Conclusions, recommendations ............................................................................................ 48
9. Annexes ......................................................................................................................................... 50
5
1. Introduction
In the recent past, under the Austrian Presidency the Performance Indicator Initiative was set up to
build a commonly defined system of indicators to assess the performance of public administrations
of the Member States. A report was produced containing information on 780 indicators submitted by
11 Member States. Those indicators measured essentially vertical governance by looking at central
operational areas of public administration.
Under the Swedish Presidency it was decided to continue on the same road. However, it has been
acknowledged that there are no universal answers, but similar basic questions and problems making
performance assessment a rich field of European experience worth harvesting for the benefit of all
The base of the PERF project was established during the Spanish Presidency, which conducted the
necessary preparatory works and levelled the field for an effective execution of the project. In June
2010, Belgium succeeded Spain in holding the rotating presidency of the Council of the European
Union. The Belgian presidency continued to build upon the work of its predecessor. The analytical
table was developed as the main instrument for the gathering and analyzing of potentially useful
indicators.
Reconfirming its objectives, the PERF as an inventory of indicators:
• should trigger interesting discussions in the EUPAN network on valuable performance indicators
and hence, about what is expected from public governance;
• should be seen as a laboratory of ideas on performance indicators;
• should be an input for innovation in national measurement practice through transfer of good
ideas;
• should be a starting point for EUPAN members to identify common concerns and performance
indicators that might lead to comparison on a voluntary basis.
The aim of the project is not to do the actual measurement. It is about performance indicators, not
about data gathering, and it is up to the members how they use the experience that can be learnt
from other members. At the EUPAN discussion about the EU2020 strategy it became clear that
implementation of the EU2020 strategy and achievement of its goals will greatly depend on how
public administrations perform all over Europe. The PERF project, by setting up a Wikipedia page on
the EUPAN website, providing a practical framework for understanding the elements of performance
of governance, and listing performance indicators, can contribute to achieving a better performing
public administration. The framework is ready, so the work can continue by sharing individual
contributions via the website and thus enhancing mutual learning opportunities.
6
2. Using performance indicators in governance
The general aim of performance measurement is to support decision making: evidence-based policy-
making relies on performance information. One of the most important questions in performance
measurement is how to design measurement systems in order to be fit for use. At this point, an other
crucial question arises: what can performance information be used for?
Based on performance measurement literature1, different purposes require different performance
measurement systems. The key stakeholders (managers of public organizations, politicians, and
citizens) use performance information in several ways. There are two main approaches to uses of
performance measures: internal and external. Internal use focuses mainly on managerial purposes
(e.g. control, motivate), while external use include the expectations of politicians and citizens. Van
Dooren (2006) identified three main functions of performance measurement:
1. Research and learning function
In this case performance information is collected in order to find out what works, either for
internal, or external use of performance measures. The central question here is how can policy (at
sector level) and management (at organizational level) be improved? What should we do
differently? Performance information can be used for evaluation of current performance as well
as for learning why and what is working or not. Typical performance measurement tools
supporting the research function are, for example, policy making and strategic planning, policy
evaluation, evidence-based policy initiatives.
2. Internal managerial function
In this case performance information serves as “identifying and rewarding or sanctioning well
performing or underperforming institutions or public servants” (Van Dooren, 2006, p. 166).
Managers use performance indicators in order to control the organization, motivate staff and
other stakeholders and make financial decisions (e.g. budgeting). For this function management
tools as performance contracts, performance-related pay, performance budgeting can be applied.
3. Accountability function
The main proposition here is that the public sector should be accountable to the citizens and
politicians. This mainly means external use of performance indicators since the expectations and
pressure come from outside of the organization. Applications of this function include publishing
results to the general public (e.g. citizens, journalists), creating rankings, or setting up citizen
charters. Pressure for accountability can be instituted by the political system, too. Centrally and
top-down determined performance targets are examples of performance measurement tools for
this latter function.
The functions and purposes of using performance information in the public administration can be
summarized as follows:
1 This section relies on Robert D. Behn’s article „Why measure performance? Different purposes require
different measures” (in: Public Administration Review, Vol. 63, Issue 5, 2003, p 585-606), Wouter Van Dooren’ s
thesis „Performance measurement in the Flemish public sector: a supply and demand approach (Catholic
University of Leuven, 2006), and the book of Van Dooren, Bouckaert, and Halligan “Performance management
in the public sector” (Routledge, 2010).
7
Functions of performance information
Internal – external approach
Purposes
Research and learning function
Internal (managers) and
external (policy makers)
Evaluation (what) and learning (how)
Internal managerial function
Internal (managers) Control, motivate, making financial decisions
Accountability function External (citizens and
politicians)
Management: promote, celebrate
Politicians: evaluation, making decision on
budget allocation, public services
General public: evaluate public services
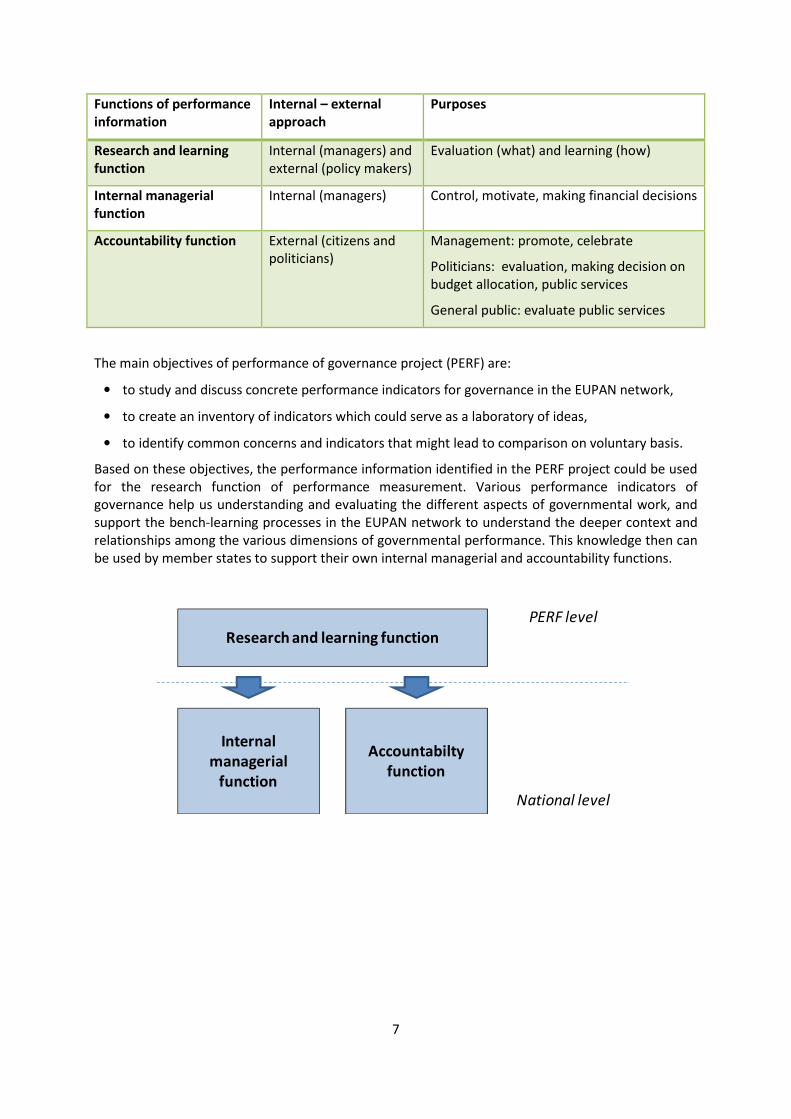
The main objectives of performance of governance project (PERF) are:
• to study and discuss concrete performance indicators for governance in the EUPAN network,
• to create an inventory of indicators which could serve as a laboratory of ideas,
• to identify common concerns and indicators that might lead to comparison on voluntary basis.
Based on these objectives, the performance information identified in the PERF project could be used
for the research function of performance measurement. Various performance indicators of
governance help us understanding and evaluating the different aspects of governmental work, and
support the bench-learning processes in the EUPAN network to understand the deeper context and
relationships among the various dimensions of governmental performance. This knowledge then can
be used by member states to support their own internal managerial and accountability functions.
Research and learning function
Internal managerial
function
Accountabilty function
PERF level
National level

8
3. The process: what happened in this semester?
The Hungarian presidency continued to build upon the work of the Belgian presidency. The PERF
project during the previous semester resulted in a framework (analytical table) for measuring the
performance of governance. The framework EUPAN and EGPA members set up consists of 7
components of governance with several facets in them. Having evaluated a wide list of potentially
useful and usable indicators, indicators were suggested for each facet.
This semester, based on the feedback from EUPAN members, Bench Learning Circles (BLC) were
formulated in order to analyse the selected facets deeper. BLC is a group of Member States and
organisations who are willing to take part in the further deepening analysis of the performance
indicators within selected facets (dimensions). BLCs explore the measurement of targets and possible
interpretations within the selected facets, collect definitions of indicators as well as good practices
for use of information. A bench learning circle operates exclusively on the web, exploiting the
facilities of the renewed EUPAN website as a virtual network.
Based on the feedback received from EUPAN members, five BLCs were formulated:
Facets BLC members Coordinator
Capacity to innovate (BLC1) Belgium, France, Hungary, Romania,
Slovenia, Sweden, UK Slovenia
Openness of government
(BLC2)
Belgium, Czech Republic, France,
Greece, Hungary, Netherlands, Portugal Hungary
Motivation of civil servants
(BLC 3)
Belgium, Denmark, France, Greece,
Hungary, Romania, Spain, UK, European
Commission
Belgium
Client satisfaction (BLC4) Austria, Belgium, France, Greece,
Hungary, Italy, Lithuania, Portugal,
Romania
France
Reducing administrative
burdens (BLC5)
Austria, Belgium, Czech Republic,
France, Hungary, Lithuania, Netherlands,
Portugal
Hungary
The role of BLC coordinators was encouraging others to join the circle as members, looking for those
who might possess good experience and valuable knowledge, facilitating discussions among
members, requesting feedback for documents created, and presenting the results in EUPAN
meetings. The BLC members were expected to provide inputs for work and feedback for documents.
The Hungarian presidency (staff of the Ministry and academic support) have collected input materials
from BLC members, supported the web-based virtual work, created draft documents.
9
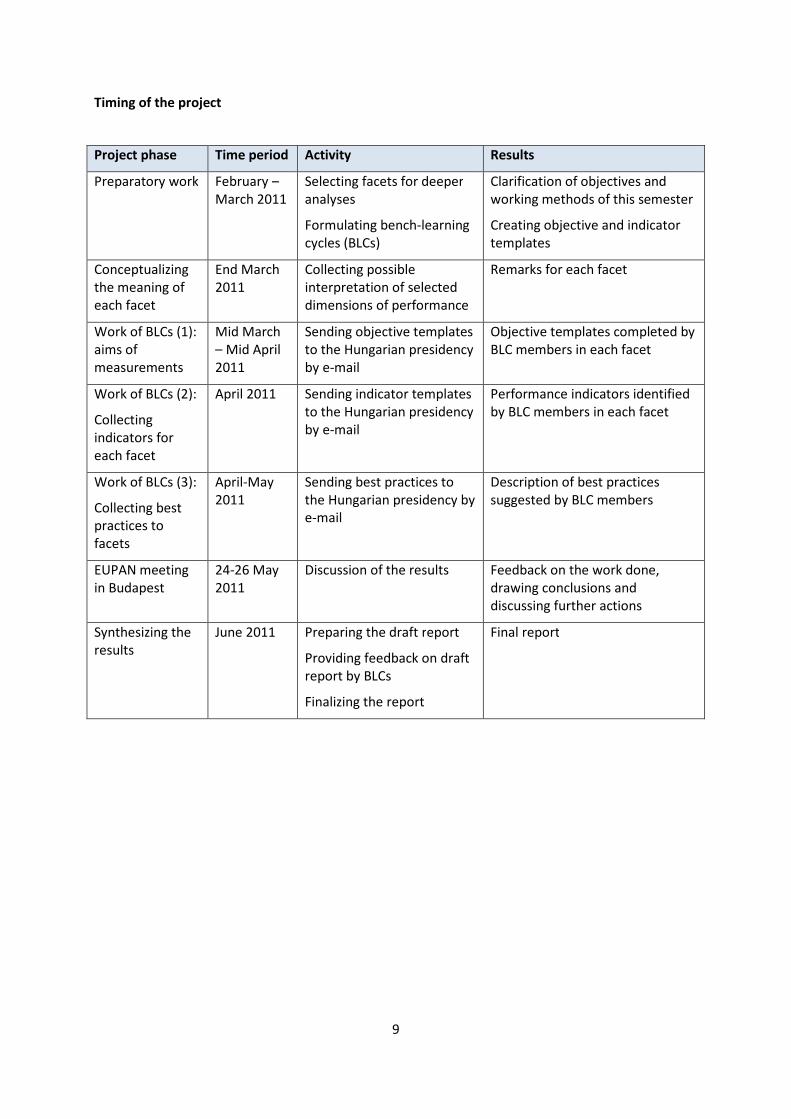
Timing of the project
Project phase Time period Activity Results
Preparatory work
February –
March 2011
Selecting facets for deeper
analyses
Formulating bench-learning
cycles (BLCs)
Clarification of objectives and
working methods of this semester
Creating objective and indicator
templates
Conceptualizing
the meaning of
each facet
End March
2011
Collecting possible
interpretation of selected
dimensions of performance
Remarks for each facet
Work of BLCs (1):
aims of
measurements
Mid March
– Mid April
2011
Sending objective templates
to the Hungarian presidency
by e-mail
Objective templates completed by
BLC members in each facet
Work of BLCs (2):
Collecting
indicators for
each facet
April 2011 Sending indicator templates
to the Hungarian presidency
by e-mail
Performance indicators identified
by BLC members in each facet
Work of BLCs (3):
Collecting best
practices to
facets
April-May
2011
Sending best practices to
the Hungarian presidency by
Description of best practices
suggested by BLC members
EUPAN meeting
in Budapest
24-26 May
2011
Discussion of the results Feedback on the work done,
drawing conclusions and
discussing further actions
Synthesizing the
results
June 2011 Preparing the draft report
Providing feedback on draft
report by BLCs
Finalizing the report
Final report

10
4. Capacity to innovate
It is widely accepted that innovation is a key driver of economic growth and a key success factor of
companies. Innovation, however, must also be present in the public sector, especially when
environmental changes (for example, consequences of the economic crisis, or constantly growing
performance-orientation) require new ways of thinking and new methods for operations.
Innovation, in its traditional format, in the business sector, may be directed at developing new
products of services, new operational (e.g. production or distribution) processes, or application of
new business routines (e.g. organizational rules or structures). These areas of innovation can be
applied to the case of the public sector as well:
(1) there might be new value-generating services provided by the government (however, the
demand for public services rather comes from citizens, and is not generated by the state, so
true service innovation is rare in the public sector),
(2) new processes that carry out existing functions in a better way (e.g. by applying e-
government applications), or
(3) new organizational routines (e.g. performance-based budgeting).
An important element of innovation may be how the government (re)defines citizen needs and
demands; (re)defining most of the times depends on political decisions as well. Innovative
approaches help public governance to carry out its tasks in a more efficient and effective way: finding
new ways to serve the demand is also considered as innovation. As the OECD states it in its paper,
“[i]nnovation in public service delivery is about getting the most out of the resources and capacities
invested in the public sector and deliver on the promises of better outcomes at lower cost.”2 While
most innovative solutions are specific to public service delivery (e.g. health care, transportation), in
the PERF project we focus our analysis to the question of how to enhance innovation in the public
administration since a higher capacity of public administration to innovate will result in better public
service delivery.
4.1. What is innovation in the public sector and public administration?
It is quite straightforward what purpose innovation in the public sector serves: to provide better
services in a more efficient way as well as to improve quality and effectiveness. What is, however,
not so straightforward is the “novelty” side of innovation. We expect that innovation, according to
the essence of the term, should bring something new – but where and to whom? How will innovation
be more than simply change? Is there a “true meaning” of innovation, or is it just a replacement for
change or reform? If a public administration body copies a best practice from an other country, is it
innovation or not?
Since novelty can be interpreted only in a relative way, there is no exact answer to this question.
However, if there is an innovation award winning project, we are able to make an argument why the
project was innovative: it is like “when we see a piece of good innovation, we recognize it”. Still,
there are some factors that can used to identify innovation. For the spread of innovative solutions
there are phases or roles: the original innovator applies the solution first, then early adopters begin
spreading the innovation, then, in the end, followers come. Since the public administration and the
public service delivery system is unique in each country, one can claim that the first public
2 OECD (2011, forthcoming): Innovation in public service delivery – Context, solutions and challenges,
GOV/PGC(2011)4
11
organization which applies a new solution in the country (even if it is adapted to a certain degree
from the private sector or foreign countries) is an innovator, and early adopters can also be
considered as innovative organizations, or ones that are open to innovative ideas. It happens quite
often in the public sector that followership is a result of a change in legal obligations. For example,
there are public organizations which introduce e-government services early, well before a
government regulation requires public bodies to implement e-services fully.
Since the public administration consists of several organizations, though all are part of the
government and thus central governance is present, innovation in public administration must cover
both organizational and interorganizational level (the latter, for example, can be directed at
restructuring the system of governance). Additionally, innovation is contextual and there is a macro-
level: the culture of innovation in a country will certainly have an effect on how innovative the public
sector can be. This, for example, has consequences for the role of education as well: where
education encourages innovative behaviour, it will have an impact not only over the economy but
the public sector as well.
Based on all these factors, a definition of public administration innovation could be: “delivering
public services in a better way by introducing new processes in public administration, or adjusting
existing ones from the private sector or from other countries to suit national/local needs”. This
definition emphasizes the role of public administration aimed at enhancing the performance of
public service delivery, and implies that an innovative public administration will have a certain extent
of adaptability, reactivity, and flexibility.
4.2. Aims of measurement
The facet “Capacity to innovate” is part of the building block of “Policy capacity”. There are a lot of
other facets in the PERF framework that monitor how innovative public governance is. The facet
“Capacity to innovate”, however, focuses on factors that enhance innovativeness: it does not
measure innovativeness per se but rather is related to the readiness to innovate. If the public
administration has a high capacity to innovate, it means that it can react to environmental changes
faster, and is able to absorb new technologies earlier. Innovation is, of course, not without dangers:
sometimes following new ways leads to new problems and unwanted consequences. Thus,
innovation in the public sector also requires its checks and balances: continuous evaluation of the
results is indispensable for timely corrections to be made.
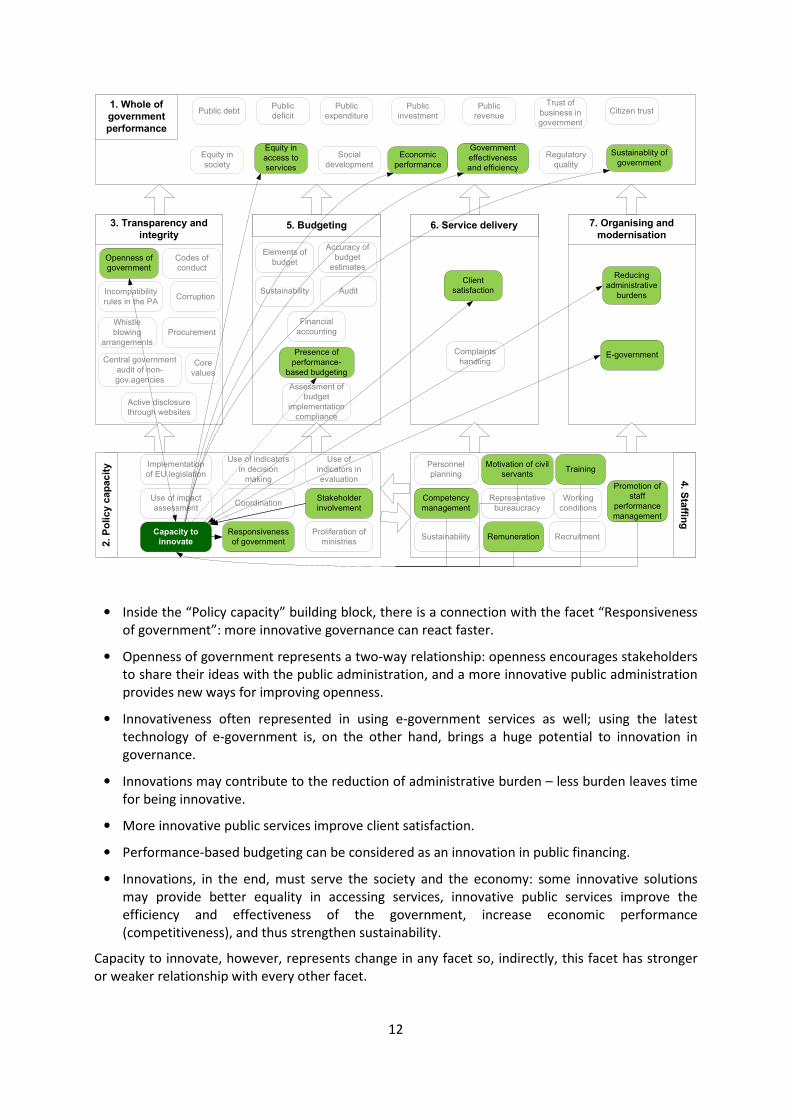
Relationship with other facets
Innovation is able to improve the performance of governance in virtually all the facets of the PERF
framework, however, there are some facets which are more directly related to “Capacity to
innovate”. They can either serve as a base for innovation capacity, or can gain a lot from a higher
level of innovation. These facets and relations are highlighted in the following figure3 (wide arrows
represent the typical relationships between building blocks, while narrow lines and arrows show
relationships between facets).
• Facets in “Staffing” as well as “Stakeholder involvement” are considered as factors enhancing
innovation capacity of the organization. For a detailed analysis of these relationships, see the
next subchapter.
3 We use this scheme to depict the relations among building blocks and facets of the PERF framework in the
case of all the facets analysed in this paper. Due to the focus of the work on 5 selected facets, we only analyse
the relations relevant to this paper, and do not grab all the possible relations in the framework.
12
1. Whole of
government
performance
3. Transparency and
integrity5. Budgeting 6. Service delivery 7. Organising and
modernisation
2. P
olicy c
ap
acit
y4. S
taffin
gPublic debt
Public
deficit
Public
revenue
Public
investment
Public
expenditureCitizen trust
Trust of
business in
government
Equity in
society
Equity in
access to
services
Government
effectiveness
and efficiency
Economic
performance
Social
development
Sustainablity of
governmentRegulatory
quality
Implementation
of EU legislation
Use of impact
assessment
Proliferation of
ministries
Responsiveness
of government
Capacity to
innovate
Stakeholder
involvementCoordination
Use of indicators
in decision
making
Use of
indicators in
evaluation
Personnel
planning
Recruitment
Working
conditions
Training
Representative
bureaucracy
Motivation of civil
servants
Remuneration
Promotion of
staff
performance
management
Sustainability
Competency
management
Openness of
government
Codes of
conduct
Incompatibility
rules in the PACorruption
Whistle
blowing
arrangements
Procurement
Central government
audit of non-
gov.agencies
Core
values
Active disclosure
through websites
Elements of
budget
Accuracy of
budget
estimates
Sustainability Audit
Financial
accounting
Presence of
performance-
based budgeting
Assessment of
budget
implementation
compliance
Complaints
handling
Client
satisfaction
Reducing
administrative
burdens
E-government
• Inside the “Policy capacity” building block, there is a connection with the facet “Responsiveness
of government”: more innovative governance can react faster.
• Openness of government represents a two-way relationship: openness encourages stakeholders
to share their ideas with the public administration, and a more innovative public administration
provides new ways for improving openness.
• Innovativeness often represented in using e-government services as well; using the latest
technology of e-government is, on the other hand, brings a huge potential to innovation in
governance.
• Innovations may contribute to the reduction of administrative burden – less burden leaves time
for being innovative.
• More innovative public services improve client satisfaction.
• Performance-based budgeting can be considered as an innovation in public financing.
• Innovations, in the end, must serve the society and the economy: some innovative solutions
may provide better equality in accessing services, innovative public services improve the
efficiency and effectiveness of the government, increase economic performance
(competitiveness), and thus strengthen sustainability.
Capacity to innovate, however, represents change in any facet so, indirectly, this facet has stronger
or weaker relationship with every other facet.

13
Factors enhancing innovation capacity
In order to improve innovation capacity in governance, one must have a clear view about the factors
that influence capacity to innovate. In short, these factors can be grouped into four categories (4 I’s
for innovation): information (one has to have access to the knowledge that can be used for
innovation), inspiration (one has to be able to come up with new ideas), incitation (one must be
motivated to share her ideas with others), and institutions (promoting and supporting innovation).
For successful innovations in the public sector, all the four elements must be present; once there,
they reinforce each other. The factors listed here build on enablers and barriers identified by the
OECD4 as well as on other sources and recommendations, with special emphasis on issued covered
during the PERF workshop in May, 2011 in Budapest.
Information:
• Knowledge management: the public sector is huge, with a lot of pieces of information just lying
around. Huge private companies invest considerable amounts of money into knowledge
management systems which capture and disseminate the knowledge produced anywhere in the
organization. Activities of the public administration are based on processing information to a
great extent so that knowledge management systems may have a greatly improve access to
information. A specific area for knowledge management in the public sector is the case of policy
evaluations and monitoring as well as other types of self-reflection at strategic level.
• Openness and partnerships: as the OECD paper claims, “open and inclusive policy making [...]
taps wider networks for innovation in policy making and service delivery”. Partnerships with
external stakeholders (with the private sector, NGOs and the academia) will be considered as
channels of information gathering – and information might turn into a pubic governance idea at
4 OECD (2011, forthcoming): Innovation in public service delivery – Context, solutions and challenges,
GOV/PGC(2011)4
14
a later stage. Partnerships with consultancies can also become a good base for innovations
happening: heavy practice-orientation of consulting may help in bringing in ideas that have
better chances to turn into actual innovations later. Sometimes “unofficial” sources, like
community sites on the internet, can turn into valuable pools of ideas. Not only external (citizen-
oriented) but also internal openness might be relevant here. There might be best practices or
interesting data in agencies/departments present; open internal communication and
information sharing (supported by, for example, a government-wide knowledge management
system) are important to disseminate these internal practices as well. The lack of trust within
government and high level of internal competition might be important factors that inhibit
internal information sharing.
Inspiration:
• Staff skills and competencies: even if the information is there, a certain set of skills and
competencies from the public administration staff is needed for turning pieces of information
into innovative ideas. Employees with adequate skills must be attracted by the public sector
(strengthening the role of strategic workforce planning), and competencies of the staff must be
continuously developed. Diversity in the workforce or internal mobility programs will also foster
innovation. In the background there is an important role of the education system in fostering
innovation in the economy – as well as in public administration. In a ageing society, lifelong
learning is an important instrument to ensure that the most experienced public servants use
their competences for organizational innovation. Beside the attraction of educated employees,
the retention and development of experienced employees is also important to inspire and
innovate.
• Teamwork, especially when it is cross-sectoral and/or cross-disciplinary, will produce more
innovative ideas by bringing together different perspectives. It is especially important in such a
complex environment as the public administration. Successful innovations can be often tied to
the presence of small and motivated teams.
Incitation:
• Monetary and non-monetary motivation: innovative ideas will turn into project proposals only
when the staff can see that their new ideas have good chances for turning into reality, and their
“innovation performance” is either compensated in monetary terms, or positively recognised in
other ways. This is to what the OECD paper refers as “the principle of merit should prevail”.
• Delegation: if employees and managers at lower organizational levels have greater freedom in
how they accomplish organizational goals, it may lead to innovation – even at a small scale.
Delegation helps people in forgetting the rigid rules of bureaucracy, and encourages them to
“start to think”.
• Risk taking: the public sector, due to the high level of public scrutiny about its activities, is
basically risk-averse. Innovation, however, inevitably comes together with the risk of failure.
Private investors easily tolerate this higher level of risk by adjusting their expected rate of return
on the investment but this is not an option for the public sector. Yet, as it is cited by the OECD
paper, “one key element in the innovation process is the need for managers to accept and
tolerate a certain amount of risk taking and empowering staff to take initiative and think
creatively, even if this results in some cases in failures.”
Institution:
• Innovation strategy and managerial support: having innovation strategy for the government,
and requiring public administration bodies to elaborate one will increase attention paid to this
area. Managerial support further strengthens the culture of innovation. Successful innovation
cases always include “champions” from the top management, advocating innovation.
15
• (Strategic) innovation units: units dedicated to public administration innovation (either
organizational units within, for example, ministries, or separate governmental agencies, focusing
on this task) can enhance innovations. Having a dedicated unit means that their resources are
fully used for promoting innovative projects – time and money will not be consumed by every
day activities and other urgencies.
• “Time to think”: when one is overburdened by her daily tasks, she will rarely spend any time
with generating innovative ideas. As the OECD paper states, “[a]dministrative simplification can
provide public sector organisations with more time and leeway to innovate.”
4.3. Appearance and use of the facet
Objectives about public sector innovation
Social and economical changes in the past one or two decades promoted the idea of a more efficient
and effective public sector – this idea has been recently further strengthened by the economic crisis.
Innovation is considered as one of the key drivers of economic growth, and is represented by
“Innovation Union”, one of the flagship initiatives of EU2020 strategy.5 While European institutions,
national governments and regional authorities can contribute a lot to various institutional solutions
that encourage innovation in the European economy, the public sector and the public administration
itself is also expected to become more innovative.
At the highest level, beyond the general role of government in supporting innovation in the economy, public sector innovation is also seen as a key driver for long-term economic success, stimulated by better public services. Objectives are formulated as follows:
• “[t]he promotion of creativity and innovation will pave the way to a competitive, socially and
environmentally responsible knowledge-based economy, and will consequently lead to an
increase in the quality of living. Among the structural changes, major adjustments are planned in
the pension system, long-term care, health service and health insurance systems.”(Slovenian
Exit Strategy)6
• “Innovation in public service delivery is about getting the most out of the resources and
capacities invested in the public sector and deliver on the promises of better outcomes at lower
cost.” (OECD)7 “Also high on the Ministerial Agenda was the need for greater innovation in the
public service. Indeed, perhaps one of the most daunting challenges on the table at the
Ministerial was avoiding that “doing more with less” lapse into “doing less with less”. Especially
since renewed growth and trust in both governments and markets depends, in part, on an
effective and efficiently functioning public sector. One key to achieving this, Ministers
recognized, would be by promoting greater innovation, in short, “doing things better””. (OECD)8
• In addition to “doing things better”, governments should also actively try to show their citizens
that they are doing things better. According to Van de Walle (2004), improving performance
does not necessarily increase trust in the public sector, as citizens’ images and ideas about
governments are not changed easily and do not correspond completely with practice.
5 http://ec.europa.eu/europe2020/tools/flagship-initiatives/index_en.htm
6 http://www.svrez.gov.si/en/highlights/exit_from_the_crisis/slovenian_exit_strategy_20102013/
7 OECD (2011, forthcoming): Innovation in public service delivery – Context, solutions and challenges,
GOV/PGC(2011)4 8 OECD (2011, forthcoming): Government at a glance, GOV/PGC(2010)/22/FINAL
16
At middle level, increasing innovative capacity of public sector organizations is proposed by the means of organizational development. Objectives are formulated as follows:
• “According to a survey made in countries with Anglo-Saxon administration systems, the
innovation within the public sector are of holistic character (i.e. cross the organizational
boundaries), generally (but not exclusively) apply the new information technologies, always
contain certain elements designed for improvement of the procedure concerned as well as
rather reflect to the internal problems that arise in a crisis situation also perceivable externally.
The initiators of the innovations are mostly middle managers as well as administrators; the
innovations are rather results of a conscious planning process than products of a floundering
headway, furthermore, the initiators of the innovations are rather motivated by the
appreciation within the organization than by the desire for a premium. These results suggest
that the organizational innovation can be improved by specific interventions. For this purpose,
such organization development means should be applied that promote becoming the two most
important resources, namely the personnel and the information more accentuated, their
enforcement.” (Hungary, State Reform Operational Programme, 2007-2013)9
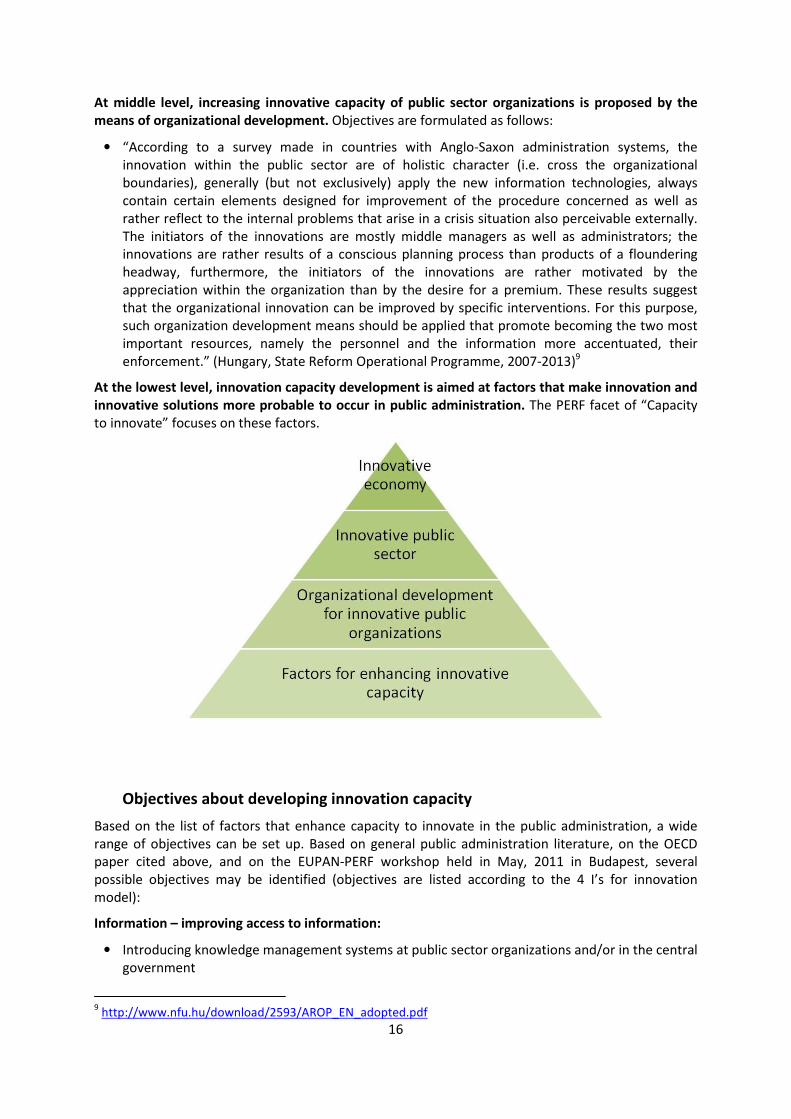
At the lowest level, innovation capacity development is aimed at factors that make innovation and innovative solutions more probable to occur in public administration. The PERF facet of “Capacity
to innovate” focuses on these factors.
Objectives about developing innovation capacity
Based on the list of factors that enhance capacity to innovate in the public administration, a wide
range of objectives can be set up. Based on general public administration literature, on the OECD
paper cited above, and on the EUPAN-PERF workshop held in May, 2011 in Budapest, several
possible objectives may be identified (objectives are listed according to the 4 I’s for innovation
model):
Information – improving access to information:
• Introducing knowledge management systems at public sector organizations and/or in the central
government
9 http://www.nfu.hu/download/2593/AROP_EN_adopted.pdf

17
• Program evaluation/self-reflection/use of monitoring and evaluation in the reform processes
• Building extensive partnerships with R&D facilities of the private sector as well as the academia
• Inclusion of external stakeholders in policy making
Inspiration – turning information into idea:
• Strategic workforce planning, e.g. encouraging shift of employees between the private and the
public sector, attracting employees with private sector job history
• Competency development trainings
• Trainings aimed at introducing up-to-date technology
• Extensive use of project teams in problem solving
• Internal mobility program
Incitation – motivating people to come up with ideas:
• Using idea boxes, signalling that ideas are important for the organization
• Inclusion of innovativeness in the performance evaluation scheme of the staff
• Rewarding staff for innovative ideas (e.g. percentage of savings earned by the implementation
of the idea is paid – might not be working with quality improvement ideas)
• Public administration innovation awards
• Risk management to cope negative effects of with risk aversion
Institution – “switching the organization into innovation mode”:
• Innovation strategy making is obligatory for all public sector organizations
• Setting up organizational units within the public administration which are dealing with
innovative ideas full-time
• Providing time for employees to think about innovative ideas (e.g. by reducing administrative
burden in public administration)
4.4. Indicators
Based on literature about public sector innovation, the following indicators may be applicable:
At the level of the whole economy:
• Government budget appropriations or outlays for R&D (GBAORD) includes all the financial
sources which promote private sector innovation as well, not just innovations directed at public
administration (element of OECD’s Government at a Glance, 2011)
• Growth in public R&D spending (Bertelsmann Stiftung’s Sustainable Governance Indicators
2009)
• B43 Investment in R&D (as percentage of government expenditure) (listed as potential PERF
indicator)
• B44 Number of patents (listed as potential PERF indicator)
• Triad patents (Bertelsmann Stiftung’s Sustainable Governance Indicators 2009)
18
• B45 Number of universities in World rankings (listed as potential PERF indicator)
• B46 Impact of country research in scientific community (listed as potential PERF indicator)
• High-tech employment (Bertelsmann Stiftung’s Sustainable Governance Indicators 2009)
• Science and technology degrees (Bertelsmann Stiftung’s Sustainable Governance Indicators
2009)
At the level of public sector innovation:
• Government spending on public sector R&D
• Government spending on public administration R&D
• B42 Funding of innovative projects by the government as a % of government expenditure (listed
as potential PERF indicator)
• Institutional reform – To what extent does the government improve its strategic capacity by
changing the institutional arrangements of governing? (Bertelsmann Stiftung’s Sustainable
Governance Indicators 2009)
At the level of public sector organizations:
• Percentage of public sector organizations having an innovation strategy
• Number of public sector organizations with organizational development projects
• Existence of innovative concrete actions (from The “Quick Scan” – The Belgian Federal
Operational governance indicator system at operational level)
At the level of factors enhancing innovation:
• A7 % of staff having completed upper secondary education (originally suggested PERF indicator
but its utility was found low at the Bruges meeting)
• B40 Distribution of governmental workforce by highest level of education attained (listed as
potential PERF indicator)
• B41 Existence of governmental coordination units for innovation (listed as potential PERF
indicator)
• Coverage of central knowledge management system (in terms of organizations and users)
• Number of documents available in the knowledge management system (however, the pure
number of documents will not tell you the quality and usability of documents, and a high
number of documents will need a very good content management system)
• Use of the knowledge management system (number of users enrolled, number of downloads –
however, it is almost impossible to measure how materials are used for creating new documents
and new knowledge)
• Frequency of sector or program evaluation/self-reflection/use of monitoring and evaluation in
reform processes
• Ratio of “co-production” in public services (operationalisation is difficult and may vary in the
case of various services)
• Existence of public administration innovation award
• Scientific advice – How influential are non-governmental academic experts for government
decision making? (Bertelsmann Stiftung’s Sustainable Governance Indicators 2009)
• % of staff with job history in the private sector:
19
o Of those who are presently employed in public administration in your assessment
how much of their career life have they spent in the public sector (vis-à-vis private
sector employment/work experience)? (from the Questionnaire on the Mobility in
National Labour Markets)
o Are management positions in civil service accessible from the private sector? (from
the Questionnaire on the Mobility in National Labour Markets)
• Strength of internal mobility of public administration:
o Are the below types of mobility encouraged by the present civil service system?
(from the Questionnaire on the Mobility in National Labour Markets)
Note: Some of the HRM indicators are not listed here since, in the PERF project, they belong to the
building block “Staffing”. E-government is also omitted since (1) it is just one – however, significant –
technology that can be used innovatively, and (2) is part of the building block “Organising and
modernisation”. Reducing administrative burden for the public administration is also missing, due to
the latter cause.
4.5. Best practice cases
Best practice cases and examples are cited in the paper prepared by the OECD, however several of
them are directed at public service delivery and not general public administration.10
Some cases were
also suggested by EUPAN members on the PERF workshop held in May, 2011 in Budapest.
Knowledge management projects
There is a Federal Knowledge Management Network (the “savoir” project) in Switzerland11
. The
membership is voluntary, and the project is a corporate initiative of the private and the public sector.
In Portugal12
, “the RCC (Common Knowledge Network) was created in order to be a reference device
to support the dissemination of good practices and the construction of knowledge. The project is
based on active participation and collaborative involvement of public bodies, central and local,
private entities and citizens. [...] There are private entities and universities that have also joined the
project and contributed with best practices, articles and solutions in different areas. [As of December
2010, there were] 291 best practices published in the RCC, organized under the following taxonomy:
Citizen Services, Administrative Modernization, Information Technology, Innovation Management,
eGovernment; Sustainability; and Quality.”13
Strategic innovation units
It seems that creating units responsible for advocating public sector innovation is a popular
approach. Romania and France have innovation units, and the Netherlands had one earlier (however,
it’s been discontinued). They can either provide assistance for other public organizations, or can
direct the attention to the importance of being innovative.
10
OECD (2011, forthcoming): Innovation in public service delivery – Context, solutions and challenges,
GOV/PGC(2011)4 11
http://www.skmf.net/fileadmin/redaktion/aktiver_content/09_savoir/WM_Infoflyer_A5__060705_dt_final.pdf 12
http://www.rcc.gov.pt
13 Common Knowledge Network, Nomination for the 8th Edition of the United Nations Public Services Awards
20
Top management support, champions for innovation
In Denmark, the commitment of 6 top managers in elderly care played a significant role in redefining
what their main task was. Instead of providing care till the end of life, they managed to shift the
focus of provision to help to get out from care.
4.6. Conclusions, recommendations
Nowadays, public sector innovation is certainly a hot topic in public governance. First, it should be
clarified what innovation means in the public sector and public administration. This partly
theoretical, partly practical question seems to characterize recent debates in several countries. Even
if the definition itself is debated, the aim of public sector innovation seems to be quite
straightforward: to provide better public services to citizens. What was central to the discussion on
the PERF workshop (and central to the concept of innovation, too) is the “novelty” factor: how will
innovation become essentially more than merely “change”? We tend to recognize when something is
considered as an innovation throughout the world but what is new in public administration? Public
administration systems may significantly differ from country to country (and do fundamentally differ
from private organizations), thus the first use of a solution in a national public administration can be
easily considered as innovation even if it is adapted from a foreign best practice or from the private
sector.
Based on the PERF workshop discussion, a definition of public administration innovation could be:
“delivering public services in a better way by introducing new processes in public administration, or
adjusting existing ones from the private sector or from other countries to suit national/local needs”.
This definition, however, needs further refinement and clarification in the future.
The PERF facet under investigation in this BLC was, however, the capacity to innovate: the work was
focused on factors that enhance innovation in public administration. A theoretical framework has
been set up for categorizing these factors, called 4 I’s for innovation:
• Information (one has to have access to the knowledge that can be used for innovation):
knowledge management and partnerships were mentioned as supporting factors.
• Inspiration (one has to be able to come up with new ideas): the role of education in enhancing
innovative thinking and the role of small but motivated teams were emphasized.
• Incitation (one must be motivated to share her ideas with others): rewards are important, let
them be monetary or non-monetary (e.g. public innovation awards), delegation and greater
responsibility may result in enhanced motivation for innovation, and in the context of the public
sector encouraging risk taking is essential since innovation inevitably comes together with
failures.
• Institutions (promoting and supporting innovation): support from top management is essential
all times, requirement of creating an innovation strategy or setting up an organizational unit or a
governmental agency responsible for innovation will demonstrate the importance of being
innovative for everybody in the public sector.
Several objectives regarding public sector innovation as well as corresponding indicators have been
identified but it became clear during the workshop discussion that this topic requires further
elaboration.
As the topic of “Capacity to innovate” addresses a wide range of innovations, from small, every day
adjustments based on the incremental approach to breakthrough projects and/or major structural
changes in public administration, there is a lot of room for further investigation of the area. The

21
importance of innovation in the public sector and public administration was also clearly seen from
other discussions: the implementation of the new Europe 2020 strategy and the realization of goals
set up will require a better responding and more innovative public sector. Continuing the discussion
within the BLC Capacity to innovate can contribute to addressing the new challenges in this respect.

22
5. Openness of government
Transparency and openness are basic values that we, as citizens or other stakeholders, require from
a state or a government to follow. Openness, on the other, is also considered as a tool: it is only an
open government which can create trust among those who are subjects of government regulations.
No wonder that openness, in some form, is a building block of all the frameworks that evaluate the
performance of governments or public governance. Modern information technology and e-
government services can play a key part in improving openness and thus almost always are
connected to this topic but, in general, openness is rather a principle or way of thinking about
governance than just a bunch of tools that should be used.
5.1. Aims of measurement
The facet “Openness of government”, as part of the building block “Transparency and Integrity”,
might have several meanings. A suitable indicator, identified during the previous semester, was
“Availability of democratic information: annual budget/account, legislation under preparation, policy
research”. Availability of information which can be interesting for citizens, enterprises or media is,
however, only the first step of openness. It should also be analysed how this information is accessed
and used: is it downloaded from the web, is it cited by newspapers – so: is it really used by its target
group?
Beyond availability, accessibility might also be part of openness: if a citizen or an interested party
requests for public information, is there a smooth process to do that, and will it be easily and quickly
delivered to him or her? If somebody just needs help in dealing with administrative issues (let it be
taxation, social health insurance, or a simple question about nationalization of a marriage
certificate), is there a possibility to turn to someone who responds in time? It is worth noting,
however, that this latter kind of accessibility could also be considered as an element of the “Service
delivery” building block since it actually makes it easier to use government services. Providing better
and faster information about government services will definitely increase customer satisfaction with
the service in question.
Openness, at its highest level, might mean two-way communication between the government and
citizens or other stakeholders: when government decisions will affect the lives of stakeholders, they
have a good chance to raise their voice during the process. This factor, however, in the PERF
framework belongs to the “Stakeholder involvement” facet, found in the “Policy capacity” building
block.
The OECD identified four dimensions of openness (or as they referred to it, “accountability and
openness”)14
:
• Transparency: government actions and actors can be scrutinized by the general public.
• Accessibility: when anybody can freely access information what she requires, and can easily (we
should add, in an equitable manner) access government services.
• Responsiveness: a government which is open towards new ideas in order to serve stakeholder
needs better, so citizens and other stakeholders are regularly consulted.
• Inclusiveness: “aims to ensure the broadest-base participation possible”.
14
Van Dooren – Lonti: How to measure performance of governance? CAP Symposium, ASPA Baltimore,
12/03/2011

23
In the PREF framework, openness of government covers the first two of these dimensions – however,
scrutinizing actors are rather part of the “Active disclosure through websites” facet.
Relationship with other facets
There are some facets in the PERF framework which support the openness of government and there
are others which gain from a more open government. These facets and relations are highlighted in
the following figure (wide arrows represent the typical relationships between building blocks, while
narrow lines and arrows show relationships between facets).
2.
Po
lic
y c
ap
acit
y
4. S
taffin
g
• Active disclosure of private interest can be considered a (significant) part of openness. Thus, if
private interest are disclosed in a wide number of cases, the government will be perceived as a
more open one by constituents.
• If openness is found among the core values of public servants, it will lead to a more open
government: regulations can enforce data publishing in a given range of documents but cannot
fully change the way of thinking in public organizations.
• Openness will certainly decrease the number of corruption cases and procurement frauds.
• If transparency and openness is part of the audit process (either by the audit office, or an intra-
governmental body over agencies), the openness of government will grow. A more open
government, on the other hand, will be more willing to act upon the results of audits, thus
audits will be perceived as more useful.
• Openness encourages stakeholders to share their ideas with the public administration, thus
increasing innovation capacity, and a more innovative public administration provides new ways
for improving openness.

24
• A more open government will be more responsive as well (will react faster), and while
stakeholders can see that the government is acting upon their contribution as fast as possible,
the government will be perceived more open.
• Stakeholder involvement can be considered as a higher level of openness, when stakeholders
are included in government decisions as far as possible.
• E-government services, information technology and the internet promote the idea of and
provide tools for open government.
• Having more information about public administration and public services, and having the
opportunity of communicating with public bodies will increase client satisfaction. In service
industries having information about the process (and the progress) is almost as important as the
result of the process: if one can clearly see, how an official procedure is progressed, and when it
is expected to end, waiting time is accepted to a greater extent (compared to the one, where
there is no information about the progress). Sometimes even very bureaucratic rules can be
explained to citizens what they will perceive as a higher level service when they understand why
the process is so bureaucratic.
• Openness will improve the quality of regulation by providing opportunities for the public to
share their ideas with the government.
• And, what is maybe the most important consequence of being open, trust of citizens and
enterprises can only be earned by a transparent and open government (of course, if there are
faults in operations, being transparent will also mean the necessity to deal with scandals,
resulting lower trust in the short term – that is why a holistic approach to performance
evaluation is needed and creating a transparent system from one day to another is almost
impossible). Since the level of trust will have a huge effect on how the government can function,
how it can implement its decisions, all the factors that increase trust are of upmost significance.
Openness in the PERF and other frameworks
Transparency of the government is a significant issue in all the frameworks that evaluate the
performance of governance. Here, we compare the PERF framework with the OECD Government at a
Glace15
and the Bertelsmann Foundation Sustainable Governance16
frameworks. This will also show
us how many meanings openness has.
PERF OECD G@G
Openness of government
Scope of freedom of information laws
Ease of filing a request for public information
Proactive disclosure of information
Improving the transparency of regulations*
Active disclosure through websites Conflict-of-interest disclosure by top decision makers
Procurement Transparency in public procurement**
All the OECD G@G indicators are part of Chapter VIII - Transparency In Governance, except for:
* Part of Chapter X - Regulatory Governance;
** Part of Chapter IX - Public Procurement.
15
OECD (2011, forthcoming): Government at a glance, GOV/PGC(2010)/22/FINAL 16
Bertelsmann Stiftung: Sustainable Governance Indicators 2009 Codebook.
25
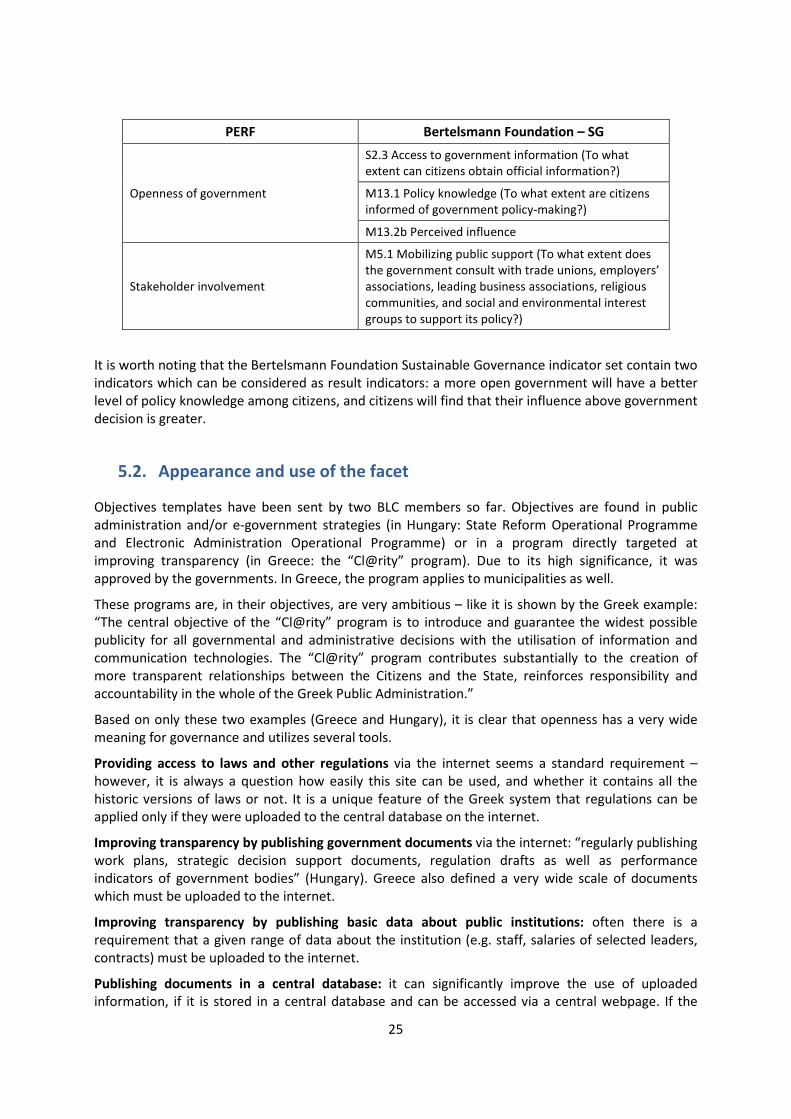
PERF Bertelsmann Foundation – SG
Openness of government
S2.3 Access to government information (To what
extent can citizens obtain official information?)
M13.1 Policy knowledge (To what extent are citizens
informed of government policy-making?)
M13.2b Perceived influence
Stakeholder involvement
M5.1 Mobilizing public support (To what extent does
the government consult with trade unions, employers’
associations, leading business associations, religious
communities, and social and environmental interest
groups to support its policy?)
It is worth noting that the Bertelsmann Foundation Sustainable Governance indicator set contain two
indicators which can be considered as result indicators: a more open government will have a better
level of policy knowledge among citizens, and citizens will find that their influence above government
decision is greater.
5.2. Appearance and use of the facet
Objectives templates have been sent by two BLC members so far. Objectives are found in public
administration and/or e-government strategies (in Hungary: State Reform Operational Programme
and Electronic Administration Operational Programme) or in a program directly targeted at
improving transparency (in Greece: the “Cl@rity” program). Due to its high significance, it was
approved by the governments. In Greece, the program applies to municipalities as well.
These programs are, in their objectives, are very ambitious – like it is shown by the Greek example:
“The central objective of the “Cl@rity” program is to introduce and guarantee the widest possible
publicity for all governmental and administrative decisions with the utilisation of information and
communication technologies. The “Cl@rity” program contributes substantially to the creation of
more transparent relationships between the Citizens and the State, reinforces responsibility and
accountability in the whole of the Greek Public Administration.”
Based on only these two examples (Greece and Hungary), it is clear that openness has a very wide
meaning for governance and utilizes several tools.
Providing access to laws and other regulations via the internet seems a standard requirement –
however, it is always a question how easily this site can be used, and whether it contains all the
historic versions of laws or not. It is a unique feature of the Greek system that regulations can be
applied only if they were uploaded to the central database on the internet.
Improving transparency by publishing government documents via the internet: “regularly publishing
work plans, strategic decision support documents, regulation drafts as well as performance
indicators of government bodies” (Hungary). Greece also defined a very wide scale of documents
which must be uploaded to the internet.
Improving transparency by publishing basic data about public institutions: often there is a
requirement that a given range of data about the institution (e.g. staff, salaries of selected leaders,
contracts) must be uploaded to the internet.
Publishing documents in a central database: it can significantly improve the use of uploaded
information, if it is stored in a central database and can be accessed via a central webpage. If the
26
central database must handle a large number of documents, it will be essential to have an adequate
content management system (e.g. categorizing, tagging documents) in order to assist stakeholders in
finding documents relevant to them. This is the case with the Greek clarity program where there is
special attention is paid to publish the documents and records in open data format – so anybody can
create further applications that use the data coming directly from the central database.
Quick response when public information is required: it was not listed among the objectives, but it is
also a very important element of openness how quickly public bodies react on requests based on
access to information laws. Since it is almost impossible to publish everything, there must be always
a way to request for any information hold by a public body.
Setting up a central government portal which contains not only the documents required to be
published but also serves as a user-friendly service point towards citizens, enterprises, and other
stakeholders, providing them all the information, process descriptions, help and news they need for
efficiently managing their official cases. These centres also serve as good starting points for citizens
to make their first enquiry about a given procedure; then it is an objective to answer these questions
as quick and as fully as possible.
Operating common territorial service centres can be a good idea to reach those citizens who do not
want or are unable to use e-government services (and the central portal). If there are physical
centres where a citizen finds help in a wide range of services, the government will show a more open
image of itself. If agencies that used to operate at separate locations are moved to a common place,
maintenance costs can be decreased as well.
Providing continuous feedback about the administrative process: “providing interactive feedback
and workflow monitoring for clients about the status of the official procedures initiated by or
affecting them” (Hungarian objective) will create more transparency in individual cases as well –
where individual citizens really can feel what openness means for them.
Why openness is important for countries? The most important reason is that it is an essential step
towards creating trust in the government. Sometimes, somewhere the bad starting point (what
citizens feel towards public administration and the state) requires immediate attention. The
reasoning behind the objectives, connected to openness, was given by the two respondents as
follows:
“The Greek citizens feel estranged and remote towards the country’s political life cause many times
in the past, Greece has suffered from severe economical and political corruption. Aiming at changing
the whole culture in the Greek Public Administration, the newly elected Prime Minster, George
Papandreou, proposed and implemented the groundbreaking initiative of the “Cl@rity” program so
as to establish a new “social contract” between the Citizens and the State.” (Greece)
“Active involvement of the social partners constitutes an integral part of the new approach. [...]
Public administration acquires its social capital from the confidence showed by citizens and
enterprises which, in turn, requires openness from the government by making relevant information
publicly available as well as including social partners in decision making.” (Hungary)
5.3. Indicators
Indicator templates have been sent by two BLC members. Indicators used (or planned to be used) are
related to a wide range of objectives. First, there are indicators that are related to information
sharing via the internet.
Some indicators measure how widespread is the application of a transparency program among
public institutions –whether there is an awareness about the program at all (input indicators):
27
• Number of entities participating in the Cl@rity Program (Greece)
Of course, the pure number of participating public bodies has a significant bias since it does not tell
anything about the quality (e.g. how well the organization adopted the regulation). There is a
remarkable indicator in Hungary, measured by a non-profit organization:
• Score on application of the information freedom law by public bodies (Hungary): there is a wide
range of information which must be uploaded to the websites of public institutions (ministries,
agencies and other public bodies) – e.g. main tasks, contacts, data about contracts etc. This civil
program checks whether how many pieces of information out of 51 required by the law are
present on the websites of public institutions, and transforms this ratio into a 0-100% score
(there is even a ranking of public institutions is created).
Other indicators concern how much information is shared via the internet (output indicators):
• Number of acts uploaded by each entity in a given time period (Greece)
• Descriptions of administrative procedures present on the internet (Hungary): for a stakeholder,
the only important issue is that she can get information about the given official procedure she
would like to initiate. There is a requirement that all the public institutions must provide
descriptions about procedures on their websites. A measurement problem can be if there is no
exact data about how many procedures are there in public administration (and whether variants
of a procedure should be counted separately or not). A variant of this indicator is when we
measure only the most common public services (e.g. in Hungary 20 service of CLBPS + 7 other
selected procedures).
Numbers and ratios can be calculated to categories of documents as well. What is extremely
important from the point of view of openness is how proposed regulations are shared:
• Ratio of uploaded draft laws and regulations – compared to the total number (Hungary): a bias
can be that there is no information about the total number of proposals, only about the laws
and regulation that are finally accepted. The ratio does not measure how much time is provided
for stakeholders to reflect on drafts. Calculating this ratio can become even more problematic in
the case of concepts, plans, and other non-legislative documents since the value of the
denominator is only known by the organization itself, and greatly dependent on the exact
definition of the indicator.
It is also important whether the information uploaded is used by the public:
• Number of website visits – daily, monthly, annual (Greece)
• Average number of weekly visitors of the government portal (Hungary)
It might be also useful to analyse how information is used by the public: what are the most
frequently used services/topics.
Then, in the next step, it can be measured how intense is the two-way communication between the
government and the stakeholders:
• Number of opinions coming from stakeholders, compared to the number of draft legislations
uploaded (Hungary, planned). Of course, this indicator will not measure how useful opinions
were, and whether they had an effect on the quality of regulation.
• Percentage of policy areas the submitted issues refer to (Greece): based on this indicator, the
public administration can get a better picture about what topics are important for people (or
what topics are more difficult to understand due to complex regulation).
• Ratio of questions, coming from citizens, that have been answered (Hungary, planned): citizens
can ask questions via the central website, and the central administration, based on the topic,
28
forwards the questions to those organizations who can answer them. A limitation may be if
quality of answers is not measured. There are good practices, however, on webpages of service
companies: in the FAQ part, the users can respond to the question: “Was this answer helpful?
Mark 1-5.”
• Number of public hearings
There are indicators which describe technical parameters of how the system is used (it is rather
needed for technical reasons – IT system development and maintenance – than for public reporting):
• Number of uploaded documents per hour – on average / in peak hours (Greece)
• Visits per hour – e.g. during working hours and other times; peak periods (Greece)
Since the programs introduce a centralized data base, indicators are automatically calculated online
in Greece, and there are plans for automatic calculation in Hungary as well. This brings “constant
transparency” and results in a quick feedback mechanism.
5.4. Best practice case
Online database of government and public sector documents
One proposal for a best practice case has been sent by Greece. Since the program has just been
implemented recently, it might be too early to tell how indicators defined for the project could be
used for decision support. However, there are certain points in the case which are considered as best
practice:
• There is a central database for all the documents.
• Documents are tagged and easily searchable in the central database.
• Laws, regulations and decisions do not take effect and cannot be executed unless uploaded to
the central database where they get unique system ID numbers.
• A very wide range of public documents must be published in the database: among others, laws,
decrees and other regulatory acts, explanatory circulars, budgets, reports, balance sheets,
individual expenses, appointments, resignations and replacements of personnel, establishment
of committees or working groups, remuneration and compensation practices, vacancy notices as
well as the list of successful and runner-up candidates, contracts, donations.
• There is an online help desk, and request are monitored.
• The implementation is based on an “open data” and “open architecture” approach, meaning the
everybody can easily use public information to build further applications.
As a short-term result, there were 220,000 documents uploaded into the system in Marc, 2011, and
the number of daily average website visits was around 30,000.
Enhancing two-way communication
Portugal used a public consultation method during its administrative burden reduction program
called “Simplex”. “Even though officials should have knowledge of all matters of their institution,
citizens have a different perspective, as a consumer or as a client and are the need of these that must
be fulfilled. [...] In the Public Consultation, all initiatives identified by public bodies to the next year
are put online and citizens have a month to comment, vote or suggest different initiatives. [...]Not
only the statistics reveal the growth of the involvement with the Simplex Program but also the
relevance of the content is proving this influence in policy-making. In 2007, 271 suggestions were

29
made, in 2008 were 515 and in 2009 were received more than 630. All the proposals are sent to a
representative official of each ministry – Mr. or Mrs. Simplex – and many of them are accepted and
included in the Program. All of them receive an answer explaining why the initiative isn’t possible or
how it is already being improved.”17
5.5. Conclusions, recommendations
Openness of government is of particular importance in each member states, however, it became
clear that measuring this issue is a challenging task. Measuring how open a government is becomes
even more difficult if we interpret openness in a wider sense: it is only the first step to publish
information about the government and the public sector, more advanced levels of openness include
responsiveness and inclusion.
Freedom of information of public interest is a standard everywhere, and there are several initiatives
which decrease transaction costs of public transparency by using the internet. Measuring the volume
of information published is relatively easy – measuring how it is used by the public has a bit more
limited means but still manageable. Responsiveness towards and inclusion of stakeholders in
government decisions (two-way communication and interaction, leading to co-decision, co-design,
and co-produce), and especially the results of these activities, will need further research to find
appropriate measures. A further reason for measuring openness is the important part it plays in
creating trust towards public governance.
17
Simplex Public Consultation and Simplex Idea, Nomination for the 8th Edition of the United Nations Public
Services Awards, December 2010
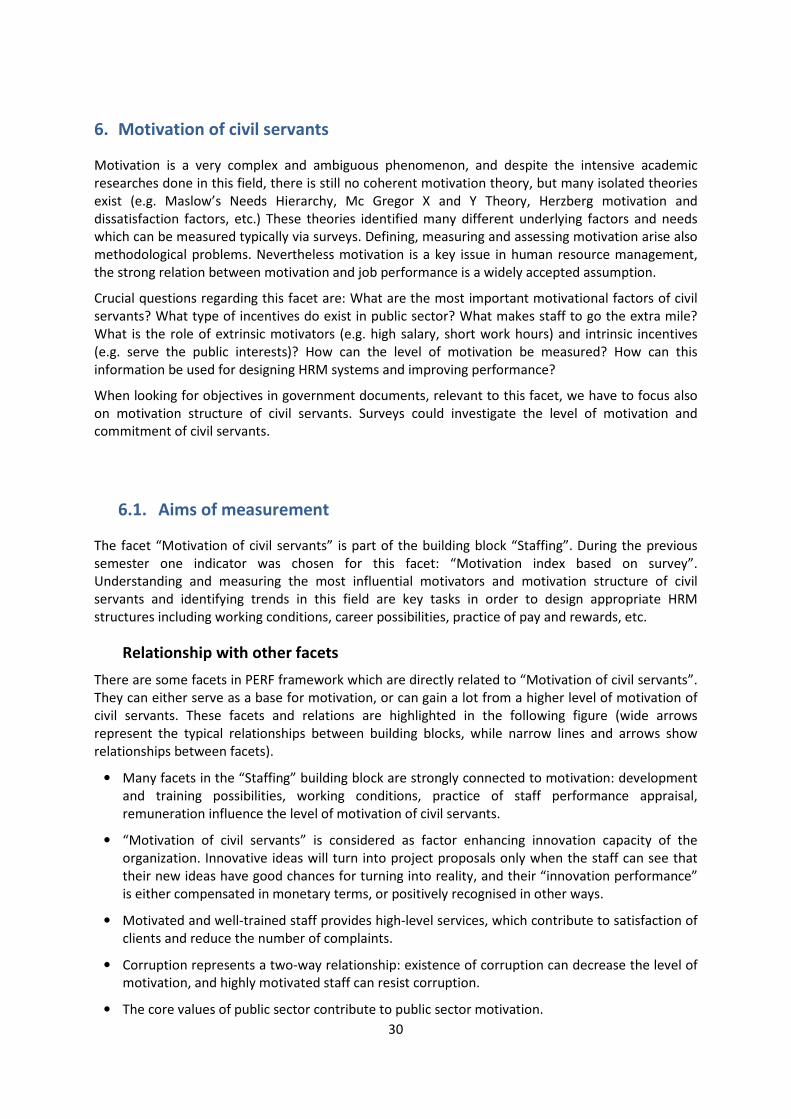
30
6. Motivation of civil servants
Motivation is a very complex and ambiguous phenomenon, and despite the intensive academic
researches done in this field, there is still no coherent motivation theory, but many isolated theories
exist (e.g. Maslow’s Needs Hierarchy, Mc Gregor X and Y Theory, Herzberg motivation and
dissatisfaction factors, etc.) These theories identified many different underlying factors and needs
which can be measured typically via surveys. Defining, measuring and assessing motivation arise also
methodological problems. Nevertheless motivation is a key issue in human resource management,
the strong relation between motivation and job performance is a widely accepted assumption.
Crucial questions regarding this facet are: What are the most important motivational factors of civil
servants? What type of incentives do exist in public sector? What makes staff to go the extra mile?
What is the role of extrinsic motivators (e.g. high salary, short work hours) and intrinsic incentives
(e.g. serve the public interests)? How can the level of motivation be measured? How can this
information be used for designing HRM systems and improving performance?
When looking for objectives in government documents, relevant to this facet, we have to focus also
on motivation structure of civil servants. Surveys could investigate the level of motivation and
commitment of civil servants.
6.1. Aims of measurement
The facet “Motivation of civil servants” is part of the building block “Staffing”. During the previous
semester one indicator was chosen for this facet: “Motivation index based on survey”.
Understanding and measuring the most influential motivators and motivation structure of civil
servants and identifying trends in this field are key tasks in order to design appropriate HRM
structures including working conditions, career possibilities, practice of pay and rewards, etc.
Relationship with other facets
There are some facets in PERF framework which are directly related to “Motivation of civil servants”.
They can either serve as a base for motivation, or can gain a lot from a higher level of motivation of
civil servants. These facets and relations are highlighted in the following figure (wide arrows
represent the typical relationships between building blocks, while narrow lines and arrows show
relationships between facets).
• Many facets in the “Staffing” building block are strongly connected to motivation: development
and training possibilities, working conditions, practice of staff performance appraisal,
remuneration influence the level of motivation of civil servants.
• “Motivation of civil servants” is considered as factor enhancing innovation capacity of the
organization. Innovative ideas will turn into project proposals only when the staff can see that
their new ideas have good chances for turning into reality, and their “innovation performance”
is either compensated in monetary terms, or positively recognised in other ways.
• Motivated and well-trained staff provides high-level services, which contribute to satisfaction of
clients and reduce the number of complaints.
• Corruption represents a two-way relationship: existence of corruption can decrease the level of
motivation, and highly motivated staff can resist corruption.
• The core values of public sector contribute to public sector motivation.
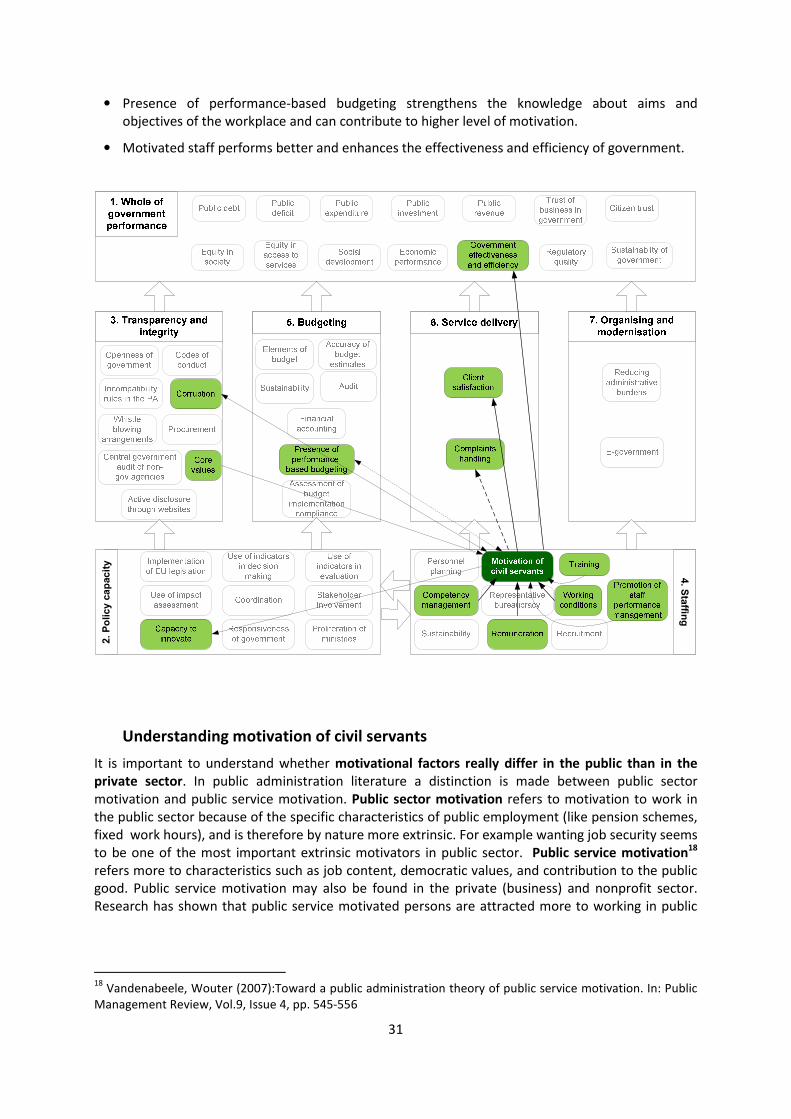
31
• Presence of performance-based budgeting strengthens the knowledge about aims and
objectives of the workplace and can contribute to higher level of motivation.
• Motivated staff performs better and enhances the effectiveness and efficiency of government.
2. P
olicy c
ap
acit
y4. S
taffin
g
Understanding motivation of civil servants
It is important to understand whether motivational factors really differ in the public than in the private sector. In public administration literature a distinction is made between public sector
motivation and public service motivation. Public sector motivation refers to motivation to work in
the public sector because of the specific characteristics of public employment (like pension schemes,
fixed work hours), and is therefore by nature more extrinsic. For example wanting job security seems
to be one of the most important extrinsic motivators in public sector. Public service motivation18
refers more to characteristics such as job content, democratic values, and contribution to the public
good. Public service motivation may also be found in the private (business) and nonprofit sector.
Research has shown that public service motivated persons are attracted more to working in public
18
Vandenabeele, Wouter (2007):Toward a public administration theory of public service motivation. In: Public
Management Review, Vol.9, Issue 4, pp. 545-556
32
service. Many academic studies confirmed that “public employees are strongly attracted by the
content of the work”19
.
If public sector motivation is different to private sector motivation, the question emerges of how
performance and motivation incentives must be structured.
A crucial question is the application of performance related pay (PRP) as incentives in governmental
organisations, too. “The main argument put forward in favour of PRP is that it acts as a motivator by
providing extrinsic rewards in the form of pay and intrinsic rewards through the recognition of effort
and achievement. PRP is also seen as helping employees to identify closely with the goals of the
organisation, leading to increased productivity, quality, flexibility and teamwork. In addition, PRP is
seen as useful in the recruitment and retention of staff. Many researchers, however, have
questioned whether PRP actually acts as a motivator, or, indeed, if money can motivate.”20
The
incentives created by different forms of pay and reward and their impact on performance can be
very complex.
In 2008 the “Final Report on the Annual Staff Opinion Survey among Commission Staff” defined
public service motivation as motivation to contribute to the common interest. Some dimensions of
public service motivation are: general public interest, self-sacrifice, democratic governance. So these
dimensions are connected to public values.
Measuring level of motivation, the impact of potential incentives and the relationship between motivation and performance raises methodological issues. Lots of indicators measure satisfaction
and other HR-related indicators are available in each Member State. During the LTHRA-meeting it
was referred to the Survey conducted by E&Y during the French presidency21
(2008) as a broad
specter framework for measuring HR policies. Another tool for measuring motivation and
performance related HR issues is the so called FED-20 in Belgium. The FED-20 is a framework of 20
indicators measuring the way how agencies are performing on 20 key issues. The baseline is that
each agency gets a report on how it is performing as such and how it is performing positioned against
a reference framework composed on what is the overall maximum value for each indicator, the
lowest value and the average value. The agency is benchmarked against the cluster, not against a
particular agency. The results should allow the agency to adapt its’ policy or policies. This type of
measurements gives opportunity to understand the context in which civil servants work and to
identify potential incentives.
6.2. Appearance and use of the facet
Many objectives templates have been sent by BLC members, which have proven that the motivation
is a key issue in human resource management. Most of them reports a motivation survey which
provides information on the key drivers of engagement (e.g.UK) and / or the level of motivation of
public employees (e.g. DK). Some typical objectives are the following:
• To provide managers and stakeholders with high quality and reliable information on the key
drivers of engagement in their organization and/or in the teams or sections of it so that they can
detect and tackle the weaknesses or flaws and build upon their strengths
19
Demmke, Christoph Dr (2005): Are civil servants different because they are civil servants? European Institute
of Public Administration, Luxembourg. Chapter 6, page 69.
20 Demmke (2005), page 76.
21 Human Resource Management Performance Assessment: analysis and operational dimensions – Survey on
public administrations of EU Member States (Nov 2008)

33
• To enhance the efficiency, effectiveness and quality of function of public services and also to
establish an integrated system of goal-setting.
• To elaborate and to introduce a competence & performance based career management system
• Improving staff training and internal communication are important objectives and actions which
can strengthen motivation and commitment of civil servants (Commission).
Besides measuring motivation in public sector and using this information in human resource
management, also some specific objectives have been presented regarding this field:
• Maintaining of motivation in spite of the economic crisis: an action plan is presented by the
Spanish member of the BLC in order to attract and keep the best professional in the public
sector.
• To attract, develop and maintain a balanced workforce. This is the main objective of the equal
opportunities strategy of the Commission. “The strategy aims to improve motivation by
transforming the Commission into a model employer, which makes the best use of the skills and
talents of its entire staff and encourages their professional aspirations.”
• To be/ to become a model employer, which makes the best use of the skills and talents of its
entire staff and encourages their professional aspirations
Based on the objectives templates sent by BLC members many extrinsic and intrinsic incentives were
identified which could influence the level of motivation of civil servants:
• Job security
• Job content
• Competence development opportunities
• Career opportunities
• Reputation (“employer branding”)
• Working environment & co-operation
• Special employment conditions
• Flexibility (e.g. possibility for floating hours, telework,…)
• Common/ general interest
• (Higher) pay
• Performance related pay (PRP) / bonuses
• Training opportunities
• The level of responsibility / responsibilities (empowerment)
6.3. Indicators
Many indicators have been suggested by the BLC members. Some surveys measure a complex set of underlying factors of motivation:
• Survey on drivers behind motivation - Danmark
• Survey on factors of satisfaction - European Commission
34
• Employee satisfaction rate - Belgium
Some indicators give the possibility to measure specific factors and characteristics of motivation :
• Internal mobility: the changes made by staff inside the organization. The rate of internal changes
of staff as an indicator of personnel mobility indirectly indicates the degree of personal
commitment to their original place within the organization, the satisfaction and motivation to
stay/to change for another section or direction as well as the functioning of the organization.
• Turn-over: the rate of outflow of staff. A high ratio indicates a high turnover which can be
monitored over certain periods.
• Absenteeism: the rate of absenteeism is an indirect indicator of satisfaction as a possible
exponent of the degree of personal satisfaction and motivation to stay/to change for another
organization as well as the functioning of the organization. Personnel absenteeism could be a
good marker. A high ratio indicates a low satisfaction/commitment that in order to be sustained
it is to be monitored over certain periods.
• Successful recruitments / length of time in position after recruitment (negative recruitment
rate): Measuring the rate of outflow of newly recruited staff within a period of 18 months after
inflow as a indicator of personnel mobility but indirectly indicates the degree of personal
commitment to the organization, the satisfaction and motivation to stay as well as the
functioning of the organization
• Motivation upon entry: reasons to joining the organisation at the time of selection, recruitment
(European Commission)
The Danish Survey (2006) goes further than just measuring motivation, it also examines its’ impact on
• Ambassador willingness
• Job satisfaction
• Job attachment degree
The European Commission has launched surveys mapping also the
• Drivers of Commitment
• Motivational factors: autonomous versus controlled employees
There’s a difference between both approaches. The Danish Survey translates the components into
correlation indexes, the European Commission asks forward questions, which at turn poses the
problem of validity and gaming.
6.4. Best practice case
Some best practice cases have been suggested by BLC participants. One of them is the Danish
approach to handle the motivation issues as a key HRM topic. Based on the Danish Survey 2006 a
total of 13,000 representatively selected persons received a questionnaire about motivation and
satisfaction. Approximately 8,600 employees from all parts of the state sector responded, which
corresponds to a response rate of 67 per cent.
Besides the drivers of motivation, their relationships and impacts were identified. The key questions
are: what is the effect of different factors on motivation, and what action areas may increase
motivation further?
The main results of the Danish Survey are the following:
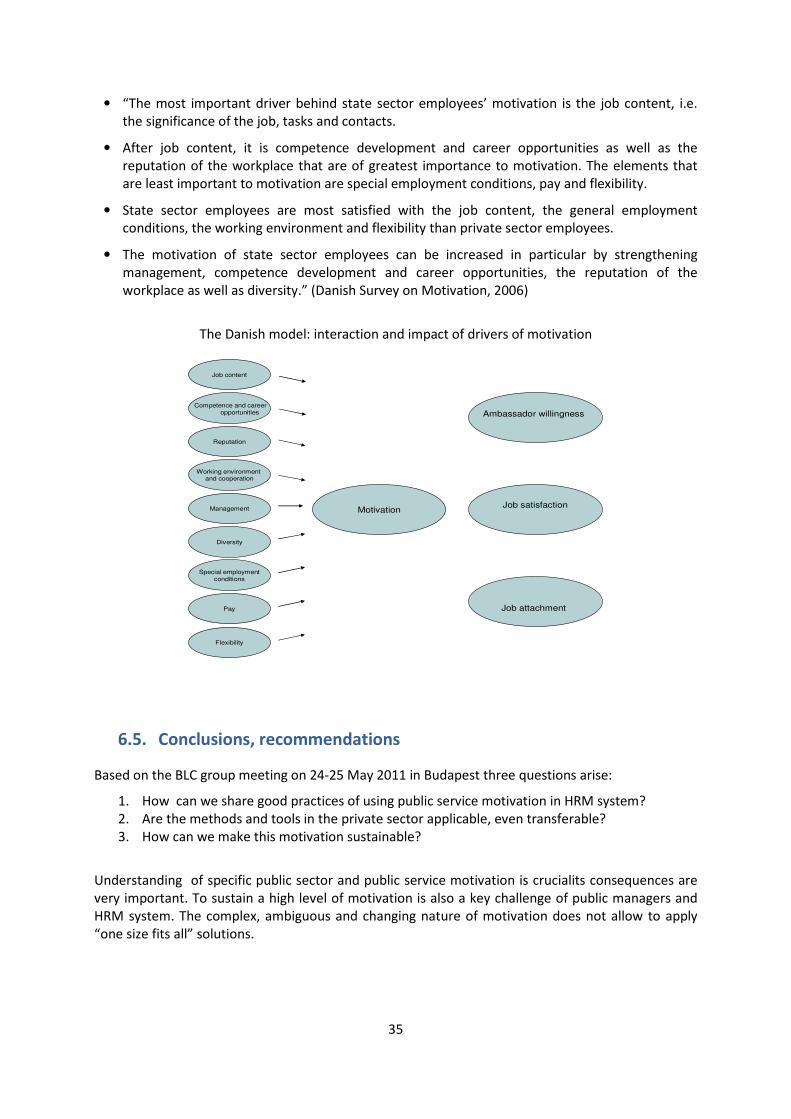
35
• “The most important driver behind state sector employees’ motivation is the job content, i.e.
the significance of the job, tasks and contacts.
• After job content, it is competence development and career opportunities as well as the
reputation of the workplace that are of greatest importance to motivation. The elements that
are least important to motivation are special employment conditions, pay and flexibility.
• State sector employees are most satisfied with the job content, the general employment
conditions, the working environment and flexibility than private sector employees.
• The motivation of state sector employees can be increased in particular by strengthening
management, competence development and career opportunities, the reputation of the
workplace as well as diversity.” (Danish Survey on Motivation, 2006)
The Danish model: interaction and impact of drivers of motivation
Motivation
Job content
Reputation
Working environment and cooperation
Management
Ambassador willingness
Job satisfaction
Diversity
Special employmentconditions
Pay
Flexibility
Job attachment
Competence and career opportunities
6.5. Conclusions, recommendations
Based on the BLC group meeting on 24-25 May 2011 in Budapest three questions arise:
1. How can we share good practices of using public service motivation in HRM system?
2. Are the methods and tools in the private sector applicable, even transferable?
3. How can we make this motivation sustainable?
Understanding of specific public sector and public service motivation is crucialits consequences are
very important. To sustain a high level of motivation is also a key challenge of public managers and
HRM system. The complex, ambiguous and changing nature of motivation does not allow to apply
“one size fits all” solutions.

36
7. Client satisfaction
The public sector is changing constantly in order to cope with a lot of challenges and to respond to
the many new needs and demands in society. The role of the citizens / clients have become of high
importance in these changes and reforms. Nowadays, citizens / clients are increasingly involved in
the policy and management cycle at different stages (design, decision, implementation, evaluation).
Therefore the topic of client satisfaction has been on European agenda for many years. The key
question for this facet, that what types of service delivery of governance, defined as the functioning
of public administration, could be considered from the viewpoint of client satisfaction. The answer is
not obvious, because public governance is about enabling rather delivering, i.e. public administration
functions well if governmental processes succeed enabling, supporting performance of other public
sectors. So we have to focus on public administration processes or services which strengthen client
focus in the whole public sector and enable better quality of public services (e.g. e-government). Or it
might be also an option to treat front line agencies or PPC partners as clients of public governance
service providers, and measure their satisfaction as an indicator of “internal service delivery
satisfaction”.
Measuring client satisfaction is an important step, but it should be also analysed how client
satisfaction is managed: besides managing services (or products) the management of expectations
and perceptions of clients is also important in this process. Therefore the use of client satisfaction
management tools (e.g. front line staff consultation and training, citizen charters, stakeholder
consultation, etc.) might be relevant for this facet.
7.1. Aims of measurement
The facet “Client satisfaction” is part of the building block of “Service delivery”. A possible indicator,
identified during the previous semester for this facet, was “% of service delivering agencies that
assess client satisfaction periodically” (e.g. through satisfaction surveys). This indicator measures the
activity of governance in supporting client orientation in the public sector.
In order to improve client / citizen focus in governance, one must have a clear view about the roles
client/citizen play in public sector, the nature of public services and factors, mechanisms influencing
client satisfaction. The European Primer on Costumer Satisfaction Management produced by the
EUPAN IPSG Working Group in 2007-2008 explains the relevance of customer focus, gives an
overview of different methods and techniques for gaining an insight in needs, expectations,
experiences, perceptions and satisfaction of the citizen/customer and gathers a lot of information
that already available on this topic in Europe (e.g. practical cases).
“Traditionally, the policy and management cycle is dominated and controlled by politicians and
administrators. […] Now, citizen / customers become co-designers, co-deciders, co-producers and co-
evaluators.” (EU Primer on Costumer Satisfaction Management, p. 31). From this perspective
measuring client satisfaction at the end of the process of the service delivery seems to be just one of
the elements of interaction with the citizen/client (as “co-evaluator”).
Expectations and perceptions have central roles in influencing client satisfaction. “In the service
quality literature, perceptions of service delivery are measured separately from customer
expectations, and the gap between the two, Perceptions – Expectations, provides a measure of
service quality and determines the level of satisfaction.” (EU Primer on Costumer Satisfaction
Management, p. 15) Having information about and impact on the client expectations is also very
important.

37
Relationship with other facets
There are some facets in PERF framework which are directly related to “Client satisfaction”. They can
either serve as a base for satisfaction, or can gain a lot from a higher level of client / citizen
satisfaction. These facets and relations are highlighted in the following figure (wide arrows represent
the typical relationships between building blocks, while narrow lines and arrows show relationships
between facets).
2.
Po
lic
y c
ap
acit
y4
. Sta
ffing
• Satisfied citizens / clients are considered as important factors enhancing trust in government.
• Handling complaints means, that the perceptions of clients are taken into account.
• Openness of government and stakeholder involvement encourages stakeholders to share their
ideas with the public administration, the citizens / clients could be involved to e.g. designing
public services, and this will result satisfaction in longer term.
• Lower level of corruption can contribute to a better view of government.
• Audits may provide recommendations about how to improve performance and service quality.
This also applies for audits of non-government agencies.
• Sustainability in financial meaning can lead to reliable services, which is a crucial factor in quality
of services.

38
• Since client perception of administrative tasks required by the government is generally bad,
reducing it will directly contribute to client satisfaction.
• Using e-government services could contribute to higher quality of services (e.g. through better
accessability).
• Inside the “Policy capacity” building block, there is a connection with the facet “Responsiveness
of government”: responsiveness is one of the widely accepted influencing factors of service
quality.
• More innovative public services can improve client satisfaction.
• Impact assessment can include measuring and evaluating client satisfaction as well.
• Motivated and well-trained staff has the skills and knowledge to provide a high-level service,
which contribute to satisfaction of clients.
Understanding client satisfaction
One of the main messages of EU Primer on Customer Satisfaction Management is that measuring
satisfaction is just one aspect of the interaction with citizens / clients, and we have to focus on
managing satisfaction at all stages of the public policy and management cycle. In order to do this, we
need to understand the client satisfaction concept. As we mentioned above, expectations and
perceptions have central roles in influencing client satisfaction.
The basic key factors most commonly seen to influence expectations are: 1) personal needs, 2)
previous experience, 3) different ways of communications (word-of-mouth, or explicit-implicit service
communication), 4) values and beliefs, 5) views about governments.
Perceptions about the quality of services are also a crucial field. Different quality dimensions (e.g.
reliability, responsiveness, accessibility, friendliness, competence, etc) have different effects on
perceptions. Some of the quality factors are so called hygiene factors: if these factors are perceived
as inadequate, then dissatisfaction will result, but any increase in performance above adequacy has
little effect on perceptions. Enhancing factors (satisfiers) have a positive effect on perceptions if they
improve performance beyond the "satisfactory" level. Critical factors can be both satisfying and
dissatisfying. Neutral factors are less sensitive to performance change.
Source: EU Primer on Customer Satisfaction Management, p. 27
39
7.2. Appearance and use of the facet
Several objectives templates have been sent by BLC members. The general objectives are either
“improving public service quality” (Italy, Lithuania), or “increasing satisfaction of clients or partners”
(Portugal, Romania, Hungary). Some programs covers the whole public administration (“the quality
standard guidelines may be applicable to every level of governance and to each policy area and type
of service”, Italy), and some of them focuses on specific public administrative services (like citizen
card in Portugal) or branches (National Unemployment Service in Hungary).
Some of the objectives templates introduce a strategic plan aiming at better quality of public
administration (Italy, Hungary), and some of them presents specific satisfaction measuring programs
and surveys (Romania, Lithuania, Hungary, Portugal). The “clients” can mean different target groups:
clients of many different administrative services provided by the state or municipalities (Lithuania),
civil servants (Romania), unemployed / job seeker people (Hungary), etc.
7.3. Indicators
Some indicators have been suggested by the BLC members. The different initiatives are very
heterogeneous and use huge number of different indicators. The most common approach is the use
of a general satisfaction surveys undertaken every (few) years:
• In Portugal the satisfaction surveys are based on the ECSI model.
• In Lithuania an indicators is calculated in every years, which measures the following factors of
service quality : 1) accessability; 2) waiting time; 3) time for the service delivering; 4) politeness;
5) providing of the necessary information; 6) communication (easy to understand); 7) time to
solve the problem; 8) satisfaction with the response and 9) quality of service in general.
• In Italy the Quality Barometer is a pilot initiatives started in 2009. It is “a composite index
designed to represent the level of actual quality of public services”. Main dimensions:
“accessibility (physical and multi-channel), timeliness, transparency and effectiveness
(completeness, compliance; reliability)”.
• In Hungary the National Employment Service calculates the Partner Satisfaction Index (P) which
is a complex indicator composed by three different indices: 1. client, 2. employer and 3.
employee satisfaction index.
• In France the Public Services Quality Barometer was introduced in 2010. It relies on 15 different
indicators reflecting the needs of the users. The results of the survey are published twice a year.
7.4. Best practice case
Best practice cases and examples are cited in the EU Primer prepared by the EUPAN IPSG Working
Group, however many of them are directed at public service delivery and not general public
administration. The Quality Barometer of public services sent by Italian BLC member focuses on
public administration. It is a pilot initiative started in July 2009, which aims at
• “the design of a shared system of actual quality indicators of public services, allowing the
comparison of service quality levels over time and among administrations;

40
• the promotion of exemplary and visible initiatives measuring service quality.” (Quality
Barometer presentation sent by Italian BLC Member)
One of the specific objectives of the Quality Barometer initiative is to develop a comparable
composite index designed to represent the level of actual quality of public services. The focus of this
initiative is he quality of public services and not client satisfaction, but the concept behind the model
is closely related the satisfaction issues as well.
The composite index has been developed in cooperation with the administrations involved in the
initiative through the selection of dimensions and indicators of actual quality. Its dimensions:
accessibility (physical and multi-channel), timeliness, transparency and effectiveness (completeness,
compliance; reliability). Some of the applied indicators: number of counters every 10.000
inhabitants; number of requests presented via web-internet; waiting time at the counter; number of
claims accepted.
The structure of the composite index
Some tools has been also developed to support the application of the Quality Barometer index:
• “a technical handbook, which explains the objectives and methodology adopted, the
dimensions and indicators of actual quality and method of their selection; the techniques for
determining the relative weights and procedures used to construct the composite index, as
well as some practical applications;
• a tool-kit, a software application accessible online, combined with a user manual, supporting
the administration in the selection of the services to be analyzed, indicators of actual quality,
identification of target values, data processing, analysis of results achieved and graphic
display.”
The Quality Barometer promotes evaluation standards and continuous quality improvement in public
organizations. It aims at collecting information that can be used by national institutions to monitor
the quality of public services and policy development, including those relating to national standards
and citizen’s charters.
41
7.5. Conclusions, recommendations
Based on the BLC meeting on 26th
May 2011 in Budapest, measuring client satisfaction is a crucial
issue in the EUPAN network. However the comparison is very difficult among services and
organizations, because a huge heterogeneity of indicators are used by the Member States.
During the BLC meeting the role of governance to strengthen client orientation in public sector has
been discussed. All members have provided the national approaches to this topic. Many countries
have no centralized approach to measure or manage client satisfaction in public sector organization.
In some countries agencies are obliged to measure client satisfaction (for example in Belgium,
Norway, France, Greece). In Finland based on the public sector costumer strategy client satisfaction
is measured at national as well as at local level. There are different practices regarding the
communication of the measured results: in some countries the results are usually not
communicated, in other MS the results of the surveys are published.

42
8. Reducing administrative burdens
Administrative burden – it is a commonly used expression in relation with bureaucracy, state and
government. In principle, every new piece of legislation and corresponding information obligation
should be backed up by thorough impact analysis, and the cost of new obligations should be lower
than the social benefit. Circumstances, however, change from time to time and some obligations
become obsolete in their original form or frequency. New technology, especially e-government
solutions provide space for simplification of administrative processes, saving time and money for all
the stakeholders. The goal of reducing administrative burdens initiates actions for continuous re-
evaluation of information obligations set up by legislation. In a bit wider sense, we can also use the
expression of “simplification” for describing these activities.
In 2007 the European Commission started an action programme, targeted at reducing administrative
burden on enterprises, resulting from EU legislation, by 25%, and encouraged member states to
initiate similar programs for the national level as well. As the strategic review states, “[s]uppressing
unnecessary administrative burdens is more important than ever in difficult economic times, when
EU businesses have fewer resources and need to invest to remain competitive.”22
This goal was
primarily related to businesses and competitiveness but several member states started programs
which were directed at citizens as well – reducing administrative burdens became general programs.
According to the EUPAN learning team, “[t]he reduction of administrative burdens for citizens is not
always a separate policy goal, but often part of a broader programme on reducing burdens of
businesses, administration, civil servants, professionals or the tax payer.”23
Administrative burden,
caused by rules of governance, over public administration (i.e. “internal administrative burden of
governance) is a much less explored area.
8.1. Aims of measurement
During the previous semester two indicators were chosen for this facet: “Time taken to pay taxes”
and “Reduction of administrative burdens”. While the first one focuses on taxation (either by
citizens, or businesses), the latter one keeps open the possibility to address any areas where
administrative burden is present. Good governance, therefore, intends to reduce present
administrative burden of all the stakeholders, and sets up guidelines for legislation in order to
precede future unnecessary administrative costs.
“Administrative costs are defined as the costs incurred by enterprises, the voluntary sector, public
authorities and citizens in meeting legal obligations to provide information on their action or
production, either to public authorities or to private parties.”24
Some administrative costs are not
imposed by legislation: there are activities which are carried out by the organizations themselves for
management purposes. Some administrative activities would be continued even if the legislative
obligations were removed since they are considered as value-added activities by the management
(e.g. accounting in businesses, maybe in a somewhat modified format). The third category of
administrative costs is administrative burden: activities belonging to this category would be ceased in
case of lack of obligation. Programs are targeting this latter category, however, from a technical
22
Reducing Administrative Burdens in the European Union, Annex to the 3rd Strategic Review on Better
Regulation, Commission Working Document, COM(2009) 16 final. 23
Report on national approaches of the EUPAN learning team on administrative burdens for citizens,
http://www.whatarelief.eu/aspx/download.aspx?file=/contents/pages/95276/eupanabltreportnationalapproa
ches2010-4.pdf 24
EU common methodology for assessing administrative costs imposed by legislation, Operational Manual
(Annex 10 to “Impact Assessment Guidelines” of the European Commission SEC(2005)791)

43
perspective it is not so straightforward to differentiate between administrative costs and burdens
when measuring those.
Relationship with other facets
There are some facets in the PERF framework which support administrative burden reduction and
there are others which gain from reduced burdens. These facets and relations are highlighted in the
following figure (wide arrows represent the typical relationships between building blocks, while
narrow lines and arrows show relationships between facets).
1. Whole of
government
performance
3. Transparency and
integrity5. Budgeting 6. Service delivery 7. Organising and
modernisation
2. P
olicy c
ap
acit
y4. S
taffin
g
Public debtPublic
deficit
Public
revenue
Public
investment
Public
expenditureCitizen trust
Trust of
business in
government
Equity in
society
Equity in
access to
services
Government
effectiveness
and efficiency
Economic
performance
Social
development
Sustainablity of
governmentRegulatory
quality
Implementation
of EU legislation
Use of impact
assessment
Proliferation of
ministries
Responsiveness
of government
Capacity to
innovate
Stakeholder
involvementCoordination
Use of indicators
in decision
making
Use of
indicators in
evaluation
Personnel
planning
Recruitment
Working
conditions
Training
Representative
bureaucracy
Motivation of civil
servants
Remuneration
Promotion of
staff
performance
management
Sustainability
Competency
management
Openness of
government
Codes of
conduct
Incompatibility
rules in the PACorruption
Whistle
blowing
arrangements
Procurement
Central government
audit of non-
gov.agencies
Core
values
Active disclosure
through websites
Elements of
budget
Accuracy of
budget
estimates
Sustainability Audit
Financial
accounting
Presence of
performance-
based budgeting
Assessment of
budget
implementation
compliance
Complaints
handling
Client
satisfaction
Reducing
administrative
burdens
E-government
• First of all, e-government services are considered as a main tool that support reducing
administrative burden: if there are more services available in electronic format, and more users
are willing to use these services, administrative burden will be lower.
• A higher level of policy capacity is definitely supporting administrative burden reductions. If
stakeholders are involved in decisions they can share their expectations and perceptions about
administrative burdens with the government.
• If responsiveness is better (decisions are followed by actions sooner), burdens can be lifted
without significant delays.
• EU legislation takes administrative burden into consideration when proposing regulation –
timely implementation can save administrative costs for the member states. (However, some
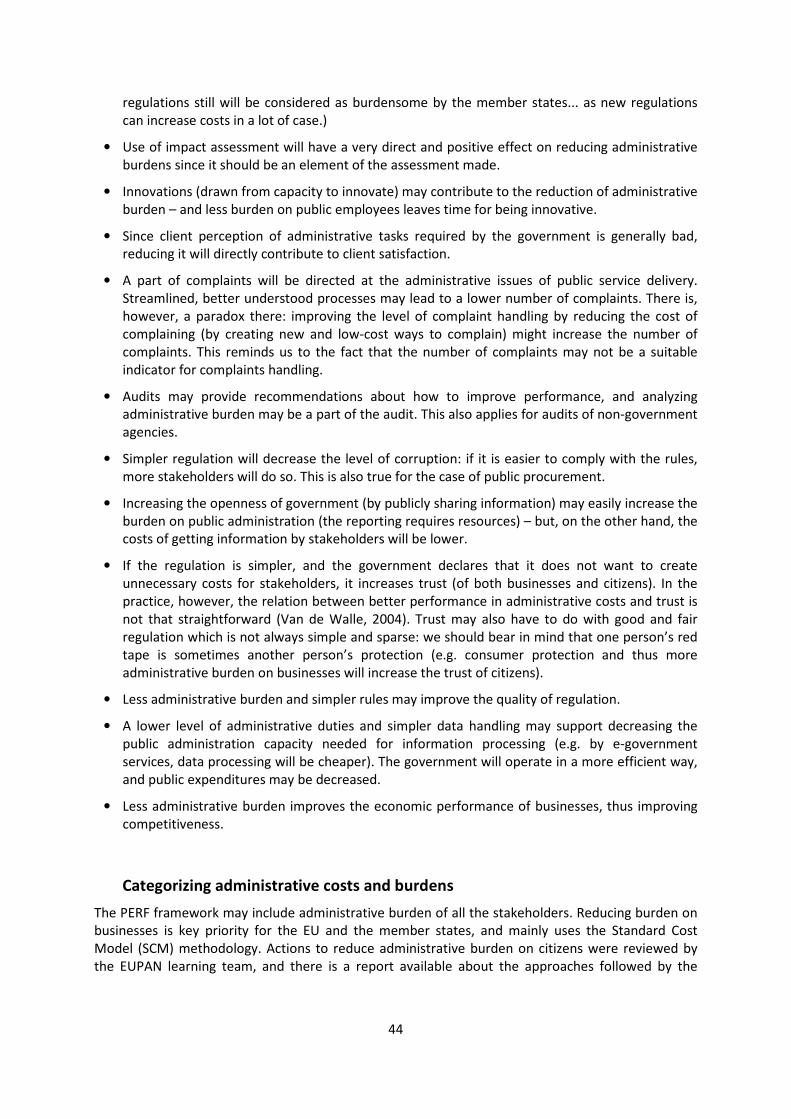
44
regulations still will be considered as burdensome by the member states... as new regulations
can increase costs in a lot of case.)
• Use of impact assessment will have a very direct and positive effect on reducing administrative
burdens since it should be an element of the assessment made.
• Innovations (drawn from capacity to innovate) may contribute to the reduction of administrative
burden – and less burden on public employees leaves time for being innovative.
• Since client perception of administrative tasks required by the government is generally bad,
reducing it will directly contribute to client satisfaction.
• A part of complaints will be directed at the administrative issues of public service delivery.
Streamlined, better understood processes may lead to a lower number of complaints. There is,
however, a paradox there: improving the level of complaint handling by reducing the cost of
complaining (by creating new and low-cost ways to complain) might increase the number of
complaints. This reminds us to the fact that the number of complaints may not be a suitable
indicator for complaints handling.
• Audits may provide recommendations about how to improve performance, and analyzing
administrative burden may be a part of the audit. This also applies for audits of non-government
agencies.
• Simpler regulation will decrease the level of corruption: if it is easier to comply with the rules,
more stakeholders will do so. This is also true for the case of public procurement.
• Increasing the openness of government (by publicly sharing information) may easily increase the
burden on public administration (the reporting requires resources) – but, on the other hand, the
costs of getting information by stakeholders will be lower.
• If the regulation is simpler, and the government declares that it does not want to create
unnecessary costs for stakeholders, it increases trust (of both businesses and citizens). In the
practice, however, the relation between better performance in administrative costs and trust is
not that straightforward (Van de Walle, 2004). Trust may also have to do with good and fair
regulation which is not always simple and sparse: we should bear in mind that one person’s red
tape is sometimes another person’s protection (e.g. consumer protection and thus more
administrative burden on businesses will increase the trust of citizens).
• Less administrative burden and simpler rules may improve the quality of regulation.
• A lower level of administrative duties and simpler data handling may support decreasing the
public administration capacity needed for information processing (e.g. by e-government
services, data processing will be cheaper). The government will operate in a more efficient way,
and public expenditures may be decreased.
• Less administrative burden improves the economic performance of businesses, thus improving
competitiveness.
Categorizing administrative costs and burdens
The PERF framework may include administrative burden of all the stakeholders. Reducing burden on
businesses is key priority for the EU and the member states, and mainly uses the Standard Cost
Model (SCM) methodology. Actions to reduce administrative burden on citizens were reviewed by
the EUPAN learning team, and there is a report available about the approaches followed by the
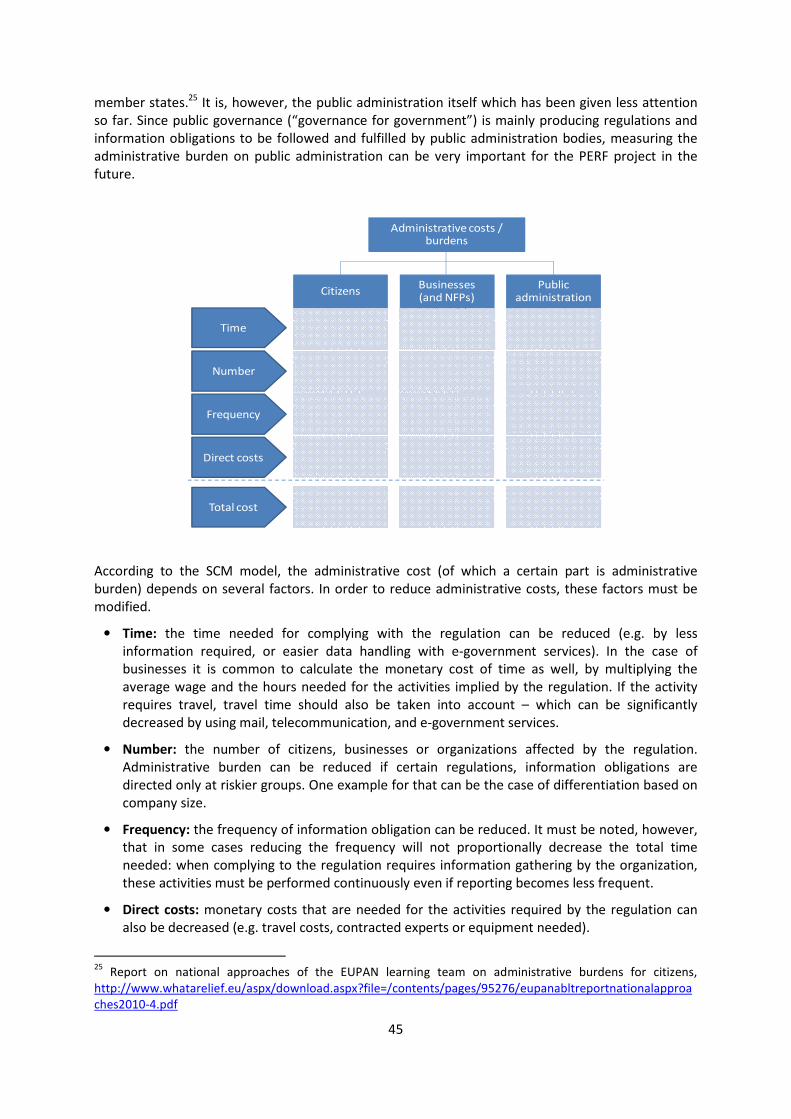
45
member states.25
It is, however, the public administration itself which has been given less attention
so far. Since public governance (“governance for government”) is mainly producing regulations and
information obligations to be followed and fulfilled by public administration bodies, measuring the
administrative burden on public administration can be very important for the PERF project in the
future.
CitizensBusinesses (and NFPs)
Public administration
Administrative costs / burdens
Time
Number
Frequency
Direct costs
Total cost
According to the SCM model, the administrative cost (of which a certain part is administrative
burden) depends on several factors. In order to reduce administrative costs, these factors must be
modified.
• Time: the time needed for complying with the regulation can be reduced (e.g. by less
information required, or easier data handling with e-government services). In the case of
businesses it is common to calculate the monetary cost of time as well, by multiplying the
average wage and the hours needed for the activities implied by the regulation. If the activity
requires travel, travel time should also be taken into account – which can be significantly
decreased by using mail, telecommunication, and e-government services.
• Number: the number of citizens, businesses or organizations affected by the regulation.
Administrative burden can be reduced if certain regulations, information obligations are
directed only at riskier groups. One example for that can be the case of differentiation based on
company size.
• Frequency: the frequency of information obligation can be reduced. It must be noted, however,
that in some cases reducing the frequency will not proportionally decrease the total time
needed: when complying to the regulation requires information gathering by the organization,
these activities must be performed continuously even if reporting becomes less frequent.
• Direct costs: monetary costs that are needed for the activities required by the regulation can
also be decreased (e.g. travel costs, contracted experts or equipment needed).
25
Report on national approaches of the EUPAN learning team on administrative burdens for citizens,
http://www.whatarelief.eu/aspx/download.aspx?file=/contents/pages/95276/eupanabltreportnationalapproa
ches2010-4.pdf
46
In the case of businesses it is common that the total cost is calculated in monetary terms (the cost of
the time used is also translated to money). It is less used in the case of citizens (since valuing a hour
spent with the activity is not so straightforward, and we do not know whether time saved would be
used for, for example, additional work and value creating activities, or not) but can be easily used in
the case of public organizations where the value of the time of the employees can be measured by
their wages.
Ratio of administrative costs is often used in certain policy areas, too, where this indicator reflects
the cost of “running the system” – e.g. the ratio of health care administration costs and total health
care expenditure is considered as an indicator of efficiency of health system governance. This
concept is different from the SCM concept since it does not measure the costs incurred by legislation
to stakeholders but rather differentiates between providers (where the public service is actually
provided for clients) and administrators (all the organizations which regulate or contract the
services). In this respect, some of the costs incurred by a health insurance company will be
administrative burden (since they are subject to regulations), and all the operating costs (other than
those which are for health service purchase) will be considered as part of the administrative cost of
providing health service.
8.2. Appearance and use of the facet
Several objectives templates have been sent by BLC members. Reducing administrative burden is
universal: “cutting of the red tape brings a significant reduction of both time and money costs for
businesses, citizens, public administration, NGOs, specific professional or social groups.” (Czech
Republic). Different target groups can be part of different programs (like in Hungary) but
administration burden reduction can be a program overarching the sector (like the Simplex program
in Portugal, however there is a separate Simplex program for municipalities). It is general to include
central administration but municipalities and local governments, to a more limited extent, are also
common targets of reductions.
Reducing administrative burden of businesses is universally justified by improving competitiveness.
“Public administration has too much bureaucracy and formalities for citizens and businesses. This is a
problem with major impacts for businesses, for example, because it can move away the investors and
entrepreneurs.” (Portugal) “Less bureaucracy needs a lower number of public servants, saving money
for the state budget, which, in turn, lead to lower level of taxes, saving money for the enterprises as
well. Lower administrative burden for enterprises will directly save money for them, too, thus
increasing their international competitiveness.” (Hungary) Sometimes, a smaller part of businesses
(for example, SMEs) can serve as a special stakeholder group in burden reduction.
There are several programs for citizens as well. The EUPAN learning team overviewed the situation in
member states.
Public administration is considered as a target group in the Portugal Simplex program.
Reducing administrative costs is usually defined as a general objective (i.e. total administrative costs
must be decreased by 25%). Administrative cost of certain regulations can also be analyzed, and it
might be a requirement to measure administrative burden of any proposed legislation (like in the
Netherlands). It is universal that the programs are approved by the government.
Cutting the red tape is a continuous activity, requiring long-lasting attention. For example, “after
setting 25% reduction targets (since 2003) the new Dutch government has set an additional
reduction target (5% yearly for national and local regulation).” (the Netherlands)
A limitation of administrative burden reduction may be that, in several cases, it concentrates too
much on legislation – and how changes in legislation can result in reductions. However, for a
47
sustainable public sector, a more holistic approach is needed: beyond the legislation other rules,
behavioural patterns and non-value-generating activities must also be targeted. It might be not
enough to describe what should happen according to the law but it must also be examined what
actually happens in the field.
8.3. Indicators
Based on the indicator templates received from BLC members, the Standard Cost Model (SCM) is the
golden standard in measuring administrative burden. The actual measurement can be directed at:
• administrative burden per GPD;
• administrative cost in monetary terms;
• reduction of administrative cost (%).
Measurement efforts can be directed at the components of the SCM model as well: for example, in
Portugal:
• Waiting time in queue,
• Response waiting time of the public services,
• Number of travels, and
• Number of documents delivered.
An indicator can be constructed to reflect the burden of a selected target group or burden caused by
a certain policy area: for example, “Administrative cost due to tax administration in SMEs / Net
revenue of SMEs (%)”. Anyway, taxation is a popular area for looking for administrative cost
reductions.
The measurement uses several sources of information: available statistical data and annual reports
can inform one about the number of and the directs costs incurred by the stakeholders who are
affected by the regulation. The time needed for the activities can we measured by interview with
subjects concerned, citizen panels, or expert assessment.
In the framework of the continuous Portugal Simplex program, the evaluation is made two times:
one before the simplification project and one after. Where there was a baseline measurement, the
progress must be checked in a regular interval: it is, for example, followed in 6-month intervals in the
Czech Republic.
A problem of the SCM model that it is mainly suitable for businesses and citizens but the burden
generated by governance over public administration cannot be determined that way. If there are
changes in the regulation, the administrative burden can even increase for a short period – due to
the time needed to adapt to the new processes. The SCM model ignores this fact. Another limitation
is that a significant part of administrative burden, especially for citizens, is a perception. “Sometimes
a difference of 5 minutes x a large Q can be on paper a large difference, but isn’t noticed by the
public.” (the Netherlands)
Using SCM measurement may cause a significant bias in decision making. Since it focuses on the side
of costs incurred, decision makers may tend to concentre on cost decreases too heavily, forgetting
about the basic principle: costs of information gathering should be evaluated against benefits of
having the information for decision making. It might happen that we concentrate on decreasing the
administrative cost of, for example, a piece of information obligation while the obligation itself does
not create any value so it should be rather demolished. Or, sometimes, requiring even more
information would be justified by taking the benefits into account. The methodological problem

48
here, however, is that actual or potential benefits can hardly be calculated in monetary terms, thus
comparison with the administrative cost is not simple. Still, the principle of comparing standard costs
and benefits should be used as widely as possible for decision making support.
An other danger of relying too much on SCM is that sometimes administrative costs might not be
reduced in total but simply shifted to other players. Reducing administrative costs of businesses
should not be reached at a price of significant increase on the side of citizens or the public
administration. The best cases of simplification should truly mean simplification for everybody; this
way, the focus of analysis should be on mapping (and simplifying) the process as a whole, instead of
measuring only the administrative costs.
8.4. Best practice cases
Best practice cases and examples are available in a large number in public reports. It can be
considered as a general best practice where measuring administrative costs is a prerequisite during
the legislative process (like in the Netherlands).
Specific programs
There are some countries which set up central programs for administrative burden reduction. In the
Netherlands, it is mainly inside public administration but ties to specific professions. Portugal also has
a general program, called “Simplex”26
. It should be however stressed that administrative burden
reduction is rather about using the principle in a good way than defining a framework program. A
specific program is not necessary when the principle is deeply built into the thinking of public
administration.
“The Simplex Program is Portugal’s national administrative and legislative program towards the
reduction of administrative burdens on businesses as well as citizens. It enjoys strong political
support at the highest level since it is under the direct responsibility of the Prime Minister. It is based
on annual action plans which are redefined from one year to the next.”27
Video demonstration of administrative processes
A good practice about how to create focus on the administrative process as a whole (instead of cost
elements) is a tool France uses. Clients are accompanied by a video camera through the process, and
these real life examples serve as a good basis for demonstrating the need for well-thought
simplification.
8.5. Conclusions, recommendations
Measuring administrative costs and burdens of businesses has a several-year-long tradition in the EU,
and has been in the focus of burden reduction for years. Several members states of the EUPAN
network, however, have already initiated programs directed at reducing administrative burdens of
citizens as well. Reducing “internal administrative burden” of the public administration, i.e. rules of
governance that create administrative costs for other public institutions, is much less developed
concept. In the future, it can be an interesting area of inspection for the EUPAN network.
The term of “administrative burden” focuses too much on the costs incurred by the activities that
must be carried out in order to comply with the regulation. Using the term of “simplification” could
be better since it underlines that a process as a whole should be in the focal point of analysis, and the
26
http://www.simplex.pt 27
Simplex Public Consultation and Simplex Idea, Nomination for the 8th Edition of the United Nations Public
Services Awards

49
analysis should go beyond the evaluation of the legislation, by incorporating other rules, typical
behaviours and every type of non-value-creating activities. Calculated standard costs should be
evaluated against the benefits (which can be more challenging to quantify), and attention should be
paid to that administrative burden reduction will not result in cost shifting but true simplification.

50
9. Annexes
See separate file for annexes.