performance evaluation of low exergy systems …
TRANSCRIPT
0
PERFORMANCE EVALUATION OF LOW EXERGY SYSTEMS DEPICTING
DECENTRALIZED DEDICATED OUTDOOR AIR SYSTEM COUPLED WITH
RADIANT COOLING IN THE TROPICS
ESMAIL MAHMOUDI SABER
(M. Eng.)
A THESIS SUBMITTED
FOR THE DEGREE OF DOCTOR OF PHILOSOPHY
DEPARTMENT OF BUILDING
NATIONAL UNIVERSITY OF SINGAPORE
2016
1
DECLARATION
I hereby declare that the thesis is my original work and it has been written by me in its
entirety. I have duly acknowledged all the sources of information which have been used in the
thesis.
This thesis has also not been submitted for any degree in any university previously.
_________________
Esmail Mahmoudi Saber
13 July 2016

2
ACKNOWLEDGMENT
I wish to express my sincere gratitude to my supervisors Prof. Kwok Wai THAM and
Prof. Hansjürg Leibundgut for sharing their expertise and providing guidance throughout my
PhD. I thank the managers, principal investigators, collaborators and researchers at Singapore-
ETH centre (SEC) and National University of Singapore (NUS) who made the collaboration
between future cities laboratory in SEC and department of building in NUS possible. The list
includes but not limited to Dr. Remo Burkhard, Prof. Arno Schlüter, Prof. Forrest Meggers,
Prof. Chandra Sekhar, Prof. David Kok Wai Cheong, Dr. Matthias Mast, Dr. Marcel
Bruelisauer, Dr. Rupesh Iyengar, Dr. Kian Wee Chen, and Mr. Cheng Li. My sincere thanks
also goes to Ms. Wu Wei Yi, Mr. Tan Cheow Beng, Mr. Komari Bin Tubi, the laboratories’
supervisors in school of design and environment at NUS for their cooperative attitude and
helpful advice. Last but not least, I would like to thank my parents, siblings and friends who
made my life in Singapore more pleasurable and memorable.
_________________
Esmail Mahmoudi Saber
13 July 2016

3
Table of Contents
Summary ................................................................................................................................... 5 List of tables ........................................................................................................................... 7
List of figures ......................................................................................................................... 8 List of abbreviations ............................................................................................................ 13 List of symbols...................................................................................................................... 16
Chapter 1. Introduction ........................................................................................................ 18 1.1 Background .................................................................................................................... 18
1.1.1 Building ACMV system in the tropics ..................................................................... 18 1.1.2 Exergy and building ................................................................................................ 21 1.1.3 Emerging cooling systems....................................................................................... 23 1.1.4 High temperature cooling ....................................................................................... 26
1.2 Conventional vs low exergy cooling systems ................................................................. 29 1.2.1 Conventional all air system .................................................................................... 30 1.2.2 Split AC systems ...................................................................................................... 32
1.2.3 Low exergy cooling system ..................................................................................... 33 1.3 Scope and objectives of study ........................................................................................ 36 1.4 Thesis structure .............................................................................................................. 39
Chapter 2. Literature review ................................................................................................ 41
2.1 High temperature cooling systems ................................................................................. 41 2.2 Thermal comfort and indoor air quality in the tropical context .................................... 52
2.3 Indoor air CFD simulation ............................................................................................ 59 2.4 Identification of knowledge gap ..................................................................................... 63 2.5 Research questions and hypothesis ................................................................................ 66
Chapter 3. Research methods ............................................................................................... 68
3.1 Research design ............................................................................................................. 68 3.2 BubbleZERO as test bed of low exergy systems............................................................. 71 3.3 Environmental parameters and air pollutants measurements ....................................... 76
3.4 DDOAS-RCP system and space control and monitoring .............................................. 80 3.5 Thermal comfort and Indoor air quality criteria ........................................................... 86
3.6 Ventilation effectiveness and contaminant distribution ................................................. 89
3.7 CFD simulation of indoor air flow ................................................................................ 93 3.8 Integration with low temperature lift chillers ................................................................ 99
3.9 Energy/Exergy saving potentials ................................................................................. 101 Chapter 4. Results ................................................................................................................ 105
4.1 Decentralized air supply units ..................................................................................... 105
4.2 Radiant cooling panel .................................................................................................. 117
4.3 DDOAS combined with RCP ....................................................................................... 124
4.4 Thermal comfort and indoor air quality ...................................................................... 133 4.5 Ventilation effectiveness analysis ................................................................................ 139
4.6 Uncertainty analysis .................................................................................................... 143 4.7 CFD results .................................................................................................................. 145 4.8 Integration with low lift chillers .................................................................................. 156
4.9 Energy/Exergy saving potentials ................................................................................. 161 Chapter 5. Discussions ......................................................................................................... 165
5.1 Decentralized air supply units ..................................................................................... 165 5.2 Radiant cooling panel .................................................................................................. 167 5.3 DDOAS combined with RCP ....................................................................................... 169 5.4 Thermal comfort and indoor air quality ...................................................................... 171
5.5 Ventilation effectiveness analysis ................................................................................ 173
4
5.6 CFD simulations .......................................................................................................... 174
5.7 Integration with low lift chillers .................................................................................. 177 5.8 Energy/Exergy saving potentials ................................................................................. 178 5.9 Selected design/control strategy .................................................................................. 179
Chapter 6. Conclusions and future work ........................................................................... 183
6.1 Conclusions .................................................................................................................. 183 6.2 Contributions to the body of knowledge ...................................................................... 189 6.3 Limitations and recommendations ............................................................................... 190
Bibliography ......................................................................................................................... 194 Appendices ............................................................................................................................ 201
BubbleZERO blower door test ........................................................................................... 201 Scientific publications from the PhD thesis ....................................................................... 208
5
Summary
The energy consumption of buildings’ air conditioning systems is of prime
concern in tropical cities where cooling and ventilation are needed all year
round in commercial buildings. The conventional air conditioning system in
Singapore commercial buildings is the central all air system. The Low exergy
concept in the tropics promotes high temperature cooling strategy using raised
chilled water temperature (16 °C) compared to the conventional design (6 °C).
This scheme could be a more energy efficient design compared to the all air
system, considering the facts that less energy is required for providing the
raised chilled water temperature and water is a more efficient medium for heat
exchange compared to air. A decentralized dedicated outdoor air system
coupled with radiant ceiling panel (DDOAS-RCP) has been designed based on
the low exergy concept for tropical buildings. This design aims to engage water
more as a medium for cooling and brings chilled water closer to the
conditioned space. Decentralized air supply units are embedded into structure
of building to take outdoor air directly from façade with the least path-distance
and fan energy use. These units provide dehumidified and cooled air into the
indoor space and satisfy the ventilation requirement of space. Radiant cooling
panels are installed near the ceiling and satisfy the remaining part of sensible
load. The main objective of this PhD thesis was to evaluate the performance of
a DDOAS-RCP in the tropical context where temperature and humidity is high
all year round. The experimental setup was conducted in the BubbleZERO
laboratory in which the above-mentioned low exergy cooling systems have
been installed. The results of the environmental measurements have shown that

6
DDOAS-RCP can provide healthy and comfortable indoor space in tropical
buildings under different indoor/outdoor scenarios. Nevertheless, more
sophisticated control schemes compared to conventional design need to be
implemented for operation of the air-water system to avoid condensation on
radiant cooling panels. This new conditioned space has lower air movement
and mean radiant temperature compared to that for the all air design. With floor
supply-ceiling exhaust distribution of DDOAS-RCP, there is approximately a 2
°C vertical thermal stratification in the space and there could be a cold feet
concern near floor diffusers. Moreover, ventilation effectiveness indices of
DDOAS-RCP with floor supply-ceiling exhaust distribution strategy were
found to be close to that in a mixing strategy. With regards to the water based
system operation, non-uniformity of radiant panel surface temperature was
observed in which panel areas in contact with chilled water pipes were up to 3
°C colder than other surface areas. With the installed specification of radiant
panels in the BubbleZERO, the contribution of panels in satisfying the cooling
load of space ranged between 20 to 30 % from morning to afternoon. The
results of CFD simulations revealed that the cooling capacity of the panel drops
at the rate of 10 W/m2 per 1 °C increase of average panel surface temperature.
The results of building energy simulation for a hypothetical one-storey building
showed that annual energy saving of this low exergy design compared to the all
air VAV system is estimated to be in the range of 10 to 18 %. Based on results
of this thesis, collections of system components and control strategies were
suggested for actual implementation and operation of high temperature cooling
systems in tropical buildings.

7
List of tables
Table 1 List of reported studies in the literature on high temperature cooling
systems applications in buildings..................................................................... 49
Table 2 List of reported studies in the literature on thermal comfort sensation
of occupants in warm and humid climates ...................................................... 56
Table 3 Performance metrics and indices employed in this research ............. 70
Table 4 Sampling design plan of experimental setup in the BubbleZERO for
environmental parameters and air pollutants ................................................ 78
Table 5 Main system related parameters in DDOAS-RCP design .................... 83
Table 6 Main space related parameters in DDOAS-RCP design ...................... 84
Table 7 Whole space and local thermal comfort criteria relevant to operation
of high temperature cooling system ................................................................ 87
Table 8 Indoor air quality criteria relevant to operation of high temperature
cooling system ................................................................................................. 88
Table 9 Multiple linear regression analysis for dependent variable of
decentralized air supply unit capacity ........................................................... 114
Table 10 Multiple linear regression analysis for dependent variable of
decentralized air supply unit off coil temperature ........................................ 115
Table 11 Multiple linear regression analysis for dependent variable of radiant
panel capacity ................................................................................................ 123
Table 12 Multiple linear regression analysis for dependent variable of indoor
temperature ................................................................................................... 132
Table 13 Measuring instruments and their technical specifications and
uncertainties ................................................................................................... 143
Table 14 Propagated uncertainties in the introduced dependent variables .... 145
Table 15 Measured and simulated temperatures and percentage error of CFD
predictions compared to measured data at several points in the space ...... 146

8
List of figures
Figure 1 The monthly variation of temperature and dew point for three cities
of Singapore (average of 1956-2015), Phoenix (average of 1948-2015) and
Hanoi (average of 1959-2015) (WeatherSpark, 2015) .................................... 21
Figure 2 Sources with same amount of energy but different amount of exergy
(IEA ECBCS Annex 37, 2003, p. 37) ................................................................... 22
Figure 3 chilled ceiling panel combined with dehumidified ventilation makeup
air (Dieckmann et al., 2004) ............................................................................. 28
Figure 4 water pipes in slab cooling system (Sastry and Rumsey, 2014) ........ 28
Figure 5 A passive chilled beam in operation (Rumsey and Weale, 2007)...... 28
Figure 6 An active chilled beam in operation (Alexander and O’Rourke, 2008)
.......................................................................................................................... 29
Figure 7 Schematic of VAV system without reheat in Singapore office
buildings ........................................................................................................... 31
Figure 8 Infrared image of an interior office space with central all air VAV
system .............................................................................................................. 32
Figure 9 Indoor and outdoor units as well as infrared image of an implemented
case of split AC system .................................................................................... 33
Figure 10 Schematic of decentralized DOAS combined with radiant ceiling
panel ................................................................................................................. 35
Figure 11 The BubbleZERO (zero emission research operation) laboratory
located near NUS campus ................................................................................ 36
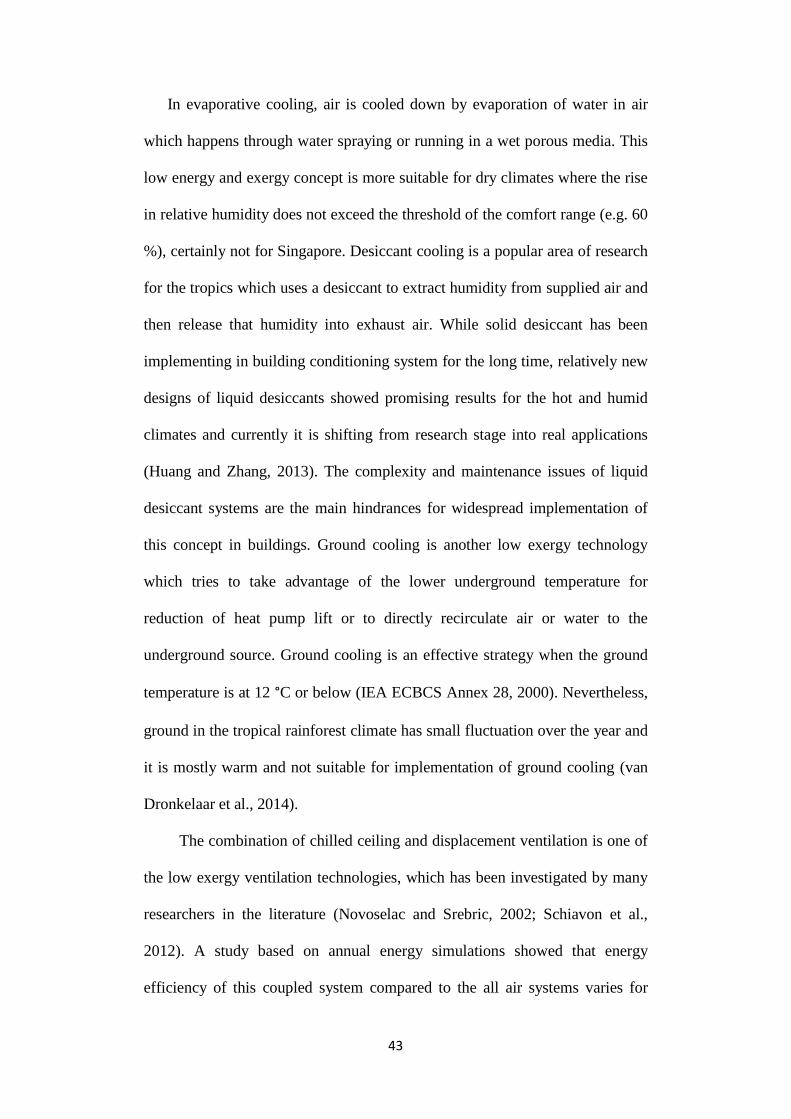
Figure 12 Impact of raising the evaporative temperature on refrigeration cycle
diagram (Doyon, 2008) .................................................................................... 52
Figure 13 PhD thesis areas ............................................................................... 66
Figure 14 PhD thesis research workflow ......................................................... 69
Figure 15 Infrared image of the BubbleZERO laboratory located in outdoor
space (red points below the container are the air compressor and its
connections to the inflated air skin façade) ...................................................... 73
Figure 16 Decentralized air supply units and radiant ceiling panel in the
BubbleZERO.................................................................................................... 74
Figure 17 Schematic diagram of DDOAS-RCP installed in the BubbleZERO
.......................................................................................................................... 75
Figure 18 Illustration of sample points and seated occupants during
experiments ...................................................................................................... 77
Figure 19 Onset HOBO data loggers U12 placed at three different heights of
0.1 m, 1 m, 1.8 m for measurement of temperature and humidity................... 80
9
Figure 20 Schematic of sensor locations and types on DDOAS-RCP
components ...................................................................................................... 82
Figure 21 A custom-designed air flow hood for measurement of air flow rate
from diffusers ................................................................................................... 85
Figure 22 Setup of ventilation effectiveness experiments including sample
points ................................................................................................................ 91
Figure 23 Sample points placed in different locations inside the BubbleZERO
for ventilation effectiveness analysis of DDOAS-RCP ................................... 91
Figure 24 Sample points at different locations and heights inside the
BubbleZERO.................................................................................................... 95
Figure 25 Coarse tetrahedral cell volumes (355 K) ......................................... 96
Figure 26 Fine tetrahedral cell volumes (1467 K) ........................................... 96
Figure 27 Ideal Carnot and reverse Carnot cycles in Temperature-Entropy
diagram .......................................................................................................... 100
Figure 28 Floor layout of the simulated hypothetical office building in
Singapore ....................................................................................................... 102
Figure 29 Three-dimensional geometry of the hypothetical one-storey office
building .......................................................................................................... 102
Figure 30 A typical layout of an all air ACMV system (Green lines are supply
ducts, red lines are return ducts) .................................................................... 103
Figure 31 A suggested ACMV layout for implementation of DDOAS-RCP in
the building (green boxes are decentralized units, blue boxes are radiant
panels, green lines are supply ducts, green arrows are outdoor air points and
red arrows are exhaust points) ....................................................................... 104
Figure 32 Two arrangements (left-arrangement A, right-arrangement B) of
three heat exchangers inside the units ......................................................... 106
Figure 33 Off coil air condition of decentralized air supply units with different
heat exchanger (HX) arrangements ............................................................... 107
Figure 34 Daily profile of decentralized units’ capacity caused by fluctuation
of outdoor air condition and supply water temperature ................................. 108
Figure 35 Pool of sampled decentralized unit capacity and supplied water
temperature .................................................................................................... 110
Figure 36 Pool of sampled decentralized unit off coil temperature and supplied
water temperature........................................................................................... 110
Figure 37 Pool of sampled decentralized air supply unit capacity and air flow
rate.................................................................................................................. 112
Figure 38 Pool of sampled decentralized air supply unit off coil temperature
and air flow rate ............................................................................................. 112
Figure 39 Air flow rate of unit in terms of fan speed level ............................ 113
Figure 40 Pool of sampled decentralized air supply unit capacity and outdoor
temperature .................................................................................................... 113
10
Figure 41 Infrared image of floor diffuser connected to decentralized air
supply units within the concrete .................................................................... 116
Figure 42 Erosion of fan blades inside the air supply units after three years of
operation ........................................................................................................ 117
Figure 43 Erosion of filter sheet inside the air supply units after one year of
operation ........................................................................................................ 117
Figure 44 Infrared image of radiant cooling panel in the conditioned laboratory
........................................................................................................................ 119
Figure 45 Measured temperature distribution on the ceiling panel surface 120
Figure 46 Infrared image of radiant cooling panel together with human body
skin ................................................................................................................. 120
Figure 47 Daily profile of radiant cooling panel unit capacity caused by
fluctuation of outdoor air temperature and supply water temperature ........... 121
Figure 48 Pool of sampled radiant panel unit capacity and outdoor temperature
........................................................................................................................ 122
Figure 49 Pool of sampled radiant panel unit capacity and water supply
temperature .................................................................................................... 123
Figure 50 Condensation pattern on the radiant cooling panel when air system
is switched off ................................................................................................ 124
Figure 51 Measured temperatures at different height levels inside the space
and outdoor during reduction of space ventilation rate (0.72 to 0.44 L/s/m2)
........................................................................................................................ 126
Figure 52 Variation of dry bulb, mean radiant, operative and dew point
temperatures during a typical day .................................................................. 127
Figure 53 Ratio of sensible cooling and latent cooling capacities provided by
air supply units and panel as well as sensible heat ratio during a typical day
........................................................................................................................ 128
Figure 54 Pool of sampled indoor temperature and outdoor temperature ...... 129
Figure 55 Pool of sampled indoor dew point temperature and outdoor
temperature .................................................................................................... 130
Figure 56 Pool of sampled indoor temperature and decentralized unit water
supply temperature ......................................................................................... 130
Figure 57 Pool of sampled indoor dew point temperature and decentralized
unit water supply temperature ........................................................................ 131
Figure 58 Pool of sampled indoor temperature and panel water supply
temperature .................................................................................................... 131
Figure 59 Calculated daily PMV in the BubbleZERO under fixed operational
settings of system ........................................................................................... 135
Figure 60 Carbon dioxide concentrations for five considered ventilation rates
and threshold value set by local standard SS 554 .......................................... 136
11
Figure 61 Range and average of CO2 concentration for transitional occupancy
........................................................................................................................ 137
Figure 62 Spatial variation of carbon dioxide in space in order of distance from
occupants........................................................................................................ 138
Figure 63 Measured SF6 concentration and interpolated curve for a SF6 step
down tracer gas decay test ............................................................................. 140
Figure 64 Measured SF6 concentration and interpolated curves in the
logarithmic scale ............................................................................................ 141
Figure 65 Calculated air change efficiency (ACE) and local air change index
(LACI) for five considered ventilation rates .................................................. 142
Figure 66 Calculated contaminant removal effectiveness for five considered
ventilation rates .............................................................................................. 142
Figure 67 Predicted thermal stratification with different mesh densities and
turbulence models vs measured data at point C in centre of laboratory ..... 148
Figure 68 Predicted air velocity pattern near diffusers ................................. 149
Figure 69 Predicted temperature distribution near diffusers ....................... 150
Figure 70 Predicted air velocity pattern near human body ........................... 151
Figure 71 Predicted temperature distribution near human body ................. 151
Figure 72 Velocity vectors in the BubbleZERO scaled by velocity magnitude
and colored by temperature .......................................................................... 152
Figure 73 Radiant flux of cooling panel for various panel surface
temperatures under area-weighted average uncooled surfaces temperature
(AUST) of 23.5 °C ............................................................................................ 154
Figure 74 Predicted air temperature for various panel surface temperatures
under area-weighted average uncooled surfaces temperature (AUST) of 23.5
°C .................................................................................................................... 155
Figure 75 Increase in radiant flux compared to panel off scenario for different
human body segments ................................................................................... 156
Figure 76 COP of ideal Carnot cycle and a small size chiller at evaporative
temperature of 5 °C ........................................................................................ 158
Figure 77 COP of ideal Carnot cycle, low lift chiller and two typical air
cooled/water cooled chillers at evaporative temperature of 15 °C ................ 160
Figure 78 Exergetic efficiency of the low lift chiller and the two typical air
cooled / water cooled chiller at evaporative temperature of 15 °C ................ 161
Figure 79 Monthly electricity consumption of the simulated one-storey
building for different stacks of building services .......................................... 162
Figure 80 predicted annual energy saving of high temperature cooling for the
hypothetical one-storey building .................................................................... 164
Figure 81 selected design and control strategies scheme for application of high
temperature cooling with one chiller ............................................................. 181

12
Figure 82 Selected design and control strategies for application of high
temperature cooling with two separate chillers ............................................. 182

13
List of abbreviations
AC Air Conditioned
ACB Active Chilled Beam
ACE Air Change Efficiency
ACMV Air Conditioning and Mechanical Ventilation
ACR Air Change Rate
AHU Air Handling Unit
BubbleZERO Bubble-Zero Emission Research Operation
CAE Computer Aided Engineering
CAV Constant Air Volume
CC Chilled Ceiling
CE Ceiling Exhaust
CFD Computational Fluid Dynamics
COP Coefficient of Performance
CRE Contaminant Removal Effectiveness
CS Ceiling Supply
DCV Demand Control Ventilation
DDOAS Decentralized Dedicated Outdoor Air System
DOAS Dedicated Outdoor Air System
DV Displacement Ventilation
ERS Energy Recovery System
FD Floor Diffuser
FS Floor Supply
HX Heat Exchanger
HTC High Temperature Cooling

14
HTCW High Temperature Chilled Water
HVAC Heating, Ventilation and Air Conditioning
IAQ Indoor Air Quality
LACI Local Air Change Index
LED Light Emitting Diode
LTC Low Temperature Cooling
LTCW Low Temperature Chilled Water
MF Mechanical Fan
MV Mixing Ventilation
NV Naturally Ventilated
PCB Passive Chilled Beam
PF Personalized Fan
PMV Predicted Mean Vote
PPD Predicted Percentage Dissatisfied
PV Personalized Ventilation
RAS Recirculated Air System
RCS Radiant Cooling System
RCP Radiant Ceiling Panel
RSC Radiant Slab Cooling
RSP Respirable Suspended Particles
SBS Sick Building Syndrome
SHR Sensible Heat Ratio
SS Singapore Standards
TABS Thermally Activated Building Structures
TVOCs Total Volatile Organic Compounds
15
UFAD Under Floor Air Distribution
VAV Variable Air Volume

16
List of symbols
𝛽 Coefficient of Expansion
𝜌 Density
𝜌𝑟𝑒𝑓 Reference Density
𝜏 Age of Air
⟨𝜏̅⟩ Room Mean Age of Air
𝜏�̅� Age of Air at Point P
𝜏𝑛 Nominal Time Constant
μ Viscosity
λ Thermal Conductivity
ε Turbulent Dissipation
ω Specific Rate of Dissipation
C Concentration
⟨𝐶⟩ Mean Concentration
𝐶𝑒 Concentration at Exhaust
clo Clothing Unit
e Energy
g Gravity of Earth
g-value Exergetic Efficiency
Icl Clothing Insulation (m2 K/W)
k Turbulent Kinetic Energy
M Metabolic Rate (W/m2)
met Metabolic Unit
P Pressure
17
PM1 Particulate Matter Less than 1 μm
PM2.5 Particulate Matter Less than 2.5 μm
PM10 Particulate Matter Less than 10 μm
q Ventilation Flow Rate
T Temperature
Td Dew point Temperature
To Operative Temperature
𝑇�̅� Mean Radiant Temperature
𝑇𝑟𝑒𝑓 Reference Temperature
Ts Surface Temperature
U Velocity Vector
V Air Velocity
Vol Volume

18
Chapter 1. Introduction
Background information is provided regarding the air conditioning system
in the commercial buildings of tropical cities. The main idea behind the low
exergy system is introduced and compared to conventional ACMV system in
the office buildings. This section is followed by a thorough literature review on
different aspects of high temperature cooling systems applications in the
tropics. The identified knowledge gaps based on conducted literature review
are further elaborated and goals/scope/research questions/hypothesis of the
thesis are explained in the subsequent sections.
1.1 Background
In this section, at first, information is provided regarding the conventional
air conditioning and mechanical ventilation system in tropical buildings. Later,
the exergy concept is introduced and its applications for building systems are
discussed. Several emerging cooling technologies in the industry and literature
are also presented before proceeding to the concept of high temperature cooling
in the tropical context.
1.1.1 Building ACMV system in the tropics
Concerns regarding the global warming encourage efforts to reduce
greenhouse gas emission of human activities at different sectors. The report of
the intergovernmental panel for climate change (IPCC) revealed that in 2004,
19
the building sector was responsible for one third of global energy related CO2
emissions and three fifth of halocarbon emissions (IPCC, 2007). This statistic
shows the importance of buildings energy efficiency policies on mitigation of
the global climate change issue. Based on report of International Energy
Agency, Singapore’s CO2 emissions from fuel combustion in 2011 were 12.49
tonnes of CO2 per capita, considerably higher than in neighbouring countries
(Asia average = 1.51) because of its small size, dense population and
manufacturing industries (IEA, 2013).
Inside buildings, air conditioning and mechanical ventilation (ACMV)
systems makes up the biggest piece of the pie in energy consumption
breakdown especially in commercial buildings for the tropical climates of
Singapore (NCCS and NRF, 2011). Air conditioning is the process of cooling
indoor air space in order to keep the occupied air space in the comfortable
condition. In the tropical context, this process means cooling and
dehumidifying inside and/or outside air and distributing it into different interior
spaces of buildings. Ventilation is the process of replacing indoor air which
carries generated pollutants by occupants and other sources in space with
outside air to ensure indoor air quality remains acceptable. In the conventional
ACMV designs of buildings, these two processes of air conditioning and
ventilation are satisfied together through supplying conditioned outside air into
space accompanied with reconditioning of return air. In commercial buildings
with the central all air system, a mixture of outside and recirculated inside air is
conditioned in AHU rooms and then distributed to various zones of the
building. Variable air volume (VAV) and constant air volume (CAV) are the
main types of all air system in which sensed temperature by thermostat inside

20
zones controls flow rate and temperature of the supplied air, respectively for
VAV and CAV.
The tropical climate is the group A of the Köppen-Geiger climate
classification (Peel et al., 2007) which includes tropical rainforest, tropical
monsoon, and tropical wet and dry (savanna) climates. The tropics are
characterized as high temperature (≥18 °C) and precipitation all year round
except for dry season in monsoon and savanna climates. These climates usually
occur in the areas near the equator and cover various countries in Asia, Africa
and America like Singapore, Malaysia, Thailand, Indonesia, Philippine, Brazil,
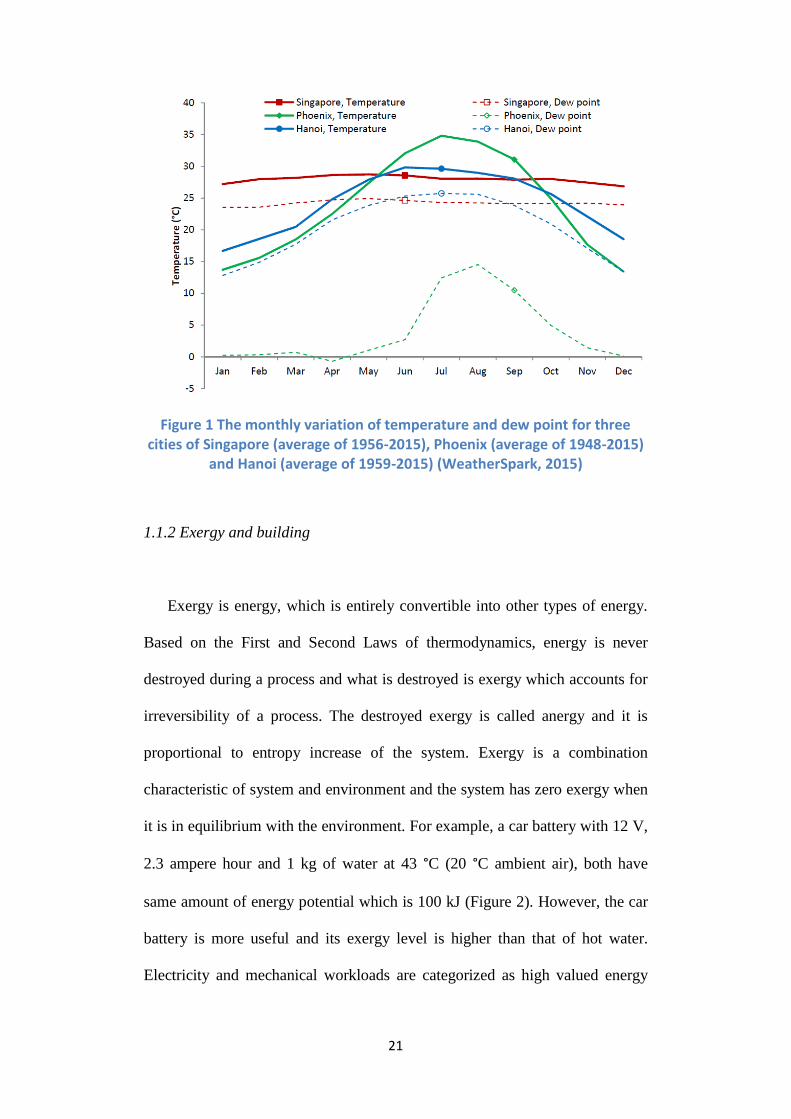
and India. The average monthly variation of temperature and dew point for
three climates of tropical rainforest (Singapore, Kuala Lumpur, Jakarta and
etc.), hot desert (Phoenix, Doha, Dubai and etc.) and warm temperate (Hanoi,
Hong Kong, Taipei and etc.) are illustrated in Figure 1. In the tropical climate
of Singapore, temperature and dew point remain almost unchanged in the
course of a year while in two other cities there is a clear warm season which
happens between May to September. The warm temperate climate of Hanoi
exhibits similar profile to the tropics during warm season where dew point is
close to 25 °C. On the other hand, at hot desert climate of Phoenix in Arizona,
dew point level is unlikely to exceed 15 °C.
21
Figure 1 The monthly variation of temperature and dew point for three cities of Singapore (average of 1956-2015), Phoenix (average of 1948-2015)
and Hanoi (average of 1959-2015) (WeatherSpark, 2015)
1.1.2 Exergy and building
Exergy is energy, which is entirely convertible into other types of energy.
Based on the First and Second Laws of thermodynamics, energy is never
destroyed during a process and what is destroyed is exergy which accounts for
irreversibility of a process. The destroyed exergy is called anergy and it is
proportional to entropy increase of the system. Exergy is a combination
characteristic of system and environment and the system has zero exergy when
it is in equilibrium with the environment. For example, a car battery with 12 V,
2.3 ampere hour and 1 kg of water at 43 °C (20 °C ambient air), both have
same amount of energy potential which is 100 kJ (Figure 2). However, the car
battery is more useful and its exergy level is higher than that of hot water.
Electricity and mechanical workloads are categorized as high valued energy

22
sources while heat sources near the ambient temperature are low valued
sources.
Figure 2 Sources with same amount of energy but different amount of
exergy (IEA ECBCS Annex 37, 2003, p. 37)
The concept of exergy can provide an evaluation on level of entropy
increase in the environment caused in the whole energy flow chains from
electricity generation in power plant to refrigeration cycle in heat pump /
chiller. Like any other systems, exergy destruction occurs in building systems
and the low exergy concept can bring new insights into the design of low
carbon footprint buildings. The low exergy systems provide the least amount of
exergy destruction for building service where supplied exergy matches better
with exergy demand of buildings. This idea can introduce new air conditioning
strategies for tropical buildings, where outdoor temperature is close to the
comfort range of human body. Nevertheless, high humidity outdoor condition
and required dehumidification for indoor space still remain as exergy intensive

23
aspect of building air conditioning system. The low exergy concept in the
tropical context can be translated into using low exergy sources close to human
comfort temperature range or high temperature cooling. That means
incorporating low exergy sources like solar energy and ground source or using
warmer chilled water in order to operate chiller under low temperature lift
conditions. In the latter case, a custom designed chiller for the low lift
condition is required to fully take advantage of energy and exergy saving
potential of this design.
1.1.3 Emerging cooling systems
Several research groups and companies introduced alternative ACMV
designs for the tropical and sub-tropical climates in which the separation of the
sensible load, the latent load and the ventilation requirements is more
pronounced. The motivations behind this further separation are saving energy
and better control of indoor air by bringing just enough dehumidified outside
air to satisfy the ventilation need of space. In these emerging systems, a parallel
cooling device or control strategy is utilized to satisfy the remaining cooling
load of space. In the department of building in NUS, single coil twin fan
(SCTF) has been proposed to use two separate fans and independent air
streams for outdoor air and return air. Flow rates of each air stream are to be
regulated based on real time data of temperature and CO2 sensors (Sekhar et
al., 2006). The aim of this design is to separate cooling load and the ventilation
requirement of space by bringing just enough outdoor air to satisfy the
ventilation requirement of space. Potential energy saving of this design based

24
on a pilot study on a small scale laboratory project was estimated to be around
12 % (Sekhar et al., 2007). Chilled water inside cooling coils passes through
both compartments of outdoor and return air. Therefore, the streams are still
interconnected on sensible cooling and dehumidifying level while their
volumetric flow rates are independent. This design uses the same chilled water
supply temperature as of conventional system which is in range of 5-7 °C for
both outdoor air and return air streams. In a similar design for the subtropical
climate of Hong Kong, two separate air streams and two coils have been
designated for outdoor air and return air in a concept which is called dry
cooling coupled with dedicated outdoor air ventilation (DCDV). This design
aims to decouple dehumidification from sensible cooling by using DV coil to
treat all the latent load and part of the sensible load while DC coil treats the
remaining space sensible load. DV and DC coils are connected in series where
the chilled water supplied to DV at 7 °C and it successively enters the DC coil
and the return water leaves the coil at 16 °C. They claimed annual energy
reduction of 54 % over CAV (constant air volume) system with reheat for
Hong Kong climate. However, the results of energy simulations have shown
that a CAV system without reheat still consumes 21 % less energy than DCDV
concept on annual basis while there is higher possibility of dissatisfaction in
indoor space without reheating (Jia and Lee, 2014). In common practice of the
building service industry, CO2 based demand control ventilation (DCV) has
being frequently used for ACMV design of buildings in which there is high
variation of occupancy level during the day. In this design the real time CO2
sensor data is connected to dampers of outdoor air ducts to increase ventilation
rate when occupancy is high and also to reduce it to save energy when the

25
occupancy is low. Emmerich and Persily (1997) conducted a literature review
on the application of DCV in buildings and concluded that CO2-based DCV is
more likely to be effective when there are unpredictable variations in
occupancy and non-occupant sources are negligible. Such buildings include
cinemas, theatres, auditoriums, classrooms, lecture halls, meeting rooms and
retail establishments. Another alternative solution to the conventional air
conditioning and distribution system in Singapore buildings is personalized
ventilation (PV) which aims to provide clean outdoor air directly to the
breathing zone of occupants. The benefits of personalized ventilation in terms
of thermal comfort, indoor air quality and reduction of sick building syndromes
and air transmission diseases have been shown by many researchers for the
tropical and temperate climates (Melikov et al., 2013; Pantelic et al., 2009).
This concept can save energy in tropical buildings by keeping the background
temperature at higher level and just maintaining comfort condition around
workstations. Potential energy saving of this design for the tropics was
estimated to be up to 51 % compared to mixing ventilation (Schiavon et al.,
2010). The maximum level of energy saving compared to a mixing CAV base
design has been achieved for a scenario with background temperature of 28 °C,
ventilation rate of 2.5 L/s/person and variable personalized supply temperature
(20-24 °C). Dependency on indoor furnishing, difficulty in equipping nozzle
and connecting ducts in various indoor spaces are the main challenges of
implementing this concept in buildings. In addition, it is not always possible to
keep occupants in fixed locations which restrict the applications of
task/personalized ventilation (Yang, 2008). A recent study (Dalewski et al.,
2014) investigated the performance of a ductless personalized ventilation
26
design combined with displacement ventilation through a subjective study. The
ductless PV takes air from displacement ventilation passing through floor
plenum and brings the air to above the desk after filtration. The level of
improvement in subjects’ thermal comfort was reported to be higher in warm
environment due to the increased air velocity by personalized air. This ductless
design of PV is more aesthetically pleasing and it could be more appealing to
architects. The combination of PV and chilled ceiling is another strategy which
has shown to be effective in improving the air quality at workstations
(Lipczynska et al., 2015). Based on temperature values and contaminants’
concentrations, the maximum flow rate of 13 L/s has been recommended for
each PV diffuser which may not be enough to satisfy the latent load of the
space in some climates or applications.
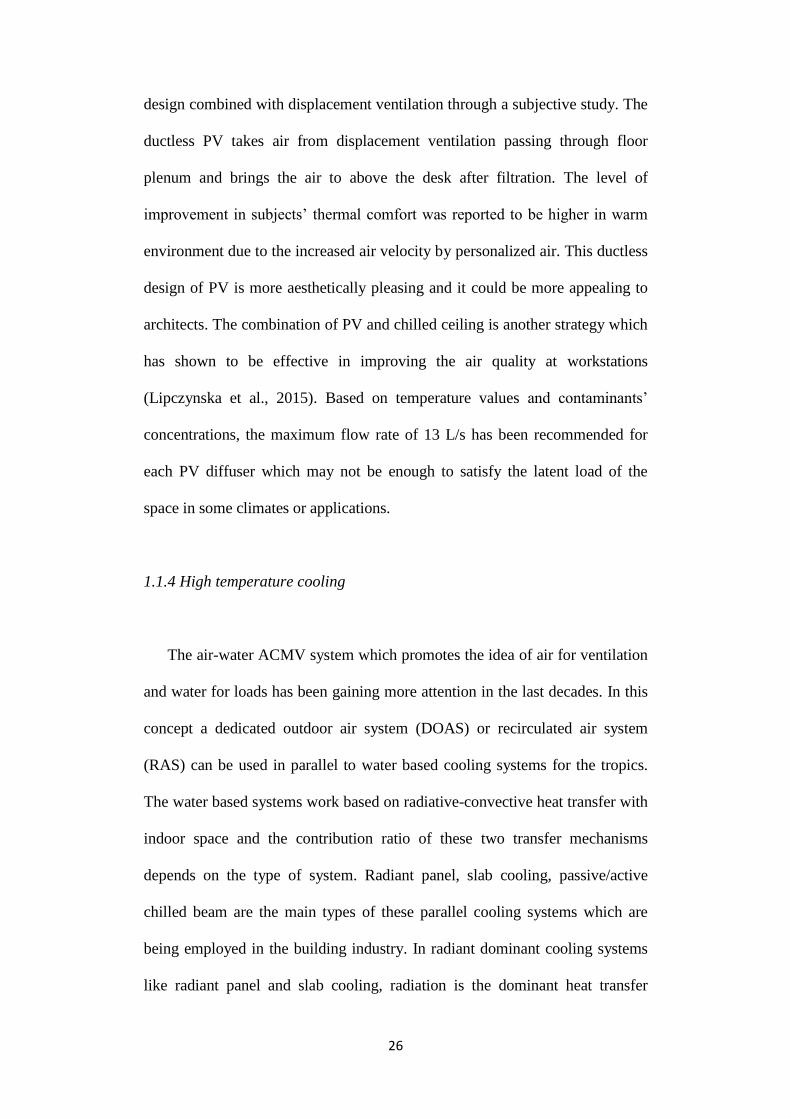
1.1.4 High temperature cooling
The air-water ACMV system which promotes the idea of air for ventilation
and water for loads has been gaining more attention in the last decades. In this
concept a dedicated outdoor air system (DOAS) or recirculated air system
(RAS) can be used in parallel to water based cooling systems for the tropics.
The water based systems work based on radiative-convective heat transfer with
indoor space and the contribution ratio of these two transfer mechanisms
depends on the type of system. Radiant panel, slab cooling, passive/active
chilled beam are the main types of these parallel cooling systems which are
being employed in the building industry. In radiant dominant cooling systems
like radiant panel and slab cooling, radiation is the dominant heat transfer
27
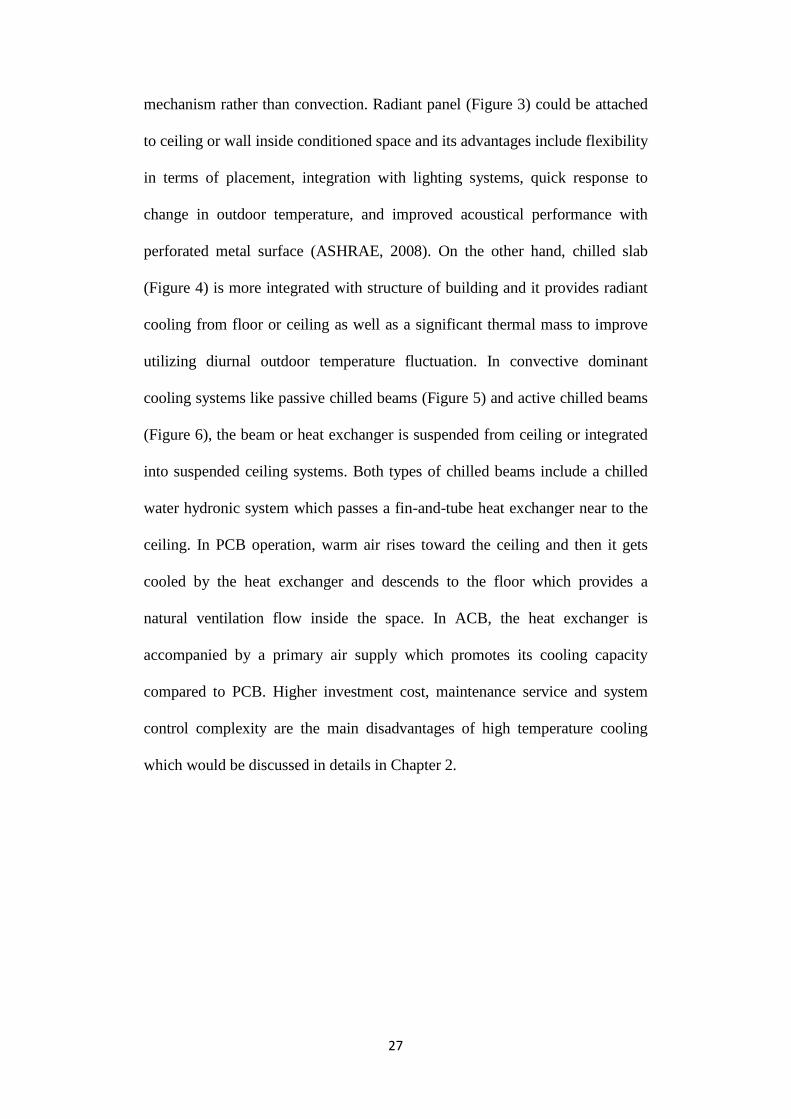
mechanism rather than convection. Radiant panel (Figure 3) could be attached
to ceiling or wall inside conditioned space and its advantages include flexibility
in terms of placement, integration with lighting systems, quick response to
change in outdoor temperature, and improved acoustical performance with
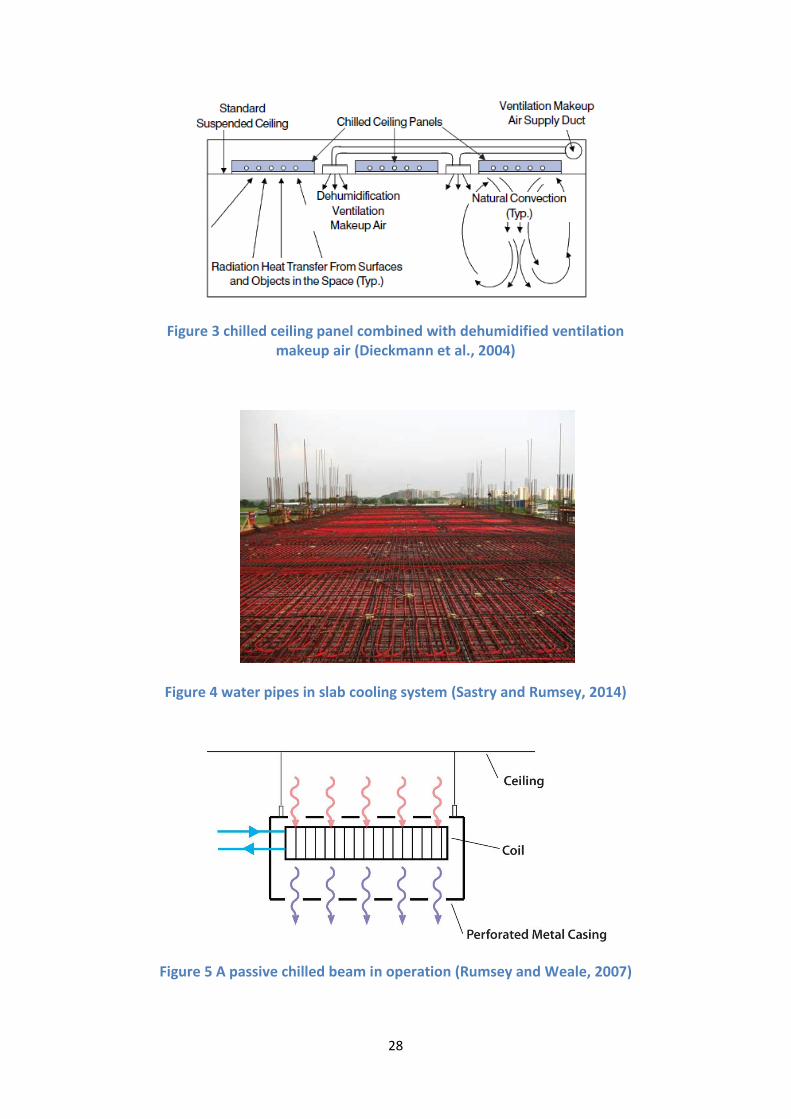
perforated metal surface (ASHRAE, 2008). On the other hand, chilled slab
(Figure 4) is more integrated with structure of building and it provides radiant
cooling from floor or ceiling as well as a significant thermal mass to improve
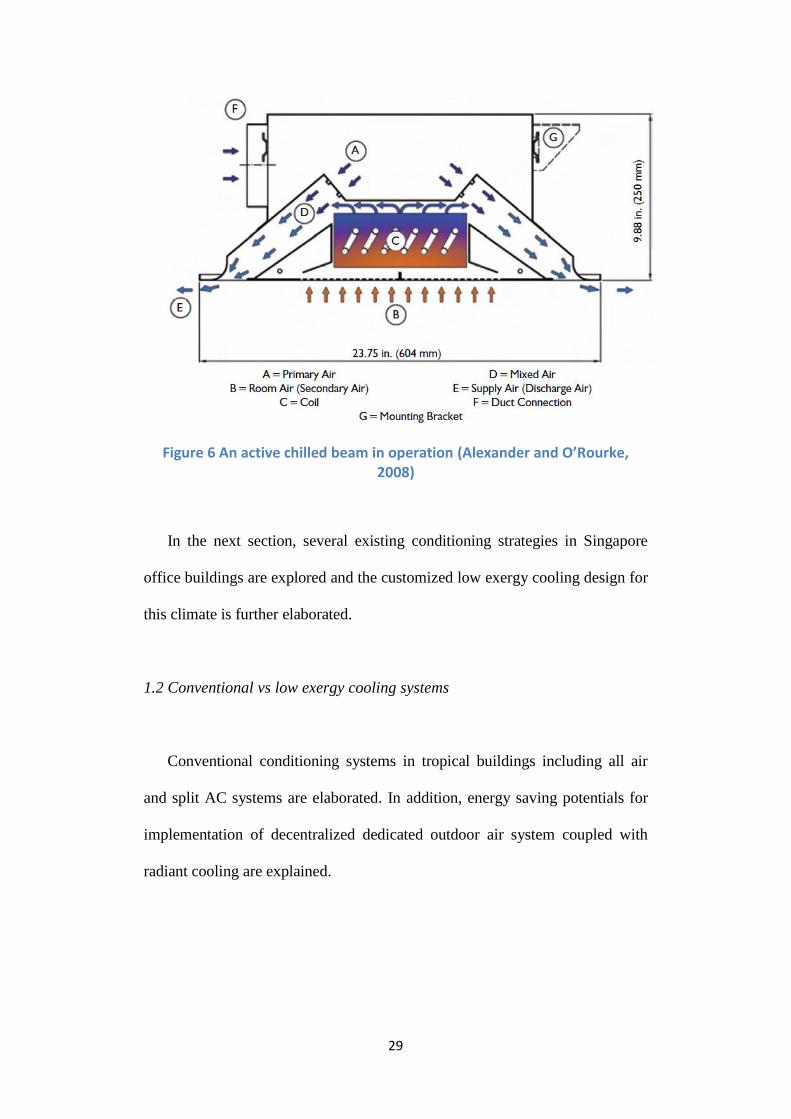
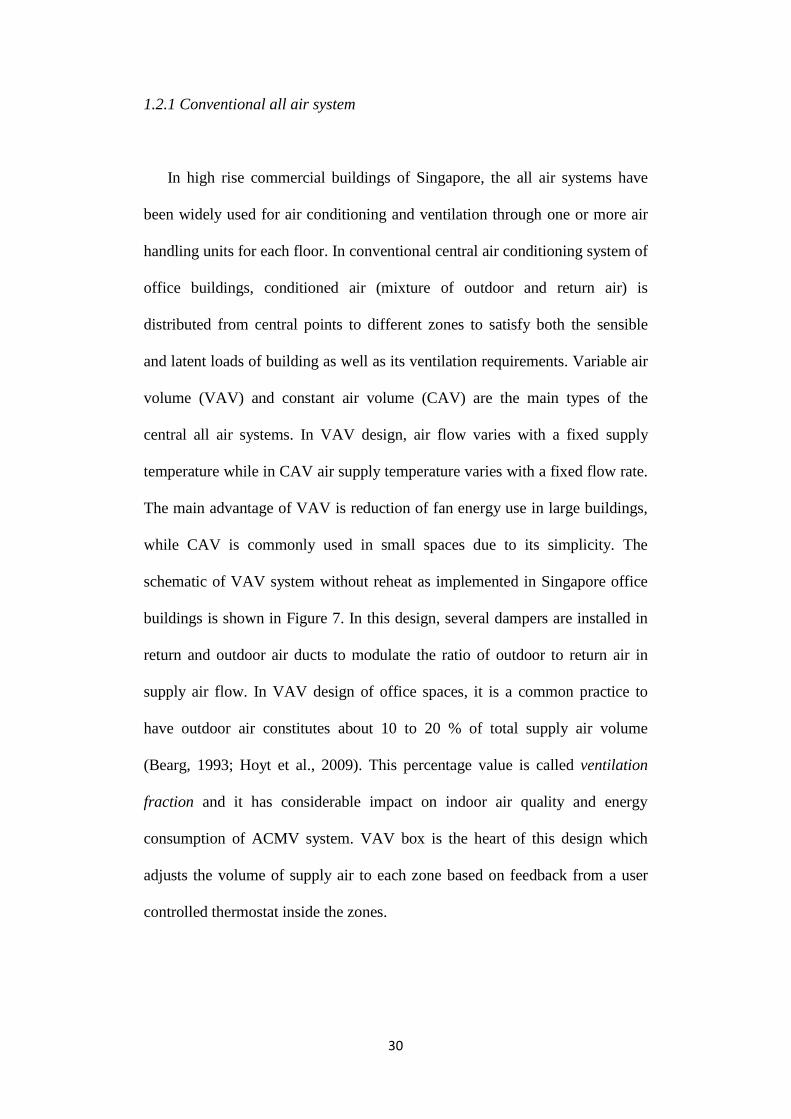
utilizing diurnal outdoor temperature fluctuation. In convective dominant
cooling systems like passive chilled beams (Figure 5) and active chilled beams
(Figure 6), the beam or heat exchanger is suspended from ceiling or integrated
into suspended ceiling systems. Both types of chilled beams include a chilled
water hydronic system which passes a fin-and-tube heat exchanger near to the
ceiling. In PCB operation, warm air rises toward the ceiling and then it gets
cooled by the heat exchanger and descends to the floor which provides a
natural ventilation flow inside the space. In ACB, the heat exchanger is
accompanied by a primary air supply which promotes its cooling capacity
compared to PCB. Higher investment cost, maintenance service and system
control complexity are the main disadvantages of high temperature cooling
which would be discussed in details in Chapter 2.
28
Figure 3 chilled ceiling panel combined with dehumidified ventilation makeup air (Dieckmann et al., 2004)
Figure 4 water pipes in slab cooling system (Sastry and Rumsey, 2014)
Figure 5 A passive chilled beam in operation (Rumsey and Weale, 2007)
29
Figure 6 An active chilled beam in operation (Alexander and O’Rourke, 2008)
In the next section, several existing conditioning strategies in Singapore
office buildings are explored and the customized low exergy cooling design for
this climate is further elaborated.
1.2 Conventional vs low exergy cooling systems
Conventional conditioning systems in tropical buildings including all air
and split AC systems are elaborated. In addition, energy saving potentials for
implementation of decentralized dedicated outdoor air system coupled with
radiant cooling are explained.
30
1.2.1 Conventional all air system
In high rise commercial buildings of Singapore, the all air systems have
been widely used for air conditioning and ventilation through one or more air
handling units for each floor. In conventional central air conditioning system of
office buildings, conditioned air (mixture of outdoor and return air) is
distributed from central points to different zones to satisfy both the sensible
and latent loads of building as well as its ventilation requirements. Variable air
volume (VAV) and constant air volume (CAV) are the main types of the
central all air systems. In VAV design, air flow varies with a fixed supply
temperature while in CAV air supply temperature varies with a fixed flow rate.
The main advantage of VAV is reduction of fan energy use in large buildings,
while CAV is commonly used in small spaces due to its simplicity. The
schematic of VAV system without reheat as implemented in Singapore office
buildings is shown in Figure 7. In this design, several dampers are installed in
return and outdoor air ducts to modulate the ratio of outdoor to return air in
supply air flow. In VAV design of office spaces, it is a common practice to
have outdoor air constitutes about 10 to 20 % of total supply air volume
(Bearg, 1993; Hoyt et al., 2009). This percentage value is called ventilation
fraction and it has considerable impact on indoor air quality and energy
consumption of ACMV system. VAV box is the heart of this design which
adjusts the volume of supply air to each zone based on feedback from a user
controlled thermostat inside the zones.

31
Figure 7 Schematic of VAV system without reheat in Singapore office
buildings
The infrared image of an interior office space in NUS (National University
of Singapore) campus which conditioned with the central all air VAV system is
shown in Figure 8. As shown in the graph, air is supplied from ceiling diffusers
at temperature of 16 °C while the temperature of grill fluorescent light fixture is
around 33 °C. This design works based on mixing strategy and generated heat
by lights and occupants as well as heat gain from façade are extracted to
outside through return air. Supply diffusers and return grills are uniformly
distributed over the space and located on the suspended ceiling where air ducts
and electrical wiring are concealed.
Cooling coil
Exhaust air
Thermostat
Sun
light
Fan
Supply air
Return air
VAV box
Fresh air

32
Figure 8 Infrared image of an interior office space with central all air
VAV system
1.2.2 Split AC systems
Split AC systems have also been installed sparsely in small office buildings
or in special rooms of high rise buildings in Singapore. In this design,
extraction of heat from indoor space occurs directly through refrigeration
cycles where refrigerant inside coils exchange heat with the surrounding air.
The cycle contains two coils and fans as well as a compressor and an expansion
valve which are installed in outdoor and indoor unit, respectively. Implemented
indoor units could be ductless or connected to air ducts in order to bring
outdoor air into space. Each indoor unit contains cold coils and a fan to
enhance the absorption of heat from the interior zones while outdoor unit
contains hot coils and a fan to enhance the extraction of heat to the ambient air.
The cooling capacity of system is usually modulated based on feedback from
user controlled thermostats located inside the space. Samples of indoor and
Supply
diffuser
Return Grill
Grill
fluorescent
light fixture
33
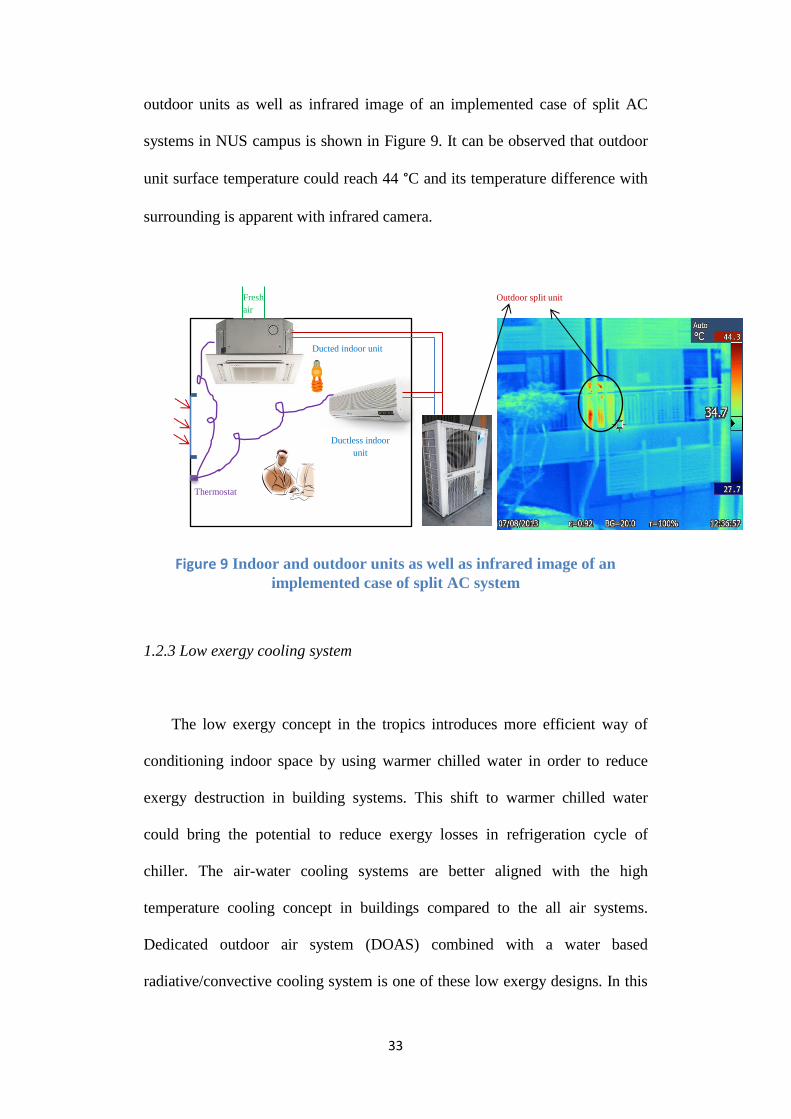
outdoor units as well as infrared image of an implemented case of split AC
systems in NUS campus is shown in Figure 9. It can be observed that outdoor
unit surface temperature could reach 44 °C and its temperature difference with
surrounding is apparent with infrared camera.
Figure 9 Indoor and outdoor units as well as infrared image of an
implemented case of split AC system
1.2.3 Low exergy cooling system
The low exergy concept in the tropics introduces more efficient way of
conditioning indoor space by using warmer chilled water in order to reduce
exergy destruction in building systems. This shift to warmer chilled water
could bring the potential to reduce exergy losses in refrigeration cycle of
chiller. The air-water cooling systems are better aligned with the high
temperature cooling concept in buildings compared to the all air systems.
Dedicated outdoor air system (DOAS) combined with a water based
radiative/convective cooling system is one of these low exergy designs. In this
Ducted indoor unit
Ductless indoor
unit
Thermostat
Outdoor split unit Fresh
air

34
concept, conditioned outdoor air is brought into space to satisfy the latent load,
the ventilation requirement and part of space sensible load. A parallel
radiative/convective cooling system like radiant ceiling panel is usually
employed to handle the rest of the sensible load. This separation increases the
share of water as heat transport medium in air conditioning system and
facilitates the use of demand controlled ventilation (DCV) based on CO2 level
in the indoor space. Compared to the conventional system, the air-water
systems can potentially save energy through further use of water as heat
transport medium to lower fan energy use and duct size. The heat capacity of
water (4.183 kJ/(kg.K) @ 20 °C) is four times more than air (1.005 kJ/(kg.K)
@ 20 °C), and consequently the heat transfer exchange process is potentially
more efficient with water. In addition, parallel radiant cooling system is
categorized as a high temperature cooling system which can result in a higher
COP (Coefficient of Performance) of the refrigeration cycle and therefore the
chiller if designed accordingly for the low lift condition. The other advantages
of DOAS combined with radiant cooling compared to the conventional system
are less noise, lower air draft, and better thermal comfort for occupants caused
by the radiant heat transfer. DOAS concept is getting more attraction over time
especially for applications in which high ventilation rate is required like in
hospitals and schools (Munters Co., 2009).
In this research project, decentralized concept is incorporated into DOAS to
further reduce fan energy use and air duct size by using decentralized
ventilation units, a concept which can be called decentralized DOAS
(DDOAS). In this concept instead of several air handling units for each floor,
many decentralized air supply units can be embedded into structure of a

35
building to take outdoor air directly from façade. These decentralized units can
be installed at different facades to accommodate the shortest and least energy
intensive way of supplying fresh air to the conditioned space. In addition, air is
supplied to and distributed within space through under floor interlaced ducting
systems to take advantage of displacement ventilation strategy. The schematic
of decentralized DOAS combined with radiant ceiling panel under floor supply
and ceiling exhaust (FS-CE) is shown in Figure 10.
Figure 10 Schematic of decentralized DOAS combined with radiant ceiling
panel
With implementation of this design in buildings, floor to floor height could
be reduced and also there is no need for AHU rooms in buildings. These low
exergy ventilation technologies including decentralized air supply units and
radiant cooling panels have been designed by the Building Systems Group at
ETH Zurich and customized for the tropical climate of Singapore (Iyengar et
al., 2013; Meggers et al., 2012). These technologies have been implemented in
a laboratory called BubbleZERO (Figure 11) which is located near the campus
Hot and
humid
outdoor
air
Decentralized
air supply units
Sun
light
Supply air
Exhaust air
Radiant ceiling panel
'Cold' chilled water
'Warm' chilled water
36
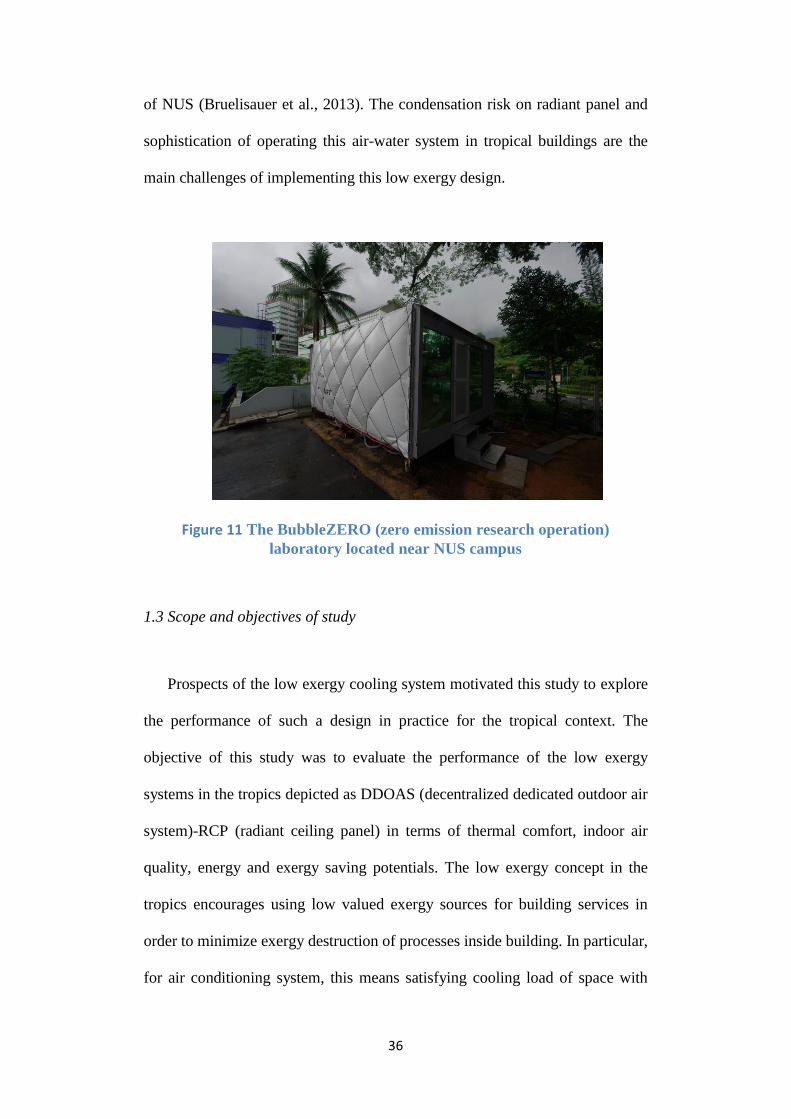
of NUS (Bruelisauer et al., 2013). The condensation risk on radiant panel and
sophistication of operating this air-water system in tropical buildings are the
main challenges of implementing this low exergy design.
Figure 11 The BubbleZERO (zero emission research operation)
laboratory located near NUS campus
1.3 Scope and objectives of study
Prospects of the low exergy cooling system motivated this study to explore
the performance of such a design in practice for the tropical context. The
objective of this study was to evaluate the performance of the low exergy
systems in the tropics depicted as DDOAS (decentralized dedicated outdoor air
system)-RCP (radiant ceiling panel) in terms of thermal comfort, indoor air
quality, energy and exergy saving potentials. The low exergy concept in the
tropics encourages using low valued exergy sources for building services in
order to minimize exergy destruction of processes inside building. In particular,
for air conditioning system, this means satisfying cooling load of space with
37
chilled water closer to thermal comfort temperature range. This change from
conventional air conditioning to DDOAS-RCP requires modification and
customization of components to accommodate an effective implementation of
the concept. The new conditioned space with DDOAS-RCP has different
characteristics compared to the conventional all air system which needs to be
determined. The second objective was to explore these characteristics and
determine the perception of occupants toward these low exergy technologies as
well as any possible indoor air quality concerns.
Thermal comfort is the status of human body when it gets into thermal
equilibrium with environment without feeling dissatisfied. The main variables
which influence the comfort status of human body include dry bulb
temperature, mean radiant temperature, clothing level, metabolic rate, water
vapour pressure and air velocity. In addition to these parameters, mental
condition and well-being of occupants also play some roles which are beyond
the scope of this PhD research. Thermal comfort needs to be investigated for
the whole occupancy zone as well as for local discomfort concerns if there is
considerable variation of environmental parameters in the space. Indoor air
quality of the space also needs to meet some minimum requirements for the
main pollutants provided by the local and the International guidelines and
standards. This is to ensure the pollutant concentrations do not exceed the
thresholds and there is no health risk for occupants. This research aimed to
investigate the conformability of indoor air space conditioned by DDOAS-RCP
with the local/International standards and thermal comfort models.
The main advantages of DDOAS coupled with radiant ceiling panel
compared to the conventional all air system are less noise and better thermal

38
comfort for occupants achieved by radiant heat transfer. In addition, this
design can reduce the required floor to floor height in buildings and potentially
it consumes less energy and exergy compared to the conventional system. On
the other hand, the main concerns of this system for the tropics are the potential
condensation risk on radiant panels and lower air movement compared to the
conventional air conditioning systems in this climate. The latter issue is mostly
relevant in the tropical context while in moderate and cold climates, lower air
movement or less draft is mostly considered as a benefit. With high outdoor
humidity levels all year round, dew point of the interior space has to be actively
controlled to be well below the radiant panel surface temperature in order to
avoid condensation. With this consideration, there would be some limitations
regarding the contribution of radiant ceiling panel in total sensible heat removal
of space. Overall, the operating condition of radiant ceiling panel should be
optimized based on the sensible cooling load of the space. Developing a better
understanding on the ratio of sensible cooling provided by radiant panel
compared to sensible and latent cooling provided by decentralized air supply
units is one of the main objectives of this research. The air movement in
DDOAS-RCP is lower than that for the conventional all air system which may
not satisfy the requirement of local standard SS 554 (in range of 0.1-0.3 m/s).
Albeit, in DDOAS-RCP design, this lower air movement is compensated by
lower mean radiant temperature in space, the response and adaptation of
occupants in the tropics to this new indoor environment needs further
investigation.
Computer aided engineering (CAE) is gaining more weight in the building
related research and industry over time and the advanced simulation models are

39
capable of predicting different aspects of building performance. Inside the
buildings, CFD (computational fluid dynamics) can provide insights into
indoor air characteristics, spatial distribution of environmental parameters and
pollutants in the space. This study utilized CFD simulation to numerically
determine indoor air characteristics and radiative/convective heat transfer
mechanism around radiant panel and occupants. As a necessary step, it is
required to validate the CFD simulation results with experimental data in order
to be able to proceed with predictions of different scenarios. Providing a clear
understanding on differences between indoor air characteristics of DDOAS-
RCP with the all air system was one of the objectives of this thesis.
There is potential for integration of DDOAS-RCP with compatible
technologies like low temperature lift chillers. These integrations can further
enhance energy saving opportunities of the design. Higher operational
efficiency of chiller can be achieved by deploying a separate low loft chiller for
radiant cooling system. The level of improvement in COP of chiller is required
to be quantified for the tropical context. The order of improvement would
determine whether running two parallel chillers in DDOAS-RCP could be
economically attractive to building managers.
1.4 Thesis structure
This thesis includes six chapters: Introduction, Literature Review,
Methodology, Results, Discussion and Conclusion. In the first chapter,
background information on ACMV system in the tropics and the low exergy
cooling systems are provided. High temperature cooling as a low exergy

40
concept is introduced and aim of the study is explained with emphasis on the
application of radiant cooling system in the tropics. In the literature review
chapter, the reported studies on application of high temperature and comfort
studies in the tropics are reviewed. Knowledge gaps are identified based on the
conducted literature review and research questions are formed to be explored in
the thesis. The followed methodologies are elaborated in chapter 3 on different
aspects of DDOAS-RCP performance evaluation. Those aspects include
description of the BubbleZERO testbed, environmental parameters, system
variables, comfort evaluation, ventilation effectiveness analysis, numerical
modelling, integration with low lift chillers and potential energy saving of this
low exergy design. In chapter 4, results have been categorized in similar
sections to present the outcomes of thesis on different aspects of DDOAS-RCP
performance in the tropics. The obtained results are further elaborated in
chapter 5 and relevant discussions are provided to give a better understanding.
In chapter 6, conclusions of thesis are summarized and future work are
suggested based on the results and limitations of this study. The report of
conducted blower door test in the BubbleZERO and scientific publications
from this PhD research are included as appendices in this thesis.

41
Chapter 2. Literature review
The reported studies in the literature on different aspects of the high
temperature cooling system including performance evaluation, thermal comfort
analysis and indoor air simulations are reviewed and discussed.
2.1 High temperature cooling systems
The whole idea behind the low exergy concept in buildings is to use low
exergetic (or low value) and sustainable energy sources for required energy
services inside buildings. Energy and exergy flows through buildings have
been investigated in various studies (IEA ECBCS Annex 37, 2003; Tolga Balta
et al., 2008) and the results have shown that the main exergy destruction occurs
in the primary energy transformation. This fact shows the importance of
conducting exergy analysis for power plants which is a necessary step at design
stage of plants. On a lower level, exergy destruction also occurs in storage,
distribution, and at the end of exergy flow chains are system components and
building envelope. Schmidt (2009) used the exergy concept to find efficient
ways to supply energy in order to satisfy demand for energy services inside
buildings. He found that technologies with low temperature heat sources like
solar thermal collectors and ground source heat pumps compared to electricity
driven technologies on exergy basis can be better matched with demands of
building services like cooking, sauna, domestic hot water and space heating. In
another study, Meggers et al. (2012) have shown the potential of the low
exergy building systems like hybrid Photovoltaics/thermal collector and low
42
lift ground source heat pump with borehole to heat buildings, which have lower
energy and exergy demand. This group also embarked on a cost analysis which
demonstrated the importance of considering investment costs for both passive
and active systems such as boreholes.
In particular for building cooling systems, various technologies have been
categorized as low exergy cooling technologies in IEA Energy Conservation in
Buildings and Community Systems (ECBCS) Annex 28 (2000). The addressed
technologies include night cooling, ground cooling (air and water), evaporative
cooling (direct and indirect), slab cooling (air and water), desiccant and
evaporative cooling, displacement ventilation and chilled ceilings. Night
cooling is able to reduce the internal peak temperature by 2-3 °C for
heavyweight constructions with suitable design and under right climate. This
strategy with natural or mechanical ventilation is mostly suitable in the
climates where there is a substantial difference between outdoor night
temperature and midday air temperature. So it cannot be an effective strategy
for the tropical climate of Singapore with warm nights. Slab cooling concept,
same as in night cooling, takes advantage of building thermal mass in order to
provide a stable indoor air temperature by providing radiative/convective
cooling to the space. In this concept, floors or walls are cast with chilled water
pipes or cool air ducts and a detailed control strategy is needed to optimize the
required cooling and avoid condensation especially in hot and humid climates
(IEA ECBCS Annex 28, 2000). The high temperature cooling system applied
as slab cooling could be an effective strategy for tropical building when
accompanied with a parallel air system to satisfy the latent load and the
ventilation requirements.
43
In evaporative cooling, air is cooled down by evaporation of water in air
which happens through water spraying or running in a wet porous media. This
low energy and exergy concept is more suitable for dry climates where the rise
in relative humidity does not exceed the threshold of the comfort range (e.g. 60
%), certainly not for Singapore. Desiccant cooling is a popular area of research
for the tropics which uses a desiccant to extract humidity from supplied air and
then release that humidity into exhaust air. While solid desiccant has been
implementing in building conditioning system for the long time, relatively new
designs of liquid desiccants showed promising results for the hot and humid
climates and currently it is shifting from research stage into real applications
(Huang and Zhang, 2013). The complexity and maintenance issues of liquid
desiccant systems are the main hindrances for widespread implementation of
this concept in buildings. Ground cooling is another low exergy technology
which tries to take advantage of the lower underground temperature for
reduction of heat pump lift or to directly recirculate air or water to the
underground source. Ground cooling is an effective strategy when the ground
temperature is at 12 °C or below (IEA ECBCS Annex 28, 2000). Nevertheless,
ground in the tropical rainforest climate has small fluctuation over the year and
it is mostly warm and not suitable for implementation of ground cooling (van
Dronkelaar et al., 2014).
The combination of chilled ceiling and displacement ventilation is one of
the low exergy ventilation technologies, which has been investigated by many
researchers in the literature (Novoselac and Srebric, 2002; Schiavon et al.,
2012). A study based on annual energy simulations showed that energy
efficiency of this coupled system compared to the all air systems varies for

44
different climate types (from cold and dry to very hot and humid) and ranges
between 10 to 40 % (Tian and Love, 2009). Novoselac and Serbric (2002) tried
to provide a dimensionless comparison of CC-DV with VAV (e.g. of VAV-
RCS) system based on the reported studies in the literature and they concluded
that this VAV-RCS design may or may not save energy compared to VAV
system. Besides climate type, the amount of energy saving is dependent on
system configuration, supply air temperature, outdoor flow rate and cooling
load of space. They also showed that minimization of infiltration and proper
control of system in transient situations like start-up and shutdown is required
to avoid condensation on chilled ceilings. Schiavon et al. (2012) tried to find a
relationship between the ratio of cooling load removed by chilled ceiling and
thermal stratification inside the space. The results showed that the higher
contribution of chilled ceiling in removal of cooling load results in lower room
stratification. The conducted experiments on VAV-RCP in which air
distributed through floor diffusers (FD) indicated that head to ankle
temperature difference of 1.5 °C is achievable with ceiling surface temperature
of 18 °C or higher.
While the concept of DDOAS-RCP is unique and its application for the
tropical climates has not been reported in the literature, there have been reports
on the similar low exergy cooling and heating systems. The closest types of air
conditioning systems to DOAS-RCP are DOAS-RSC, DOAS-ACB, DOAS-
PCB, RAS-RCP, RAS-RSC, RAS-ACB and RAS-PCB. The high temperature
cooling systems of radiant slab cooling (RSC), active chilled beam (ACB) and
passive chilled beam (PCB) could be employed instead of radiant ceiling panel
(RCP). Each of the above-mentioned HTC systems has unique characteristics

45
in terms of initial cost, cooling capacity and operation strategy. Among HTC
cooling system, radiant slab cooling (RSC) can be implemented at lower
investment cost, although it requires early-stage planning and integration into
structure of building. In active chilled beam (ACB) design, supply air passes
through heat exchanger which operates with high temperature chilled water.
Passive chilled beam (PCB) is an independent HX beam installed near ceiling
and it can provide uniform convective-radiative cooling from the ceiling in the
downward direction.
In the recirculated air system (RAS) concept, the supply air is the mixture
of fresh air and return air, while in DOAS, the supply air is pure fresh air and
there is no return air. Overall, DOAS types of high temperature cooling
compared to RAS types provide a lower air movement indoor space in which
water based cooling system plays a more effective role and they could be
potentially more energy efficient. Convective and radiative heat exchanges are
the most dominant heat transfer mechanisms respectively in chilled beam and
chilled ceiling. The abovementioned conditioning system can be further
categorized based on their distribution types. The air distribution systems could
vary from ceiling supply-ceiling exhaust (CS-CE) to floor supply-ceiling
exhaust (FS-CE) for each of the combinations of the low exergy systems.
Interaction of air and water systems inside the space needs to be understood
and optimized at design stage. Mixing ventilation (MV) and displacement
ventilation (DV) are the most common types of distribution strategies which
can include CS-CE or FS-CE through UFAD.
Mumma (2002) identified the main barriers of ceiling panel cooling
combined with DOAS (DOAS-RCP) systems in buildings. These include

46
condensation, capacity and first cost. The conducted hourly energy analysis for
humid continental climate of Philadelphia showed that a conventional VAV
(variable air volume) system costs about 29 % more to operate compared to
DOAS-radiant cooling panel. Regarding the condensation issue, he showed
that even if the occupancy increases by a factor of 2 or 3, it could take hours
before the condensation film on the panels would be equal to the thickness of a
human hair (Mumma, 2001). For the tropical climate of Thailand, Vangtook
and Chirarattananon (2007) conducted a whole year energy simulation and
thermal comfort analysis for radiant cooling panel system. The results of the
study showed that radiant cooling system combined with proper conditioned air
can help to attain thermal comfort superior to the conventional system, while
energy saving is also achieved. They used the relatively high chilled water
temperature of 25 °C provided by cooling tower to avoid condensation which
results in low capacity of cooling panels and makes their design applicable
only for low heat gain spaces.
A software company in Hyderabad did a side-by-side comparison between
VAV and DOAS-slab cooling and they observed 34 % less energy
consumption by DOAS-radiant cooling compared to the VAV system on
annual basis (Sastry and Rumsey, 2014). This group also did a cost comparison
of conventional and radiant cooling system and showed that the cost of the
radiant system was slightly lower than the VAV system. The cost saving
opportunities from reduction of AHU and duct size was about 6 % of total cost
of ACMV system while radiant piping, accessories and installation raised the
investment cost for around 23 %. This study considered 33 % reduction in
HVAC low side work or commissioning cost in the case of radiant cooling

47
which was not elaborated in the paper. The combination of the central all air
system with active chilled beams is also another popular design, which is
getting more attention in Singapore. In this regard, Kosonen and Tan (2005)
investigated the feasibility of ventilated beam system in Singapore office
buildings combined with DOAS and RAS. They concluded that the room
design condition of 23 °C and 65 % humidity level is achievable with both
DOAS-ACB (10 L/s/person outdoor air) and RAS-ACB (4 L/s/person outdoor
air combined with reconditioning of return air). The recommended minimum
outdoor air supply for office buildings is 5.5 L/s/person based on the Singapore
standard of SS 553 (2009).
Besides energy simulation analysis, experimental and numerical modelling
approaches have been chosen by some researchers to explore the implications
of radiant cooling and DOAS systems in buildings. Chiang et al. (2012)
employed CFD to provide enhanced predictions on implementation of radiant
ceiling panel combined with displacement ventilation for the subtropical
climate of Taiwan. They supplied the conditioned air at high temperatures of
18-24 °C near the floor to reduce thermal stratification in the space and achieve
better thermal comfort. No concern of condensation on radiant ceiling surface
was reported for this range of supply temperature which could be due to the
low dew point level at supply air or low latent load of the laboratory. They also
concluded that energy saving is achievable with rise of supply air temperature
which can result in higher cooling capacity of ceiling panel and increase in
efficiency of chiller. By this change, they can shift more sensible heat removal
of space to ceiling panel and provide a better balance for the whole indoor
space. However, maintaining the same level of humidity in supply air with

48
raised temperature is a challenge which needs to be taken care of with a more
sophisticated conditioning system. Their results also showed that moving the
supply air position from the ceiling to the floor led to better cooling efficiency.
Wang and Tian (2013) also performed CFD simulation and experiments to
investigate the thermal comfort of the hybrid radiant cooling and dedicated
outdoor air system. Contrary to Chiang et al. (2012)’s results, they found that
ceiling delivery and ceiling exhaust of outdoor air is the optimized distribution
option. Based on their findings, the magnitude of factors’ impact has an order
of air supply temperature > panel coverage area > panel temperature > air
supply volume. This order of magnitude is aligned with other studies which
found air supply temperature as a critical factor for DOAS-RCP. For US office
buildings, Schiavon et al. (2012) carried out experiments in a typical office
building to assess the impact of a chilled ceiling combined with a displacement
ventilation system on room air stratification. The results revealed that the
average temperature of radiant panel surface is the best predictor of
temperature difference between head and ankle of a seated person in the space.
It was also showed that less coverage of the ceiling with radiant panel usually
requires cooler surface temperatures, which causes more disruption on room air
stratification. The details of the studies in the literature on the high temperature
cooling system are listed in Table 1. It is noteworthy that although the
researchers in these reported studies have not used the term of low exergy for
their suggested design, due to the applied concept of high temperature cooling
in their designs, they can be categorized as low exergy cooling systems. The
amount of energy saving reported in these studies also determined based on

49
electricity use or pure exergy sources and the values would be equal to exergy
saving as it is technically correct to use exergy instead of energy.
Table 1 List of reported studies in the literature on high temperature cooling systems applications in buildings
Authors
(year)
High
temperatur
e cooling
system
Air
system
/
distribu
tion
City /
Climate
Type
Investigation
approach
Main findings-
Energy/exergy saving
Mumma
(2002) RCP
DOAS /
CS-CE
Philadelphi
a-USA /
humid
subtropical
Building
performance
simulation
VAV costs about 29 % more to
operate compared to DOAS-
RCP
Novoselac
and Srebric
(2002)
RCP DV
Various
locations
and
climates
Literature
review
VAV-RCP design may or may
not save energy compared to
VAV system
Kosonen
and Tan
(2005)
ACB CS-CE
Singapore /
tropical
rainforest
Field
Measurements
Comfort room condition is
achievable with both DOAS-
ACB and VAV-ACB
Vangtook
and
Chirarattan
on (2007)
RCP /
TABS -
Central
Thailand /
tropical
savanna
Building
performance
simulation
Radiant cooling with chilled
water from cooling tower can
be applied for low heat gain
spaces
Tian and
Love
(2009)
TABS DOAS
cold and
dry to very
hot and
humid
Building
performance
simulation
Annual energy saving of
DOAS-TABS compared to all
air systems ranges between 10
- 40 % for different climates
Schiavon et
al. (2012) RCP DV - Test chamber
Higher contribution of chilled
ceiling in removal of cooling
load results in lower room
stratification
Chiang et
al. (2012) RCP CS-CE
Taipei-
Taiwan /
humid
subtropical
Test chamber
/ CFD
simulation
Air supply temperature plays
the most important role and
rise of this temperature can
result in higher cooling
capacity of ceiling panel
Wang and
Tian (2013) RCP DOAS -
Test chamber
/ CFD
simulation
magnitude of factors’ impact
has an order of air supply
temperature > panel coverage
area > panel temperature > air
supply volume
Sastry and
Rumsey
(2014)
TABS DOAS
Hyderabad-
India /
tropical
Field
Measurements
DOAS-slab cooling consumes
34 % less energy compared to
VAV system on annual basis

50
savanna
The applications of the low exergy technologies are abundant for temperate
and dry climate, although their applications for the tropics are sparse. In
particular for the high temperature cooling strategy, the condensation problem
imposes restriction on supply chilled water temperature and as a consequence
on cooling capacity of radiant system. The building system group at
Department of Architecture in ETH, Zurich has conducted extensive research
on the application of the low exergy technologies in the buildings. These low
exergy technologies including decentralized air supply units and radiant panels
have been designed by this group for the continental climate of Zurich and
successfully installed in a building inside the ETH campus (HPZ building).
This design is a combination of decentralized concept with DOAS-RCP which
seeks integration with building structure and other building services including
lighting. The group further expanded this design and customized it for the
tropical climate of Singapore inside a laboratory called BubbleZERO
(Bruelisauer et al., 2013). In this concept, dehumidified and cool outdoor air
satisfies the latent load, the ventilation requirement and part of space sensible
load while radiant panels satisfy the rest of sensible load. The results of the
preliminary evaluation in this laboratory showed that humidity level in the
supplied outdoor air and infiltration rate of space should be closely controlled
to avoid condensation on radiant panels (Meggers et al., 2013). In another
evaluation study in the BubbleZERO on the feasibility of high temperature
cooling, it was concluded that a water-based radiant cooling is feasible in the
tropics and supply air condition at diffuser level and stored humidity in the
façade during system start up are the critical parameters (Iyengar et al., 2013).

51
Overall, the air-water system can potentially save energy compared to the
all air system by using water as a more efficient heat transfer medium and
reducing the amount of supply air. This decrease in supply air volume can
result in downsizing AHU and duct size for a centralized air conditioning
system. In decentralized DOAS-RCP concept, water has been further circulated
in the building by bringing the decentralized air supply units just close to the
conditioned space. So, the reduction in the fan energy compared to that for the
all air system would be more substantial. While this change increases the water
pump energy use in buildings, the overall required energy for air circulation is
much higher than that for water circulation.
The high temperature cooling concept can accommodate another aspect of
energy saving through implementation of DDOAS-RCP instead of the all air
system. Incorporating radiant cooling systems in buildings facilitates use of
higher chilled water temperature which can potentially save energy and exergy
by using a custom designed chiller for low temperature lift conditions. This
higher evaporator temperature can reduce the compressor work because of
lower temperature and pressure lift. The refrigeration cycles on pressure-
enthalpy diagrams for two cases of low temperature and high temperature
cooling is shown in Figure 12. As can be seen in this graph, with reduced lift
between low and high pressure side of refrigeration cycle, the compressor is
needed to perform less work done. This graph indicates the efficiency
superiority of the high temperature cooling concept over conventional air
conditioning system in the tropics. It is also noteworthy that by using low
exergy sources like solar power and ground, energy and exergy destruction
inside the refrigeration cycle can be further reduced.
52
Figure 12 Impact of raising the evaporative temperature on refrigeration
cycle diagram (Doyon, 2008)
Overall, most of the cited studies found an increased energy efficiency of
DOAS/radiant cooling systems compared to conventional systems with higher
perceived comfort for occupants in the conditioned space. Based on the
reported studies, supply air temperature and panel surface temperature have the
most dominant impacts on thermal stratification, energy saving and acceptance
of occupants. According to the knowledge of this author, no study has been
undertaken on performance evaluation of decentralized concept incorporated
into DOAS-RCP design for the tropics. Therefore, there is a lack of
understanding of key system related parameters in DDOAS-RCP design.
2.2 Thermal comfort and indoor air quality in the tropical context
DDOAS-RCP provides a new type of conditioned indoor space for the
occupants in the tropics and its compatibility with the International and local
standards and thermal comfort models needs to be investigated.
Acclimatization can also play a role in the tropical context which requires a

53
detailed understanding of the preference of locally acclimatized occupants.
Various studies have been conducted in the tropics to investigate the
acclimatization theory of the human body to hot and humid climates (Ole
Fanger and Toftum, 2002; Wong et al., 2002). The mainstream research on this
matter conducted to identify and quantify any possible acclimatization
behaviour among the habitants for naturally ventilated (NV) and air
conditioned spaces in this climate. Webb (1959) has investigated the overall
thermal sensation of fully acclimatized subjects in the equatorial climate of
Singapore and he provided an equation for Singapore index comfort which was
slightly higher than temperate climate standards. The optimum value of the
Singapore index was 25.9 ± 0.4 °C when 68 ± 8 % of occupants felt
comfortable. Thirty years later, in two separate studies by Busch (1992) and de
Dear et al. (1991), field experiments and thermal comfort studies have been
conducted respectively in Bangkok and Singapore. Busch’s study in Bangkok
revealed that the upper bound of acceptable effective temperature is 28 °C for
air conditioned spaces and 31 °C for naturally ventilated buildings. Both of
these values were significantly higher than the ASHRAE 55-81 (1981)
standard limit at the time of the study, which was 26.1 °C. Although these
results showed the evidence of the acclimatization for tropical occupants, it
lacks detailed information on air speed in space and clothing level of office
workers. On the other hand, the results of de Dear et al. (1991)’s study have
shown that occupants find the NV spaces at 29.6 °C and 74 % RH (0.22 m/s,
0.26 clo.1) slightly warm, while their response was on the cool margin in the air
conditioned space at 23.5 °C and 56 % RH (0.11 m/s, 0.44 clo.). No sign of
1 Clothing level
54
acclimatization has been observed for air conditioned space in this
investigation.
de Dear et al. (2013) reviewed the trend of thermal comfort studies in the
last two decades and they observed the paradigm shift from heat-balanced
thermal comfort models toward adaptive models. They also noticed the
rehabilitation of air movement perception from negative to positive language.
As an example of such studies in recent years for the tropical climates, in two
large cities in the south of India (Chennai and Hyderabad), Indraganti et al.
(2014) found the mean comfort temperature to be 28.0 °C and 26.4 °C for NV
and AC offices, respectively. They proposed a linear correlation between
indoor comfort and outdoor temperature and the slope of the curve was close to
the reported slope in ASHRAE standard 55 (2004), CEN standard (2007) and
CIBSE guide (2006). In a similar study at hot and humid climates of Changsha,
Guangzhou, and Shenzhen in central south of China, Han et al. (2007) obtained
a higher neutral operative temperature than Fanger’s PMV model prediction
and the difference was attributed to the thermal adaptation of humans.
However, the survey was conducted at both AC and NV homes and the
subjects were allowed to adjust their heat balance by other means like clothing,
windows and fan. So the results do not necessarily support the acclimatization
theory. In another study at the tropical climate of Brazil, the volunteers’
response in air conditioned spaces was similar to the PMV predictions, while in
NV buildings, there was a significant difference between thermal sensation
vote and predicted mean vote (Andreasi et al., 2010).
In local context of Singapore, Chen and Chang (2012) investigated the
overcooling perception of office workers in Singapore and the results showed

55
the average indoor temperature of 24.5 °C is too cold as expressed by actual
occupants’ thermal sensation vote while it is in-line with the PMV model
comfort range. This study identified overcooling as the main concern for office
buildings in the tropics and attributed this observation to acclimatization of
occupants and design of ACMV system. Contrary to these results, Willem and
Tham (2007) showed that tropically acclimatized subjects prefer a neutral to
slightly cool thermal sensation, which is optimized when the thermal sensation
was -0.4. In another field study in high rise public housing in Singapore, de
Dear and Leow (1990) found that acclimatized human in the tropics prefer 2 °C
warmer temperatures than the value predicted by the PMV model and the ISO
standard. Physiological acclimatization was suggested as the possible
explanation of this discrepancy between temperate climate models and actual
perception of subjects in the tropics. Regarding the impact of air movement,
Gong et al. (2006) showed that more than 30 % of locally acclimatized people
in the tropics still prefer higher air movement even at local temperature of 23.5
°C and local air velocity of 0.15 m/s. However, the results of this study are
mostly relevant for the applications of personal ventilation where the subjects
are exposed to the outdoor air coming toward their face. In a recent study,
Schiavon et al. (2015) investigated the effect of personally controlled air
movement on comfort level of tropically acclimatized occupants and they
found 98 % of subjects satisfied at temperature of 29 °C when they have access
to personal fan. This finding shows the higher draft tolerance of occupants in
the tropics which can be utilized for enhancing the energy saving in building
ACMV system by raising the indoor temperature. In a subjective study on
application of personal desktop fans (Melikov et al., 2013), no concerns

56
regarding the SBS has been reported and better perceived air quality has been
observed with increased air movement. However, humidity concern has been
reported by some studies (Shirey and Henderson, 2004) at part load operation
of CAV design which could cause IAQ issues in indoor environment with
increased set point temperature. Regarding the application of radiant cooling in
office buildings, Bolashikov et al. (2013) investigated the thermal comfort
level in an office environment with four different types of convective/radiant
cooling systems. The results of experiments with 24 human subjects revealed
that the indoor space with radiant cooling had a more homogenous thermal
environment and occupants were more satisfied with radiant cooling rather
than convective cooling. Nevertheless, this comfort study was conducted with
local subjects in Denmark and local occupants in tropical context may have
different comfort preferences. The details of the studies in the literature on
thermal comfort sensation of occupants in conditioned spaces of warm and
humid climates are listed in Table 2.
Table 2 List of reported studies in the literature on thermal comfort sensation of occupants in warm and humid climates
Authors
(year)
Air system /
distribution
City /
Climate
Type
Investigation
approach (
No. subjects)
Main findings
De Dear
et al.
(1991)
NV / MF /
AC
Singapor
e /
tropical
rainforest
Field study (818)
Occupants prefer warmer temperature in
NV spaces but no sign of acclimatization
has been observed for AC spaces
Busch
(1992)
NV / MF /
AC
Bangkok-
Thailand
/ tropical
savanna
Field study (1100)
Upper bound of acceptable effective
temperature is 28 °C for AC spaces and
31 °C for NV buildings
Gong et
al.
(2006)
AC (MV-
PV)
Singapor
e /
tropical
rainforest
Test chamber
study (24)
30 % of locally acclimatized occupants
prefer higher air movement even at local
temperature of 23.5 °C and air velocity of
0.15 m/s

57
Han et
al.
(2007)
NV / MF /
AC
Central
southern
china /
Summer
Field study (110)
Higher neutral operative temperature than
Fanger’s PMV model prediction due to the
thermal adaptation of humans
Willem
and
Tham
(2007)
AC (MV)
Singapor
e /
tropical
rainforest
Test chamber
study (96)
Tropically acclimatized subjects prefer a
neutral to slightly cool thermal sensation,
which is optimized when the thermal
sensation was -0.4
Andreasi
et al.
(2010)
NV / MF /
AC
3 cities in
Brazil /
tropical
savanna
Field study (1301)
Occupants’ response in AC spaces was
similar to PMV, while in NV buildings,
there was a significant difference
Chen
and
Chang
(2012)
AC (MV)
Singapor
e /
tropical
rainforest
Field study (210
onsite and 98
online)
Average indoor temperature of 24.5 °C is
too cold as expressed by actual occupants’
thermal sensation vote
Indragan
ti et al.
(2014)
NV / MF /
AC
2 cities in
India /
tropical
savanna
Field study (2787
subjects and 6048
responses)
Mean comfort temperatures were 28.0 °C
and 26.4 °C for NV and AC offices,
respectively
Schiavo
n et al.
(2015)
AC (MV-PF)
Singapor
e /
tropical
rainforest
Test room study
(56)
98 % of subjects were satisfied at
temperature of 29 °C when they have
access to personal fan
The main goal of sustainable healthy buildings is to achieve healthy,
comfortable and productive indoor spaces with least amount of exergy
consumption and environmental impacts. The low exergy designs
incorporating decentralized dedicated outdoor air system coupled with radiant
cooling could be effective in achieving this for the tropical climate. For
conventional means of mechanical dehumidification, a design prerogative is to
minimize ventilation rates, since dehumidification entails exergy destruction
due to the required low temperatures. With improved ventilation effectiveness
of the design, the minimum required ventilation rate can be lowered without
compromising the indoor air quality. Depending on the location of air supply
outlets, and exhaust grilles as well as ventilation rate and supplied air
condition, air flow pattern could be close to the ideal scenarios of fully mixed

58
(air change efficiency (ACE)=50%) or piston (ACE=100%) strategies. An
indoor air pattern with ACE between 50-100 % is categorized as displacement
flow and with ACE below 50%, it is called a short-circuit flow (REHVA
Guidebooks No. 2, 2004).
Ventilation effectiveness indices including air change efficiency (ACE) and
contaminant removal effectiveness (CRE) are used to quantify the ability of air
flow patterns to exchange air and remove air-borne contaminants, respectively.
Several standards and handbooks provide guidelines on the procedure of
calculating these values based on data from experiments or numerical
modelling (ASHRAE 129, 2002; REHVA Guidebooks, 2004; REHVA
Guidebooks, 2007). Although it was shown by several studies (Awbi, 1998;
Gan, 1995) that displacement ventilation is more effective, Simon and Waters
(1998) and Lin et al. (2006) concluded that in operation, indoor air pattern with
near floor supply diffusers is more complicated than expected. Depending on
the locations of heat sources and diffusers, near floor supply of air may not
necessarily improve the air quality near occupants. Tomasi et al. (2013)
investigated the ventilation effectiveness of residential rooms with mixing
ventilation and floor heating / cooling and they found that ACE and CRE could
give contradictory information on the effectiveness of air distribution. They
recommended considering both values in the design process and accompanying
experiments with computational fluid dynamics (CFD) simulations.
The majority of research results in the literature showed that the PMV
model fails to predict the actual response of acclimatized occupants in the
tropics especially for naturally ventilated spaces. However, for conditioned
spaces in the tropics, slightly warmer neutral temperature compared to PMV

59
prediction has been reported and this difference ranges from 0 to 2 °C while
one study even reported slightly cooler temperature is preferred by local
occupants (Andreasi et al., 2010; de Dear and Leow, 1990; Indraganti et al.,
2014; Willem and Tham, 2007). The bilateral (upper and lower) deviation of
actual perception of locally acclimatized occupants toward PMV prediction as
reported in the literature shows the moderate stance of this model and improves
its credibility for the conditioned spaces in the tropics. While a general comfort
model like PMV can provide a good understanding of the actual perception of
occupants for this design, it still cannot capture all the details of such an indoor
space. Thermal perception, adaptation and acceptability of locally acclimatized
occupants toward this new concept are taken into account through considering
local standards of Singapore. It was also understood that ventilation
effectiveness analysis of the selected air distribution strategy is necessary to
evaluate the ability of system for purging the generated pollutants.
2.3 Indoor air CFD simulation
In the literature, CFD simulation has been extensively used in indoor air
studies to capture air flow and temperature distribution as well as contaminant
dispersion in indoor spaces. CFD also opened new directions of research to be
further explored like near-body micro-environment and disease transmission
research (Li and Nielsen, 2011; Siddiqui et al., 2012). Good agreements have
been achieved between the CFD results and measured data for air velocity,
temperature, and concentration of pollutants like TVOCs, formaldehyde, CO2
and toxic gas release in indoor spaces (Bulińska et al., 2014; Hayashi et al.,

60
2002; Panagopoulos et al., 2011; Siddiqui et al., 2012). Bulinska et al. (2014)
showed that numerical models can be successfully incorporated to predict the
spatial distribution of carbon dioxide exhaled by a person in a room. The
results have shown the strong impact of the geometry of the components
inside the room like window and radiator on dispersion pattern of CO2 in the
space. Hayashi et al. (2002) conducted a CFD analysis on the characteristics of
contaminant inhalation by occupants under different postures. The results have
shown that standing occupant inhales air from area close to the floor which
rises due to the metabolic heating and the region of inhalation extends
horizontally around the head for the case of sleeping occupant. In another
study, Panagopoulos et al. (2011) used CFD techniques to predict TVOCs and
formaldehyde distribution in an apartment with full-scale kitchen and living
room. They concluded that CFD model can improve indoor pollution
management system by optimizing sizing and siting of ventilation schemes.
Siddiqui et al. (2012) also investigated different accidental release scenarios of
dense gases in the indoor space with CFD simulations. The results have shown
that the dense toxic chlorine gas spreads like a liquid close to the floor.
Computational fluid dynamics (CFD) is gaining more weight in ventilation
and indoor air research due to the increase in computer hardware capabilities.
CFD has been widely used in the past to investigate buoyancy driven flow
around human body (Rim and Novoselac, 2009; Sørensen and Voigt, 2003),
air pollutant dispersion and inhalation (Bulińska et al., 2014; Hayashi et al.,
2002; Panagopoulos et al., 2011) and thermal comfort criteria (Catalina et al.,
2009; Chiang et al., 2012) for different types of air conditioning and
distribution strategies. Catalina et al. (2009) used CFD technique to explore

61
the characteristics of an indoor space with chilled ceiling panel and they found
vertical thermal stratification to be less than 1 °C. In another study, Chiang et
al. (2012) employed CFD tool to provide design solutions to improve the
performance of radiant cooling ceiling for the subtropical climate of Taiwan.
They concluded that cooling efficiency can be improved by supplying air on
the floor level and distributing it to multiple diffusers all over the floor.
Sørensen and Voigt (2003) conducted a CFD study to predict heat transfer and
flow pattern around a seated manikin and they achieved good agreement with
particle image velocimetry (PIV) measurements on velocity magnitude above
manikin head as well as for radiative and convective heat transfer coefficients
of different body segments. In similar studies, Hayashi et al. (2002) and Rim
and Novoselac (2009) investigated thermal plume near human body in indoor
space through CFD simulation and they found that buoyancy driven flow
plays an important role in transport of pollutants near occupants and their
inhalation through breathing. These results show the significance and potential
contributions of CFD technique to analyse the characteristics of DDOAS-RCP
with FS-CE distribution for the tropical context.
The k-ε turbulence model is the most widespread model in the industry and
also in the building research field. However, it has been reported in the
literature that the shear stress transport (SST) turbulence model, which is the
combination of the standard k-ε model (in far field flow) and the k-ω model (in
wall boundary layer) perform better in indoor air CFD studies especially for
flows dominated by wake and shear regions (Yang et al., 2007; Yousaf et al.,
2011). Yang et al. (2007) used CFD predictions of air flow and temperature
distribution around a computational thermal manikin to determine convective

62
and radiant heat transfer coefficient around human body. The results showed
good agreement with published data in the literature. This group tried to find
the whole-body values of heat transfer coefficient and they have not embarked
on calculation of coefficients for each body segment. Yousaf et al. (2011) also
conducted a full scale analysis of buoyancy air flow around human body with
CFD and particle image velocimetry (PIV) and the results of simulation and
experiments compared very well. In indoor air CFD simulation, the details of
air flow patterns and heat transfer near the diffusers and human body are
mostly the points of concerns. This matter has been elaborated by Abdilghani
et al. (2009) and Sorensen and Voigt (2003), respectively for inlet turbulence
intensity and flow around the simulated manikin. Martinho et al. (2012)
investigated the inherent error with CFD computation of air flow and heat
transfer around the human body. The results demonstrated that grid refinement,
boundary conditions, turbulence models, and human body model can have
significant impacts on the flow pattern around the simulated person. They also
achieved a good agreement compared to experimental data with the mixed
turbulence model (SST) of k-ε and k-ω. Overall, the results of the previous
studies showed that grid refinement, boundary conditions, and turbulence
models are the main factors, which could affect the accuracy of the CFD
results.
The characteristics of a conditioned indoor space with DDOAS-RCP are
unique in terms of thermal stratification, air movement and the difference
between mean radiant and dry bulb temperatures. CFD is a complimentary
approach with experimental setup and it has the potential to reveal and further
illustrate features of this low exergy design. The literature is abundant with
63
studies of the numerical modelling of indoor air spaces and the majority of
them have achieved good agreement with experimental results. The CFD
model has the potential to provide insights into characteristics of indoor space
conditioned with DDOAS-RCP in the tropics.
In the next section, the identified knowledge gaps based on the conducted
literature review are summarized and discussed.
2.4 Identification of knowledge gap
Implemented cases of low exergy air conditioning strategies like RAS-RCP
and RAS-ACB have been reported in the previous research projects and actual
buildings in the tropics, although no case has been found on the
implementation of DOAS-RCP. In particular, the combination of decentralized
concept with DOAS-RCP is a new design for both temperate and tropical
buildings. The amount of supply in DOAS types of high temperature cooling is
considerably lower than RAS types of HTC which has impacts on operational
condition, indoor environment and fan energy use of the design. In the first part
of a group project conducted at the low exergy module of Future Cities
Laboratory, the feasibility of DDOAS-RCP operation in the tropics has been
investigated. However, there are still many unanswered questions on
performance, thermal comfort and indoor air quality aspects of this design in
the tropical context.
DDOAS-RCP provides unique indoor air characteristics with lower air
movement and mean radiant temperature and it is required to further elaborate
and quantify the differences of such a system with that of conventional
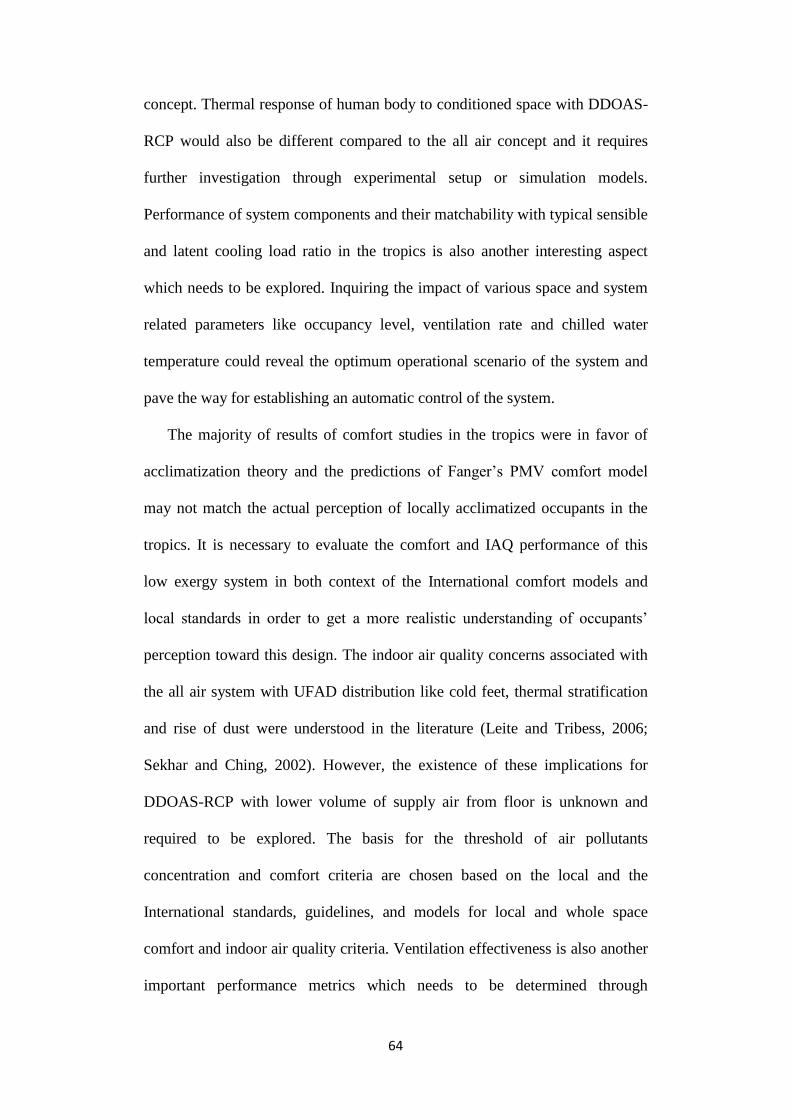
64
concept. Thermal response of human body to conditioned space with DDOAS-
RCP would also be different compared to the all air concept and it requires
further investigation through experimental setup or simulation models.
Performance of system components and their matchability with typical sensible
and latent cooling load ratio in the tropics is also another interesting aspect
which needs to be explored. Inquiring the impact of various space and system
related parameters like occupancy level, ventilation rate and chilled water
temperature could reveal the optimum operational scenario of the system and
pave the way for establishing an automatic control of the system.
The majority of results of comfort studies in the tropics were in favor of
acclimatization theory and the predictions of Fanger’s PMV comfort model
may not match the actual perception of locally acclimatized occupants in the
tropics. It is necessary to evaluate the comfort and IAQ performance of this
low exergy system in both context of the International comfort models and
local standards in order to get a more realistic understanding of occupants’
perception toward this design. The indoor air quality concerns associated with
the all air system with UFAD distribution like cold feet, thermal stratification
and rise of dust were understood in the literature (Leite and Tribess, 2006;
Sekhar and Ching, 2002). However, the existence of these implications for
DDOAS-RCP with lower volume of supply air from floor is unknown and
required to be explored. The basis for the threshold of air pollutants
concentration and comfort criteria are chosen based on the local and the
International standards, guidelines, and models for local and whole space
comfort and indoor air quality criteria. Ventilation effectiveness is also another
important performance metrics which needs to be determined through

65
experimental setup for a typical design of DDOAS-RCP under FS-CE
distribution.
The potential and usability of CFD for indoor air science has been shown
by numerous numerical studies in the literature. The aim of the present work
was to develop a CFD model to capture the indoor air characteristics of
DDOAS-RCP in the tropical context. A verified and validated simulation
model can be used to explore spatial distribution of environmental parameters
under various operational scenarios of system and space. It also can help to
identify any comfort or air quality issues associated with configuration of
supply diffusers and exhaust points in the conditioned space.
One of the energy and exergy saving opportunities in application of
DDOAS-RCP in the tropics comes from the high temperature cooling idea
behind this design. This saving compared to conventional system is more
pronounced when the high temperature cooling system which is radiant cooling
panel in this design is connected to a designated chiller for low temperature lift
condition. A significant enhancement in efficiency of chiller for radiant cooling
can outweigh the added maintenance cost of having two separate chillers in
DDOAS-RCP design. This study tried to explore the potential benefits of
incorporating a low temperature lift chiller in the tropical context.
The feasibility of the low exergy technologies depicted as DDOAS-RCP in
the tropics has been investigated through experimental setup in the
BubbleZERO. However, there are too many unanswered questions remained
which need further investigations. The indoor air characteristics of the
conditioned space with DDOAS-RCP and thermal response of human body to
this system can be further explored. The thorough understanding of impacts of
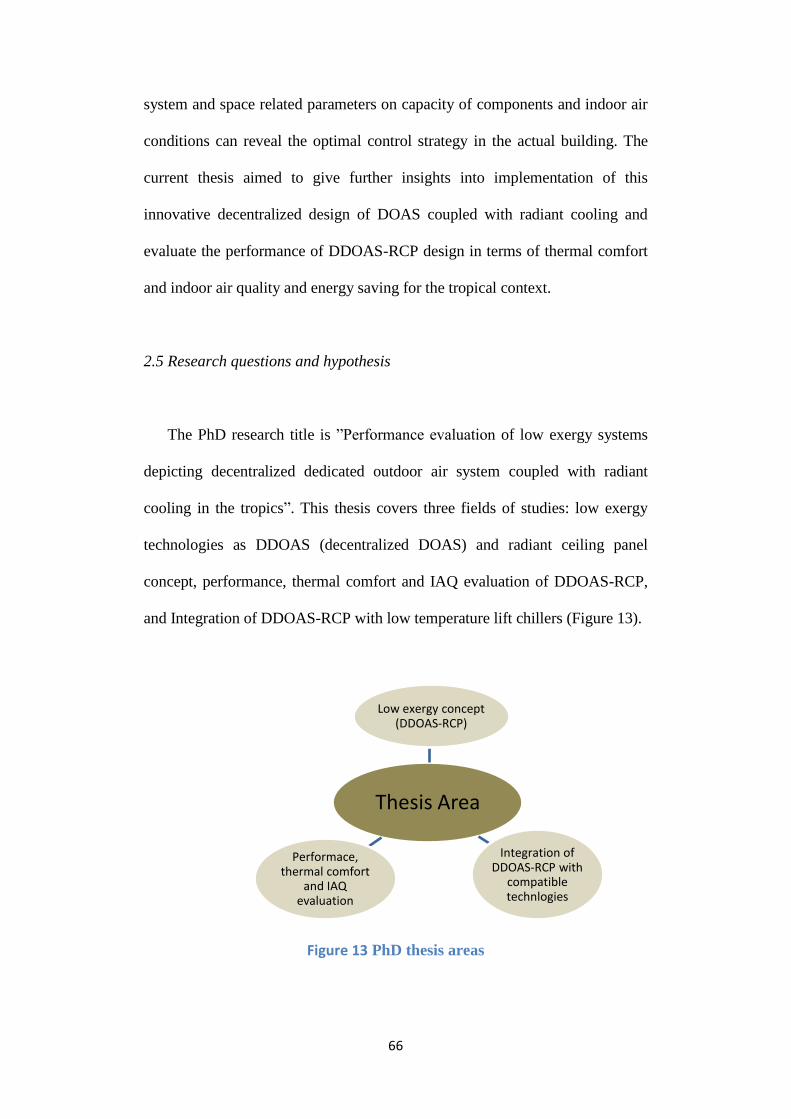
66
system and space related parameters on capacity of components and indoor air
conditions can reveal the optimal control strategy in the actual building. The
current thesis aimed to give further insights into implementation of this
innovative decentralized design of DOAS coupled with radiant cooling and
evaluate the performance of DDOAS-RCP design in terms of thermal comfort
and indoor air quality and energy saving for the tropical context.
2.5 Research questions and hypothesis
The PhD research title is ”Performance evaluation of low exergy systems
depicting decentralized dedicated outdoor air system coupled with radiant
cooling in the tropics”. This thesis covers three fields of studies: low exergy
technologies as DDOAS (decentralized DOAS) and radiant ceiling panel
concept, performance, thermal comfort and IAQ evaluation of DDOAS-RCP,
and Integration of DDOAS-RCP with low temperature lift chillers (Figure 13).
Figure 13 PhD thesis areas
Thesis Area
Low exergy concept (DDOAS-RCP)
Integration of DDOAS-RCP with
compatible technlogies
Performace, thermal comfort
and IAQ evaluation

67
This research aimed to evaluate performance, thermal comfort and indoor
air quality aspects of conditioned spaces with the low exergy ventilation
technologies in the tropics. The research questions of the thesis are as follows,
What are the indoor air characteristics of a conditioned space with
DDOAS-RCP in the tropics under various system and space related
parameters?
Are there any particular indoor air quality and comfort concerns for
implementation of decentralized DOAS-radiant ceiling panel in
tropical office buildings?
Where does DDOAS-RCP with FS-CE distribution stand in terms
of ventilation effectiveness indices?
How much is the energy and exergy saving potential for DDOAS-
RCP when it is connected to low lift chillers?
The hypothesis of the PhD thesis is as follows,
“Low exergy ventilation technologies depicted as decentralized dedicated
outdoor air system coupled with radiant cooling can provide acceptable indoor
air quality and thermal comfort in tropical buildings with less destruction of
exergy”
In the next chapter, the followed methodology in experimental setup and
numerical simulations are presented.

68
Chapter 3. Research methods
The methodologies adopted for the evaluation of different aspects of
DDOAS-RCP performance in the tropics are elaborated. The low exergy
technologies implemented in the BubbleZERO including decentralized air
supply units and radiant cooling panel are introduced. In the subsequent
sections, the measured environmental and system parameters are discussed as
well as thermal comfort, air quality and ventilation effectiveness indices.
Regarding the CFD simulation procedure, information is provided on geometry
modelling and mesh generation. In addition, energy and exergy saving
potentials of high temperature cooling applications are explained and explored.
3.1 Research design
In order to answer the research questions, the investigation has been
divided into three areas of experimental studies, numerical indoor air
simulation and analysis of integration with low lift chillers. The research
workflow of the thesis is shown in Figure 14. At first, knowledge gaps and
research questions were identified based on the literature review. After defining
the scope and objectives of study, experiments were conducted in the test bed
of the low exergy cooling and ventilation technologies (BubbleZERO) under
various operational scenarios of the system. These experiments could reveal the
optimal operating conditions of the system in terms of thermal comfort and
indoor air quality. For thermal comfort evaluation of the system, local and
whole space comfort models available in the literature were used to predict the

69
mean vote of occupants in each scenario. In parallel to these experiments, CFD
simulation model was utilized to get a better understanding of indoor air spatial
distribution (e.g. thermal stratification) and flow pattern in the space. In
addition, the integration of DDOAS-RCP with low lift chillers was investigated
based on the collected data in the experimental setup and available studies in
the literature. At the end, the outcomes of the investigations are discussed and
recommendations are provided for future work.
Figure 14 PhD thesis research workflow
Various metrics and indices have been employed to systematically evaluate
the performance of this low exergy system in tropical buildings. This
evaluation covers different aspects of DDOAS-RCP including thermal comfort,
air quality, energy saving and practical implications. The employed indices and
metrics as well as the corresponding approaches in this investigation are listed
Literature review
knowledge gap
Research questions
Scope and objectives of
study
Experimental setup
DDOAS-RCP Performance
evaluation
Impact of system and space related
parameters
Thermal comfort and indoor air
quality performace
Ventilation effectiveness
analysis
Numerical simulation
Indoor air characteristics
Integration with low lift chillers
Efficiency of low lift chillers in the
tropics
Energy saving potentials of DDOAS-RCP
Discussion and conclusions
Main findings and conclusions
Recommendations for future work
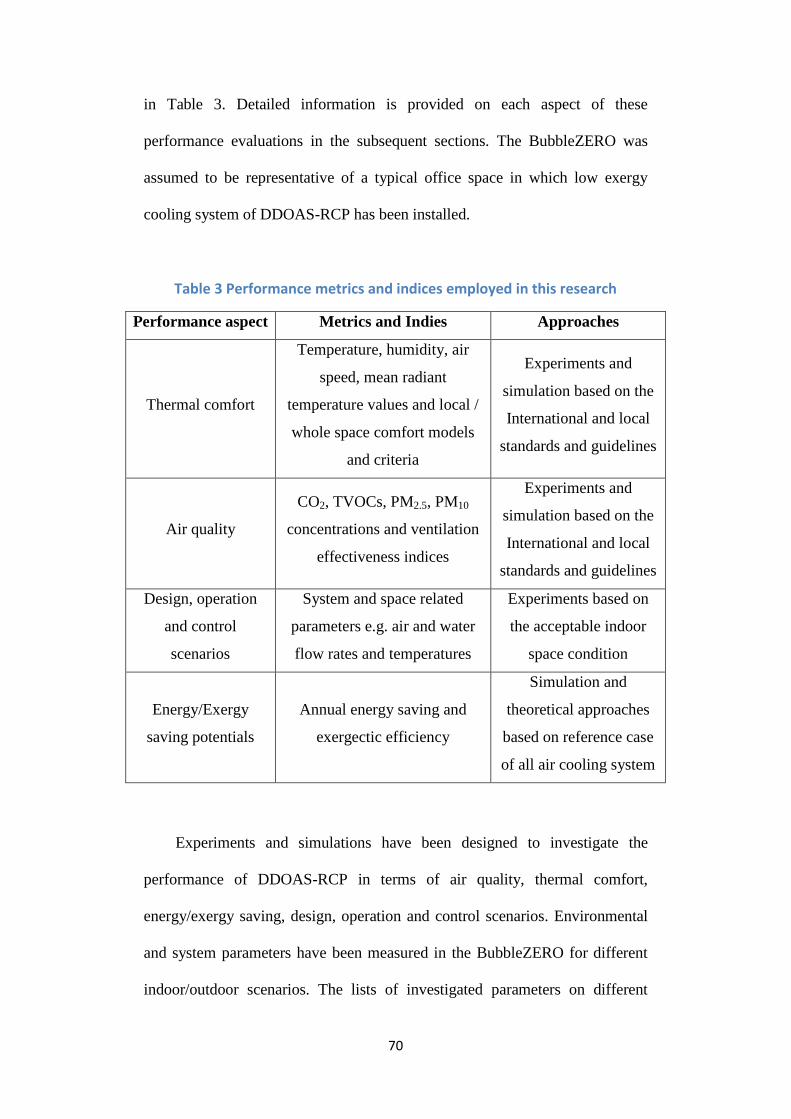
70
in Table 3. Detailed information is provided on each aspect of these
performance evaluations in the subsequent sections. The BubbleZERO was
assumed to be representative of a typical office space in which low exergy
cooling system of DDOAS-RCP has been installed.
Table 3 Performance metrics and indices employed in this research
Performance aspect Metrics and Indies Approaches
Thermal comfort
Temperature, humidity, air
speed, mean radiant
temperature values and local /
whole space comfort models
and criteria
Experiments and
simulation based on the
International and local
standards and guidelines
Air quality
CO2, TVOCs, PM2.5, PM10
concentrations and ventilation
effectiveness indices
Experiments and
simulation based on the
International and local
standards and guidelines
Design, operation
and control
scenarios
System and space related
parameters e.g. air and water
flow rates and temperatures
Experiments based on
the acceptable indoor
space condition
Energy/Exergy
saving potentials
Annual energy saving and
exergectic efficiency
Simulation and
theoretical approaches
based on reference case
of all air cooling system
Experiments and simulations have been designed to investigate the
performance of DDOAS-RCP in terms of air quality, thermal comfort,
energy/exergy saving, design, operation and control scenarios. Environmental
and system parameters have been measured in the BubbleZERO for different
indoor/outdoor scenarios. The lists of investigated parameters on different

71
aspects of DDOAS-RCP performance are provided in the subsequent sections.
Tracer gas decay test has been conducted for ventilation effectiveness analysis
of this low exergy system. In addition, CFD simulation tool has been employed
to get a more elaborate understanding on variation of parameters in the
BubbleZERO. Several sampling strategies have been chosen for this
investigation. On one hand, some parameters have been measured continuously
at different locations inside the space to provide spatial and temporal
distribution of parameters over the course of experiments. On the other hand,
some parameters have been measured only at one location in which spatial
distribution was negligible. Spot measurements have also been conducted from
location to location and time to time to check the spatial and temporal
variations. The details of selected sampling strategy for each environmental
and system parameter are provided in the subsequent sections of this chapter.
3.2 BubbleZERO as test bed of low exergy systems
The BubbleZERO was the main test bed of this PhD thesis in which
various low exergy technologies have been installed. Its façade consisted of
two shipping containers that are attached to each other on their longitudinal
side, while the intersection surfaces of containers were removed. The
BubbleZERO is located in the open space with an inflated skin on north, south,
and roof of laboratory to provide a strong heat transfer barrier with the help of
air film and insulations. An air compressor was designated below the container
to maintain the necessary air pressure in the inflated skin. The infrared image
of the BubbleZERO including air compressor and its connections to the

72
inflated air skin is shown in Figure 15. East and west facades were mostly
made of glasses, metal frames and doors which introduce enough cooling load
and infiltration to the space to resemble a real office space. The visual
illustrations of the technologies installed in this laboratory are shown in Figure
16. Decentralized air supply units embedded into the structure of BubbleZERO
can bring in enough outdoor air through façade and dehumidify it to keep the
dew point of space below radiant panel surface temperature and avoid
condensation. As can be seen from the figure, conditioned air is distributed in
the space through embedded air ducts in the floor which are connected to seven
floor diffusers. The air ducts on one side of the laboratory are cast into concrete
and on the other side they are within the raised floor. These two floor
configurations have been implemented to investigate the performance of each
design. The concrete side has the potential to act as a thermal mass and provide
some level of heating to air supply ducts. On the other hand, the raised floor
side has enough free space to accommodate other building services. The
generated heat and pollutants leave the space via the four exhaust flaps
installed in the middle of radiant panel. The CO2-sensor controlled exhaust
flaps and ducts as well as LED lighting are embedded in these multifunctional
ceiling panels. The exhaust flap fully opens when the sensed CO2 level exceeds
an upper limit and it returns back to be partially open when the concentration
goes down below a lower limit. The back of LED strips are adjacent to exhaust
air stream and some part of generated heat by LED leave the space directly
through exhaust air flow.
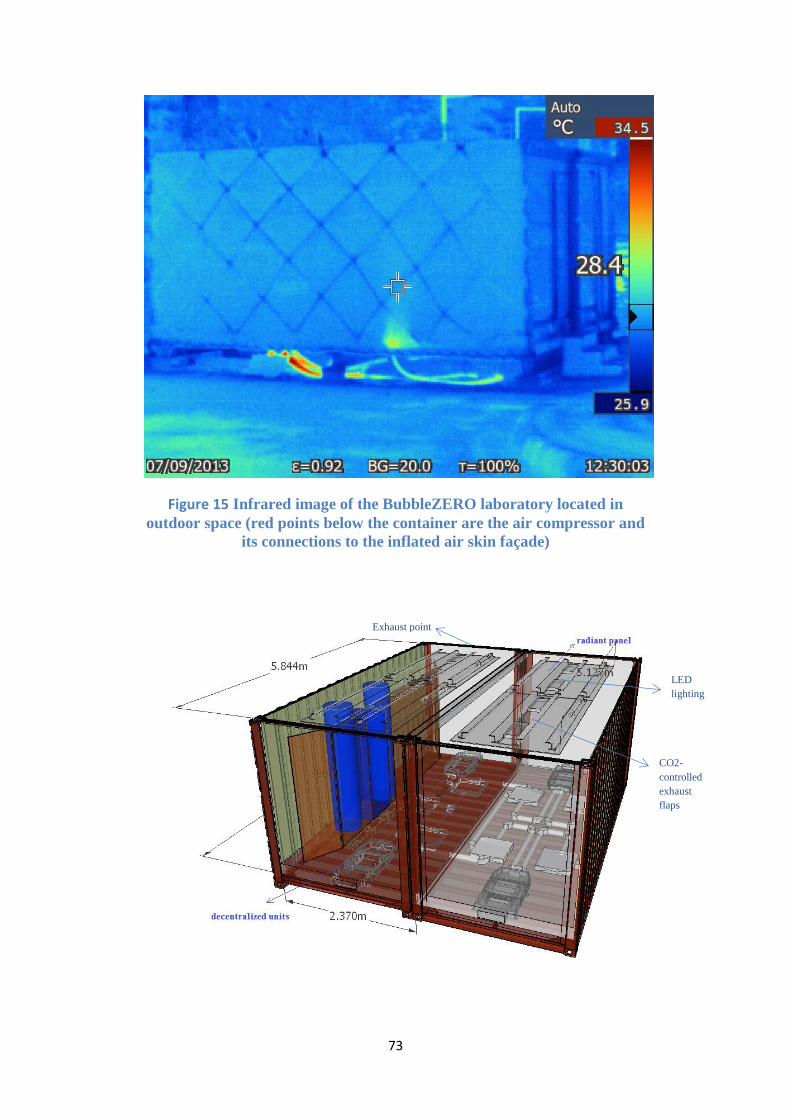
73
Figure 15 Infrared image of the BubbleZERO laboratory located in
outdoor space (red points below the container are the air compressor and
its connections to the inflated air skin façade)
Exhaust point
LED
lighting
CO2-
controlled
exhaust
flaps

74
Figure 16 Decentralized air supply units and radiant ceiling panel in the
BubbleZERO
DDOAS-RCP design installed in the BubbleZERO portrays the low exergy
technologies by incorporating the concept of the high temperature cooling as
radiant cooling system. Experimental studies were conducted in the
BubbleZERO for different scenarios of the system operations to explore the
impact of each parameter on indoor environmental conditions. The main space
related parameters that affect the thermal comfort, IAQ and energy usage of
decentralized DOAS are the outdoor air flow rate (ventilation rate), air supply
condition, and radiant panel surface temperature. The modular control system
of chillers, pumps and decentralized units in the BubbleZERO provides the
opportunities to assess the impact of these parameters. Independent control of
components has been designed to provide a suitable platform for conducting
experiments on each system separately. The schematic overview of DDOAS-
RCP installed in the BubbleZERO including the two chillers and tanks is
shown in Figure 17. The temperature lift of chiller is defined as the difference
between outdoor temperature and required chilled water temperature. In this
investigation, the chiller which is connected to radiant panel (15-17 °C chilled
water) labeled as low lift chiller and the one which is connected to
decentralized units (8-12 °C chilled water) labelled as high lift chiller. With this
arrangement, the designated low lift chiller for radiant cooling can operate at
higher COP (coefficient of performance) and reduce the energy consumption as
well as exergy destruction in the compressor of the chiller. Nevertheless, this
energy and exergy saving is significant when a custom designed chiller for low
temperature lift applications is used instead of typical chillers which are

75
available in the market. The level of improvement in exergetic efficiency of
refrigeration system for these types of low lift chillers compared to typical
chillers has also been explored in this research.
Figure 17 Schematic diagram of DDOAS-RCP installed in the
BubbleZERO
Implemented control strategies in the BubbleZERO
Two main control strategies have been implemented in the BubbleZERO to
evaluate the performance of the whole system and the individual components.
A control software has been designed as the main platform to modulate
different system related parameters. In the manual control mode, operational
conditions of each system components have been controlled individually based
on user input values. There is no interconnection between operation of
decentralized air supply units and radiant panel in this mode. This control
strategy is suitable for parametric analysis of system parameters. The main
parts of research in this thesis have been conducted in this mode and the
impacts of various system related parameters have been analysed. An
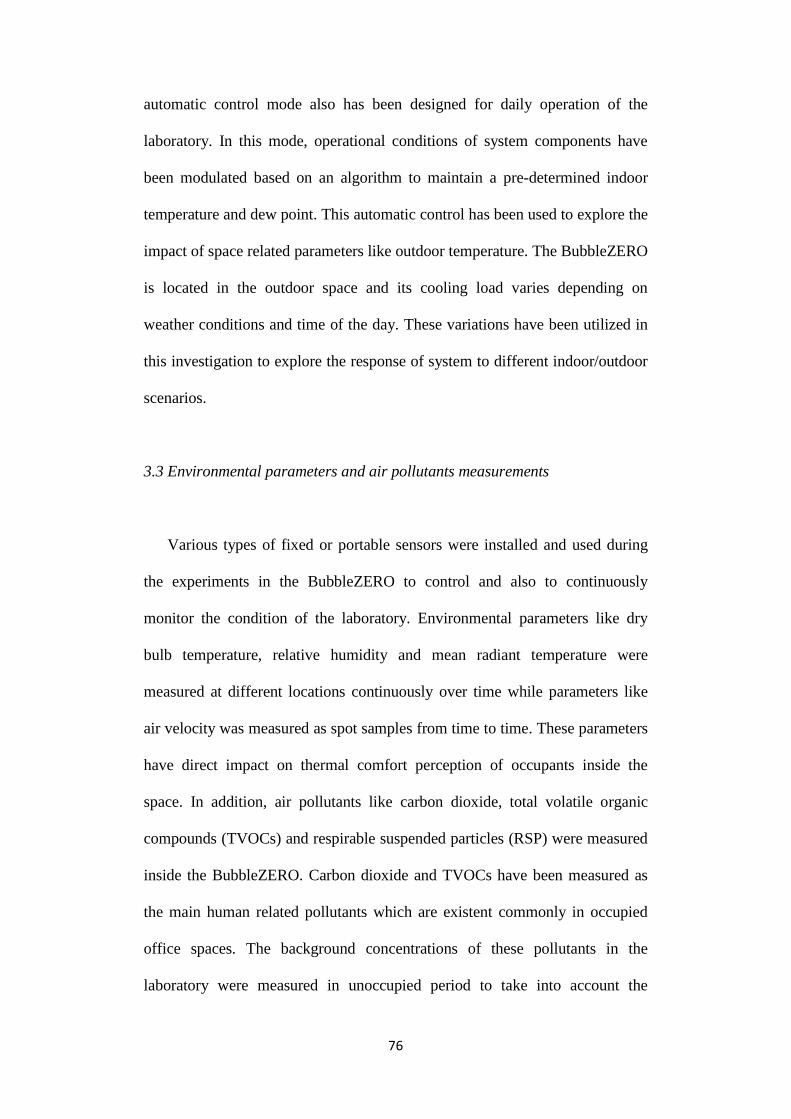
76
automatic control mode also has been designed for daily operation of the
laboratory. In this mode, operational conditions of system components have
been modulated based on an algorithm to maintain a pre-determined indoor
temperature and dew point. This automatic control has been used to explore the
impact of space related parameters like outdoor temperature. The BubbleZERO
is located in the outdoor space and its cooling load varies depending on
weather conditions and time of the day. These variations have been utilized in
this investigation to explore the response of system to different indoor/outdoor
scenarios.
3.3 Environmental parameters and air pollutants measurements
Various types of fixed or portable sensors were installed and used during
the experiments in the BubbleZERO to control and also to continuously
monitor the condition of the laboratory. Environmental parameters like dry
bulb temperature, relative humidity and mean radiant temperature were
measured at different locations continuously over time while parameters like
air velocity was measured as spot samples from time to time. These parameters
have direct impact on thermal comfort perception of occupants inside the
space. In addition, air pollutants like carbon dioxide, total volatile organic
compounds (TVOCs) and respirable suspended particles (RSP) were measured
inside the BubbleZERO. Carbon dioxide and TVOCs have been measured as
the main human related pollutants which are existent commonly in occupied
office spaces. The background concentrations of these pollutants in the
laboratory were measured in unoccupied period to take into account the

77
possibilities of emissions from non-human related sources like materials.
Respirable suspended particles also have been measured to evaluate the
possibility of resuspension of particles from floor supply diffusers into
breathing level. Locations of sampling points and seated occupants during the
experiments in the test bed are illustrated in Figure 18.
Figure 18 Illustration of sample points and seated occupants during
experiments
Thirteen sensor points have been considered for indoor environmental
measurements at four locations with three different heights and only one height
at the fifth location. Three heights of 0.1 m, 1 m and 1.8 m have been chosen to
cover three air zones corresponding to feet level, desk level and standing
breathing point. A wireless sensor network and control system has been used to
collect the real-time data and adjust system settings based on measured values
and user controlled set points. Air velocity, mean radiant temperature and air
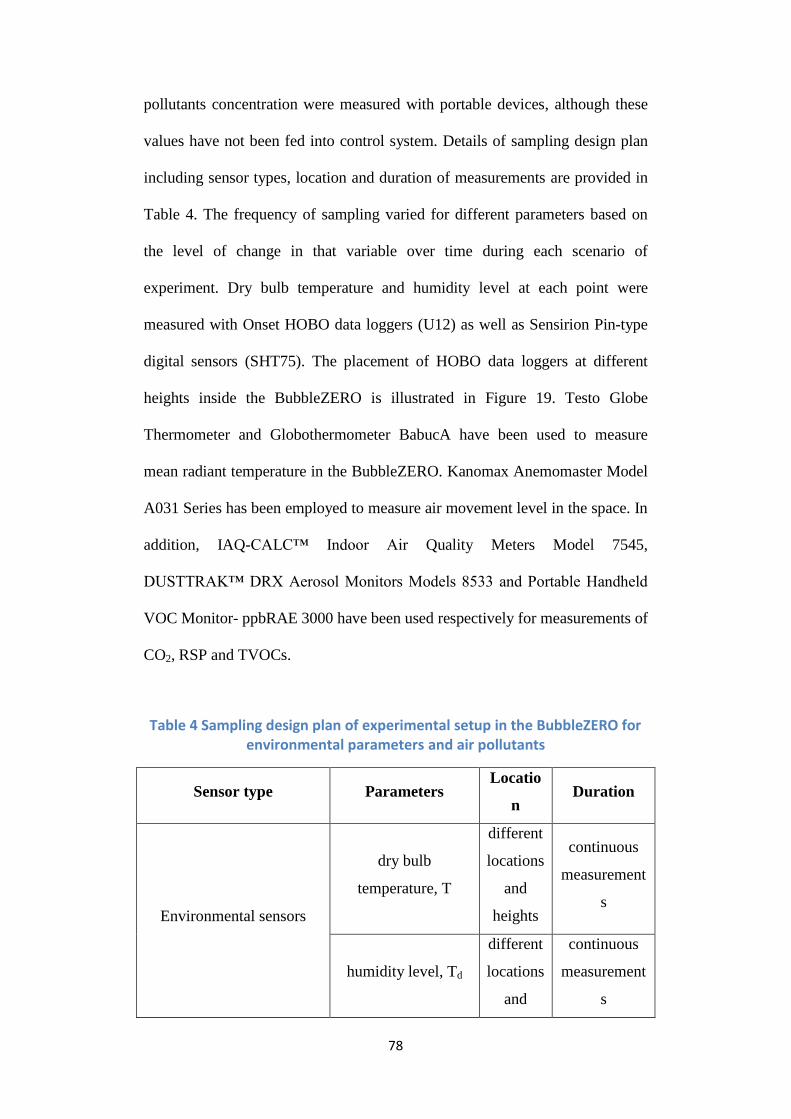
78
pollutants concentration were measured with portable devices, although these
values have not been fed into control system. Details of sampling design plan
including sensor types, location and duration of measurements are provided in
Table 4. The frequency of sampling varied for different parameters based on
the level of change in that variable over time during each scenario of
experiment. Dry bulb temperature and humidity level at each point were
measured with Onset HOBO data loggers (U12) as well as Sensirion Pin-type
digital sensors (SHT75). The placement of HOBO data loggers at different
heights inside the BubbleZERO is illustrated in Figure 19. Testo Globe
Thermometer and Globothermometer BabucA have been used to measure
mean radiant temperature in the BubbleZERO. Kanomax Anemomaster Model
A031 Series has been employed to measure air movement level in the space. In
addition, IAQ-CALC™ Indoor Air Quality Meters Model 7545,
DUSTTRAK™ DRX Aerosol Monitors Models 8533 and Portable Handheld
VOC Monitor- ppbRAE 3000 have been used respectively for measurements of
CO2, RSP and TVOCs.
Table 4 Sampling design plan of experimental setup in the BubbleZERO for environmental parameters and air pollutants
Sensor type Parameters Locatio
n Duration
Environmental sensors
dry bulb
temperature, T
different
locations
and
heights
continuous
measurement
s
humidity level, Td
different
locations
and
continuous
measurement
s

79
heights
mean radiant
temperature, 𝑇�̅�
different
locations
continuous
measurement
s
air velocity, V different
locations
spot
measurement
s
Air pollutants sensors
Carbon dioxide, CO2 different
locations
continuous
measurement
s
Respirable
suspended particles,
RSP
different
locations
spot
measurement
s
Total Volatile
Organic
Compounds, TVOCs
different
locations
spot
measurement
s

80
Figure 19 Onset HOBO data loggers U12 placed at three different heights
of 0.1 m, 1 m, 1.8 m for measurement of temperature and humidity
3.4 DDOAS-RCP system and space control and monitoring
The operational conditions of any ventilation and air conditioning system
are required to be modulated and controlled based on indoor/outdoor
conditions as well as thermostat feedback from building users. The DDOAS-
RCP design as an alternative solution to the conventional ACMV system in the
tropics is required to be investigated to get an understanding of the impact of
each operational scenario. Different sensors were installed on the system

81
components of DDOAS-RCP to monitor and control operational scenario
based on indoor/outdoor conditions. The schematic of sensor locations and
types on decentralized air supply units and radiant ceiling panels is shown in
Figure 20. Temperature sensors (St) were placed on supply and return water
pipes and flow rate sensors (Sf) were designated on chilled water loops to
determine the capacity of each component separately. The sensed data was
collected with a distributed wireless network system and real time control
decision was made to keep the indoor temperature in the comfort range. The
cooling capacity of each component has been determined based on collected
data on air and water sides of system. The air flow rate from each unit was
measured by an air flow hood on the floor diffuser and it was controlled
through modulation of fan speed installed in the unit. The interaction of air
system and water system happens through cooling coming from floor and
ceiling in opposite directions. In a free standing laboratory like the
BubbleZERO, outdoor condition is not controlled and it varies from morning to
afternoon. This variation has been utilized in this investigation to explore the
response of system to different outdoor scenarios.
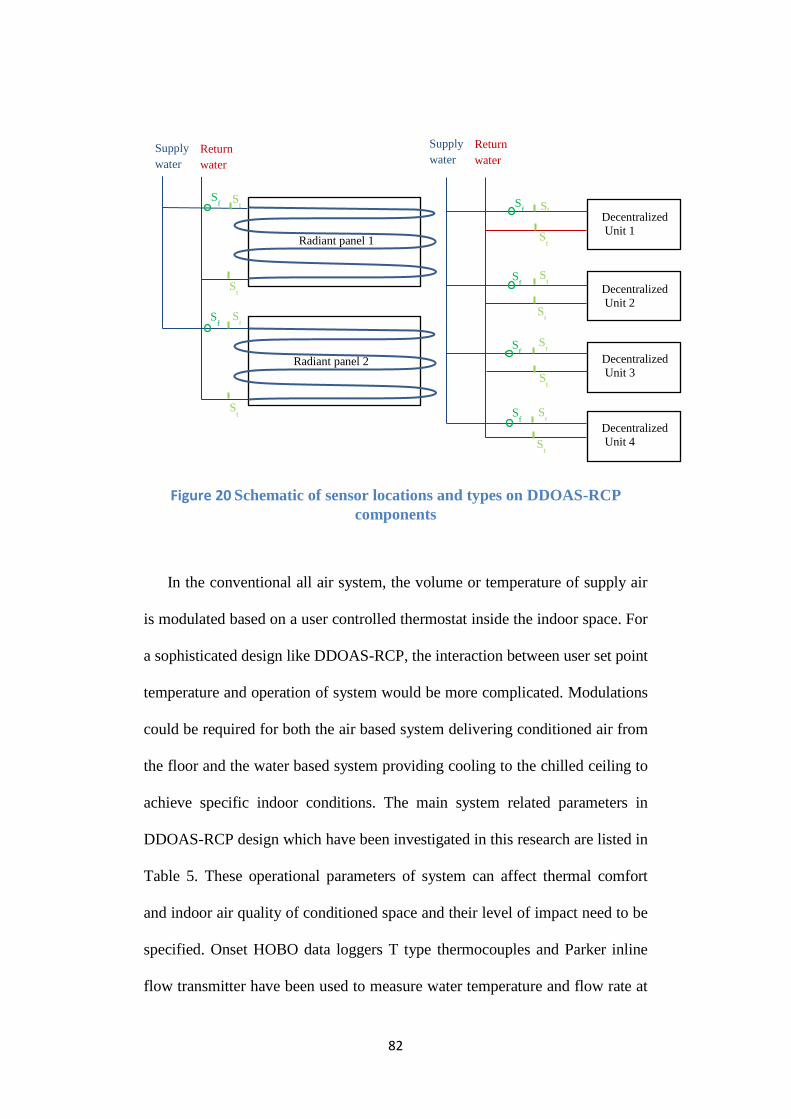
82
Figure 20 Schematic of sensor locations and types on DDOAS-RCP
components
In the conventional all air system, the volume or temperature of supply air
is modulated based on a user controlled thermostat inside the indoor space. For
a sophisticated design like DDOAS-RCP, the interaction between user set point
temperature and operation of system would be more complicated. Modulations
could be required for both the air based system delivering conditioned air from
the floor and the water based system providing cooling to the chilled ceiling to
achieve specific indoor conditions. The main system related parameters in
DDOAS-RCP design which have been investigated in this research are listed in
Table 5. These operational parameters of system can affect thermal comfort
and indoor air quality of conditioned space and their level of impact need to be
specified. Onset HOBO data loggers T type thermocouples and Parker inline
flow transmitter have been used to measure water temperature and flow rate at
St
St S
f
St
St S
f
Radiant panel 2
Radiant panel 1
Sf
St
St
St
St
St
Sf
Sf S
t
St
Sf St
Supply
water
Decentralized
Unit 1
Decentralized Unit 2
Decentralized Unit 3
Decentralized Unit 4
Return
water Supply
water Return
water

83
supply and return points of decentralized air supply units and radiant cooling
panel. The ventilation rate or air exchange rate of space was calculated based
on the results of tracer gas decay test with photoacoustic multi-gas monitor
Innova 1312.
Table 5 Main system related parameters in DDOAS-RCP design
System Parameters Variable (Unit) Range
Decentralized ventilation unit capacity Flow rate (L/s) 2.5-5 L/s
Decentralized ventilation unit water
supply/return temperature Water temperature (°C)
Supply/Return: 8-18
˚C / 13-23 ˚C
Decentralized ventilation unit water
flow rate Water flow rate (mL/s) 10-30 mL/s
Radiant panel water supply/return
temperature Water temperature (°C)
Supply/Return: 16-
19 ˚C / 18-21 ˚C
Radiant panel water flow rate Water flow rate (mL/s) 15-40 mL/s
In addition to the system related parameters, there are some space related
variables which their impacts on indoor air conditions are coupled with system
control settings. The abovementioned system parameters have direct or indirect
impacts on air supply condition near indoor diffusers and surface temperatures.
Indoor space related parameters like surface temperatures and air supply
condition are dependent to operational setting of system, outdoor condition,
internal load and space heat gain. The main space related parameters which
have been monitored in the conditioned space with DDOAS-RCP are listed in
Table 6. The air supply condition including dry bulb and dew point
temperature were measured with Sensirion Pin-type digital sensor (SHT75)
placed inside the air stream. Fluke Dual Input Contact Digital Thermometer

84
(54-ii) and Fluke Building Diagnostic Thermal Imagers (TiR32, IR fusion
technology) have been used to measure surface temperatures inside the
BubbleZERO. Besides tracer gas decay test, a custom-designed air flow hood
was manufactured to get an estimate of supply air flow rate from each floor
diffuser (Figure 21). This custom-designed hood narrows down air stream from
floor diffuser to a smaller cross section in which uniform air velocity profile
could be measured with anemometer at one point.
Table 6 Main space related parameters in DDOAS-RCP design
Space related parameters Variable (Unit) Range
Air supply flow rate from each
diffuser Flow rate (L/s) 1-3 L/s
Air supply condition Dry bulb and dew
point temperature (°C)
Temperature/dew point:
12-22 ˚C / 10-20 ˚C
Radiant panel average surface
temperature, Ts
Surface temperature
(°C) 17-20 ˚C
Other surfaces temperature
(floor, roof, walls, windows), Ts
Surface temperature
(°C) 21-34 ˚C
Human load Number of people
(person) 1-2 person

85
Figure 21 A custom-designed air flow hood for measurement of air flow
rate from diffusers
Data analysis has been conducted on the monitored and collected data in
the BubbleZERO over a specific period of time. Layout, location of panels
relative to loads of façade and occupancy as well as the locations of sensors are
illustrated in Figure 18. The simple and multiple linear regression models have
been used to analyse these environmental and system component related data.
17280 sample data points were collected during twelve days of measurements
with sample time period of one minute. This range and frequency of data has
been chosen in order to provide a comprehensive analysis of this low exergy
system under different indoor/outdoor conditions and experimental scenarios.
At first, the simple regression model based on the least square estimator was
incorporated to find the correlation between dependent design parameters (e.g.
indoor temperature and dew point) and independent DDOAS-RCP system
parameters (e.g. water supply temperature and ventilation rate). Later, the
multiple linear regression model was implemented to extend the correlation for

86
several independent variables all at the same time. The coefficient of
determination (R2) of regression analyses has been calculated to determine the
compatibility of regression line and sampled data. In addition, the “t” statistic
test (Tan, 2011) has been employed to test the significance of the found
correlations. In the t-test, at first a null hypothesis is constructed and then “t”
value is calculated based on mean and variance of sample data. A tabulated “t”
values available in statistics reference books (Tan, 2011) has been used to
determine the correctness of hypothesis based on the degree of freedom of
sample. If “t” value exceeds the tabulated value for a specific level of
probability, it could be said that there is a significant correlation between the
two investigated variables. In the next step, P-value has been calculated based
on the “t” statistic test. P-value is defined as the probability of obtaining a
result equal to the null hypothesis. A large P-value indicates that there is weak
evidence to support the found correlation.
3.5 Thermal comfort and Indoor air quality criteria
The main goal of a building ventilation and air conditioning system is to
provide comfortable and healthy indoor environment for occupants. Thermal
comfort perception of occupants for the new designed concept of DDOAS-
RCP is required to be explored in the tropical context. In this investigation,
objective measurements and simulations have been undertaken to assess
response of people to this type of conditioned space. The whole space and local
comfort criteria based on the International/local standards and comfort models
which have been used in this research are listed in Table 7. In this

87
investigation, Fanger’s PMV model has been chosen accompanied with other
criteria from the International standards as well as the local standard of SS 554
(2009). PMV provides a comfort index in correlation with six parameters of
metabolic rate, clothing insulation, air temperature, radiant temperature, air
speed, and humidity. The local standard of SS 554 only provides recommended
temperature (24 to 26 °C), relative humidity (< 65 %) and air movement (0.1-
0.3 m/s) ranges which does not cover the conditioned space of DDOAS-RCP
with lower air movement than that for the typical all air system in the tropics.
For an indoor space with lower air movement (< 0.1 m/s), the PMV model can
provide a comfort index considering the six abovementioned parameters
altogether. Albeit, the comfort perception of locally acclimatized occupants in
the tropics has been considered by taking into account the acceptable air
velocity range as recommended by the local standard of SS 554. Relevant
comfort criteria to application of radiant cooling system in buildings like floor
temperature and radiant temperature asymmetry have been obtained from the
International standard of ISO 7730. No relevant comfort criteria on radiant
cooling applications have been provided in the local standard of SS 554.
Table 7 Whole space and local thermal comfort criteria relevant to operation of high temperature cooling system
Thermal comfort criteria Standard Acceptable range
Fanger’s PMV model ISO 7730
Category A: -0.2 < PMV
< 0.2
PPD < 6 %
Category B: -0.5 < PMV
< 0.5
PPD < 10 %

88
Indoor air velocity SS 554 0.1 - 0.3 m/s
Vertical air temperature difference ISO 7730 Category A: ΔT < 2 °C
Category B: ΔT < 3 °C
Floor temperature ISO 7730 19-29 °C
Radiant temperature asymmetry ISO 7730 Cool ceiling: < 14 °C
Besides comfort perception of occupants, it is necessary to make sure that
air quality in DDOAS-RCP design can satisfy the requirements of a healthy
indoor space. Any conditioned space is required to comply with indoor air
quality criteria based on the local and the International standards. The list of
considered indoor air pollutants and their maximum threshold values are listed
in Table 8. Carbon dioxide and volatile organic compounds have been
monitored as the main and secondary human related pollutants, respectively.
The concentration of resiprable suspended particles (PM2.5, PM10) also was
measured to evaluate the concerns regarding the rise of dust from floor due to
distributing air from floor diffusers in this design. These parameters are also
typically measured in indoor air quality audits in Singapore office buildings.
Table 8 Indoor air quality criteria relevant to operation of high temperature cooling system
Air pollutants Standard Maximum
threshold
Carbon dioxide SS 554
700 ppm above
outdoor (around
1100 ppm)
Total volatile organic compounds (TVOCs) SS 554 3000 ppb
Respirable suspended particles (PM10) SS 554 50 μg/m3

89
Respirable suspended particles (PM2.5) SS 554 35 μg/m3
3.6 Ventilation effectiveness and contaminant distribution
DDOAS-RCP with floor supply- ceiling exhaust distribution system has its
own specific ventilation and air flow characteristics. On one hand, it cannot be
categorized as mixing ventilation since the amount of supplied air and point of
distribution in space does not portray a perfect mixing condition. On the other
hand, volume of supplied air in DDOAS-RCP is 0.2 to 0.4 fraction of
conventional all air displacement system which could exhibit different
characteristics from the typical displacement ventilation system. Several
indicators have been considered in this research to get a better understanding of
DDOAS-RCP conditioned air characteristics. Ventilation effectiveness is an
indicator of how well a supply-exhaust distribution system performs compared
to a perfect mixing condition. The ASHRAE standard 129 (2002) provided a
guideline on how to measure age of air and ventilation effectiveness with tracer
gas step-up or decay tests. In addition, REHVA guideline No. 2 (2004)
introduced the procedure to determine ventilation effectiveness indices
including air change efficiency and contaminant removal effectiveness based
on tracer gas tests and pollutant dispersion. These indices are used at design
stage of HVAC system to calculate the ventilation requirement of space. The
ASHRAE standard 62 (2007) introduced the parameter of air distribution
effectiveness to determine the minimum outdoor air flow requirement to
maintain acceptable air quality.

90
The ventilation effectiveness can be measured with different methods
through injection of a tracer gas in the space. A step down tracer gas method
has been used in this study and SF6 was selected as the tracer gas. The
experiments have been conducted in the freestanding test bed (BubbleZERO)
located in outdoor space whose exterior is subjected to the ambient air but the
interior is conditioned. The setup for the experiments including system
components and location of sample points are shown in Figure 22 and Figure
23. Decentralized air supply units (green components) located within the floor
take outdoor air directly from the façade, condition it and distribute it through
underfloor ducts and floor diffusers. Radiant cooling panels were installed at
the ceiling and air exhaust flaps were located in the middle of panels where air
leaves the space through exhaust ducts. During the test, two persons were
seated in the centre of the room and working with their laptops. Tracer gas has
been injected in the centre of the room and the concentrations of SF6 as well as
CO2 have been monitored with a Photoacoustic multi-gas monitor Innova
1312. The gases concentrations were measured at 10 points in the space by
means of the multipoint sampler Innova 1309. Two sample points were put at
exhaust ducts (9&10), two sample points (1&2) in front of occupants at a
height of 1 m, and six other sample points (3-8) at heights of 1.7 m at different
locations throughout the space.
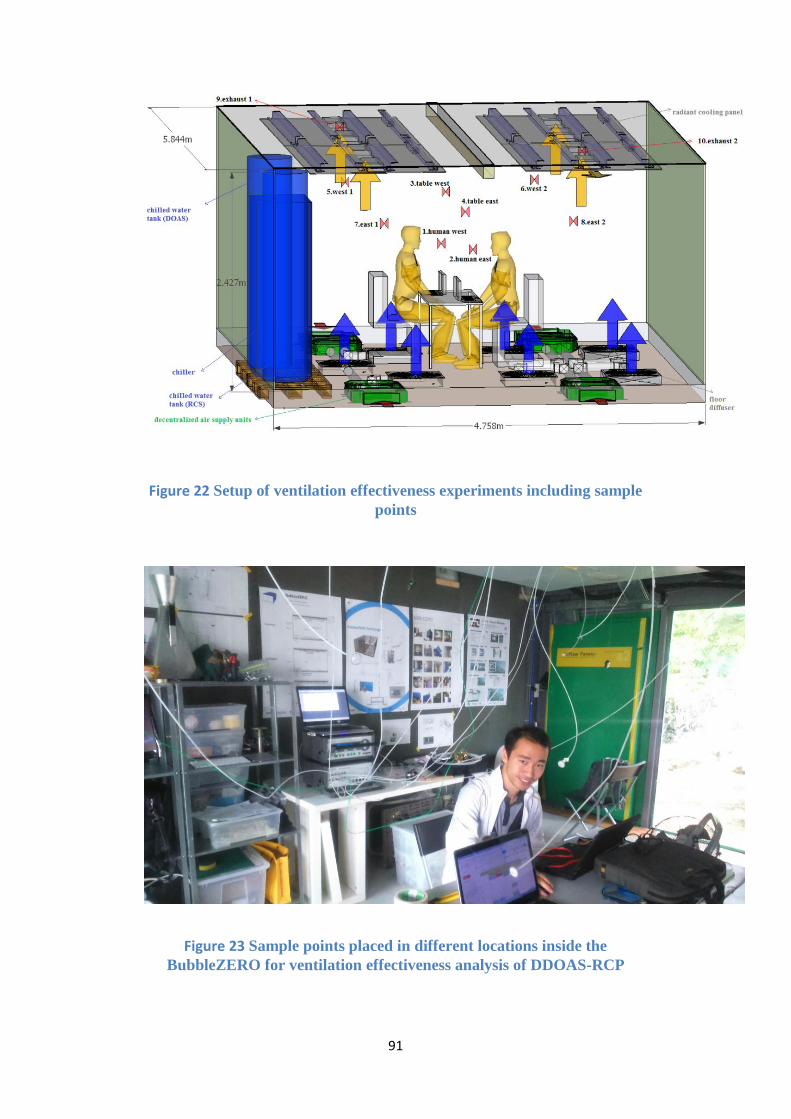
91
Figure 22 Setup of ventilation effectiveness experiments including sample
points
Figure 23 Sample points placed in different locations inside the
BubbleZERO for ventilation effectiveness analysis of DDOAS-RCP

92
The concentration of tracer gas was measured for three hours after
injection. Due to the small size of the BubbleZERO, SF6 dispersed uniformly
in the space over a short period of time. The air change rate was determined
through decay slope of logarithmic curve of concentration over time. The
ventilation effectiveness indices ACE and LACI have been calculated based on
the age of air concept. The age of air at a point is defined as the time elapsed
for the incoming air to reach that point (𝜏�̅�). The younger is the age of air at a
point indicates the better quality of air in that point. Having more outdoor air at
breathing level would result in improved air quality perception of occupants. In
this regard, nominal time constant (𝜏𝑛=Vol/q) is defined as local mean age of
air at exhaust and can be calculated as the ratio between volume to ventilation
flow rate of space. ACE is defined as the ratio of the lowest possible mean age
of air (𝜏𝑛/2) and the room mean age of air ⟨𝜏̅⟩. An indoor space with ACE
below 50 % is a short-circuit flow pattern, at 50 % is fully mixed, between 50
to 100 % is displacement flow and at 100 % it is a piston flow (REHVA
Guidebooks No. 2, 2004). Contaminant removal effectiveness is defined as the
ratio between steady state pollutant concentration in the space and exhaust air
concentration. The CRE indicates how fast the generated pollutants are
removed from the space. The CRE value is equal to 1 for fully mixed scenario
and values above 1 indicates a more effective air distribution strategy. The
indices of ACE, LACI (local air change index), and CRE were calculated using
the Eq. 1-3 (REHVA Guidebooks No. 2, 2004),
𝐴𝐶𝐸 = 𝜏𝑛
2⟨�̅�⟩. 100 [%] (Eq. 1)
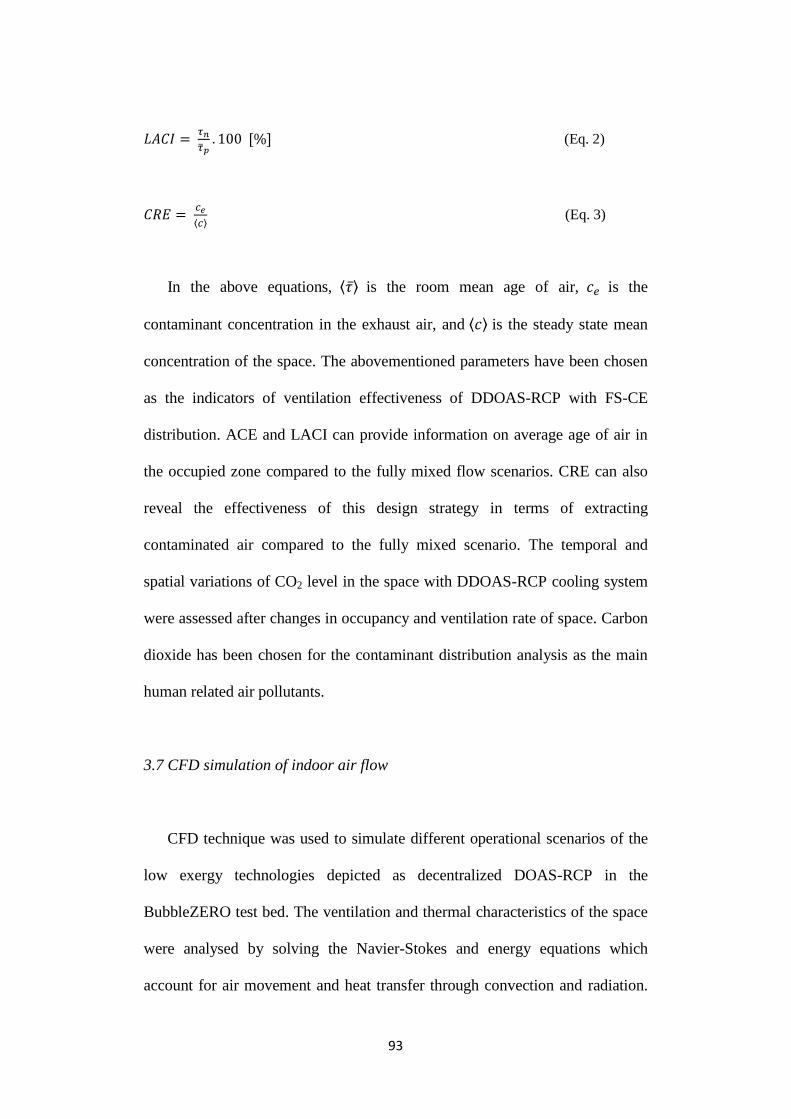
93
𝐿𝐴𝐶𝐼 = 𝜏𝑛
�̅�𝑝. 100 [%] (Eq. 2)
𝐶𝑅𝐸 = 𝑐𝑒
⟨𝑐⟩ (Eq. 3)
In the above equations, ⟨𝜏̅⟩ is the room mean age of air, 𝑐𝑒 is the
contaminant concentration in the exhaust air, and ⟨𝑐⟩ is the steady state mean
concentration of the space. The abovementioned parameters have been chosen
as the indicators of ventilation effectiveness of DDOAS-RCP with FS-CE
distribution. ACE and LACI can provide information on average age of air in
the occupied zone compared to the fully mixed flow scenarios. CRE can also
reveal the effectiveness of this design strategy in terms of extracting
contaminated air compared to the fully mixed scenario. The temporal and
spatial variations of CO2 level in the space with DDOAS-RCP cooling system
were assessed after changes in occupancy and ventilation rate of space. Carbon
dioxide has been chosen for the contaminant distribution analysis as the main
human related air pollutants.
3.7 CFD simulation of indoor air flow
CFD technique was used to simulate different operational scenarios of the
low exergy technologies depicted as decentralized DOAS-RCP in the
BubbleZERO test bed. The ventilation and thermal characteristics of the space
were analysed by solving the Navier-Stokes and energy equations which
account for air movement and heat transfer through convection and radiation.

94
In the simulated experiment, two persons were sitting in the middle of
laboratory and they were working with their laptops. The BubbleZERO is
located outdoors with mostly glass facades on east and west directions. The
other directions including south, north and roof are well insulated with a layer
of rigid insulation and an inflated “bubble” skin. The conditioned indoor space
of laboratory was modelled in the afternoon when the main heat gain was
coming from the west façade. During the experiments, temperature sensors
were positioned at different locations (A-B-C-D) and heights (0.1-1-1.8 m)
inside the space (Figure 24). Interior surface temperatures were measured to be
used as boundary conditions for the CFD simulation. These boundary
conditions represent the steady state heat gain through the façade. Supply air
conditions and flow rates were also measured and provided as inlet boundary
conditions for the simulations. The seated occupants were modelled based on
reported dimensions of human body parts in the literature (Šmíd, 1977) for a
male body of 1.75 m height. The surface area of seated occupants was divided
into five segments including feet, calf-thigh, abdomen, hand-arm and chest-
head. Temperature of each segment was specified based on reported
experimental studies (Yao et al., 2007) of skin temperature at thermal comfort
condition.
95
Figure 24 Sample points at different locations and heights inside the
BubbleZERO
The created geometry of laboratory was discretized into tetrahedral cell
volumes on which Navier-Stokes and energy equations were solved. In order to
achieve mesh independent CFD results, tetrahedron cells with two mesh
densities of 355 K (coarse) and 1467 K (fine) were generated (Figures 25 and
26). For the fine unstructured cell volumes, density of mesh was refined near
human body and wall boundary conditions in order to get a more elaborate
understanding of flow pattern near those areas. While a further refined mesh
can provide more information on distribution of variables in the space, it
requires higher computation cost and could lead to more convergence
problems.

96
Figure 25 Coarse tetrahedral cell volumes (355 K)
Figure 26 Fine tetrahedral cell volumes (1467 K)
In this investigation, the open source CFD toolbox of OpenFOAM (open
source field operation and manipulation) 2.3 has been used to solve Navier-
Stokes and energy equations over the domain of interior space. OpenFOAM is
a C++ simulation platform for easy development of customized numerical
solver and pre-/post- processing utilities in which physical entities are
described by tensors (OpenFOAM Foundation, 2014a). The standard solver of

97
bouyantBoussinesqSimpleFoam from OpenFOAM library has been used to
analyse heat transfer and buoyancy-driven flow of indoor air space. This solver
is a steady-state solver for buoyant, turbulent flow of incompressible fluids
which was modified in this study to include radiation in order to capture radiant
cooling panel impacts. P-1 approximation which is a simple form of the
general P-N method was implemented to numerically solve radiant heat
transfer terms. The P-N approach employs a finite set of moment equations to
approximate transfer relations of radiant transfer in participating media through
expansion of intensity in an orthogonal series of spherical harmonics (Siegel
and Howell, 1992). Since in the current indoor air simulations, temperature
variation over the space is not significant, the Boussinesq approximation has
been used for prediction of buoyancy driven flows in the space. In this
approximation, variation of air density is neglected in all Navier-Stokes and
energy equations terms except in the buoyancy term. The Boussinesq
approximation in the implemented solver of OpenFOAM can be expressed by
the following equation,
𝜌 = 𝜌𝑟𝑒𝑓[1 − 𝛽(𝑇 − 𝑇𝑟𝑒𝑓)] (Eq. 4)
where β is the coefficient of expansion (K-1
), ρref and Tref are reference
density and temperature which are specified as input into the model.
Turbulence model is another important setting for CFD simulation of indoor air
flows. Several studies (Chen, 1995; Zhang et al., 2007) tried to find the most
suitable turbulence model for indoor space CFD simulation in terms of
accuracy and computational cost. The mainstream results showed that RNG k-ε
98
and k-ω based SST have superior performance compared to other two-equation
based turbulence models. In the preliminary investigation of the BubbleZERO,
it was concluded that the standard k-ε and k-ω based SST models result in
slightly different temperature profiles in the space while k-ω based SST and
Reynolds stress models have close predictions. Three turbulence models of
standard k-ε, renormalization group (RNG) k-ε and k-ω based SST were
employed in the final investigation in order to achieve more reliable results.
The standard k-ε model is the most prominent turbulence model in the industry
because of its robustness and stability which used as a reference turbulence
model for this investigation. In the renormalization group k-ε model, RNG
techniques are used to modify transport equations in order to handle small-
scale and large-scale velocity fluctuations with different schemes (Chen, 1995).
The k-ω based shear stress transport (SST) model is designed to give highly
accurate predictions of flow patterns in adverse pressure gradient condition
which could occur in low Reynolds flows near walls (Menter, 1994). The
governing heat/mass transfer and momentum equations for the simulated
indoor air are as follows (OpenFOAM Foundation, 2014b),
𝜕𝜌
𝜕𝑡+ ∇. (𝜌𝑈) = 0 (Eq. 5)
𝜕𝜌𝑈
𝜕𝑡+ ∇. (𝜌𝑈𝑈) − ∇. 𝜇∇𝑈 = −∇𝑃 + 𝑆𝑏𝑢𝑜𝑦𝑎𝑛𝑐𝑦 (Eq. 6)
𝜕𝜌𝑒
𝜕𝑡+ ∇. (𝜌𝑈𝑒) − ∇. (𝜆∇𝑇) = 𝑃∇. 𝑈 (Eq. 7)
In the above equations, Sbuoyancy is defined as (ρ-ρref)g which can be
calculated from Eq. 4. Viscosity (μ) in two equations turbulence models is
defined based on turbulent kinetic energy (k) and turbulent dissipation (ε) or
99
specific rate of dissipation (ω) which are derived from transport equations.
Uniform set of temperature and velocity values have been set as initial
conditions in these simulations. In addition, the CFD algorithm of SIMPLE
with residual control of 10-6
has been employed to achieve iterative
independent results. Several probes on different locations in the simulation
domain have been designated to track the changes in mass flow rate or
temperature and velocity over the iterations. The simulations deemed to be
converged when residual criteria have been satisfied and no considerable
changes were observed in the probes’ values.
3.8 Integration with low temperature lift chillers
The benefits of the high temperature cooling can be understood from the
theoretical thermodynamic cycle of Carnot. This cycle is the most efficient
possible set of processes to convert a certain amount of energy of a heat source
into usable works. The Carnot cycle (engine) and the reversed Carnot cycle
(refrigerator) between a hot reservoir (TH) and a cold reservoir (TC) on a
temperature-entropy diagram is shown in Figure 27. QH and QC are the amount
of heat transferred from/to hot sources and cold sources, respectively. W is the
amount of given or taken work. Based on the First Law of thermodynamics, the
amount of work for reversible processes is equal to difference between QH and
QC. The COP of the cycle in heating and cooling modes can be determined as
follows in Eq.8-9,
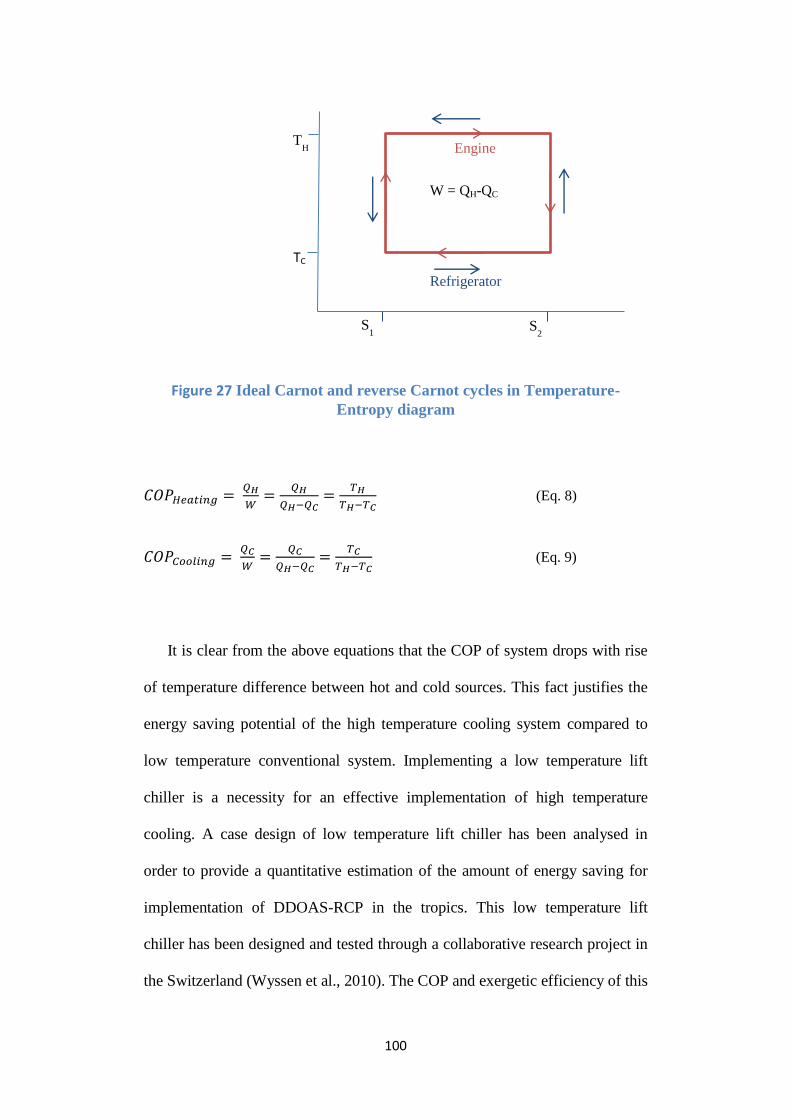
100
Figure 27 Ideal Carnot and reverse Carnot cycles in Temperature-
Entropy diagram
𝐶𝑂𝑃𝐻𝑒𝑎𝑡𝑖𝑛𝑔 = 𝑄𝐻
𝑊=
𝑄𝐻
𝑄𝐻−𝑄𝐶=
𝑇𝐻
𝑇𝐻−𝑇𝐶 (Eq. 8)
𝐶𝑂𝑃𝐶𝑜𝑜𝑙𝑖𝑛𝑔 = 𝑄𝐶
𝑊=
𝑄𝐶
𝑄𝐻−𝑄𝐶=
𝑇𝐶
𝑇𝐻−𝑇𝐶 (Eq. 9)
It is clear from the above equations that the COP of system drops with rise
of temperature difference between hot and cold sources. This fact justifies the
energy saving potential of the high temperature cooling system compared to
low temperature conventional system. Implementing a low temperature lift
chiller is a necessity for an effective implementation of high temperature
cooling. A case design of low temperature lift chiller has been analysed in
order to provide a quantitative estimation of the amount of energy saving for
implementation of DDOAS-RCP in the tropics. This low temperature lift
chiller has been designed and tested through a collaborative research project in
the Switzerland (Wyssen et al., 2010). The COP and exergetic efficiency of this
Refrigerator
Engine
S2 S
1
TH
TC
W = QH-QC

101
low lift chiller have been compared with conventional air/water cooled chillers
which are commonly used in the tropics. The improvement in COP of chiller
for high temperature cooling has been used for estimation of energy/exergy
saving of DDOAS-RCP in the tropics.
3.9 Energy/Exergy saving potentials
The energy/exergy saving potentials from implementation of a low exergy
system in buildings are multifaceted. Radiant cooling system in DDOAS-RCP
can operate with warmer chilled water temperature which could be provided at
higher chiller efficiency. In addition, using more water for heat transfer
medium in building bring the opportunity to reduce fan energy use in ACMV
system of building. Energy simulation analysis was conducted for a typical
one-storey building for the tropical climate of Singapore in order to get an
estimate on energy saving potential of an air-water system like DDOAS-RCP
in this climate. The layout and three dimensional schematic of this hypothetical
building are shown in Figures 28 and 29. The geometry of this building was
modelled in the SketchUp 3D (SketchUp make Version 15.3) modelling
software through use of the OpenStudio plugin tool. OpenStudio (Version 1.8)
is an open source collection of software which is used as a platform to conduct
building energy modelling using EnergyPlus (Version 8.1) building energy
simulation program. Standard types of materials and constructions for roofs,
floors, walls and windows as well as Singapore IWEC (International Weather
for Energy Calculation) file have been used in this simulation.

102
Figure 28 Floor layout of the simulated hypothetical office building in
Singapore
Figure 29 Three-dimensional geometry of the hypothetical one-storey
office building
The energy simulation has been conducted for a conventional all air based
system in which air distributed to different conditioned zones from air handling

103
units located in each floor of the building. A typical all air ACMV layout of
building including supply and return ducts is plotted in Figure 30. Supply and
return fans are installed inside the AHU room to supply and return air to or
from zones. It is assumed that the Toilet and AHU/Storage room areas are
naturally ventilated or in other words are not conditioned with the central
ACMV system. The annual energy consumption of this one-storey building
with all air system has been determined for the tropical climate of Singapore
through use of EnergyPlus building energy simulation program (Version 8.1).
Figure 30 A typical layout of an all air ACMV system (Green lines are
supply ducts, red lines are return ducts)
In the low exergy cooling strategy of DDOAS-RCP, instead of one AHU
per floor, numerous decentralized air supply units are installed near the facade
to take the outdoor outside air at the shortest distance. These units bring in cool
and dehumidified air to satisfy the latent load and the ventilation requirement
of the space while implemented radiant ceiling panels satisfy the remaining
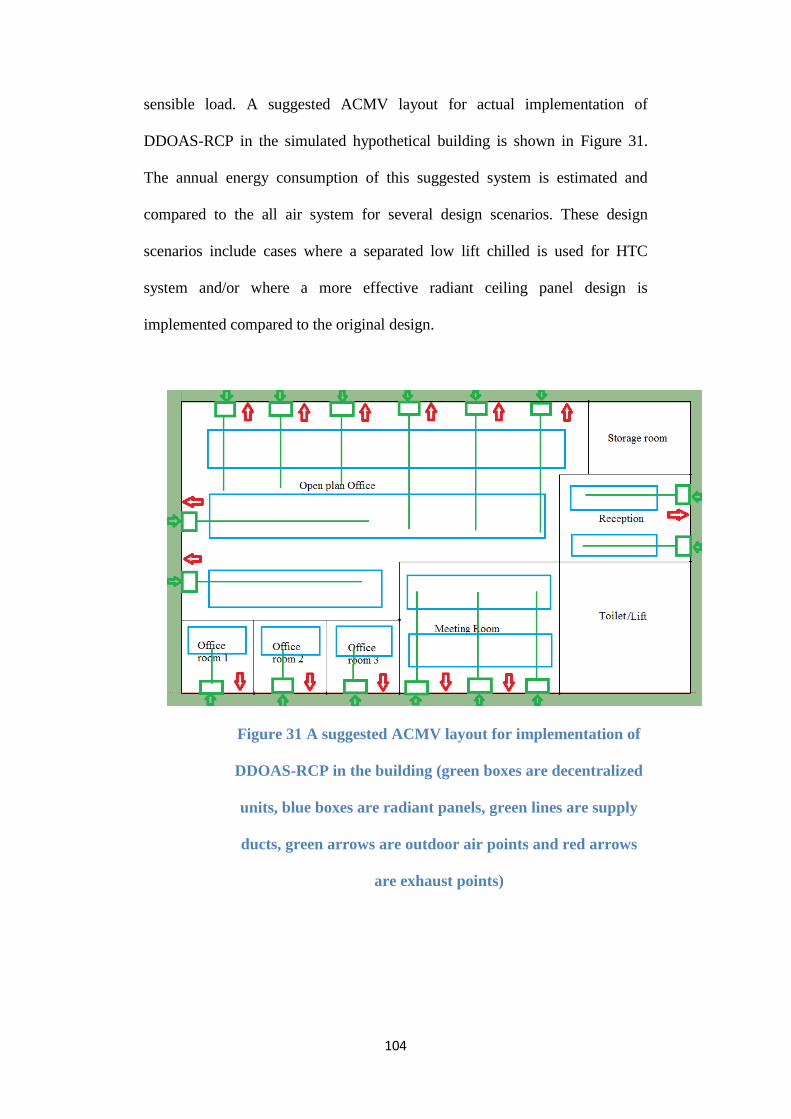
104
sensible load. A suggested ACMV layout for actual implementation of
DDOAS-RCP in the simulated hypothetical building is shown in Figure 31.
The annual energy consumption of this suggested system is estimated and
compared to the all air system for several design scenarios. These design
scenarios include cases where a separated low lift chilled is used for HTC
system and/or where a more effective radiant ceiling panel design is
implemented compared to the original design.
Figure 31 A suggested ACMV layout for implementation of
DDOAS-RCP in the building (green boxes are decentralized
units, blue boxes are radiant panels, green lines are supply
ducts, green arrows are outdoor air points and red arrows
are exhaust points)
105
Chapter 4. Results
At first, the results of experimental setup and statistical analysis on
decentralized air supply units and radiant ceiling panel are presented
individually. Later, the outcomes of data analysis on coupled DDOAS-RCP
design are provided in terms of thermal comfort, indoor air quality and
ventilation effectiveness. The conducted uncertainty analyses based on
measurement accuracies and propagated errors are elaborated in the subsequent
section. The results of CFD simulation in the testbed of BubbleZERO are
explained regarding the air flow pattern, temperature distribution and radiant
flux on surfaces. In the last two sections of this chapter, the potential
integration of DDOAS-RCP with low lift chiller is elaborated. The research
outcomes of “experimental setup”, “numerical simulation” and “integration
with low lift chiller” stages from the PhD thesis research workflow (Figure 14)
are presented in this chapter.
4.1 Decentralized air supply units
The Decentralized air supply units in DDOAS-RCP system play the most
important role for humidity control, ventilation, and consequently on indoor air
quality and energy consumption of the whole system. From the energy
efficiency point of view, the amount of outdoor air should be minimized and
kept close to the minimum ventilation requirement of the space. To achieve this
scenario in the tropics, having an air tight façade is a necessity to minimize the
amount of latent load in the space. Three sets of heat exchangers have been

106
incorporated into the decentralized air supply units. The arrangements of these
cooling coils in terms of supply and return water position affect the
dehumidification capacity and off coil air condition. The two selected
arrangements of coils for the current design of units in the BubbleZERO are
shown in Figure 32. Arrangement B follows the main stream coil design
strategy rule where chilled water is supplied to coil close to the off coil side for
the best efficiency. The locations of supply and return chilled water pipes to
coil have been modified in Arrangement A to evaluate the possibilities of
having some level of reheat within the decentralized air supply unit.
Figure 32 Two arrangements (left-arrangement A, right-arrangement B) of three heat exchangers inside the units
Two decentralized supply units for each arrangement of the heat
exchangers were installed on each side of laboratory. In arrangement A, the
first two cooling coils provide cooling and dehumidification while the third one
is utilized to provide sensible reheat. The chilled water flowing through the
first two coils gets warm and it provides some level of heating for the air at the
third coil. For these units, the off coil air reaches the diffusers through air ducts

107
located in a floor plenum. However, in arrangement B, all three heat
exchangers provide cooling and dehumidification and the off coil stream of
these units is attached to air ducts embedded into the concrete floor slab, which
provides some level of reheating before the air is supplied to the space through
FD. The units’ off coil air temperature and dew point for these two types of
arrangements are compared to each other in Figure 33. It can be seen that units
with arrangement B can provide cooler and dryer air compared to arrangement
A. However, supplying air at that temperature range could result in cold feet
issue and it requires some level of reheating before being supplied into the
space. During this experiment, decentralized air supply units were operating in
manual mode with similar and fixed chilled water temperature and flow rates
on both water and air sides.
Figure 33 Off coil air condition of decentralized air supply units with different heat exchanger (HX) arrangements

108
The capacity of these decentralized units in the course of a day with
fluctuating outdoor temperature and supply chilled water is shown in Figure
34. There was an increase in supply water temperature in the morning due to
the chiller on/off control setting which caused a slow decrease of unit capacity.
In the afternoon, cooling capacity of units increased considerably because of
higher outdoor temperature. The capacity of unit was around 800 W in the
morning which rose to around 1000 W in the afternoon. This profile of unit
capacity was commonly observed during twelve days of consecutive
experiments except for fully rainy days when the curve line of capacity was
almost flat. It is noted that in this graph, water flow rate was 28 mL/s and air
flow rate passing through unit was 2.75 L/s.
Figure 34 Daily profile of decentralized units’ capacity caused by
fluctuation of outdoor air condition and supply water temperature
The main parameters which have impacts on capacity of decentralized
air supply units and off coil air condition of units include outdoor
temperature, water supply temperature, water supply flow rate and air flow
109
rate passing through unit. The simple and multiple linear regression models
were used to analyse the collected data and find an estimated correlation
between dependent decentralized unit variables (e.g. unit capacity and off
coil temperature) and independent input parameters (e.g. chilled water
temperature and flow rate, air flow rate). The pool of sampled decentralized
unit capacity and supply chilled water temperature are plotted in Figure 35.
For supply water temperature in the range of 8 to 18 °C, the unit capacity
varies between 400 to 1400 W. The simple linear regression analysis shows
the strong correlation between these two parameters. It was also observed
that the difference between supply and return water temperatures ranges
between 5 to 8 °C and the value is higher for lower supply water
temperatures. In Figure 36, the pool sample data of decentralized unit off
coil temperature and water supply temperature are plotted. There is a strong
correlation between these two variables and slope of linear regression line
is close to 1. It can be seen that off coil air temperature is approximately 2
°C (shown as dashed line in Figure 36) higher than supply water
temperature over the range of measured data. Nevertheless, for the range of
water flow rate (10-30 mL/s) and air flow rate (2.5-4 L/s) passing through
unit, this temperature difference could vary from 1 to 3 °C. The condition
of air at off coil point of decentralized unit was usually at saturation point
and there was a little difference between dry bulb and dew point
temperatures. The coefficient of determination (R2) are in the acceptable
range for both of the above regression analyses which show there are good
fits between sampled data and regression line.

110
Figure 35 Pool of sampled decentralized unit capacity and supplied water
temperature
Figure 36 Pool of sampled decentralized unit off coil temperature and
supplied water temperature

111
In addition to supply chilled water temperature, other design input
parameters like air flow rate and outdoor temperature also play some roles
on capacity and off coil condition of decentralized units. The pools of
sampled data regarding the air flow rate passing through decentralized units
on capacity of units and off coil temperature are shown in Figures 37 and
38. 17280 sample points were analysed using the simple linear regression
model. The air flow rates in the collected sample data did not continuously
cover the whole range and they were clustered in three groups for different
fan speed levels. The unit’s fan speed and the corresponding air flow rate
are plotted in Figure 39. The unit’s capacity ranges from 500 to 1200 W
and off coil temperature ranges from 10 to 18 °C while air flow rate is
between 2.5 to 5 L/s. Higher air flow rate passing through heat exchangers
inside the unit results in rise of convective heat transfer around tubes which
enhances heat transfer mechanism between air and water and consequently
cooling capacity of unit. With higher air speed in units, each control
volume of air has less residence time to interact with heat exchangers. The
pool of sampled decentralized unit capacity and outdoor temperature are
plotted in Figure 40. From morning to afternoon, outdoor temperature
ranges from 27 to 33 °C, while the capacity of unit fluctuates from 500 to
1200 W. The higher outdoor temperature increases the temperature
difference between on coil hot air entering the unit and supply water which
consequently enhances the cooling capacity of units. The coefficients of
determination (R2) in all three abovementioned regression analyses
(Figures 37, 38 and 40) are not near a good fit range which shows the

112
multiple regression analysis is required to get an understanding on the
impacts of these variables on dependent parameters.
Figure 37 Pool of sampled decentralized air supply unit capacity and air
flow rate
Figure 38 Pool of sampled decentralized air supply unit off coil
temperature and air flow rate

113
Figure 39 Air flow rate of unit in terms of fan speed level
Figure 40 Pool of sampled decentralized air supply unit capacity and
outdoor temperature
The simple linear regression models only analyse the change in
dependent parameters based on variation of one independent parameter at a

114
time. A multiple linear regression analysis was conducted to get an overall
understanding of the impacts of all input parameters on capacity and off
coil air condition of decentralized air supply units. This analysis can
identify and compare the significance of independent parameters in
affecting the dependent variables. Four independent variables of outdoor
temperature (°C), water supply temperature (°C), water flow rate (mL/s)
and air flow rate (L/s) have been considered in this analysis. The outcomes
of the statistical analysis for dependent variables of unit capacity (W) and
off coil temperature (°C) are listed in Tables 9 and 10. The coefficient of
determination (R2) for unit capacity and off coil temperature was found to
be around 0.92 and 0.94, respectively. These coefficients of determination
indicate good fit between regression lines and actual sample data where R2
is 1 in the ideal perfect fit regression. The calculated P-values based on the
“t” statistics test are also near zero which indicates that the found
correlations are significant. The sign of coefficients can be justified with
the physical concept behind the heat transfer phenomena inside the units.
The capacity of unit rises with increase of outdoor temperature, water flow
rate and air flow rate and it decreases with rise of water supply temperature.
It can be observed in Table 10 that unit off coil temperature ascends with
increase of water supply temperature and air flow rate and it decreases with
rise of water flow rate. A positive correlation also was found between unit
off coil temperature and outdoor temperature.
Table 9 Multiple linear regression analysis for dependent variable of decentralized air supply unit capacity
Y Variable – Decentralized unit capacity (W) Coefficients Standard P-value

115
Error
Intercept -324.808 14.84852 1.2E-104
X Variable 1 Outdoor temperature (°C) 44.26123 0.282263 0
X Variable 2 Water supply temperature (°C) -76.3313 0.191589 0
X Variable 3 Water flow rate (mL/s) 17.74559 0.430033 0
X Variable 4 Air flow rate (L/s) 65.38009 0.684847 0
𝑌∗ = −324.81 + 44.26 𝑋1 − 76.33 𝑋2 + 17.75 𝑋3 + 65.38 𝑋4
(±0.28) (±0.19) (±0.43) (±0.28)
𝐶𝑜𝑒𝑓𝑓𝑖𝑐𝑖𝑒𝑛𝑡 𝑜𝑓 𝑑𝑒𝑡𝑒𝑟𝑚𝑖𝑛𝑎𝑡𝑖𝑜𝑛 𝑅2 = 0.92
Table 10 Multiple linear regression analysis for dependent variable of decentralized air supply unit off coil temperature
Y Variable – unit off coil temperature (°C) Coefficients Standard
Error P- value
Intercept 6.240734 0.124467 0
X Variable 1 Outdoor temperature (°C) 0.007885 0.002366 0.000862
X Variable 2 Water supply temperature (°C) 0.860672 0.001606 0
X Variable 3 Water flow rate (mL/s) -0.16543 0.003605 0
X Variable 4 Air flow rate (L/s) 0.493466 0.005741 0
𝑌∗ = 6.24 + .008 𝑋1 + 0.86 𝑋2 − 0.16 𝑋3 + 0.49 𝑋4
(±0.002) (±0.001) (±0.003) (±0.006)
𝐶𝑜𝑒𝑓𝑓𝑖𝑐𝑖𝑒𝑛𝑡 𝑜𝑓 𝑑𝑒𝑡𝑒𝑟𝑚𝑖𝑛𝑎𝑡𝑖𝑜𝑛 𝑅2 = 0.94
As explained in Section 3.2, the two sides of attached containers in the
BubbleZERO have different floor construction components. On one side,
decentralized air supply units and air ducts were cast into concrete floor
and on the other side, the units and ducts are within the raised floor. A clear
trace of cooling stored in the concrete was observed near the decentralized
air supply units which were embedded into concrete (Figure 41). The
thermal trace follows embedded chilled water pipes into concrete as well as
the air ducts to floor diffusers. This observation shows that some level of
reheating to air supply could be expected when ducts are cast into concrete
floor.
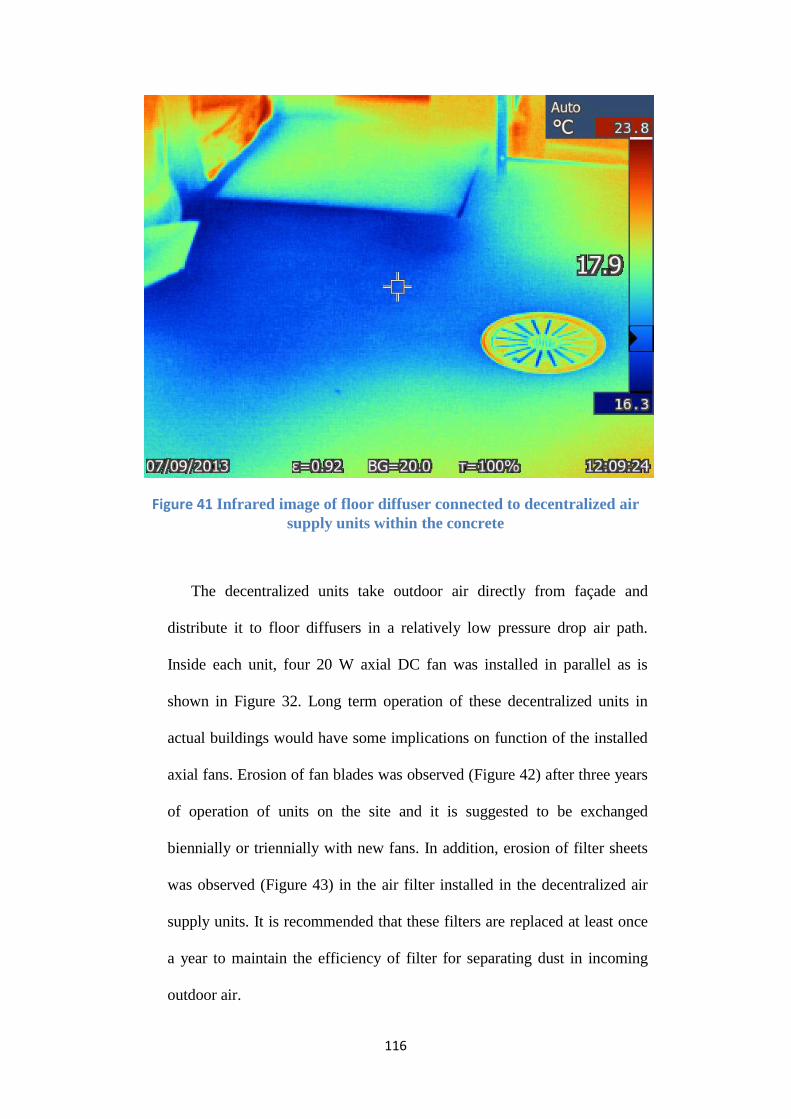
116
Figure 41 Infrared image of floor diffuser connected to decentralized air
supply units within the concrete
The decentralized units take outdoor air directly from façade and
distribute it to floor diffusers in a relatively low pressure drop air path.
Inside each unit, four 20 W axial DC fan was installed in parallel as is
shown in Figure 32. Long term operation of these decentralized units in
actual buildings would have some implications on function of the installed
axial fans. Erosion of fan blades was observed (Figure 42) after three years
of operation of units on the site and it is suggested to be exchanged
biennially or triennially with new fans. In addition, erosion of filter sheets
was observed (Figure 43) in the air filter installed in the decentralized air
supply units. It is recommended that these filters are replaced at least once
a year to maintain the efficiency of filter for separating dust in incoming
outdoor air.
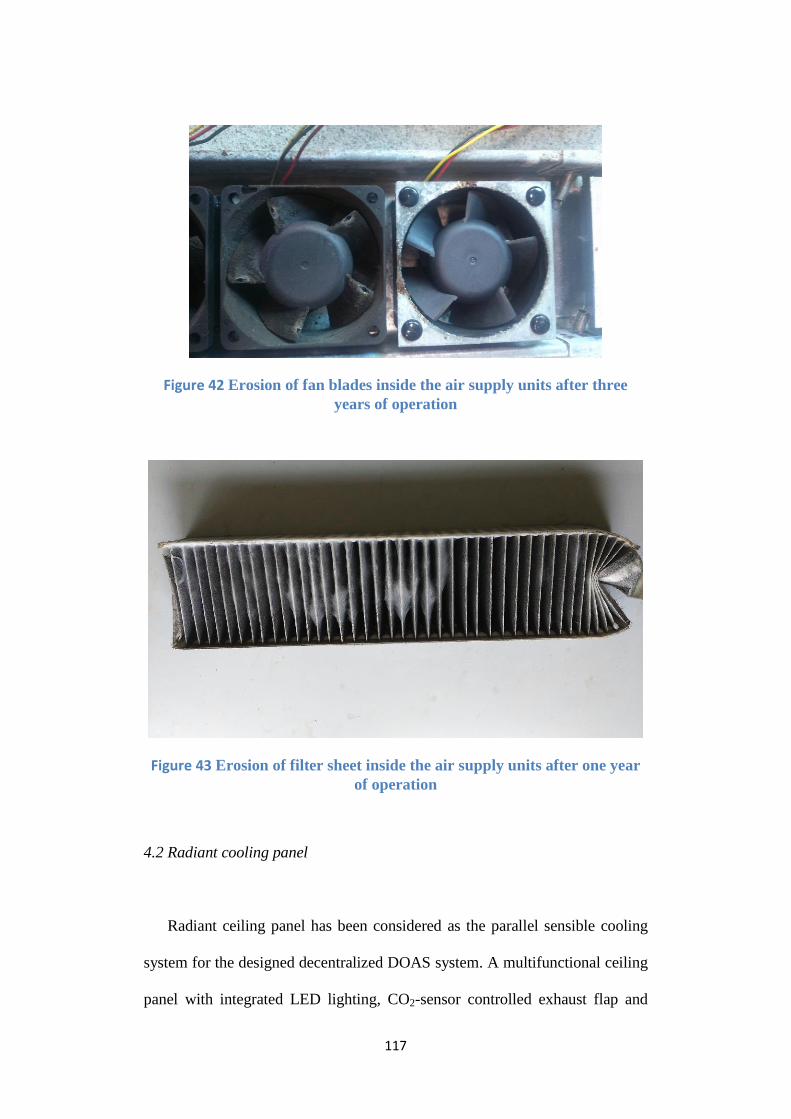
117
Figure 42 Erosion of fan blades inside the air supply units after three
years of operation
Figure 43 Erosion of filter sheet inside the air supply units after one year
of operation
4.2 Radiant cooling panel
Radiant ceiling panel has been considered as the parallel sensible cooling
system for the designed decentralized DOAS system. A multifunctional ceiling
panel with integrated LED lighting, CO2-sensor controlled exhaust flap and
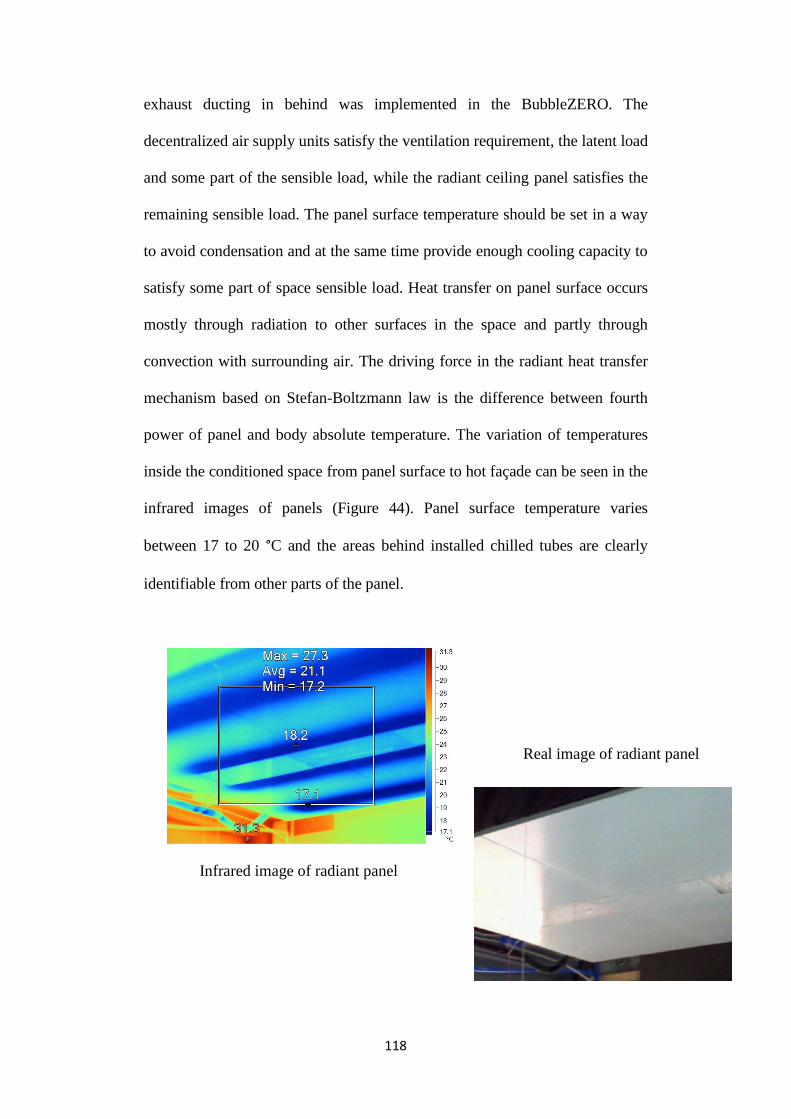
118
exhaust ducting in behind was implemented in the BubbleZERO. The
decentralized air supply units satisfy the ventilation requirement, the latent load
and some part of the sensible load, while the radiant ceiling panel satisfies the
remaining sensible load. The panel surface temperature should be set in a way
to avoid condensation and at the same time provide enough cooling capacity to
satisfy some part of space sensible load. Heat transfer on panel surface occurs
mostly through radiation to other surfaces in the space and partly through
convection with surrounding air. The driving force in the radiant heat transfer
mechanism based on Stefan-Boltzmann law is the difference between fourth
power of panel and body absolute temperature. The variation of temperatures
inside the conditioned space from panel surface to hot façade can be seen in the
infrared images of panels (Figure 44). Panel surface temperature varies
between 17 to 20 °C and the areas behind installed chilled tubes are clearly
identifiable from other parts of the panel.
Real image of radiant panel
Infrared image of radiant panel

119
Figure 44 Infrared image of radiant cooling panel in the conditioned
laboratory
One of the common problems associated with radiant panels is the non-
uniformity of temperature on the panel surface. In order to obtain more
accurate temperature distributions on panels, a digital contact thermometer also
has been used during the whole set of experiment. Temperatures measured with
the contact thermometer at different points on the panel surface are shown in
Figure 45. This variation depends on the number of passes of the hydronic
system behind the panel and also the sensible cooling load. In the current two-
pass pipe configuration of hydraulic system, the area behind the track of water
pipe is 1 to 3 °C colder than rest of the panel during day time. Increasing the
number of cold water passes behind the panel could improve the uniformity
level and increase the cooling capacity of panel per surface area. It was also
observed that the temperatures on the surface of LED lamps are much higher
than the rest of the panel. In the designed multifunctional panel, the back of
LED lights is adjacent to exhaust duct, so some part of generated heat by
lighting would be transferred directly to the exhaust air. The infrared image of
radiant cooling panel together with human body skin is shown in Figure 46.
This level of temperature difference would result in a considerable radiant heat
exchange between human body and radiant panel surface.
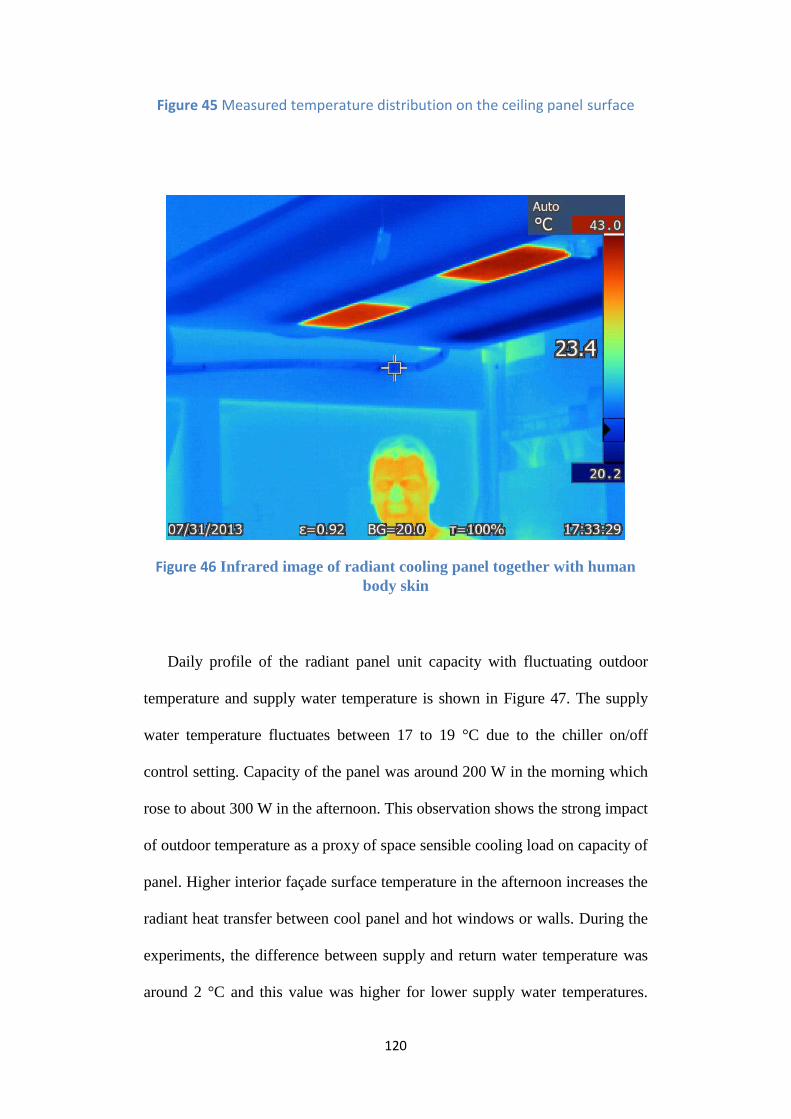
120
Figure 45 Measured temperature distribution on the ceiling panel surface
Figure 46 Infrared image of radiant cooling panel together with human
body skin
Daily profile of the radiant panel unit capacity with fluctuating outdoor
temperature and supply water temperature is shown in Figure 47. The supply
water temperature fluctuates between 17 to 19 °C due to the chiller on/off
control setting. Capacity of the panel was around 200 W in the morning which
rose to about 300 W in the afternoon. This observation shows the strong impact
of outdoor temperature as a proxy of space sensible cooling load on capacity of
panel. Higher interior façade surface temperature in the afternoon increases the
radiant heat transfer between cool panel and hot windows or walls. During the
experiments, the difference between supply and return water temperature was
around 2 °C and this value was higher for lower supply water temperatures.

121
This daily pattern of radiant panel capacity was commonly observed during the
experiments except for fully rainy days when there was no peak point in the
afternoon.
Figure 47 Daily profile of radiant cooling panel unit capacity caused by
fluctuation of outdoor air temperature and supply water temperature
The simple linear regression analysis has been conducted to investigate the
correlations between radiant panel capacity and input design parameters. Three
independent parameters of outdoor temperature, panel water supply
temperature and panel water flow rate have been considered in the analysis.
17280 sample data points and the simple linear regression of radiant panel unit
capacity in terms of water supply temperature and outdoor temperature are
plotted in Figures 48 and 49. Panel capacity varies between 50 to 350 W for
water supply temperature in the range of 16 to 19 °C and the outdoor

122
temperature in the range of 27 to 33 °C. Nevertheless, the coefficients of
determination (R2) for the regression analyses are not near a good fit range and
the multiple regression analysis is required to adequately realize the impact of
these variables on capacity of radiant panel.
Figure 48 Pool of sampled radiant panel unit capacity and outdoor
temperature
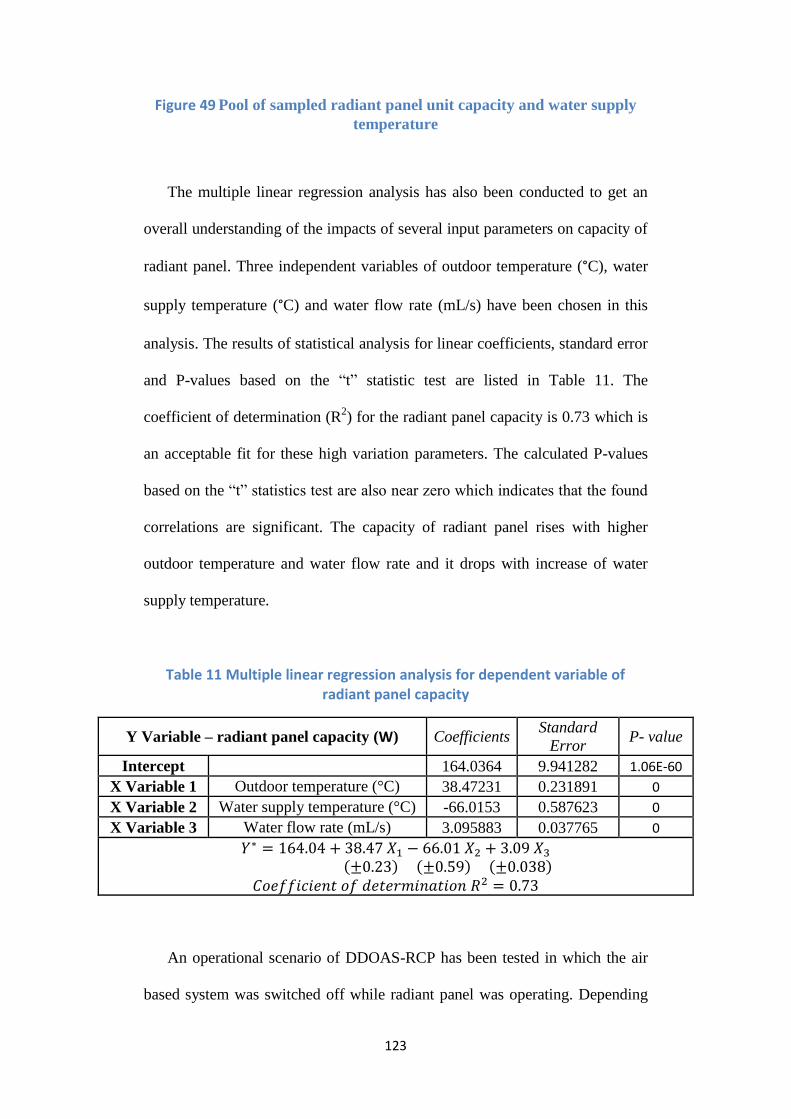
123
Figure 49 Pool of sampled radiant panel unit capacity and water supply
temperature
The multiple linear regression analysis has also been conducted to get an
overall understanding of the impacts of several input parameters on capacity of
radiant panel. Three independent variables of outdoor temperature (°C), water
supply temperature (°C) and water flow rate (mL/s) have been chosen in this
analysis. The results of statistical analysis for linear coefficients, standard error
and P-values based on the “t” statistic test are listed in Table 11. The
coefficient of determination (R2) for the radiant panel capacity is 0.73 which is
an acceptable fit for these high variation parameters. The calculated P-values
based on the “t” statistics test are also near zero which indicates that the found
correlations are significant. The capacity of radiant panel rises with higher
outdoor temperature and water flow rate and it drops with increase of water
supply temperature.
Table 11 Multiple linear regression analysis for dependent variable of radiant panel capacity
Y Variable – radiant panel capacity (W) Coefficients Standard
Error P- value
Intercept 164.0364 9.941282 1.06E-60
X Variable 1 Outdoor temperature (°C) 38.47231 0.231891 0
X Variable 2 Water supply temperature (°C) -66.0153 0.587623 0
X Variable 3 Water flow rate (mL/s) 3.095883 0.037765 0
𝑌∗ = 164.04 + 38.47 𝑋1 − 66.01 𝑋2 + 3.09 𝑋3
(±0.23) (±0.59) (±0.038) 𝐶𝑜𝑒𝑓𝑓𝑖𝑐𝑖𝑒𝑛𝑡 𝑜𝑓 𝑑𝑒𝑡𝑒𝑟𝑚𝑖𝑛𝑎𝑡𝑖𝑜𝑛 𝑅2 = 0.73
An operational scenario of DDOAS-RCP has been tested in which the air
based system was switched off while radiant panel was operating. Depending
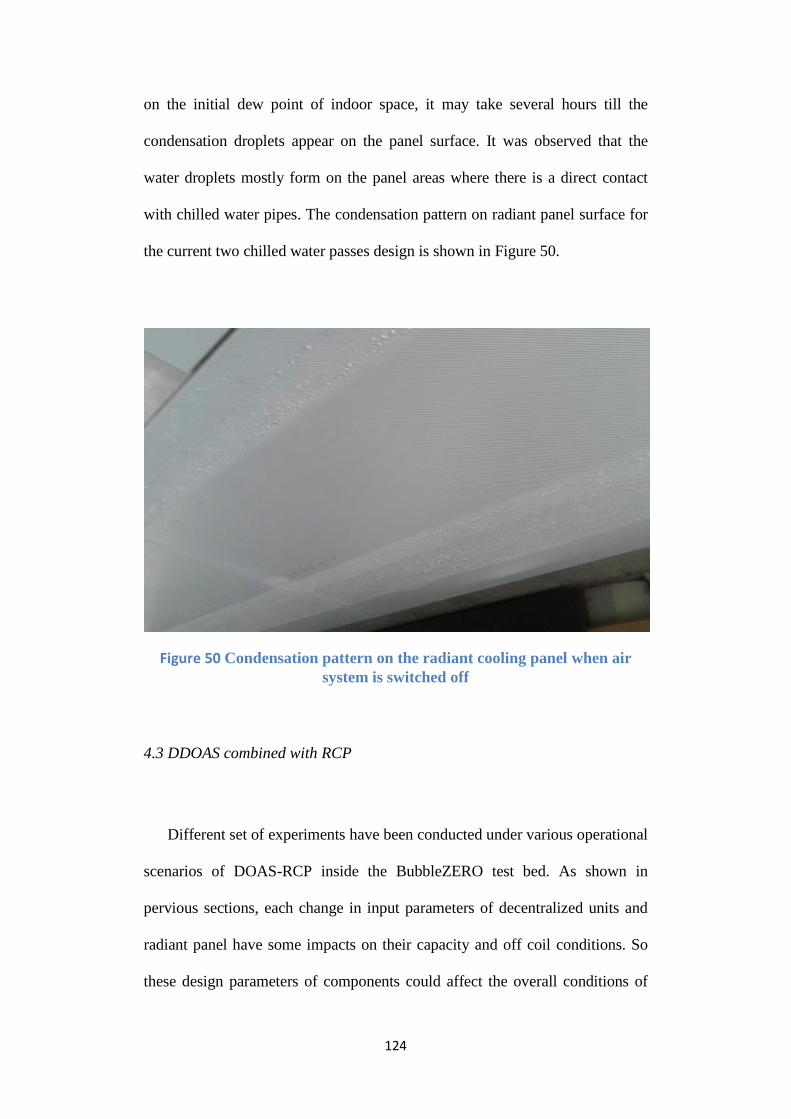
124
on the initial dew point of indoor space, it may take several hours till the
condensation droplets appear on the panel surface. It was observed that the
water droplets mostly form on the panel areas where there is a direct contact
with chilled water pipes. The condensation pattern on radiant panel surface for
the current two chilled water passes design is shown in Figure 50.
Figure 50 Condensation pattern on the radiant cooling panel when air
system is switched off
4.3 DDOAS combined with RCP
Different set of experiments have been conducted under various operational
scenarios of DOAS-RCP inside the BubbleZERO test bed. As shown in
pervious sections, each change in input parameters of decentralized units and
radiant panel have some impacts on their capacity and off coil conditions. So
these design parameters of components could affect the overall conditions of

125
indoor air space and their interactions required further investigation as well. A
certain range of values for each input parameter have been identified from
preliminary experiments which were conducted to achieve indoor air condition
in the BubbleZERO near to acceptable range. As discussed in the methodology
section, different environmental parameters including, dry bulb temperature,
mean radiant temperature and relative humidity have been monitored and
recorded at different locations inside the BubbleZERO. The sensors were
located at various locations and heights to get a sense of spatial distribution of
environmental parameters in the space.
Dry bulb temperature at different heights (average of four points) of 0.1 m,
1 m, 1.8 m inside the space and also outdoor air temperature are plotted in
Figure 51. The data is shown for eleven consecutive days in which ventilation
rate of space reduced from 0.72 to 0.44 L/s/m2. The reduction of outdoor air
flow rate affected the cooling capacity of decentralized units which caused
approximately one degree increase of space temperature at the same outdoor
condition (as shown by lines in Figure 51). DDOAS-RCP system was
operating in manual control mode with fixed operational conditions besides
ventilation rate of space. It was also observed that with FS-CE distribution and
ceiling radiant panel, there is a two degree vertical thermal stratification in the
space and the temperature gradient is steeper below 1 m height level. The
selected range of ventilation rates is close to the minimum ventilation
requirement of office buildings in Singapore which is 0.6 L/s/m2 based on SS
553 (2009).

126
Figure 51 Measured temperatures at different height levels inside the
space and outdoor during reduction of space ventilation rate (0.72 to 0.44
L/s/m2)
Dew point temperature (humidity level) and mean radiant temperature also
continuously were measured at different locations inside the BubbleZERO.
These temperature values including calculated operative temperature for a
typical day are plotted in Figure 52. Mean radiant temperature was roughly two
degree lower than dry bulb temperature in the areas below the ceiling panels
due to the impact of radiant cooling. The mean radiant temperature curve
followed the same trend as dry bulb in which peak point occurred in the
afternoon. Without change in system control settings for different outdoor
conditions, the maximum dew point temperature also occurred around 5 pm,
although the span of variation in dew point value was lower than dry bulb
fluctuation from 9 AM to 5 PM.

127
Figure 52 Variation of dry bulb, mean radiant, operative and dew point
temperatures during a typical day
The capacities of decentralized air supply units and radiant cooling panels
were monitored during the experiments and the outcomes were used to
determine the contribution of each system in satisfying the sensible and latent
loads of the space. This separation of sensible and latent cooling could provide
detailed information on level of air supply units’ contribution for satisfying the
sensible and latent loads of the space. The main function of these units is to
provide dehumidified outdoor air for the ventilation requirement and the latent
load of the space, while they provide sensible cooling as well and the amount
of this sensible cooling is of importance. The ratios of sensible and latent
cooling capacities of decentralized air supply units and radiant panels as well
as sensible heat ratio (SHR) of the BubbleZERO for a typical day are shown in
Figure 53. SHR is the ratio of sensible cooling load to total cooling load. This
parameter could reveal the level of the latent load imposed on the typical office
spaces in the tropics. It was observed that share of air supply units in satisfying

128
the sensible load of space was 10 % higher than radiant panels in the morning.
SHR was around 0.5 in the morning which rose to about 0.6 in the afternoon.
Due to the higher sensible heat ratio in the afternoon, the contribution of
radiant panel increased to about 30 % and it played a more important role in
satisfying the cooling load of space.
Figure 53 Ratio of sensible cooling and latent cooling capacities provided
by air supply units and panel as well as sensible heat ratio during a
typical day
The simple linear regression analysis has been used to explore the
correlation between indoor temperature and input independent variables. 14401
sample data points of collected indoor temperature and outdoor temperature are
plotted in Figure 54. Without change in system control settings of decentralized
air supply units and radiant cooling panel, indoor temperature rises from 20 to
24 °C when outdoor temperature increases from 27 to 33 °C. The coefficient of
determination (R2) for this regression is near to fit range. The pool of sampled

129
indoor temperature and dew point in terms of outdoor temperature,
decentralized unit water supply temperature and panel water supply
temperature are shown in Figures 55, 56, 57 and 58. The average dew point
temperature of the laboratory varies from 12 to 16 °C over the range of outdoor
temperature (27 to 33 °C) and decentralized unit water supply temperature (8 to
17 °C). The average indoor temperature also varies from 20 to 24 °C over the
range of decentralized unit water supply temperature (8 to 17 °C) and panel
water supply temperature (16 to 19 °C). The coefficients of determination in
the abovementioned regression analyses are not close to fit range and the
multiple regression analysis has been conducted to understand the impact of
these variables on indoor temperature and dew point.
Figure 54 Pool of sampled indoor temperature and outdoor temperature

130
Figure 55 Pool of sampled indoor dew point temperature and outdoor
temperature
Figure 56 Pool of sampled indoor temperature and decentralized unit
water supply temperature
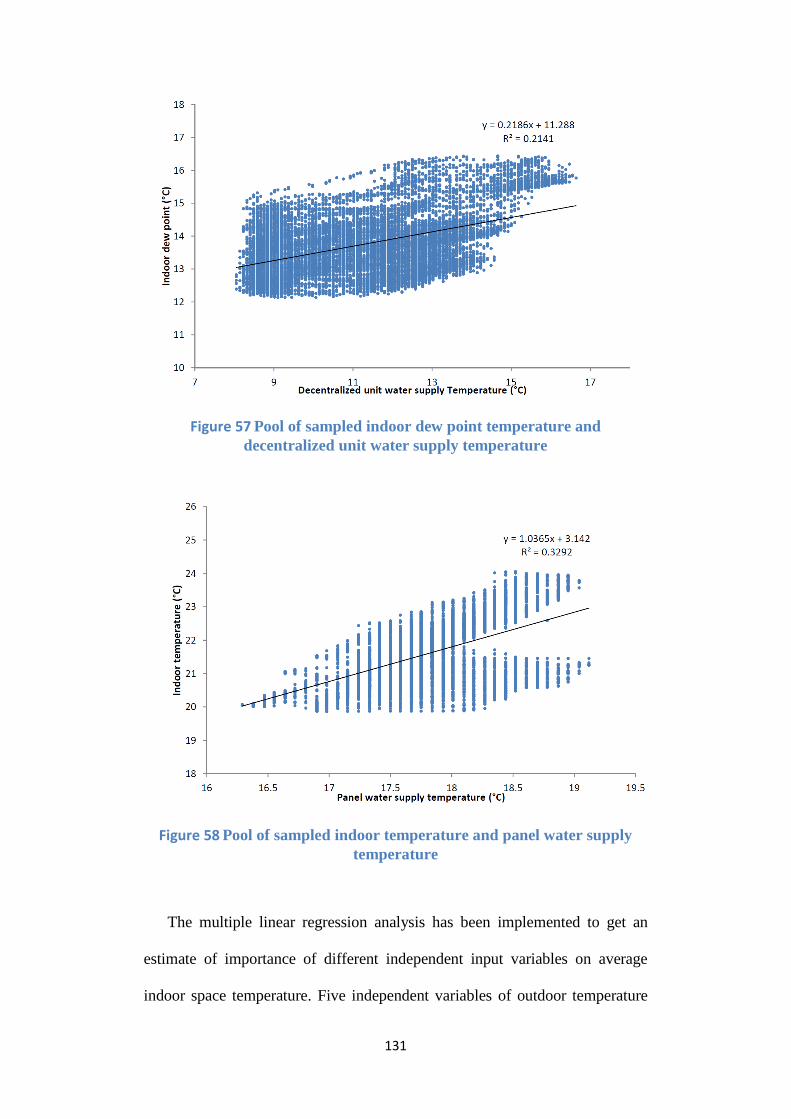
131
Figure 57 Pool of sampled indoor dew point temperature and
decentralized unit water supply temperature
Figure 58 Pool of sampled indoor temperature and panel water supply
temperature
The multiple linear regression analysis has been implemented to get an
estimate of importance of different independent input variables on average
indoor space temperature. Five independent variables of outdoor temperature

132
(°C), decentralized unit water supply temperature (°C), decentralized unit water
flow rate (mL/s), outdoor air flow rate (L/s), and radiant panel water supply
temperature (°C) have been considered in this investigation. The outcomes of
statistical analysis for linear coefficients, standard error and P-values based on
the “t” statistic test are listed in Table 12. The coefficient of determination (R2)
for the indoor air temperature is 0.87 which is a good fit between linear
regression line and measured data. The calculated P-values based on the “t”
statistics test are also near zero which indicates that the found correlations are
significant. The dependent variable of average indoor air temperature ascends
with rise of outdoor temperature, decentralized unit water supply temperature
and panel supply water temperature and it drops with increase of decentralized
unit water flow rate and outdoor air flow rate.
Table 12 Multiple linear regression analysis for dependent variable of indoor temperature
Y Variable – indoor temperature (°C) Coefficients Standard
Error P-value
Intercept 0.884087 0.143734 7.91E-10
X Variable 1 Outdoor temperature (°C) 0.596047 0.002384 0
X Variable 2 Decentralized unit water
supply temperature (°C) 0.037066 0.001359
8.3E-160
X Variable 3 Decentralized unit water
flow rate (mL/s) -0.0174 0.000697
1.1E-134
X Variable 4 Air flow rate (L/s) -0.04122 0.001012 0
X Variable 5 Panel water supply
temperature (°C) 0.297756 0.006531
0
𝑌∗ = 0.88 + 0.6 𝑋1 + 0.04 𝑋2 − 0.02 𝑋3 − 0.04 𝑋4 + 0.3 𝑋5 (±0.002) (±0.001) (±0.0007) (±0.001) (±0.006)
𝐶𝑜𝑒𝑓𝑓𝑖𝑐𝑖𝑒𝑛𝑡 𝑜𝑓 𝑑𝑒𝑡𝑒𝑟𝑚𝑖𝑛𝑎𝑡𝑖𝑜𝑛 𝑅2 = 0.87

133
4.4 Thermal comfort and indoor air quality
Thermal comfort index and indoor air pollutants level are the main
parameters which should be evaluated for any new designed air conditioning
system in buildings. DDOAS-RCP in the tropics introduces a new indoor
environment with lower air movement and mean radiant temperature compared
to that for the conventional all air system. The measured mean radiant
temperature in space was roughly 2 °C less than dry bulb temperature at
locations below the radiant panels. Although Fanger’s PMV model has not
been fully accepted as a reference thermal comfort model for the tropical
climates, it still can provide some insights into the possible range of acceptable
indoor air condition by occupants. The calculated PMV for a typical day based
on average of measured values inside the BubbleZERO conditioned with
DDOAS-RCP is shown in Figure 59. The categories of A and B of thermal
environment in the standard of ISO 7730 (2005) have been chosen as
thresholds which respectively corresponds to -0.2 < PMV < 0.2 and -0.5 <
PMV < 0.5 (Predicted Percentage Dissatisfied (PPD) < 6 and 10 %). It can be
seen in Figure 59 that with fixed operational settings of system (set based on
maximum cooling load), indoor air was slightly overcooled in the morning and
eventually it went into the comfort range in the afternoon time. As mentioned
in the literature review chapter, the predictions of Fanger’s PMV model do not
truly match the perception of locally acclimatized occupants. The neutral
temperature based on occupants’ perception could be slightly warmer or cooler
(Andreasi et al., 2010; de Dear and Leow, 1990; Indraganti et al., 2014; Willem

134
and Tham, 2007) than PMV predictions and low air speed in indoor space is
likely to be the point of comfort concern for this climate.
The relevant local discomfort criteria of categories A and B in the ISO
standard includes draft risk (maximum air velocity), vertical air temperature
difference, range of floor temperature, and radiant temperature asymmetry.
Draft risk is not a concern for this design because of low air movement in the
space. Vertical temperature difference is less than 2 °C which is in the
acceptable range of both categories (A: < 2 °C, B: < 3 °C). The floor
temperature during the experiments was in the range of 20 to 22 °C which is in
tolerable range of the standard (19-29 °C). In addition, the maximum measured
surface temperature difference inside the BubbleZERO was around 10 °C
which is less than radiant temperature asymmetry threshold of the ISO standard
for cool ceiling (< 14 °C). Regarding the compliance with the Singapore
standard, spot measurements with anemometer revealed that the indoor air
velocity is less than 0.01 m/s (resolution of device) in most of locations inside
the space (except close to diffusers) which is below the acceptable range of
Singapore standard SS 554 (0.1-0.3 m/s). Although the calculated PMV shows
that lower dry bulb and mean radiant temperature could compensate the impact
of lower air movement, the preference of locally acclimatized occupants in the
tropics requires further investigation. It is also noteworthy that the calculation
of PMV has been done for a normal male employee in Singapore’s offices with
sedentary activity (1.2 met), normal trousers and long sleeves shirt (0.79 clo). 1
met is the metabolic unit which is equal to metabolic rate (M) of 58.2 W/m2
and 1 clo is the clothing unit which is equal to clothing insulation (Icl) of 0.155
m2 K/W.

135
Figure 59 Calculated daily PMV in the BubbleZERO under fixed
operational settings of system
Besides the whole space and local comfort criteria, air quality level in a
conditioned space with DDOAS-RCP is also an important aspect of this design.
Continuous and spot measurements have been done during the experiments for
the main indoor air pollutants of carbon dioxide (CO2), total volatile organic
compounds (TVOCs) and respirable suspended particles (RSP). Carbon
dioxide as the main human related contaminant in the indoor space has been
monitored inside the test chamber. The variations of CO2 concentration under
steady state indoor conditions with different ventilation rates are shown in
Figure 60. During the experiments, the occupancy level was 0.1 person/m2. As
can be seen in Figure 60, CO2 level is below threshold of 1100 ppm (700 ppm
more than outdoor concentration based on SS 554) in all the cases. At the
ventilation rate of 0.44 L/s/m2, the CO2 concentration was close to the

136
threshold, while at higher rates, it was well below the limit. These results are
consistent with the recommended ventilation rate for office spaces in Singapore
set by the local standard of SS 553, which is 0.6 L/s/m2.
Figure 60 Carbon dioxide concentrations for five considered ventilation
rates and threshold value set by local standard SS 554
Besides overall and steady state level of carbon dioxide, the spatial and
temporal distribution of CO2 in the indoor space was also explored during the
measurements. The transient CO2 level in the BubbleZERO for a typical day
with occupants entering and leaving the space is shown in Figure 61. It can be
seen that after each change in occupancy it takes about two hours to reach a
steady state CO2 concentration in the space. In addition, a 30% reduction in
ventilation rate of the laboratory resulted in 100 ppm increase in steady state
carbon dioxide concentration. During these measurements in occupied period,
two persons were sitting in the laboratory which is equal to an occupancy level
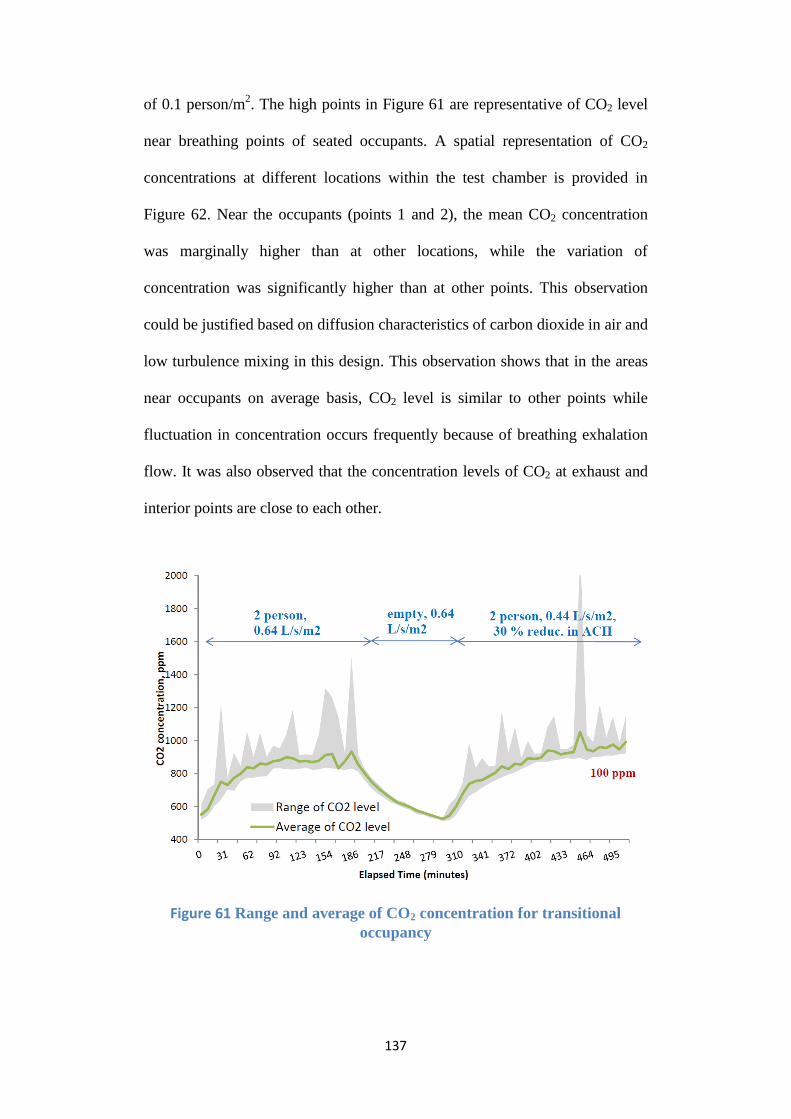
137
of 0.1 person/m2. The high points in Figure 61 are representative of CO2 level
near breathing points of seated occupants. A spatial representation of CO2
concentrations at different locations within the test chamber is provided in
Figure 62. Near the occupants (points 1 and 2), the mean CO2 concentration
was marginally higher than at other locations, while the variation of
concentration was significantly higher than at other points. This observation
could be justified based on diffusion characteristics of carbon dioxide in air and
low turbulence mixing in this design. This observation shows that in the areas
near occupants on average basis, CO2 level is similar to other points while
fluctuation in concentration occurs frequently because of breathing exhalation
flow. It was also observed that the concentration levels of CO2 at exhaust and
interior points are close to each other.
Figure 61 Range and average of CO2 concentration for transitional
occupancy

138
Figure 62 Spatial variation of carbon dioxide in space in order of distance
from occupants
TVOCs concentration also has been measured at several spot points in the
BubbleZERO and observed values were around 150 ppb in occupancy period
which is well below SS 554 limits (3000 ppb). The background level of
TVOCs in the space without occupants ranged between 40 to 50 ppb. This
measured range shows that there is no concern regarding the emitted organic
compounds from materials of walls, floor, roof, tables and other objects in the
space. VOC monitor of ppbRAE 3000 has been used for these measurements
which is a third generation photoionization detector with built-in correction
factor for more than 200 VOC compounds. RSP concentration has also been
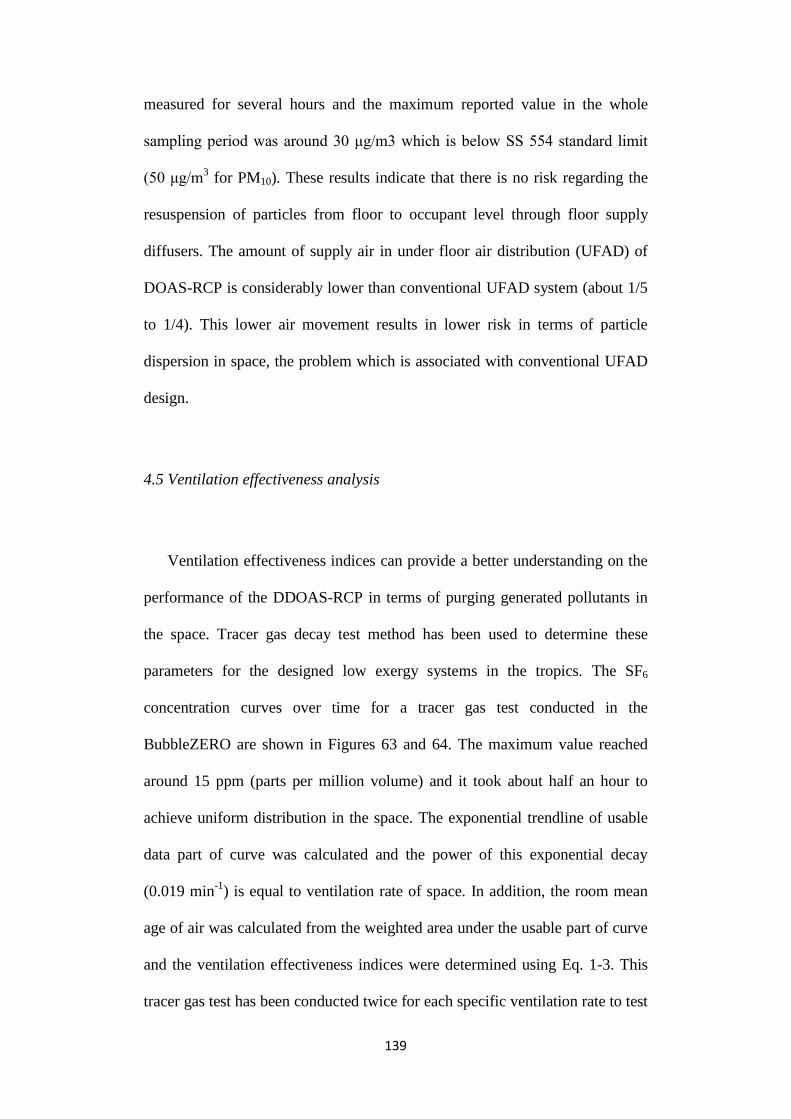
139
measured for several hours and the maximum reported value in the whole
sampling period was around 30 μg/m3 which is below SS 554 standard limit
(50 μg/m3 for PM10). These results indicate that there is no risk regarding the
resuspension of particles from floor to occupant level through floor supply
diffusers. The amount of supply air in under floor air distribution (UFAD) of
DOAS-RCP is considerably lower than conventional UFAD system (about 1/5
to 1/4). This lower air movement results in lower risk in terms of particle
dispersion in space, the problem which is associated with conventional UFAD
design.
4.5 Ventilation effectiveness analysis
Ventilation effectiveness indices can provide a better understanding on the
performance of the DDOAS-RCP in terms of purging generated pollutants in
the space. Tracer gas decay test method has been used to determine these
parameters for the designed low exergy systems in the tropics. The SF6
concentration curves over time for a tracer gas test conducted in the
BubbleZERO are shown in Figures 63 and 64. The maximum value reached
around 15 ppm (parts per million volume) and it took about half an hour to
achieve uniform distribution in the space. The exponential trendline of usable
data part of curve was calculated and the power of this exponential decay
(0.019 min-1
) is equal to ventilation rate of space. In addition, the room mean
age of air was calculated from the weighted area under the usable part of curve
and the ventilation effectiveness indices were determined using Eq. 1-3. This
tracer gas test has been conducted twice for each specific ventilation rate to test

140
the repeatability of the experiments. The variations of ventilation effectiveness
indices for repeated cases as well as different locations are included in the
presented values as error bars. The red line in Figures 63 and 64 shows the
usable data part of curve for the calculation of ventilation rate and ACE. The
exponential trendline of the usable data and the corresponding equation are also
shown (green line) here.
Figure 63 Measured SF6 concentration and interpolated curve for a SF6
step down tracer gas decay test
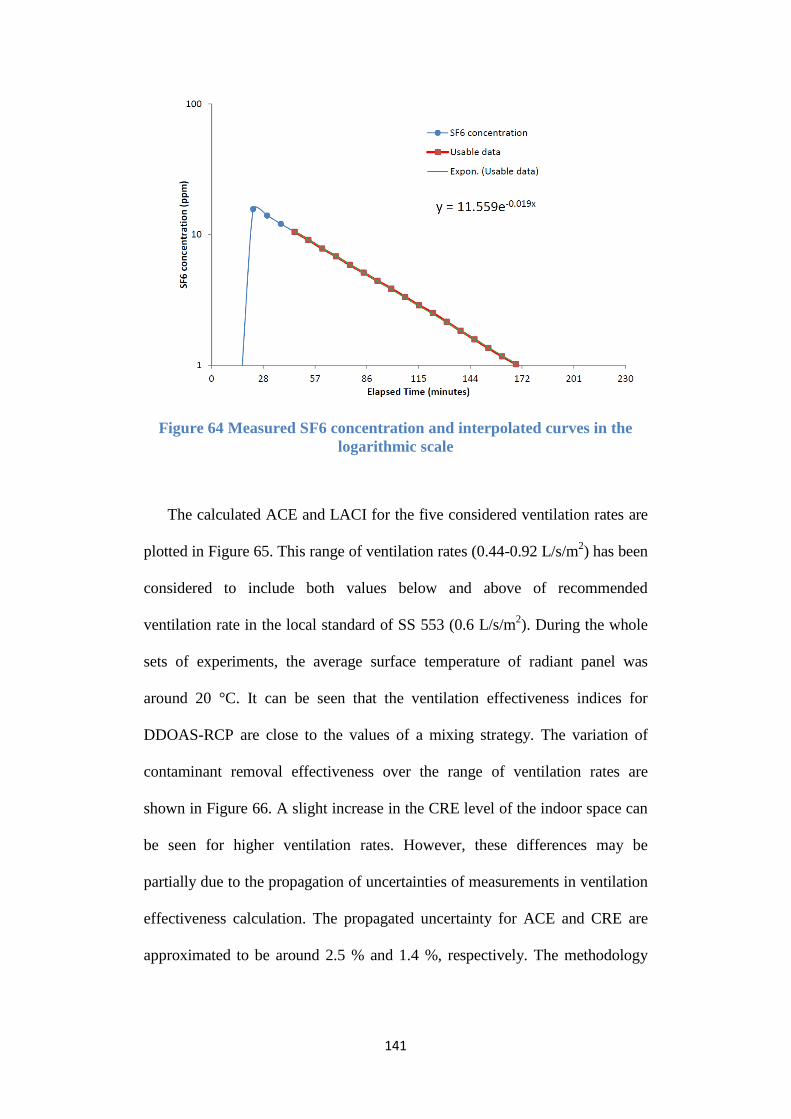
141
Figure 64 Measured SF6 concentration and interpolated curves in the
logarithmic scale
The calculated ACE and LACI for the five considered ventilation rates are
plotted in Figure 65. This range of ventilation rates (0.44-0.92 L/s/m2) has been
considered to include both values below and above of recommended
ventilation rate in the local standard of SS 553 (0.6 L/s/m2). During the whole
sets of experiments, the average surface temperature of radiant panel was
around 20 °C. It can be seen that the ventilation effectiveness indices for
DDOAS-RCP are close to the values of a mixing strategy. The variation of
contaminant removal effectiveness over the range of ventilation rates are
shown in Figure 66. A slight increase in the CRE level of the indoor space can
be seen for higher ventilation rates. However, these differences may be
partially due to the propagation of uncertainties of measurements in ventilation
effectiveness calculation. The propagated uncertainty for ACE and CRE are
approximated to be around 2.5 % and 1.4 %, respectively. The methodology
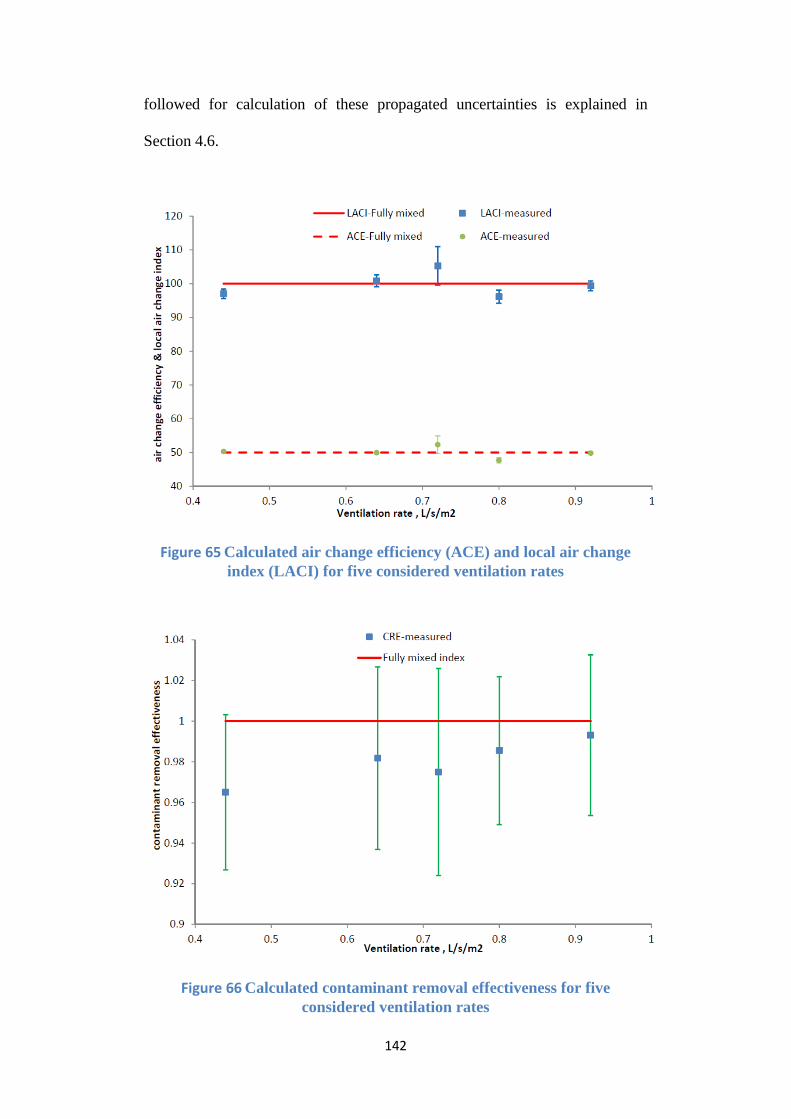
142
followed for calculation of these propagated uncertainties is explained in
Section 4.6.
Figure 65 Calculated air change efficiency (ACE) and local air change
index (LACI) for five considered ventilation rates
Figure 66 Calculated contaminant removal effectiveness for five
considered ventilation rates

143
4.6 Uncertainty analysis
The measured values during the experiments are subjected to some
uncertainties due to the various measurement errors including instruments’
precision or observational error. The accuracy, resolution and repeatability of
instruments are parts of systematic and random errors in the measurements
which can be determined from the technical specification of the used
instruments. The continuous and spot measuring instruments, which have been
used for the experiments, are listed in Table 13, including their accuracy,
resolution and repeatability. Accuracy describes how close the measured value
is to the true value, and resolution is the smallest increment, which can be
detected by an instrument. Repeatability of a test is defined as the variation of a
measured value with same person, instruments and condition in the repeated
times. These values can be used to get an idea of the range of true values in
respect to the measured values.
Table 13 Measuring instruments and their technical specifications and
uncertainties
Parameters &
Pollutants Measuring Instruments
Accuracy/ Resolution /
Repeatability
Respirable Suspended
Particles (RSP), PM1,
PM2.5, PM10
DUSTTRAK™ DRX
Aerosol Monitors Models
8533
Res.: ± 0.1% of reading or 0.001
mg/m3, whichever is greater
Carbon Dioxide, CO2
IAQ-CALC™ Indoor Air
Quality Meters Model
7545
Acc.: ± 3.0% of reading or ±50
ppm, whichever is greater
Res.: 1 ppm
Photoacoustic multi-gas
monitor Innova 1312 Rep.: 1% of measured value
Sulfur Hexafluoride, Photoacoustic multi-gas Rep.: 1% of measured value
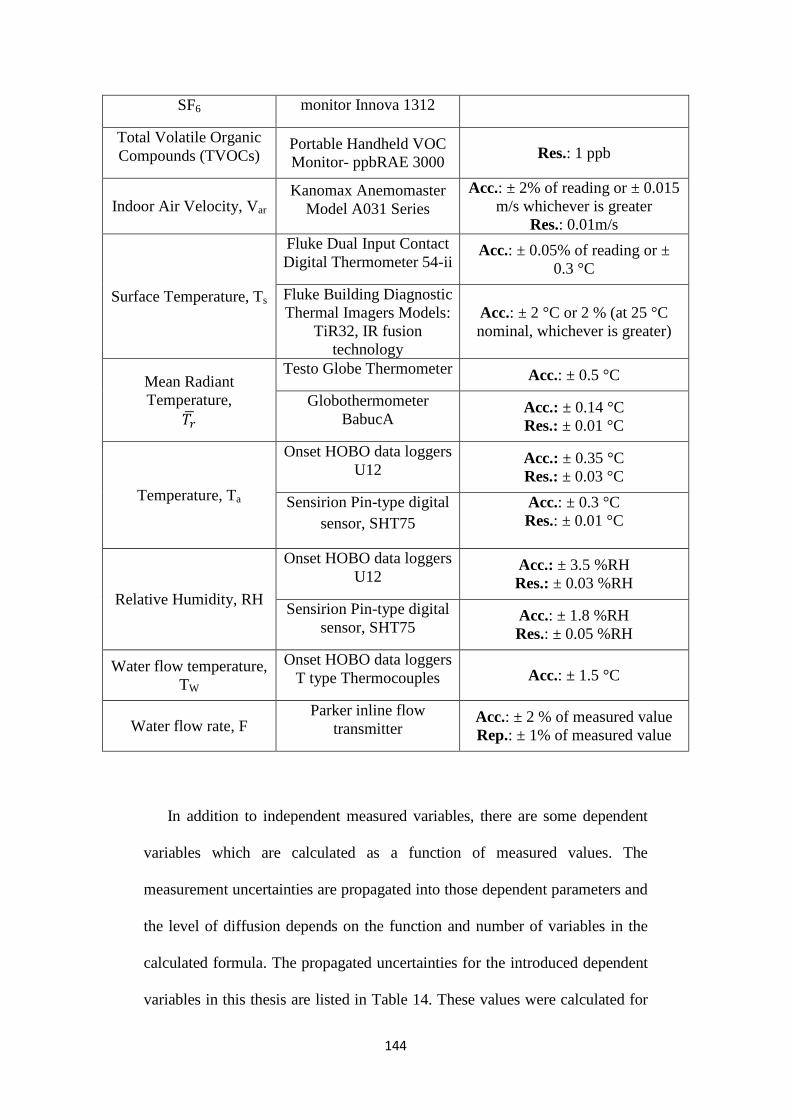
144
SF6 monitor Innova 1312
Total Volatile Organic
Compounds (TVOCs) Portable Handheld VOC
Monitor- ppbRAE 3000 Res.: 1 ppb
Indoor Air Velocity, Var Kanomax Anemomaster
Model A031 Series
Acc.: ± 2% of reading or ± 0.015
m/s whichever is greater
Res.: 0.01m/s
Surface Temperature, Ts
Fluke Dual Input Contact
Digital Thermometer 54-ii Acc.: ± 0.05% of reading or ±
0.3 °C
Fluke Building Diagnostic
Thermal Imagers Models:
TiR32, IR fusion
technology
Acc.: ± 2 °C or 2 % (at 25 °C
nominal, whichever is greater)
Mean Radiant
Temperature, 𝑇�̅�
Testo Globe Thermometer Acc.: ± 0.5 °C
Globothermometer
BabucA Acc.: ± 0.14 °C
Res.: ± 0.01 °C
Temperature, Ta
Onset HOBO data loggers
U12 Acc.: ± 0.35 °C
Res.: ± 0.03 °C
Sensirion Pin-type digital
sensor, SHT75
Acc.: ± 0.3 °C
Res.: ± 0.01 °C
Relative Humidity, RH
Onset HOBO data loggers
U12 Acc.: ± 3.5 %RH
Res.: ± 0.03 %RH
Sensirion Pin-type digital
sensor, SHT75 Acc.: ± 1.8 %RH
Res.: ± 0.05 %RH
Water flow temperature,
TW
Onset HOBO data loggers
T type Thermocouples Acc.: ± 1.5 °C
Water flow rate, F Parker inline flow
transmitter Acc.: ± 2 % of measured value
Rep.: ± 1% of measured value
In addition to independent measured variables, there are some dependent
variables which are calculated as a function of measured values. The
measurement uncertainties are propagated into those dependent parameters and
the level of diffusion depends on the function and number of variables in the
calculated formula. The propagated uncertainties for the introduced dependent
variables in this thesis are listed in Table 14. These values were calculated for

145
each parameter based on the corresponding mathematical formula and mean
values in the operational range of the relevant independent variables. An open
source calculator called “abacus” has been used to estimate the propagation of
uncertainty in dependent parameters based on the mean values and range of
independent variables.
Table 14 Propagated uncertainties in the introduced dependent variables
Dependent parameters Calculated variables Propagated
uncertainty
Dew Point temperature,
Td
Temperature-T, Relative Humidity-
RH ± 0.9 °C
Operative temperature,
To
Temperature-T, Mean Radiant
Temperature-𝑇�̅� ± 0.2 °C
Air Change Rate, ACR Sulfur Hexafluoride, SF6 ± 0.008 (± 0.6 %)
Air Change Efficiency,
ACE Sulfur Hexafluoride, SF6 ± 1.2 (± 2.5 %)
Contaminant Removal
Effectiveness, CRE Carbon Dioxide, CO2 ± 0.014 (± 1.4 %)
Local Air Change Index,
LACI Sulfur Hexafluoride, SF6 ± 2 (± 2.1 %)
4.7 CFD results
Verification and validation are essential stages of any CFD simulation in
order to achieve reliable results and confidently employ the outcomes for
design process. CFD verification is a process for evaluation of numerical
uncertainty through examining programming code, iterative convergence, grid
convergence and comparing with benchmark numerical solutions. On the level
of consistency with physical reality, CFD validation is defined as the
evaluation of modelling accuracy through comparing of simulated results with
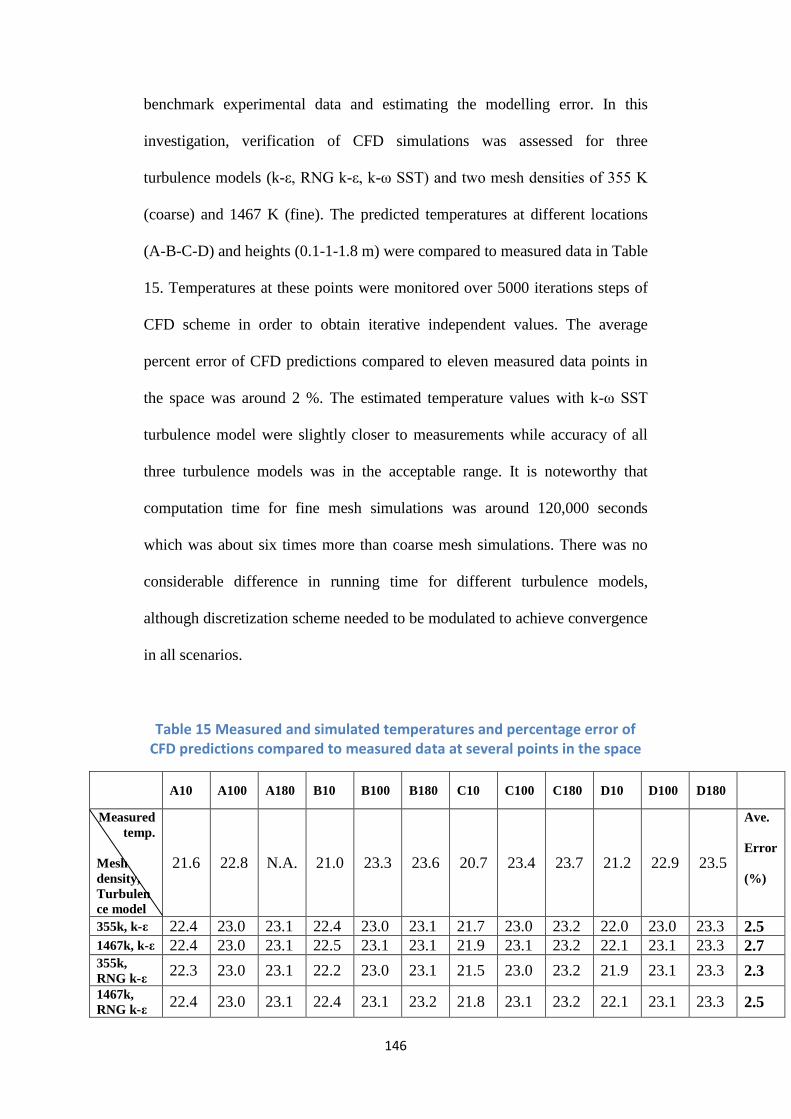
146
benchmark experimental data and estimating the modelling error. In this
investigation, verification of CFD simulations was assessed for three
turbulence models (k-ε, RNG k-ε, k-ω SST) and two mesh densities of 355 K
(coarse) and 1467 K (fine). The predicted temperatures at different locations
(A-B-C-D) and heights (0.1-1-1.8 m) were compared to measured data in Table
15. Temperatures at these points were monitored over 5000 iterations steps of
CFD scheme in order to obtain iterative independent values. The average
percent error of CFD predictions compared to eleven measured data points in
the space was around 2 %. The estimated temperature values with k-ω SST
turbulence model were slightly closer to measurements while accuracy of all
three turbulence models was in the acceptable range. It is noteworthy that
computation time for fine mesh simulations was around 120,000 seconds
which was about six times more than coarse mesh simulations. There was no
considerable difference in running time for different turbulence models,
although discretization scheme needed to be modulated to achieve convergence
in all scenarios.
Table 15 Measured and simulated temperatures and percentage error of CFD predictions compared to measured data at several points in the space
A10 A100 A180 B10 B100 B180 C10 C100 C180 D10 D100 D180
Measured
temp.
Mesh
density,
Turbulen
ce model
21.6 22.8 N.A. 21.0 23.3 23.6 20.7 23.4 23.7 21.2 22.9 23.5
Ave.
Error
(%)
355k, k-ε 22.4 23.0 23.1 22.4 23.0 23.1 21.7 23.0 23.2 22.0 23.0 23.3 2.5
1467k, k-ε 22.4 23.0 23.1 22.5 23.1 23.1 21.9 23.1 23.2 22.1 23.1 23.3 2.7 355k,
RNG k-ε 22.3 23.0 23.1 22.2 23.0 23.1 21.5 23.0 23.2 21.9 23.1 23.3 2.3
1467k,
RNG k-ε 22.4 23.0 23.1 22.4 23.1 23.2 21.8 23.1 23.2 22.1 23.1 23.3 2.5

147
355k, k-ω
SST 22.1 23.0 23.1 22.1 23.1 23.1 21.5 23.1 23.2 21.8 23.1 23.3 2.1
1467k, k-
ω SST 22.3 23.1 23.2 22.4 23.1 23.2 21.8 23.1 23.3 22.0 23.2 23.3 2.4
Predicted vertical thermal stratification with different turbulence models
and mesh densities at a point (C) in the centre of the BubbleZERO are plotted
in Figure 67 including measured data range. The temperature profile is specific
to the conditioned space with floor air supply and ceiling panel where air is
cooler near floor and chilled ceiling. Since heat transfer near chilled ceiling
occurs mostly through radiation rather than convection, the slope of transition
from mid-height level temperature to ceiling is steeper than that of floor to
mid-height values. The predictions are closer to experimental data at mid-
height temperature while near floor and ceiling, the difference is more
pronounced. CFD simulations with fine and coarse mesh elements resulted in
similar temperature profiles except near cooling panels where there is a slight
difference between them. Overall, the curves are fairly close to each other
which shows the negligible impact of turbulence model and cell size on CFD
predictions for these types of flow patterns.
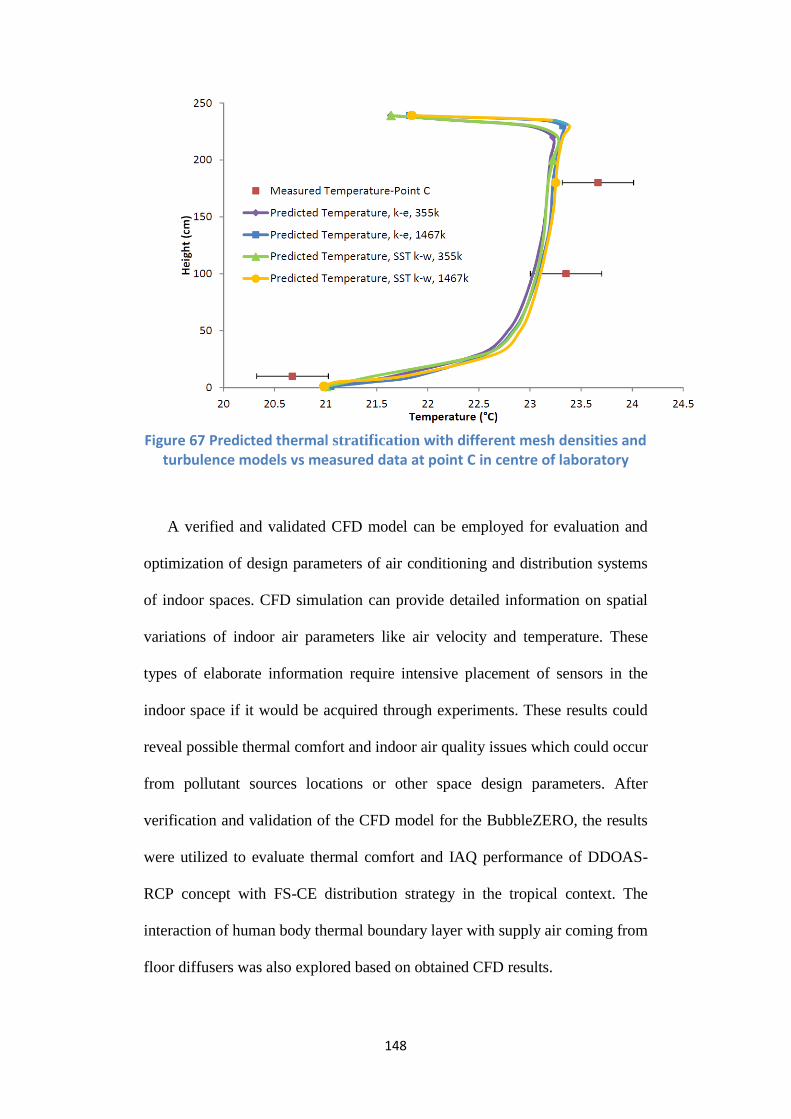
148
Figure 67 Predicted thermal stratification with different mesh densities and
turbulence models vs measured data at point C in centre of laboratory
A verified and validated CFD model can be employed for evaluation and
optimization of design parameters of air conditioning and distribution systems
of indoor spaces. CFD simulation can provide detailed information on spatial
variations of indoor air parameters like air velocity and temperature. These
types of elaborate information require intensive placement of sensors in the
indoor space if it would be acquired through experiments. These results could
reveal possible thermal comfort and indoor air quality issues which could occur
from pollutant sources locations or other space design parameters. After
verification and validation of the CFD model for the BubbleZERO, the results
were utilized to evaluate thermal comfort and IAQ performance of DDOAS-
RCP concept with FS-CE distribution strategy in the tropical context. The
interaction of human body thermal boundary layer with supply air coming from
floor diffusers was also explored based on obtained CFD results.

149
The predicted air velocity and temperature contours near floor diffusers are
shown in Figures 68 and 69, respectively. Air velocity is less than 0.1 m/s in
most of locations in the interior space except near floor diffusers and exhaust
points. The details of supply air openings, including dust collection basket and
floor swirl diffuser were not modelled in this simulation so the actual velocity
pattern near diffuser are expected to be more uniform in reality. It can be
observed in Figure 68 that the temperature in the radius of 0.2 m from floor
diffusers is in the range of 18 °C which raises the concern of cold feet for
occupants seated close to them. In the conducted experimental scenarios, cool
outdoor air was supplied at temperatures in the range of 13-14 °C and this
operational condition caused low air temperature conditions at diffuser outlet.
Besides locations nearby to diffusers, temperature is approximately 21 °C at
feet level which rises to the range of 23 °C at breathing level. Below the chilled
ceiling, only a 0.05 m layer of cool air was formed, since radiation is the main
heat transfer mechanism from panel surface to the BubbleZERO space.
Figure 68 Predicted air velocity pattern near diffusers

150
Figure 69 Predicted temperature distribution near diffusers
The thermal plumes generated around a seated human body in the space are
illustrated in Figures 70 and 71. There is a considerable increase of air velocity
above the head of the simulated occupants where buoyancy flow starts forming
above the chest area. Similar observations on rising thermal plume above the
head of human body have been reported in several numerical and experimental
studies in the literature (Gao and Niu, 2004; Sørensen and Voigt, 2003). The
air temperature adjacent to human body segments is warmer than average
temperature of the space. The warm plume grows over the chest and face and it
extends to about 1 m above the head before fading away near the ceiling. The
heat generated by laptop also caused a small thermal boundary layer around its
hot surfaces. Figure 72 displays the velocity vector field for the whole interior
space where vectors are scaled by air velocity magnitude and they are coloured
by temperature index. The velocity field near and above occupants head is
stronger than at other points in the space and this natural convection flow is
mainly vertical toward the ceiling. Besides seven supply air openings near the
floor, air speed is also high near exhaust openings at two sides of the façade

151
where air leaves the space. No prevailing air velocity vector was observed in
upward direction and there was random velocity fluctuation everywhere except
for vertical buoyancy flow around human body.
Figure 70 Predicted air velocity pattern near human body
Figure 71 Predicted temperature distribution near human body

152
Figure 72 Velocity vectors in the BubbleZERO scaled by velocity magnitude and colored by temperature
Surface temperature of radiant cooling panel is a key design parameter in
operational condition of DDOAS-RCP. This design parameter plays a critical
role in the tropical context where condensation risk is more serious than in a
moderate climate and control of indoor humidity level is essential. On the one
hand, panel surface temperature needs to be above indoor dew point level, but
on the other hand, higher surface temperatures decreases panel cooling capacity
and its effectiveness for satisfying sensible cooling load of space. The indoor
dew point temperature is in the range of 17 °C for comfort criteria of 24 °C dry
bulb temperature and 65 % relative humidity (SS 554, 2009). For the previous
simulations, a uniform temperature of 20 °C was assumed over the whole panel
surface. However, an infrared image of the panel installed in the BubbleZERO
showed that in reality there could be up to 3 °C temperature difference over the
panel surface. In this investigation, the validated and verified CFD model has
153
been employed to get a better understanding of the impact of panel temperature
on indoor space condition. Simulations were conducted for several uniform
panel surface temperatures in the range of 18 to 22 °C while other boundary
conditions were fixed. The radiant flux absorbed by radiant panel under various
panel surface temperatures is shown in Figure 73. The radiant capacity of panel
which is 43 W/m2 at 18 °C panel surface temperature drops to 13 W/m
2 at 22
°C surface temperature, a decrease of 10 W/m2 in capacity per 1 °C surface
temperature increase. This steep reduction in radiant flux of panel with a small
increase in surface temperature can be explained based on the Stefan-
Boltzmann law, which shows the driving force in the radiant heat transfer
mechanism is the difference between fourth power of panel and surrounding
surfaces temperatures. The estimated capacity of radiant ceiling panels based
on design guideline of ASHRAE handbook (2008) is also shown in Figure 73.
This design guideline under area-weighted average uncooled surfaces
temperature (AUST) of 23.5 °C provides lower estimation compared to CFD
predictions which could be caused due to the uncertainties in measurements of
boundary conditions. The results of simulations also revealed that convective
flux constitutes 15 % of total heat flux absorbed by radiant panels and this flux
rate drops for higher panel surface temperature at slightly lower rate compared
to radiant flux.
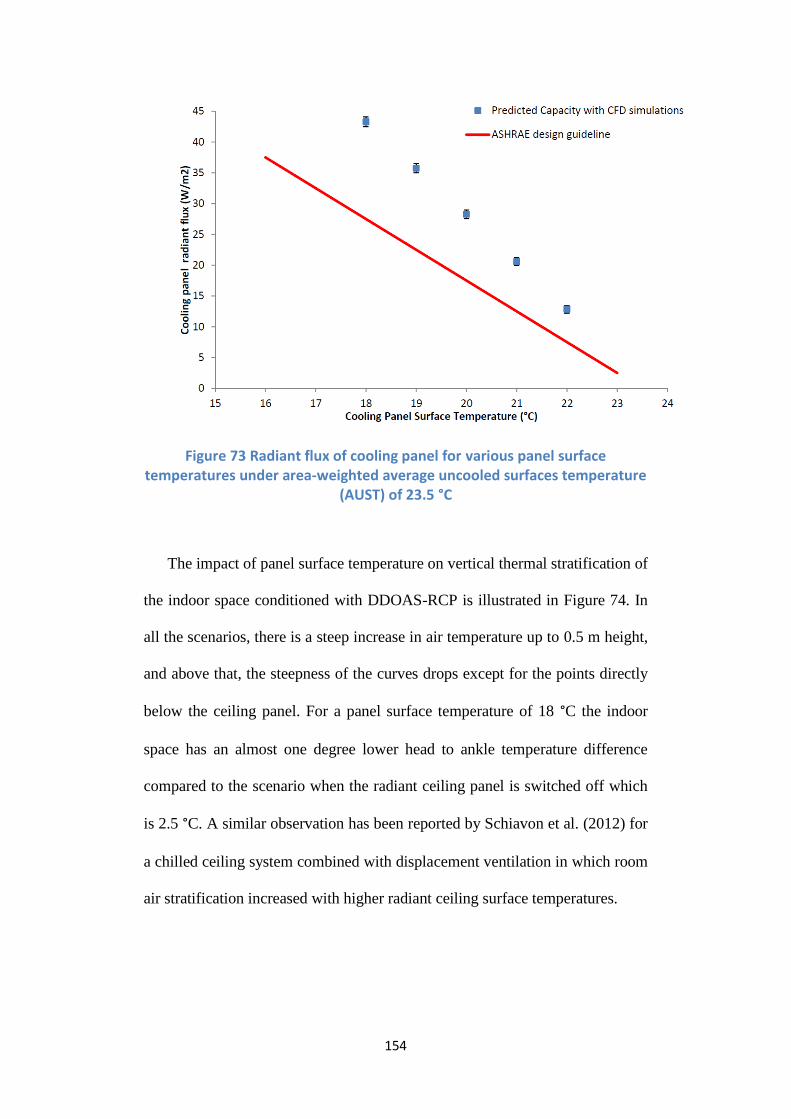
154
Figure 73 Radiant flux of cooling panel for various panel surface temperatures under area-weighted average uncooled surfaces temperature
(AUST) of 23.5 °C
The impact of panel surface temperature on vertical thermal stratification of
the indoor space conditioned with DDOAS-RCP is illustrated in Figure 74. In
all the scenarios, there is a steep increase in air temperature up to 0.5 m height,
and above that, the steepness of the curves drops except for the points directly
below the ceiling panel. For a panel surface temperature of 18 °C the indoor
space has an almost one degree lower head to ankle temperature difference
compared to the scenario when the radiant ceiling panel is switched off which
is 2.5 °C. A similar observation has been reported by Schiavon et al. (2012) for
a chilled ceiling system combined with displacement ventilation in which room
air stratification increased with higher radiant ceiling surface temperatures.

155
Figure 74 Predicted air temperature for various panel surface temperatures
under area-weighted average uncooled surfaces temperature (AUST) of 23.5 °C
It has been shown in Figure 73 that a lower panel surface temperature
results in a significant increase of panel radiant flux. However, not all of this
increase in radiation would directly or indirectly impact thermal comfort of
occupants since some part of it would be transferred to hot façade surfaces and
result in higher heat gain to the space. It was shown in a simulation study (Feng
et al., 2013) that 24 hours cooling energy of radiant cooling system could be 5
to 15 % higher than air systems due to the increase of conduction heat transfer
from the facade. The validated CFD model has been employed to explore the
emitted radiant flux of different body segments under various panel surface
temperatures. The level of increase in radiant flux for five body segments
including chest-head, hand-arm, abdomen, calf-thigh and feet are depicted in
Figure 75. Head, chest, hand, and arm for a seated occupant working on a table
have the highest view factor toward the radiant ceiling panel and the most

156
significant increase in radiant flux can be observed for these parts of body. The
amount of increase in radiant flux ranges between 2 to 5 % compared to panel
off scenario for panel surface temperatures in the range of 18 to 22 °C. The
abdomen, thigh and calf areas of a seated human are mostly hidden by the table
surface from radiant panel and the increase of flux is less significant for these
parts. Since no modesty panel installed on the table inside the BUbbleZERO,
feet is mostly viewed by ceiling panel and there is a 4 % increase of heat flux
for this part at a panel temperature of 18 °C compared to panel off scenario.
Figure 75 Increase in radiant flux compared to panel off scenario for different human body segments
4.8 Integration with low lift chillers
In the introduced DDOAS-RCP system, chilled water is supplied to radiant
panel at temperature of 16 °C while in conventional design, the supply

157
temperature is around 6 °C. COP of refrigeration systems in the tropical context
of Singapore with assumed outdoor temperature of 30 °C (ranges between 27 to
33 °C) can be calculated as follows in Eq. 10-11,
𝐶𝑂𝑃𝐶𝑎𝑟𝑛𝑜𝑡,𝑙𝑜𝑤 𝑡𝑒𝑚𝑝𝑒𝑟𝑎𝑡𝑢𝑟𝑒 =𝑇𝑐
𝑇ℎ−𝑇𝑐=
273.15+6
30−6= 11.6 (Eq. 10)
𝐶𝑂𝑃𝐶𝑎𝑟𝑛𝑜𝑡,ℎ𝑖𝑔ℎ 𝑡𝑒𝑚𝑝𝑒𝑟𝑎𝑡𝑢𝑟𝑒 =𝑇𝑐
𝑇ℎ−𝑇𝑐=
273.15+16
30−16= 20.6 (Eq. 11)
Based on the theoretical Carnot cycle, there is a 77 % increase in
operational COP of chillers for the high temperature cooling system in the
tropical climate of Singapore. However, because of the exergy losses in
different sub-processes inside the chiller, the COP of actual refrigeration
systems operating in cooling system of buildings are far below the theoretical
Carnot values. The level of increase in COP for high temperature cooling is
also less likely to be in the same order. In addition, radiant cooling system in
DDOAS-RCP design only satisfies part of space cooling load. It was shown in
the Section 3.3 that radiant cooling panel covers around 20 to 30 % of space
cooling load and the rest of the load is still required to be met with low
temperature cooling systems like decentralized air supply units.
The ideal Carnot and actual COP of typical air cooled and water cooled
chillers under various temperature lift at evaporative temperature of 5 °C are
shown in Figure 76. The cooling capacity and electricity usage of a 9 kW air
cooled chiller with hermetic reciprocating compressor and a 100 kW water
cooled chiller with scroll compressor were obtained from the available data in
the catalogue of selected manufacturers. The COP of the small size air cooled
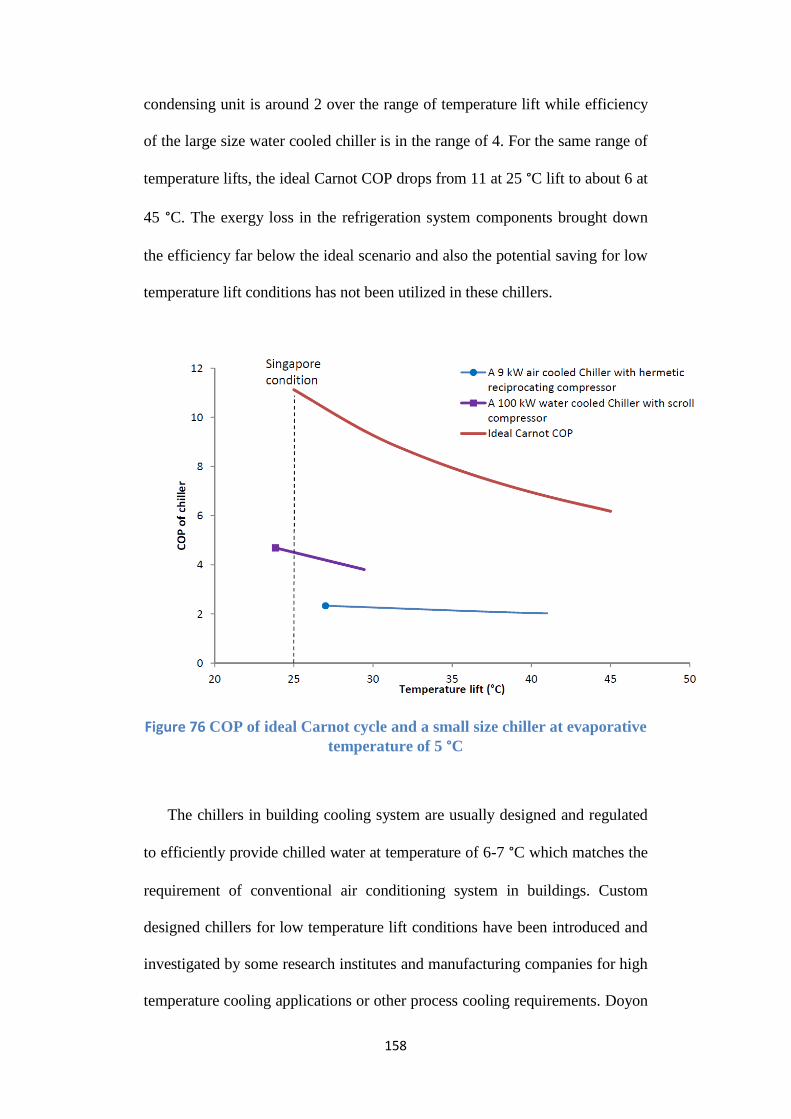
158
condensing unit is around 2 over the range of temperature lift while efficiency
of the large size water cooled chiller is in the range of 4. For the same range of
temperature lifts, the ideal Carnot COP drops from 11 at 25 °C lift to about 6 at
45 °C. The exergy loss in the refrigeration system components brought down
the efficiency far below the ideal scenario and also the potential saving for low
temperature lift conditions has not been utilized in these chillers.
Figure 76 COP of ideal Carnot cycle and a small size chiller at evaporative
temperature of 5 °C
The chillers in building cooling system are usually designed and regulated
to efficiently provide chilled water at temperature of 6-7 °C which matches the
requirement of conventional air conditioning system in buildings. Custom
designed chillers for low temperature lift conditions have been introduced and
investigated by some research institutes and manufacturing companies for high
temperature cooling applications or other process cooling requirements. Doyon

159
(2008) investigated the critical design parameters of centrifugal chillers for
superior efficiency at low temperature lift conditions. He found open-
drive/gear-drive compressors with variable orifice and oil education system as
the most suitable features in chillers for the high temperature cooling
applications. He also concluded that chillers with hermetic drive motors and
fixed variable orifice would not be able to utilize the potential energy saving of
HTC operational conditions due to the required high head pressure for cooling
of motor windings. The oil management system in open-drive centrifugal
chiller needs to be employed with an oil education system to separate oil from
refrigerant in the evaporator and avoid oil loss in low temperature lift
applications. In a collaborative project for implementation of the low exergy
system in the Switzerland, Wyssen et al. (2010) designed a chiller prototype for
low temperature lift conditions which was equipped with a semi-hermetic
reciprocating compressor. The outcomes of this research showed that at
evaporative temperature of 15 °C, the COP of this chiller increases from 4 at 40
°C temperature lift to about 11.4 at 13 °C lift. The COP of this custom designed
chiller as well as ideal Carnot and typical air/water cooled chillers are plotted
in Figure 77. It can be seen that performance curve of this prototype chiller fits
in between typical chillers and ideal efficiency curves. The low lift chiller
performs better than air cooled/water cooled chillers both in terms of COP
value at any specific lift and increase rate for lower temperature lift. This
shows some part of exergy losses in chiller sub-processes has been eliminated
in this design. It is noteworthy that the 9 kW air cooled chiller has been
installed in the BubbleZERO and the measured COP of this chiller was in
agreement with the reported values in the catalogue of the manufacturer.
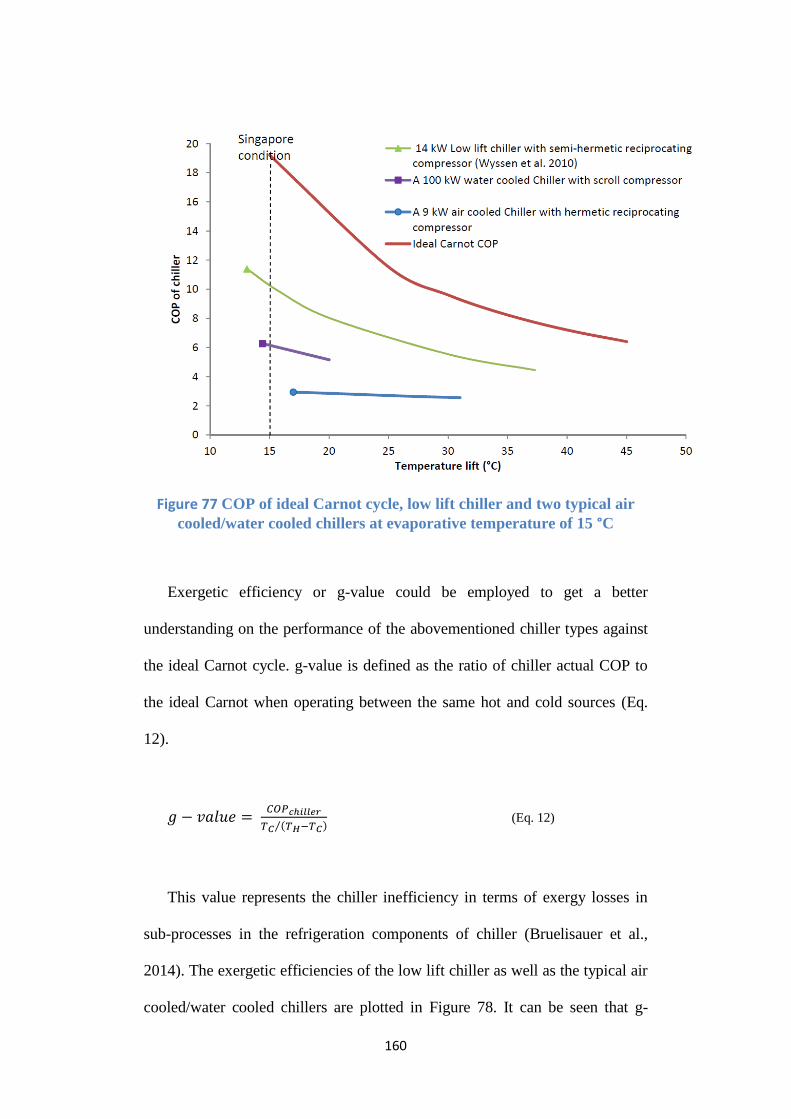
160
Figure 77 COP of ideal Carnot cycle, low lift chiller and two typical air
cooled/water cooled chillers at evaporative temperature of 15 °C
Exergetic efficiency or g-value could be employed to get a better
understanding on the performance of the abovementioned chiller types against
the ideal Carnot cycle. g-value is defined as the ratio of chiller actual COP to
the ideal Carnot when operating between the same hot and cold sources (Eq.
12).
𝑔 − 𝑣𝑎𝑙𝑢𝑒 = 𝐶𝑂𝑃𝑐ℎ𝑖𝑙𝑙𝑒𝑟
𝑇𝐶 (𝑇𝐻−𝑇𝐶)⁄ (Eq. 12)
This value represents the chiller inefficiency in terms of exergy losses in
sub-processes in the refrigeration components of chiller (Bruelisauer et al.,
2014). The exergetic efficiencies of the low lift chiller as well as the typical air
cooled/water cooled chillers are plotted in Figure 78. It can be seen that g-

161
values of typical chillers range between 0.2 to 0.4 which indicates that there are
considerable exergy losses in their refrigeration system. On the other hand, g-
value of the low temperature lift chiller is in the range of 0.5-0.6 and it
performs better in terms of exergy losses within the chiller.
Figure 78 Exergetic efficiency of the low lift chiller and the two typical air
cooled / water cooled chiller at evaporative temperature of 15 °C
4.9 Energy/Exergy saving potentials
Building energy simulation has been conducted for a hypothetical one-
storey office building in the tropical climate of Singapore. The monthly
electricity consumption of this building for different stacks of building services
are shown in Figure 79. In this base design scenario, the all air ACMV design
has been simulated to distribute the conditioned air from AHU room to
different thermal zones. VAV boxes with no reheat were considered in this
simulation to modulate the amount of supply air to each thermal zone based on
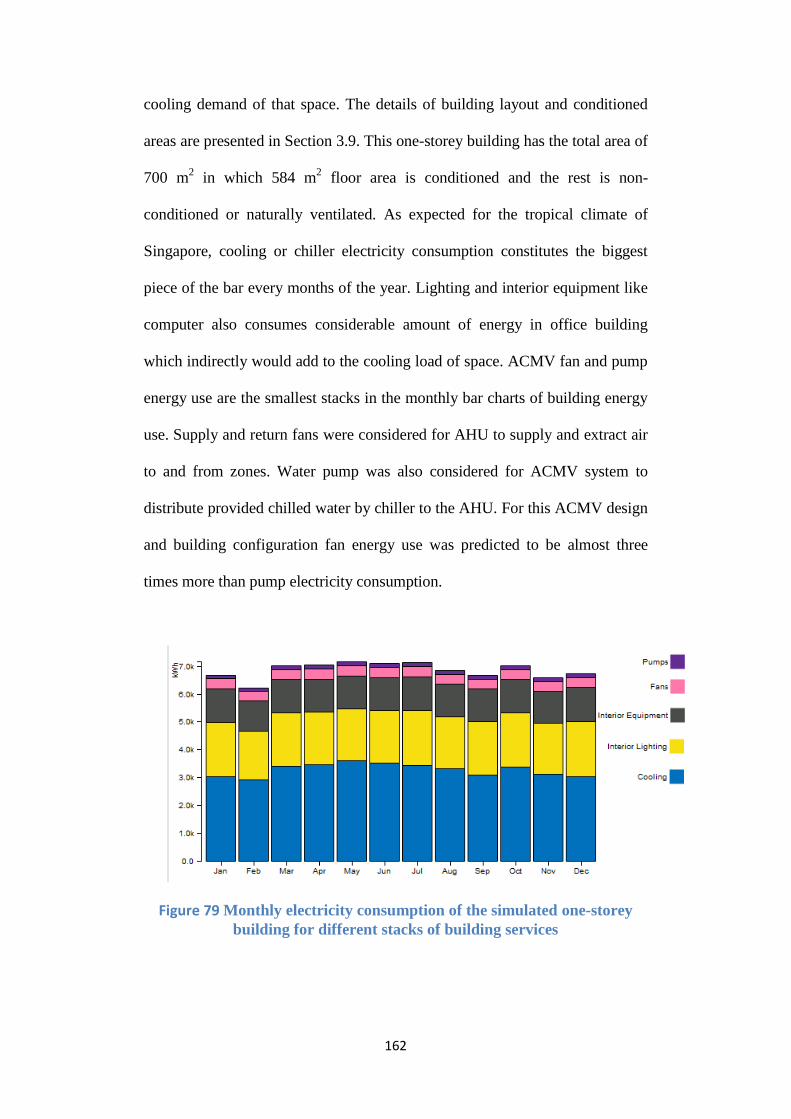
162
cooling demand of that space. The details of building layout and conditioned
areas are presented in Section 3.9. This one-storey building has the total area of
700 m2 in which 584 m
2 floor area is conditioned and the rest is non-
conditioned or naturally ventilated. As expected for the tropical climate of
Singapore, cooling or chiller electricity consumption constitutes the biggest
piece of the bar every months of the year. Lighting and interior equipment like
computer also consumes considerable amount of energy in office building
which indirectly would add to the cooling load of space. ACMV fan and pump
energy use are the smallest stacks in the monthly bar charts of building energy
use. Supply and return fans were considered for AHU to supply and extract air
to and from zones. Water pump was also considered for ACMV system to
distribute provided chilled water by chiller to the AHU. For this ACMV design
and building configuration fan energy use was predicted to be almost three
times more than pump electricity consumption.
Figure 79 Monthly electricity consumption of the simulated one-storey
building for different stacks of building services
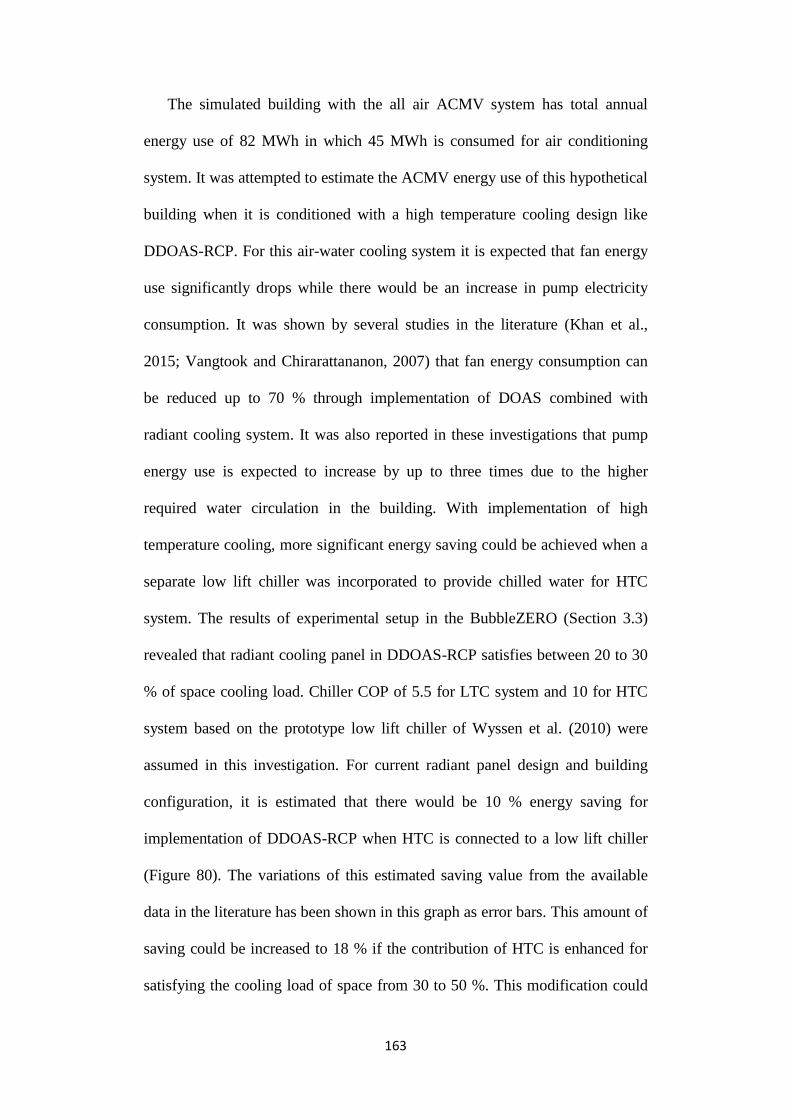
163
The simulated building with the all air ACMV system has total annual
energy use of 82 MWh in which 45 MWh is consumed for air conditioning
system. It was attempted to estimate the ACMV energy use of this hypothetical
building when it is conditioned with a high temperature cooling design like
DDOAS-RCP. For this air-water cooling system it is expected that fan energy
use significantly drops while there would be an increase in pump electricity
consumption. It was shown by several studies in the literature (Khan et al.,
2015; Vangtook and Chirarattananon, 2007) that fan energy consumption can
be reduced up to 70 % through implementation of DOAS combined with
radiant cooling system. It was also reported in these investigations that pump
energy use is expected to increase by up to three times due to the higher
required water circulation in the building. With implementation of high
temperature cooling, more significant energy saving could be achieved when a
separate low lift chiller was incorporated to provide chilled water for HTC
system. The results of experimental setup in the BubbleZERO (Section 3.3)
revealed that radiant cooling panel in DDOAS-RCP satisfies between 20 to 30
% of space cooling load. Chiller COP of 5.5 for LTC system and 10 for HTC
system based on the prototype low lift chiller of Wyssen et al. (2010) were
assumed in this investigation. For current radiant panel design and building
configuration, it is estimated that there would be 10 % energy saving for
implementation of DDOAS-RCP when HTC is connected to a low lift chiller
(Figure 80). The variations of this estimated saving value from the available
data in the literature has been shown in this graph as error bars. This amount of
saving could be increased to 18 % if the contribution of HTC is enhanced for
satisfying the cooling load of space from 30 to 50 %. This modification could

164
be achieved through increasing the number of chilled water passes behind the
panel or improving the airtightness of the façade. It is noteworthy that energy
saving terms in this analysis are determined based on pure exergy sources like
electricity and the values would be equal to exergy saving percentages.
Figure 80 predicted annual energy saving of high temperature cooling for
the hypothetical one-storey building

165
Chapter 5. Discussions
5.1 Decentralized air supply units
The results of experiments for different arrangements of heat exchangers
(HX) inside the decentralized air supply units showed that the arrangement of
HX has some impact on off coil condition of units (Figure 33). In the case
where two HX is utilized for cooling and one for reheating, both off coil
temperature and dew point are higher compared to the case where all the three
HX are employed only for cooling. The first arrangement brings less concern
regarding the cold feet issue near diffusers, although it provides less
dehumidification capacity. The locations of decentralized unit and air ducting
path to floor diffusers could be the deciding point for choosing the right heat
exchanger arrangement. If enough reheating can be provided to the air stream
inside a lengthy path with low insulation duct material, then the second
arrangement would be more suitable. However, in the cases where there is a
short distance between decentralized unit and floor supply, first arrangement of
HX can provide some level of reheating to rise supply air temperature. The
number of heat exchangers inside decentralized unit and arrangement of
cooling coil in terms of chilled water supply order can be further optimized to
provide suitable supply air condition.
The results of regression analyses have shown that there are significant
correlations between decentralized unit’s off coil temperature/capacity and its
operational conditions (Tables 9 and 10). At supply temperature in the range of
8 to 10 °C, the capacity of unit is approximately 1000 W (Figure 34). Unit’s off
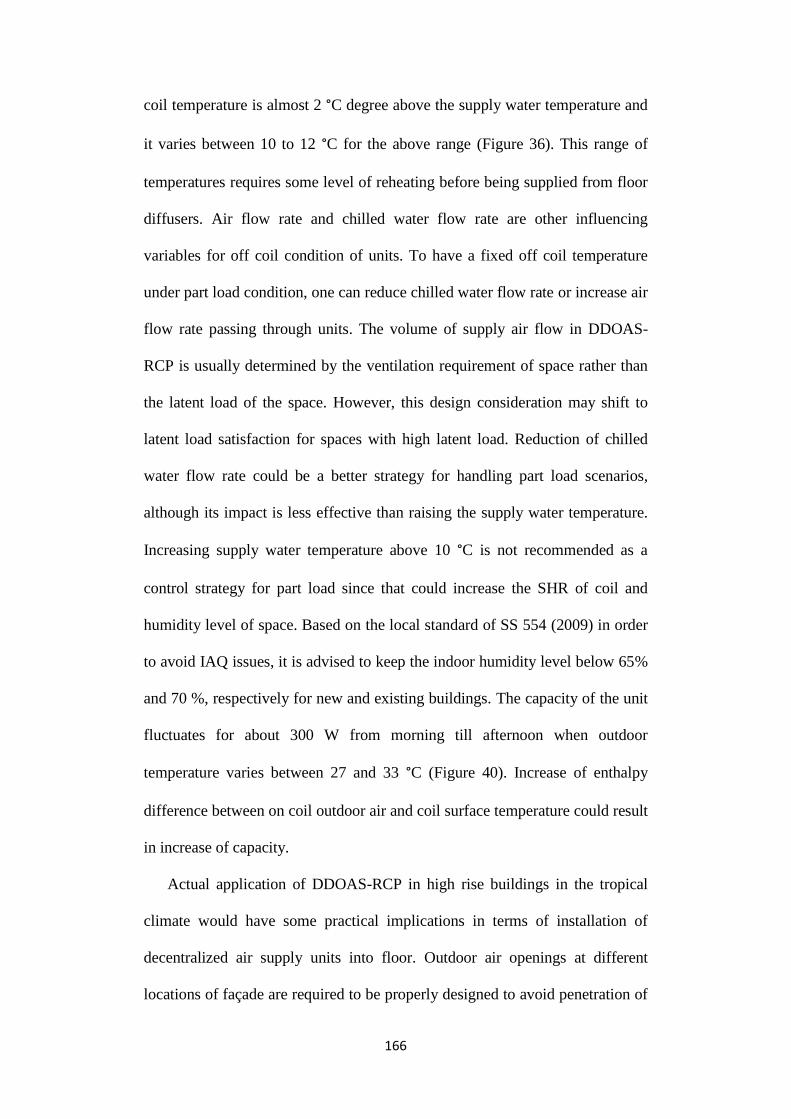
166
coil temperature is almost 2 °C degree above the supply water temperature and
it varies between 10 to 12 °C for the above range (Figure 36). This range of
temperatures requires some level of reheating before being supplied from floor
diffusers. Air flow rate and chilled water flow rate are other influencing
variables for off coil condition of units. To have a fixed off coil temperature
under part load condition, one can reduce chilled water flow rate or increase air
flow rate passing through units. The volume of supply air flow in DDOAS-
RCP is usually determined by the ventilation requirement of space rather than
the latent load of the space. However, this design consideration may shift to
latent load satisfaction for spaces with high latent load. Reduction of chilled
water flow rate could be a better strategy for handling part load scenarios,
although its impact is less effective than raising the supply water temperature.
Increasing supply water temperature above 10 °C is not recommended as a
control strategy for part load since that could increase the SHR of coil and
humidity level of space. Based on the local standard of SS 554 (2009) in order
to avoid IAQ issues, it is advised to keep the indoor humidity level below 65%
and 70 %, respectively for new and existing buildings. The capacity of the unit
fluctuates for about 300 W from morning till afternoon when outdoor
temperature varies between 27 and 33 °C (Figure 40). Increase of enthalpy
difference between on coil outdoor air and coil surface temperature could result
in increase of capacity.
Actual application of DDOAS-RCP in high rise buildings in the tropical
climate would have some practical implications in terms of installation of
decentralized air supply units into floor. Outdoor air openings at different
locations of façade are required to be properly designed to avoid penetration of

167
rainwater into buildings. The type of air filter inside the units needs to be
selected based on level of dust and haze in outdoor air. Two strategies could be
chosen for distribution of air into different parts of floor layout. In the first
strategy, decentralized air supply units are not connected to each other and they
provide dehumidified outdoor air directly to zones near the facade and core of
the building. In the second strategy, decentralized units are connected through
an interlaced duct network which is integrated into floor construction (Baldini
and Meggers, 2008). The first strategy is simpler and more straightforward in
the aspect of control of indoor conditions in different thermal zones. The
interlaced network system can lower the pressure drop in distribution of air to
zones in the core of building, although it adds complexity to dusting system
and control of thermal zones.
5.2 Radiant cooling panel
The infrared image of radiant cooling panel illustrated the non-uniformity
of temperature on panel surface (Figures 44 and 45). The area behind chilled
water pipe was found to be colder than other areas. This variation of
temperature could degrade the capacity of panel and impose further restriction
regarding the condensation risk for a fixed average panel temperature. For the
investigated radiant panel with a two-pass pipe, 3-4 °C temperature variation
was observed on the panel surface and there is potential to reduce this variation
by implementing a four-pass chilled water pipe. This change could also
enhance the cooling capacity of radiant panel per surface area. However, a
higher number of water pipe loops means increased cost of piping and pressure

168
drop in hydronic system. The design specification of radiant panel needs to be
optimized based on trade-off considerations between cooling capacity and cost.
The measurement results on radiant panel revealed that capacity of RCP
rises up in afternoon due to the higher sensible cooling load in the space
compared to morning. This observation brings the question that whether
implementing radiant cooling panel potentially leads to increase of cooling
load for space. It has been reported by several studies in the literature and there
would be an increase of building cooling load for the implemented cases of
radiant cooling compared to the all air system (Feng et al., 2013; Olesen,
2008). Nevertheless, this concern is more relevant to floor cooling systems and
it is improbable of sun shine incidence on cooling panel near the ceiling.
Chilled water supply temperature was found to be effective in influencing the
capacity of RCP as well as chilled water flow rate (Table 11). For cooling of
space under part load conditions, one could increase chilled water supply
temperature or reduce water flow rate to radiant ceiling panel. Utilizing a three-
way control valve for achieving a well-controlled supply temperature could be
a more effective control strategy for handling part load conditions compared to
modulation of water flow rate scheme. The results of experiments revealed that
there is an estimable offset value between chilled water supply temperature and
average panel temperature. This observation shows that attaining any desired
panel surface temperature is plausible with a modular supply water temperature
which is necessary for the tropical context to avoid condensation under various
indoor/outdoor scenarios.

169
5.3 DDOAS combined with RCP
DDOAS-RCP with floor supply-ceiling exhaust and radiant ceiling panel
provides a unique type of conditioned indoor space which exhibits different
characteristics to the all air conditioning system. This design is a combination
of decentralized concept with radiant cooling system in which low momentum
flow is supplied from the floor diffusers. The results of measurements in the
BubbleZERO have shown that there is a two degree vertical thermal
stratification for this design and configuration (Figure 51). The level of vertical
thermal stratification for a typical DV+CC design could be up to 4 ˚C
(Schiavon et al., 2012). The temperature gradient was found to be steeper
below 1 m height due to the positioning of air supply diffusers on the floor.
This distribution pattern is prone to change for other configurations of supply
and exhaust diffusers. It is expected that space temperature would be more
uniform for ceiling supply-ceiling exhaust distribution strategy of this design.
Ceiling cooling panel resulted in having mean radiant temperature 2 °C lower
than dry bulb temperature in the areas below the panel (Figure 52). The level of
difference between mean radiant and dry bulb temperature for the actual
implementation of DDOAS-RCP in buildings could vary based on cooling
panel coverage ratio and façade heat gain. Based on the Singapore standard of
SS 554, operative temperature can be defined as 𝑇𝑜 =𝑇+�̅�𝑟
2 for occupants with
metabolic rates between 1 and 1.3 met, not in direct sunlight and being exposed
to air velocities less than 0.2 m/s. The recommended operative temperature
based on this standard is within 24 to 26 °C.

170
The measured values on system components of DDOAS-RCP revealed
that radiant cooling panel satisfies about 20 to 30 % of space sensible load
(Figure 53). This percentage value is the key measure to evaluate the
effectiveness of this design strategy for tropical buildings. In the ideal scenario,
it is expected that HTC system provides the main part (≥ 50 %) of space
sensible cooling. This ideal scenario would result in more energy saving
compared to the conventional design since HTC can play a more significant
role in cooling of space and the required chilled water can be provided at
higher efficiency. LTC or the air based system is designated to mainly cover
the latent cooling and ventilation needs of space. These facts make this design
more suitable for spaces with high sensible load or sensible heat ratio. The
estimated SHR of the BubbleZERO was in the range of 0.5 to 0.6 (Figure 53)
from morning to afternoon which is close to typical cooling profile in
Singapore office buildings (Sekhar and Tan, 2009). Providing an airtight
façade is a prerequisite for implementation of high temperature cooling in the
tropical context to enhance the effectiveness of this design. The Singapore
standard of SS 212 (2007) provides a guideline for acceptable leakage rate of
windows on the envelope and doors opening to non-conditioned areas.
Improving uniformity level of radiant panel surface and increasing panel
coverage area in the space are other tactics for boosting the contribution of
radiant ceiling panel. Enhanced cost of system due to the increased piping and
metal sheet for radiant cooling panel is the main practical constraint for these
tactics. Elevated capacity of RCP means reduced air supply volume and it
requires less fan power for circulation.

171
The outcomes of the simple and multiple regression analyses showed that
input variables of system components have significant impacts on indoor air
conditions. These outcomes guide us in finding the best control strategies for
operation of DDOAS-RCP in actual implementation of this concept in tropical
buildings. Both LTCW and HTCW are modulated based on central chilled
water plant settings and operational conditions of the air-water system. This is
to ensure impactful cooling provided by decentralized units and radiant cooling
system without causing condensation on RCP. Modulating LTCW flow rate
and HTCW temperature could be the best feasible strategies for operation of
DDOAS-RCP under part load conditions. Effective and efficient
implementation of these control strategies in building requires real time
modulation of three-way control valves and pumps in hydraulic system. The
proposed hydraulic system design for implementation of high temperature
cooling has been detailed in Section 5.9.
5.4 Thermal comfort and indoor air quality
The conditioned laboratory with DDOAS-RCP was found to be compatible
with the local and whole space requirements of thermal comfort standards
(Figures 59 and 60). PMV values were in the acceptable range, although it has
not been fully accepted in the literature for estimation of locally acclimatized
occupants’ perception in tropical buildings. Low air movement in indoor space
was the only identified comfort deficiency which based on the Singapore
standards of SS 554, it should be in a certain range (0.1 – 0.3 m/s). Similar
observation has also been reported for application of radiant cooling systems in

172
the tropical context of Malaysia (Kwong et al., 2014; Yau and Hasbi, 2013).
The Malaysian standard of MS 1525 (2007) has the recommended air speed
range of 0.15 to 0.5 m/s for temperature in the range of 23 to 26 ˚C. This
problem can be addressed by using personalized fan on workstations to raise
air movement level near the occupants. Higher draft tolerance of locally
acclimatized occupants has been observed in a recent study for personally
controlled air movement scenarios (Schiavon et al., 2015). Sastry and Rumsey
(2014) provided ceiling fan in conjunction with radiant slab cooling and
achieved higher satisfaction among occupants compared to the all air system
for the tropical climate of Hyderabad in India. However, employing ceiling
fans to augment air movement could have consequences on ventilation
effectiveness indices and air quality at the breathing level.
The CO2 level in the conditioned space with DDOAS-RCP can be kept
well below the threshold of Singapore standards (700 ppm above ambient
level) with the ventilation rate in the range of 0.6 L/s/m2. On average basis,
carbon dioxide concentration was found to be uniform throughout the space.
However, there was temporal high level CO2 concentration near breathing
points of occupants. It was also observed that transient and steady state carbon
dioxide level in space is strongly correlated with occupancy schedule and
ventilation rate. These types of transitional CO2 concentrations are not
uncommon in actual buildings due to the chaotic nature of office activities and
occupants’ movements from one zone to another. Deploying CO2 sensors for
the spaces where there is high variation of occupancy level like in meeting
room could be a good strategy to enhance the performance of DDOAS-RCP. A
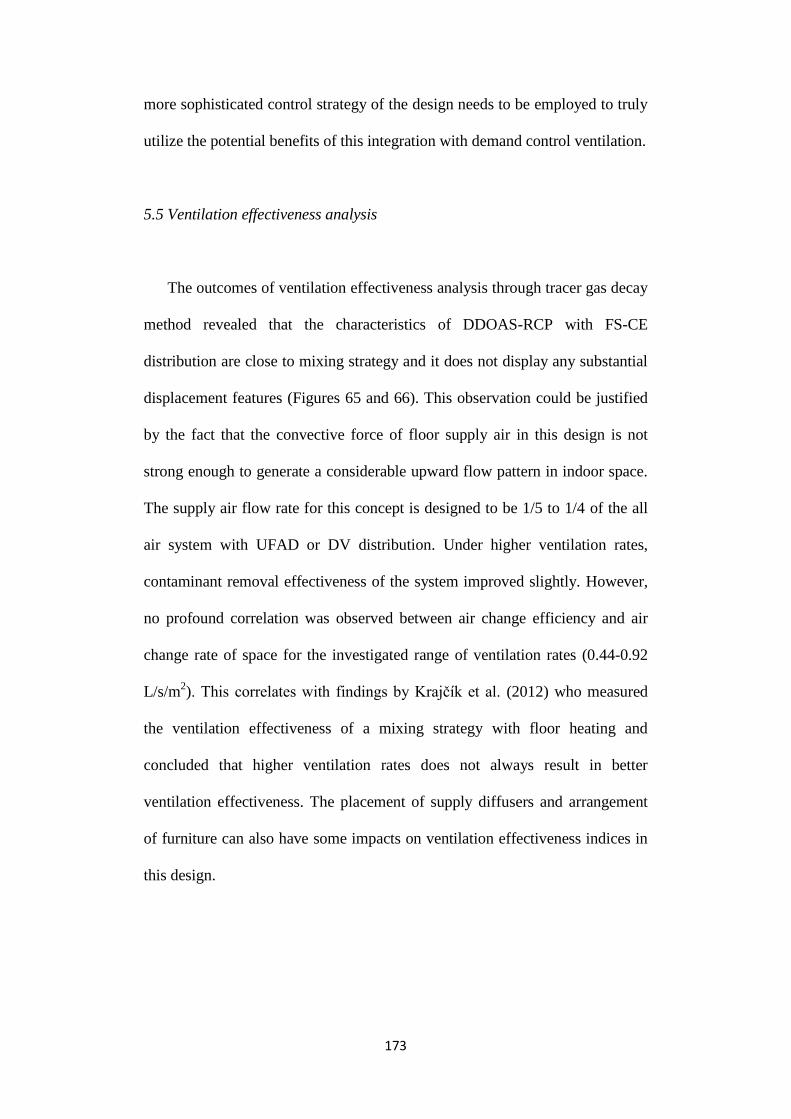
173
more sophisticated control strategy of the design needs to be employed to truly
utilize the potential benefits of this integration with demand control ventilation.
5.5 Ventilation effectiveness analysis
The outcomes of ventilation effectiveness analysis through tracer gas decay
method revealed that the characteristics of DDOAS-RCP with FS-CE
distribution are close to mixing strategy and it does not display any substantial
displacement features (Figures 65 and 66). This observation could be justified
by the fact that the convective force of floor supply air in this design is not
strong enough to generate a considerable upward flow pattern in indoor space.
The supply air flow rate for this concept is designed to be 1/5 to 1/4 of the all
air system with UFAD or DV distribution. Under higher ventilation rates,
contaminant removal effectiveness of the system improved slightly. However,
no profound correlation was observed between air change efficiency and air
change rate of space for the investigated range of ventilation rates (0.44-0.92
L/s/m2). This correlates with findings by Krajčík et al. (2012) who measured
the ventilation effectiveness of a mixing strategy with floor heating and
concluded that higher ventilation rates does not always result in better
ventilation effectiveness. The placement of supply diffusers and arrangement
of furniture can also have some impacts on ventilation effectiveness indices in
this design.

174
5.6 CFD simulations
CFD predictions were in close agreements with measured data and the
average error for the eleven sampling points was around 2 % (Table 15). It was
shown that mesh density and turbulence model do not play important roles on
accuracy of simulations for the current indoor air scenarios. Considering the
computation cost and convergence complexity of using more sophisticated
models and refined mesh, it can be recommended to use the standard k-ε model
with coarse mesh for general applications of such a system in buildings.
Nevertheless, these results cannot be generalized to all indoor air flow
scenarios like rooms with air jets where choosing right turbulence model and
refining mesh near inlets have more important impacts. More refined mesh
near boundary conditions is required if detailed flow pattern near occupants or
other heat sources is needed. In a similar CFD investigation, Zhang et al.
(2007) evaluated the performance of eight turbulence models in indoor air
simulations and they showed that all turbulence models provide good or
acceptable mean temperature and velocity predictions for mixed convections
flow regimes. In the current thesis, boundary conditions including air supply
condition and interior surface temperatures were set based on actual measured
data in the BubbleZERO which facilitated achieving a good level of accuracy
with experiments. Concurrent measurements of temperature at indoor air points
and interior surfaces are necessary for validation of CFD simulations in actual
buildings’ conditions where surfaces’ temperature change in the course of the
day.

175
It was also shown that air velocity is less than 0.1 m/s for most of the
locations in the BubbleZERO except near floor diffuser, exhaust points and
above the head of occupants (Figure 68). This low air speed may degrade the
comfort level of occupants in the tropics where occupants prefer higher air
movement as expressed by the Singapore standard of SS 554, which sets a
minimum velocity of 0.1 m/s (SS 554, 2009). The other finding was the cold
feet concern for occupants seated near diffusers where the air temperature is
around 18 °C in the case of supplied outdoor air at 13-14 °C. Nevertheless, the
amount of supply air for an air-water system like DDOAS-RCP is considerably
lower than that of the all air system with floor distribution and the cold feet
concern is less likely to be a serious issue. In the current design of the system
in the BubbleZERO, supply air is distributed over seven diffusers in the floor
and the amount of cool air coming from each diffuser is too small to have a
serious impact on comfort of occupants. The air velocity at floor diffuser point
does not exceed 0.3 m/s as can be seen in velocity contours of Figure 68. For
implementation of this concept in a real building, a practical consideration
raised from this observation is to distribute supply air uniformly over the floor
through using many diffusers.
The temperature distribution around human body revealed that buoyancy
flow forms around chest and it develops above the head of seated occupants
(Figures 70 and 71). This observation shows that there are some signs of
displacement ventilation strategy in the space where cool air warms by heat
sources like occupants and laptop and the generated warm plume rises up
toward the ceiling. However, buoyancy signs are only limited to areas near
occupants and there is no strong upward velocity directions in other locations.
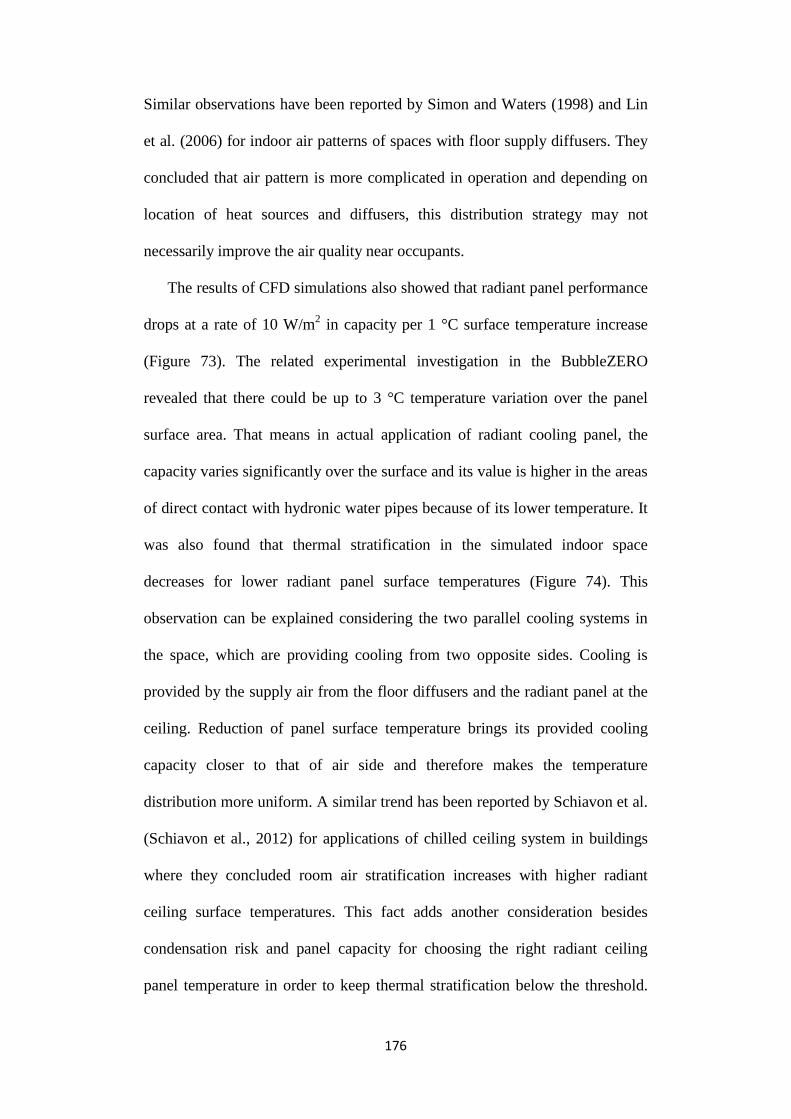
176
Similar observations have been reported by Simon and Waters (1998) and Lin
et al. (2006) for indoor air patterns of spaces with floor supply diffusers. They
concluded that air pattern is more complicated in operation and depending on
location of heat sources and diffusers, this distribution strategy may not
necessarily improve the air quality near occupants.
The results of CFD simulations also showed that radiant panel performance
drops at a rate of 10 W/m2 in capacity per 1 °C surface temperature increase
(Figure 73). The related experimental investigation in the BubbleZERO
revealed that there could be up to 3 °C temperature variation over the panel
surface area. That means in actual application of radiant cooling panel, the
capacity varies significantly over the surface and its value is higher in the areas
of direct contact with hydronic water pipes because of its lower temperature. It
was also found that thermal stratification in the simulated indoor space
decreases for lower radiant panel surface temperatures (Figure 74). This
observation can be explained considering the two parallel cooling systems in
the space, which are providing cooling from two opposite sides. Cooling is
provided by the supply air from the floor diffusers and the radiant panel at the
ceiling. Reduction of panel surface temperature brings its provided cooling
capacity closer to that of air side and therefore makes the temperature
distribution more uniform. A similar trend has been reported by Schiavon et al.
(Schiavon et al., 2012) for applications of chilled ceiling system in buildings
where they concluded room air stratification increases with higher radiant
ceiling surface temperatures. This fact adds another consideration besides
condensation risk and panel capacity for choosing the right radiant ceiling
panel temperature in order to keep thermal stratification below the threshold.

177
The analysis of radiant flux from human body revealed that increase in emitted
radiant flux due to the lower panel temperature is not uniform for all body
segments (Figure 75). The amount of increase is dependent on the view factor
of that body part toward radiant ceiling panel. For a seated occupant, head,
chest, hand and arm skins are more exposed to radiant cooling compared to
other body parts. Mustakallio et al. (2016) also determined manikin based
equivalent temperatures for different body segments of a seated thermal
manikin in an office environment with convective/radiant cooling systems.
Experimental results showed that the effect of radiant cooling could be clearly
seen for the upper body parts and locally on the front surface of the body.
Other design parameters which can influence the direct thermal interaction
between occupants and radiant panel include ceiling panel coverage ratio,
clothing level, location of occupants and furniture design.
5.7 Integration with low lift chillers
The reverse Carnot cycle for applications of high temperature cooling in
Singapore condition revealed that there is considerable potential for energy
saving through implementing this concept. However, the main challenge is it to
incorporate a custom designed chiller for low temperature lift condition to fully
utilize the benefits of HTC designs like DDOAS-RCP. The reported prototype
of low lift chillers in the literature (Wyssen et al., 2010) proved to be capable
of providing cooling at significantly higher efficiency for HTC scenarios
compared to LTC (Figures 76 and 77). Employing two separate chillers for
HTC and LTC could be a good strategy for implementation of DDOAS-RCP

178
design in tropical buildings. Nevertheless, this strategy could be advantageous
when the benefits of enhancement in COP of chiller for HTC system outweigh
the investment and operational costs of running two separate chillers for
DDOAS and RCP. There are also other considerations regarding the spatial
requirements and chilled water network in buildings which require further
investigation for implementing of this strategy.
5.8 Energy/Exergy saving potentials
The energy simulation showed that implementing an air-water system like
DDOAS-RCP instead of the all air VAV system would result in considerable
annual energy saving for a typical one-storey office building in Singapore. The
energy saving comes from reduction of fan energy use for circulation of air in
the building and enhanced operational efficiency of chiller. A significant level
of saving could be achieved for application of high temperature cooling when a
separate low temperature lift chiller has been designated for HTC system. The
level of energy saving for DDOAS-RCP when connected to the selected design
of low lift chiller (Wyssen et al., 2010) is estimated to be 10 % compared to the
based design of the all air system. This level of saving could be increased up to
18 %, if more effective HTC designs and façade characteristics are
implemented (Figure 80). In the current design of DDOAS-RCP in the
BubbleZERO, radiant cooling system satisfies up to 30 % of space cooling
load and there is opportunity to improve the contribution of radiant system.
Radiant ceiling panel could be redesigned with higher number of chilled water
passes to achieve higher cooling capacity and more uniform surface

179
temperature. A more airtight façade could also decrease the latent load of the
space and reduce the required dehumidification for the indoor space. This
change could potentially boost the contribution of radiant system for satisfying
the cooling load of space. It is noteworthy that having a separate low lift chiller
for HTC system and more effective radiant system would increase the
investment cost of this concept and overall benefits of these strategies need to
be evaluated in the context of added cost and saved energy.
5.9 Selected design/control strategy
The outcomes of experimental and numerical research in this thesis could
be used to introduce adequate and effective designs and control strategies for
application of high temperature cooling in the tropics. Two selected control
schemes of HTC including system components and chilled water pipelines are
shown in Figures 81 and 82. In the first selected design (Figure 81), only one
chiller is designated to provide low temperature chilled water (6 °C) for both
the air based and water based systems. Three-way control valves are to be used
to maintain the required chilled water temperature for HTC system through
modulating pressure in the hydraulic line. The level of energy saving for this
selected design strategy would be only limited to reduction of fan energy use
and the possibility of using energy recovery system. However, a more
significant energy saving could be acquired if the required high temperature
chilled water for HTC is to be provided through alternative strategies like a
separate low lift chiller. A custom designed chiller which operates at
considerably higher efficiency in low temperature lift conditions could be a
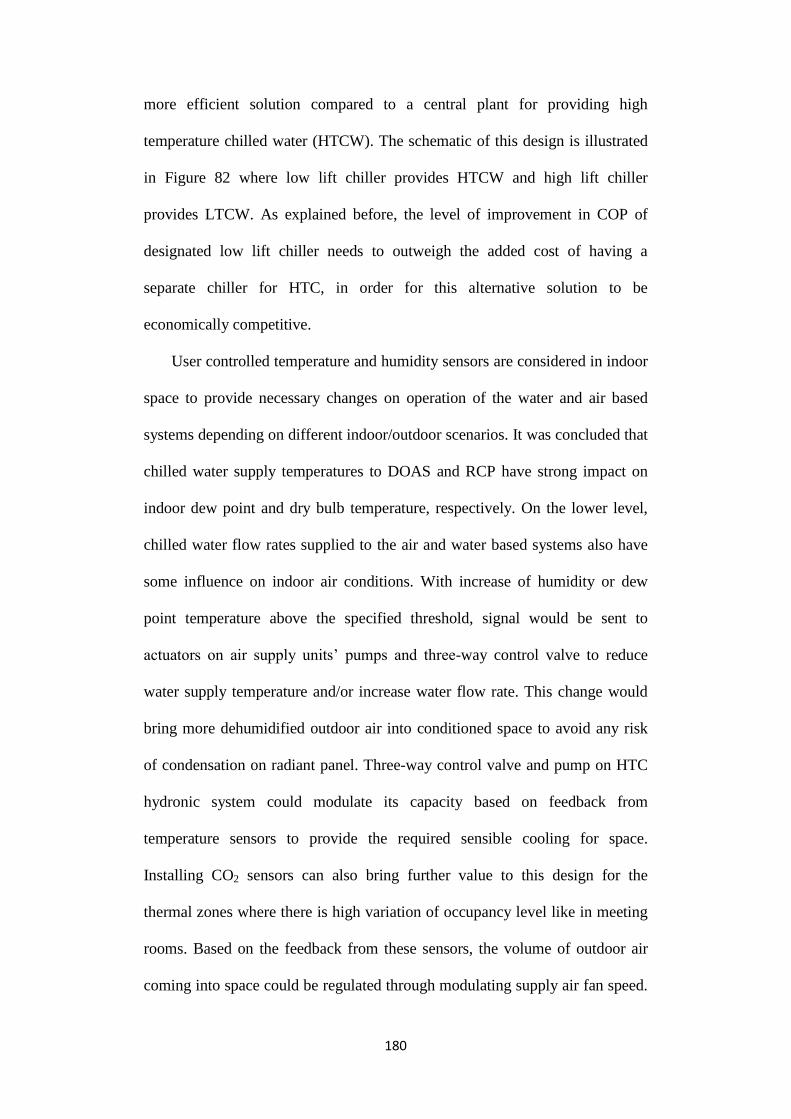
180
more efficient solution compared to a central plant for providing high
temperature chilled water (HTCW). The schematic of this design is illustrated
in Figure 82 where low lift chiller provides HTCW and high lift chiller
provides LTCW. As explained before, the level of improvement in COP of
designated low lift chiller needs to outweigh the added cost of having a
separate chiller for HTC, in order for this alternative solution to be
economically competitive.
User controlled temperature and humidity sensors are considered in indoor
space to provide necessary changes on operation of the water and air based
systems depending on different indoor/outdoor scenarios. It was concluded that
chilled water supply temperatures to DOAS and RCP have strong impact on
indoor dew point and dry bulb temperature, respectively. On the lower level,
chilled water flow rates supplied to the air and water based systems also have
some influence on indoor air conditions. With increase of humidity or dew
point temperature above the specified threshold, signal would be sent to
actuators on air supply units’ pumps and three-way control valve to reduce
water supply temperature and/or increase water flow rate. This change would
bring more dehumidified outdoor air into conditioned space to avoid any risk
of condensation on radiant panel. Three-way control valve and pump on HTC
hydronic system could modulate its capacity based on feedback from
temperature sensors to provide the required sensible cooling for space.
Installing CO2 sensors can also bring further value to this design for the
thermal zones where there is high variation of occupancy level like in meeting
rooms. Based on the feedback from these sensors, the volume of outdoor air
coming into space could be regulated through modulating supply air fan speed.

181
In these design strategies (Figures 81 and 82), an energy recovery system
(ERS) is also designated for DOAS to recuperate some part of cooling from
exhaust air stream. This ERS device could be an active/passive desiccant wheel
or a membrane based air to air heat exchanger which transfers heat and
humidity between two air streams. The high enthalpy difference between
indoor and outdoor condition in the tropical context would make ERS an
effective system for the applications of DOAS.
Figure 81 selected design and control strategies scheme for application of
high temperature cooling with one chiller
Temperature,
humidity and
CO2 sensors
EA
OA
SA RA
CHWR CHWS
ERS
HTC
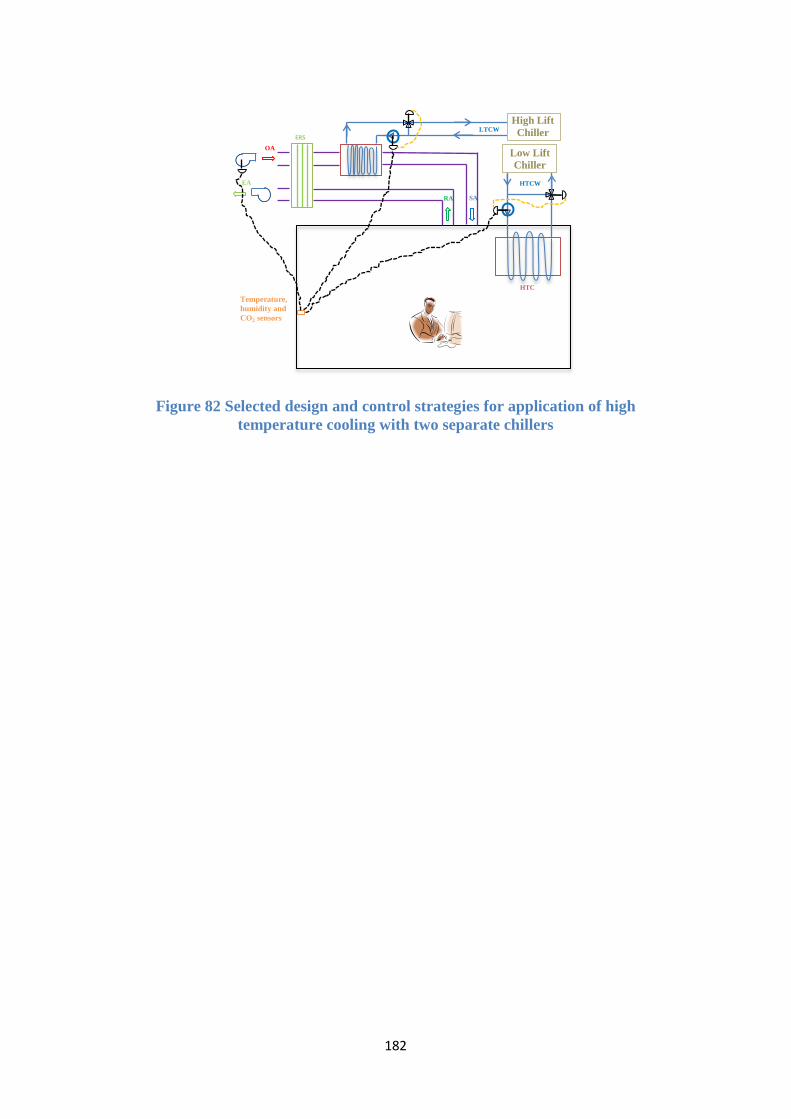
182
Figure 82 Selected design and control strategies for application of high
temperature cooling with two separate chillers
LTCW High Lift
Chiller
Low Lift
Chiller
HTCW
Temperature,
humidity and
CO2 sensors
EA
OA
SA RA
ERS
HTC
183
Chapter 6. Conclusions and future work
The main conclusions from the research are summarized and elaborated
separately in bullet points. In addition, recommendations are provided for
future work based on limitations of this study and some suggestions have been
made regarding the actual implementation of high temperature cooling in
tropical buildings.
6.1 Conclusions
The application of the low exergy cooling systems in tropical buildings
depicted as decentralized dedicated outdoor air system coupled with radiant
cooling has been explored in this thesis. The significance of this research is on
providing a better understanding for applications of high temperature cooling
in the tropics and identifying the most suitable control and operation strategies
for the actual implementation in buildings. Characterizing an indoor space
conditioned with the low exergy cooling systems in the tropics was one of the
objectives of this study. It has been shown that DDOAS-RCP can provide a
comfortable and healthy indoor environment for occupants in the tropics with
less destruction of exergy. The main part of hypothesis on performance
evaluation of the low exergy cooling system in terms of thermal comfort, air
quality and energy saving has been demonstrated. The levels of energy saving
and comfort perception of occupants in tropical building need to be further
explored through implementation of this design in actual buildings.

184
More sophisticated control and operation strategies compared to the all air
system need to be implemented in order to avoid condensation risk in the water
based system located inside the conditioned space. The selected control
schemes for operation of high temperature cooling in tropical buildings are
elaborated in Chapter 5 (Figures 81 and 82). This high temperature cooling
design provides a conditioned indoor space with lower mean radiant
temperature and air movement compared to that for the all air systems. Based
on thermal comfort model’s predictions, it is likely that occupants find this new
indoor space comfortable and acceptable. However, there have been reported
studies in the literature (Gong et al., 2006; Kwong et al., 2014) that locally
acclimatized occupants would prefer higher air movement. This deficiency of
the design could be rectified by using personal fans near workstations. It has
been shown in a recent study that locally acclimatized occupants in the tropics
have higher draft tolerance (Schiavon et al., 2015). Nevertheless, enhancing air
movement level in the space would have some impact on ventilation
effectiveness, IAQ and contaminant mixing level. Thermal stratification is
below the threshold with floor supply–ceiling exhaust distribution scheme of
DDOAS-RCP, although cold feet concern still exists near floor diffusers. In
addition, ventilation effectiveness indices of the design were found to be close
to that of mixing strategy. These observations are prone to change for other air
distribution configurations like ceiling supply – ceiling exhaust. Cold feet
concern would not be an issue in CS-CE distribution system and it is expected
that indoor flow pattern would be close to mixing strategy. Nevertheless,
supply and exhaust diffusers on the ceiling should be arranged in a way to
avoid short circuiting flow condition between diffusers.
185
The other objective of this research was to explore the contribution ratio of
the air and water systems in this coupled design. The contribution of radiant
cooling panel in satisfying the total cooling load of the BubbleZERO was
found to be between 20 to 30 %. It is recommended to improve air tightness
level of façade and enhance uniformity level of panel surface temperature in
order to increase the effectiveness of radiant ceiling panel. There are also
potentials for integrations of DDOAS-RCP with low temperature lift chillers,
although the efficiency of this separate chiller needs to meet some minimum
requirements in order to be economically competitive compared to the original
design. This study has advanced the technical knowledge required for effective
implementation of high temperature cooling in tropical buildings. The detailed
outcomes of this thesis can be summarized in the following points:
The arrangement of cooling coils inside the decentralized air supply
unit affects dehumidification capacity and off coil air condition of
unit. For the applications where cold feet near floor diffusers is a
concern, ceiling supply-ceiling exhaust air distribution strategies or
coil arrangements with some level of reheating function inside the
units are recommended.
It was concluded that with a two-pass pipe hydronic system behind
radiant cooling panel, there is up to 3 °C temperature variation on
panel surface. Non-uniformity level of temperature on panel surface
could be mitigated by increasing the number of chilled water passes
behind the panel.
For floor supply-ceiling exhaust distribution of DDOAS-RCP, there
is a two degree vertical thermal stratification in the space and the

186
temperature gradient is steeper below 1 m height level. This
conclusion could be generalized for all the applications of DDOAS-
RCP with similar operational ranges, air distribution strategy,
building configuration and load pattern.
In this high temperature cooling design, mean radiant temperature is
approximately two degree lower than dry bulb temperature for the
areas below the ceiling panel. However, this difference could be
negligible for some locations due to the exposure to warm radiation.
The capacity of radiant cooling system could be enhanced near
these locations to provide enough cooling for occupants.
For the current design specification of DDOAS-RCP, the
contribution of radiant cooling panel in satisfying the cooling load
of space ranges between 20 to 30 % from morning to afternoon. The
contribution of radiant system could be enhanced by employing a
more effective panel design and improving airtightness of façade.
There are significant correlations between indoor condition and
operational scenarios of system components which are required to
be considered for adequate control of this low exergy design under
different indoor/outdoor scenarios. .
Based on Fanger’s PMV model, indoor comfort condition is
achievable with this low exergy cooling system under different
indoor/outdoor scenarios. However, this comfort model has not
been fully accepted in the literature for prediction of occupants’
perception in the tropics.
187
Low air movement in the conditioned space has been identified as a
comfort deficiency for this design in the context of Singapore where
there is a minimum requirement for air movement level based on
the local standards.
For the coupled DDOAS-RCP concept, the ventilation rate of 0.44
L/s/m2 closely fulfills the criteria of CO2 concentration in the space
and at the rate of 0.64 L/s/m2, carbon dioxide level is well below the
threshold set by the local standards. Higher ventilation rate may be
required for increased occupancy level or other sources of
pollutants in the space.
On average basis, there is a uniform distribution of CO2
concentration throughout the space, although the variation of
concentration is considerably higher at locations near to occupants’
breathing point.
Ventilation effectiveness of DDOAS-RCP design with FS-CE
distribution is close to that of mixing strategy and there is no
significant difference for the range of investigated ventilation rates.
For the current operational condition of DDOAS-RCP, the air
temperature near floor diffusers is estimated to be around 18 °C.
This level of supply temperature requires distributing air uniformly
over the floor and raising supply air temperature in order to avoid
cold feet for occupants seated near diffusers. Ceiling supply-ceiling
exhaust distribution strategy could also be employed instead of
floor supply-ceiling exhaust to avoid this comfort concern.

188
Radiant capacity of cooling panel drops significantly at a rate of 10
W/m2 in capacity per 1 °C increase of panel surface temperature.
Considering the condensation risk on panels, the surface
temperature is recommended to be kept just above the indoor dew
point level in order to effectively employ radiant cooling system.
Reducing panel surface temperature increases panel contribution in
satisfying overall cooling load of space, which furthermore results
in a reduction of thermal stratification in the space. Similar
observations have been reported in the literature for the same
conditioning and distribution strategies in buildings.
Rising plume of warm air above the seated occupants shows that
there are some signs of displacement ventilation in the space.
However, this buoyancy flow pattern is only limited to areas near
occupants and there is no strong upward velocity directions in other
locations.
Radiant cooling from ceiling panel does not have uniform impact
for all body segments of a seated person working on a table. The
upper body parts including head, chest, hand and arm get more
direct influence from ceiling panel compared to lower body parts.
There is energy saving potential for integration of the low exergy
design with low temperature lift chillers. Nevertheless, the
efficiency of this custom designed chiller needs to be superior at
high temperature cooling applications in order to make this idea
financially attractive.

189
The results of energy simulation for a hypothetical one-storey
office building in Singapore showed that annual energy saving of
this low exergy design compared to the all air VAV system is 10 %
and with a more effective design strategy, the level of saving could
be increased up to 18 %.
6.2 Contributions to the body of knowledge
This PhD thesis has provided new insight into application and performance
of high temperature cooling system. It clearly introduced the main energy
saving potentials behind application of HTC system and tried to explore the
most effective design strategies and operational conditions to materialize those
benefits. The reported studies in the literature on the application of HTC fell
short in finding the missing connection between HTC system and chiller
design. This PhD thesis presented a comprehensive view on interdependence
function of HTC system and chiller operation in order to clarify the potential
energy saving of this concept. This study was also successful in providing more
refined and detailed information on operational conditions of radiant cooling
system and decentralized units in buildings. No study in the literature has
undertaken experimental investigations on these systems with this level of
details. In addition, CFD tool has been employed to further explore the
characteristics of an indoor space conditioned with radiant cooling system. This
numerical research went beyond investigating spatial distribution and flow
pattern which have been commonly reported in the literature. The validated
CFD model has been utilized to explore the performance of radiant ceiling
190
panel and its impact on different occupants’ body segments. The outcomes of
this PhD thesis have been used to introduce collections of system designs and
control strategies for effective implementation of high temperature cooling
system in the tropics. These outcomes could help other researchers to get a
better understanding on application of radiant cooling and it paves the way for
industry practitioners to implement this design into actual buildings.
6.3 Limitations and recommendations
This research has been conducted in a free standing laboratory located in
the outdoor space which may not truly represent the configuration of a typical
office space. The specific façade design and chiller capacity in this laboratory
make it moderately different compared to typical office spaces in high rise
commercial buildings. To overcome this limitation in future work, it is
suggested to conduct a side by side comparison between the low exergy and
conventional systems. This comparison of the air-water and the all air system
under similar façade design and building usage could reveal the real benefits
and disadvantages of high temperature cooling in tropical buildings. The
advantages and drawbacks of the proposed design compared to the
conventional all air system could be in terms of investment cost, energy usage
and the required maintenance service over the life cycle of the system. The
impacts of different control strategies on performance of HTC design and
system components could also be investigated as part of this implementation.
Some of the provided conclusions in this thesis are specific to the investigated
laboratory conditions and operational scenarios and an actual implementation
191
of this low exergy cooling system could provide more generalized conclusions.
In addition, the level of energy saving for application of high temperature
cooling has been estimated based on a simple energy simulation and available
data in the literature. A more elaborate and comprehensive energy simulation
tool can provide more accurate saving values for different building
configurations and applications. Annual energy saving of DDOAS-RCP
compared to the all air system could vary depending on cooling load pattern,
operational hours and number of floors.
In this research, Fanger’s PMV model has been employed to predict the
perception of occupants in the tropics toward the new conditioned indoor space
provided by the high temperature cooling system. However, it was shown by
several studies in the literature (Chen and Chang, 2012; Willem and Tham,
2007) that the PMV comfort model may not be able to fully capture the
perception and preference of locally acclimatized occupants in the tropical
context. An actual implementation of this low exergy cooling system in
building can bring the opportunity to conduct a subjective study with local
human subjects in the field. The outcomes of the proposed subjective test could
identify the difference between actual perception of occupants in building and
Fanger’s model.
Low air movement in DDOAS-RCP conditioned space has been identified
as a thermal comfort concern for locally acclimatized occupants. This issue
could be rectified by using personalized fans near workstations to provide
enough air movement near occupants and improve their comfort perceptions. It
was shown in the literature that locally acclimatized occupants in the tropics
have higher draft tolerance. The personalized fans could be mounted on chair

192
or desk near office occupants as chair mounted fans or desk mounted fans
which could enhance displacement flow around human body. Besides,
considering the level of improvement in comfort level and increase in fan
energy use, the impacts of this enhancement in air movement level on
ventilation effectiveness and contaminant distribution in the space are required
to be investigated. Future studies could explore the potential integration of the
high temperature cooling systems with personalized fans to improve the
comfort perception of local occupants in the tropics. This integration could be
investigated through field studies in an implemented case of radiant cooling
system or through numerical modelling of air flow on workstations.
The concept of DDOAS-RCP introduces a new type of air conditioned
spaces with lower air movement and mean radiant temperature compared to the
all air system. This change in indoor air condition has an impact on the type of
heat transfer mechanism between human body and surrounding. It was shown
through CFD simulation that there would be different level of increase in
radiative flux of body segments depending on their view factor to radiant
ceiling panel. Future work can further investigate the ratio of convective to
radiative heat transfer coefficients under various human body seating and
standing postures. The convective/radiative heat transfer coefficients of body
segments could be measured by using heat flux sensors on skins of real
subjects or thermal manikin located inside the conditioned space with the high
temperature cooling system.
For actual implementation of DDOAS-RCP or similar high temperature
cooling designs in tropical buildings, it is recommended to provide an air tight
façade and minimize the infiltration rate from façade. A uniform panel surface

193
temperature can enhance effectiveness of radiant cooling panel and reduce the
risk of condensation. In addition, employing energy recovery system can be an
effective strategy in DOAS to recover some part of cooling from exhaust air
streams into outdoor air. Regarding the distribution scheme of DDOAS-RCP, it
is advised to choose ceiling supply-ceiling exhaust instead of floor supply-
ceiling exhaust where no reheating is available to avoid cold feet concern. The
selected design and control strategies based on the outcomes of this thesis are
elaborated in the discussion chapter (Figures 81 and 82).

194
Bibliography
Alexander, D., O’Rourke, M., 2008. Design Considerations for Active Chilled Beams. ASHRAE J. 49, 50–58.
Andreasi, W.A., Lamberts, R., Cândido, C., 2010. Thermal acceptability assessment in buildings located in hot and humid regions in Brazil. Build. Environ. 45, 1225–1232. doi:10.1016/j.buildenv.2009.11.005
ASHRAE, 2008. ASHRAE Handbook: HVAC Systems and Equipment, SI Edition. American Society of Heating, Refrigerating and Air-Conditioning Engineers, Atlanta, USA.
ASHRAE 55, 2004. ANSI/ASHRAE Standard 55-2004: Thermal Environmental Conditions for Human Occupancy. American Society of Heating, Refrigerating and Air-Conditioning Engineers, Atlanta, USA.
ASHRAE 55-81, 1981. Thermal environment condition for human occupancy. American Society of Heating, Refrigerating and Air-Conditioning Engineers, Atlanta, USA.
ASHRAE 62, 2007. ANSI/ASHRAE Standard 62.1-2007: Ventilation for Acceptable Indoor Air Quality. American Society of Heating, Refrigerating and Air-Conditioning Engineers, Atlanta, USA.
ASHRAE 129, 2002. ANSI/ASHRAE Standard 129-1997 (RA 2002): Measuring Air-Change Effectiveness. American Society of Heating, Refrigerating and Air-Conditioning Engineers, Atlanta, USA.
ATTMA TS L2, 2010. Measuring air permeability of building envelopes (Non-Dwellings). The Air Tightness Testing & Measurement Association, Northampton, UK.
Awbi, H.B., 1998. Energy efficient room air distribution. Renew. Energy, Renewable Energy, Energy Efficiency, Policy and the Environment 15, 293–299. doi:10.1016/S0960-1481(98)00176-1
Baldini, L., Meggers, F., 2008. Advanced Distribution and Decentralized Supply: A Networked Approach for Minimum Pressure Losses and Maximum Comfort, in: Proceedings of Advanced Building Ventilation and Environmental Technology. Presented at the 29th AIVC Conference, Kyoto, Japan.
Bearg, D.W., 1993. Indoor Air Quality and HVAC Systems. CRC Press, Lewis Publishers, Boca Raton, FL, USA.
Bolashikov, Z., Mustakallio, P., Kolencikova, S., Kostov, K., Melikov, A.K., Kosonen, R., 2013. Thermal Conditions in a Simulated Office Environment with Convective and Radiant Cooling Systems, in: 11th REHVA World Congress and the 8th International Conference on Indoor Air Quality, Ventilation and Energy Conservation in Building (Clima). Prague, Czech Republic.
Bruelisauer, M., Chen, K., Iyengar, R., Leibundgut, H., Li, C., Li, M., Mast, M., Meggers, F., Miller, C., Rossi, D., Saber, E.M., Schlueter, A., Tham, K.W., 2013. BubbleZERO—Design, Construction and Operation of a Transportable Research Laboratory for Low Exergy Building System Evaluation in the Tropics. Energies 6, 4551–4571. doi:10.3390/en6094551
Bruelisauer, M., Meggers, F., Saber, E., Li, C., Leibundgut, H., 2014. Stuck in a stack—Temperature measurements of the microclimate around split type condensing units in a high rise building in Singapore. Energy Build. 71, 28–37. doi:10.1016/j.enbuild.2013.11.056

195
Bulińska, A., Popiołek, Z., Buliński, Z., 2014. Experimentally validated CFD analysis on sampling region determination of average indoor carbon dioxide concentration in occupied space. Build. Environ. 72, 319–331. doi:10.1016/j.buildenv.2013.11.001
Busch, J.F., 1992. A tale of two populations: thermal comfort in air-conditioned and naturally ventilated offices in Thailand. Energy Build. 18, 235–249. doi:10.1016/0378-7788(92)90016-A
Catalina, T., Virgone, J., Kuznik, F., 2009. Evaluation of thermal comfort using combined CFD and experimentation study in a test room equipped with a cooling ceiling. Build. Environ. 44, 1740–1750. doi:10.1016/j.buildenv.2008.11.015
Chen, A., Chang, V.W.-C., 2012. Human health and thermal comfort of office workers in Singapore. Build. Environ. 58, 172–178. doi:10.1016/j.buildenv.2012.07.004
Chen, Q., 1995. Comparison of different k-ε models for indoor air flow computations. Numer. Heat Transf. Part B Fundam. Int. J. Comput. Methodol. 28, 353–369.
Chiang, W.-H., Wang, C.-Y., Huang, J.-S., 2012. Evaluation of cooling ceiling and mechanical ventilation systems on thermal comfort using CFD study in an office for subtropical region. Build. Environ. 48, 113–127. doi:10.1016/j.buildenv.2011.09.002
Dalewski, M., Melikov, A.K., Vesely, M., 2014. Performance of ductless personalized ventilation in conjunction with displacement ventilation: Physical environment and human response. Build. Environ. 81, 354–364. doi:10.1016/j.buildenv.2014.07.011
de Dear, R.J., Akimoto, T., Arens, E.A., Brager, G., Candido, C., Cheong, K.W.D., Li, B., Nishihara, N., Sekhar, S.C., Tanabe, S., Toftum, J., Zhang, H., Zhu, Y., 2013. Progress in thermal comfort research over the last twenty years. Indoor Air 23, 442–461. doi:10.1111/ina.12046
de Dear, R.J., Leow, K.G., 1990. Indoor climate and thermal comfort in high-rise public housing in an equatorial climate: A field-study in Singapore. Atmospheric Environ. Part B Urban Atmosphere 24, 313–320. doi:10.1016/0957-1272(90)90037-U
De Dear, R.J., Leow, K.G., Foo, S.C., 1991. Thermal comfort in the humid tropics: Field experiments in air conditioned and naturally ventilated buildings in Singapore. Int. J. Biometeorol. 34, 259–265.
Dieckmann, J., Roth, K., Brodrick, J., 2004. Radiant ceiling cooling. ASHRAE J. 46, 42–42.
Doyon, T., 2008. Chiller Design For Low-Lift Conditions. Air Cond. Heat. Refrig. News 234, 13–15.
Emmerich, S.J., Persily, A.K., 1997. Literature review on CO2-based demand-controlled ventilation,. ASHRAE Trans. 103, 229–243.
Feng, J. (Dove), Schiavon, S., Bauman, F., 2013. Cooling load differences between radiant and air systems. Energy Build. 65, 310–321. doi:10.1016/j.enbuild.2013.06.009
Gan, G., 1995. Evaluation of room air distribution systems using computational fluid dynamics. Energy Build. 23, 83–93. doi:10.1016/0378-7788(95)00931-0
Gao, N., Niu, J., 2004. CFD study on micro-environment around human body and personalized ventilation. Build. Environ. 39, 795–805.

196
Gong, N., Tham, K.W., Melikov, A.K., Wyon, D.P., Sekhar, S.C., Cheong, K.W., 2006. The Acceptable Air Velocity Range for Local Air Movement in The Tropics. HVACR Res. 12, 1065–1076. doi:10.1080/10789669.2006.10391451
Han, J., Zhang, G., Zhang, Q., Zhang, J., Liu, J., Tian, L., Zheng, C., Hao, J., Lin, J., Liu, Y., Moschandreas, D.J., 2007. Field study on occupants’ thermal comfort and residential thermal environment in a hot-humid climate of China. Build. Environ. 42, 4043–4050. doi:10.1016/j.buildenv.2006.06.028
Hayashi, T., Ishizu, Y., Kato, S., Murakami, S., 2002. CFD analysis on characteristics of contaminated indoor air ventilation and its application in the evaluation of the effects of contaminant inhalation by a human occupant. Build. Environ. 37, 219–230. doi:10.1016/S0360-1323(01)00029-4
Hoyt, T., Lee, K.H., Zhang, H., Arens, E., Webster, T., 2009. Energy savings from extended air temperature setpoints and reductions in room air mixing, in: 13th International Conference on Environmental Ergonomics. Boston, MA, USA.
Huang, S.-M., Zhang, L.-Z., 2013. Researches and trends in membrane-based liquid desiccant air dehumidification. Renew. Sustain. Energy Rev. 28, 425–440. doi:10.1016/j.rser.2013.08.005
IEA, 2013. CO2 emissions from fuel combustion IEA Statistics International Energy Agency highlights (IEA Statistics). International Energy Agency, Paris, France.
IEA ECBCS Annex 28, 2000. Low Energy Cooling Systems (Technical Synthesis Report). International Energy Agency, Coventry, UK.
IEA ECBCS Annex 37, 2003. Low Exergy Systems for Heating and Cooling Buildings - Guidebook. VTT Technical Research Centre of Finland, Helsinki, Finland.
Indraganti, M., Ooka, R., Rijal, H.B., Brager, G.S., 2014. Adaptive model of thermal comfort for offices in hot and humid climates of India. Build. Environ. 74, 39–53. doi:10.1016/j.buildenv.2014.01.002
IPCC, 2007. Climate change mitigation in the buildings sector: the findings of the 4th Assessment Report of the IPCC. Intergovernmental Panel for Climate Change, New York, USA.
ISO 7730, 2005. Ergonomics of the thermal environment -- Analytical determination and interpretation of thermal comfort using calculation of the PMV and PPD indices and local thermal comfort criteria. International Organization for Standardization, Geneva, Switzerland.
Iyengar, R.S., Saber, E., Meggers, F., Leibundgut, H., 2013. The feasibility of performing high-temperature radiant cooling in tropical buildings when coupled with a decentralized ventilation system. HVACR Res. 19, 992–1000. doi:10.1080/10789669.2013.826065
Jia, J., Lee, W., 2014. Energy performance and condensation risk of DCDV system in subtropical Hong Kong. Trans. Tianjin Univ. 20, 42–47. doi:10.1007/s12209-014-2092-2
Khan, Y., Khare, V.R., Mathur, J., Bhandari, M., 2015. Performance evaluation of radiant cooling system integrated with air system under different operational strategies. Energy Build. 97, 118–128. doi:10.1016/j.enbuild.2015.03.030
Kosonen, R., Tan, F., 2005. A feasibility study of a ventilated beam system in the hot and humid climate: a case-study approach. Build. Environ. 40, 1164–1173. doi:10.1016/j.buildenv.2004.11.006
Krajčík, M., Simone, A., Olesen, B.W., 2012. Air distribution and ventilation effectiveness in an occupied room heated by warm air. Energy Build., Cool

197
Roofs, Cool Pavements, Cool Cities, and Cool World 55, 94–101. doi:10.1016/j.enbuild.2012.08.015
Kwong, Q.J., Arsad, M.A., Adam, N.M., 2014. Evaluation of Indoor Thermal Environment in a Radiant-Cooled-Floor Office Building in Malaysia. Appl. Mech. Mater. 564, 228–233. doi:10.4028/www.scientific.net/AMM.564.228
Leite, B.C.C., Tribess, A., 2006. Analysis of Thermal Comfort in an Office Environment with Underfloor Air Supply in a Tropical Climate. HVACampR Res. 12, 215–229. doi:10.1080/10789669.2006.10391176
Li, Y., Nielsen, P.V., 2011. CFD and ventilation research. Indoor Air 21, 442–453. doi:10.1111/j.1600-0668.2011.00723.x
Lin, Z., Jiang, F., Chow, T.T., Tsang, C.F., Lu, W.Z., 2006. CFD analysis of ventilation effectiveness in a public transport interchange. Build. Environ. 41, 254–261. doi:10.1016/j.buildenv.2005.02.011
Lipczynska, A., Kaczmarczyk, J., Melikov, A.K., 2015. Thermal environment and air quality in office with personalized ventilation combined with chilled ceiling. Build. Environ. 92, 603–614. doi:10.1016/j.buildenv.2015.05.035
Martinho, N., Lopes, A., Gameiro da Silva, M., 2012. Evaluation of errors on the CFD computation of air flow and heat transfer around the human body. Build. Environ. 58, 58–69. doi:10.1016/j.buildenv.2012.06.018
Meggers, F., Pantelic, J., Baldini, L., Saber, E.M., Kim, M.K., 2013. Evaluating and adapting low exergy systems with decentralized ventilation for tropical climates. Energy Build. 67, 559–567. doi:10.1016/j.enbuild.2013.08.015
Meggers, F., Ritter, V., Goffin, P., Baetschmann, M., Leibundgut, H., 2012. Low exergy building systems implementation. Energy 41, 48–55. doi:10.1016/j.energy.2011.07.031
Melikov, A.K., Krejciríková, B., Kaczmarczyk, J., Duszyk, M., Sakoi, T., 2013. Human response to local convective and radiant cooling in a warm environment. HVACR Res. 19, 1023–1032. doi:10.1080/10789669.2013.842734
Melikov, A.K., Skwarczynski, M.A., Kaczmarczyk, J., Zabecky, J., 2013. Use of personalized ventilation for improving health, comfort, and performance at high room temperature and humidity. Indoor Air 23, 250–263. doi:10.1111/ina.12012
Menter, F.R., 1994. Two-equation eddy-viscosity turbulence models for engineering applications. AIAA J. 32.
MS 1525, 2007. Code of Practice on Energy Efficiency and Use of Renewable Energy for Non-Residential Buildings. Department of Standards Malaysia, Putrajaya, Malaysia.
Mumma, S.A., 2002. Chilled Ceilings in Parallel with Dedicated Outdoor Air Systems: Addressing the Concerns of Condensation, Capacity, and Cost. ASHRAE Trans. 108, 220–231.
Mumma, S.A., 2001. Condensation issues with radiant cooling panels. ASHRAE IAQ Appl. 1–3.
Munters Co., 2009. School application guideline. Munters Corporation, Kista, Sweden.
Mustakallio, P., Bolashikov, Z., Kostov, K., Melikov, A., Kosonen, R., 2016. Thermal environment in simulated offices with convective and radiant cooling systems under cooling (summer) mode of operation. Build. Environ. 100, 82–91. doi:10.1016/j.buildenv.2016.02.001
NCCS, NRF, 2011. Air-con system efficiency primer: a Summary (National Climate Change Secretariat & National Research Foundation). Prime Minister’s Office, Republic of Singapore, Singapore.

198
Novoselac, A., Srebric, J., 2002. A critical review on the performance and design of combined cooled ceiling and displacement ventilation systems. Energy Build. 34, 497–509. doi:10.1016/S0378-7788(01)00134-7
Ole Fanger, P., Toftum, J., 2002. Extension of the PMV model to non-air-conditioned buildings in warm climates. Energy Build. 34, 533–536. doi:10.1016/S0378-7788(02)00003-8
Olesen, B.W., 2008. Radiant Floor Cooling Systems. ASHRAE J. 50, 16–22. OpenFOAM Foundation, 2014a. OpenFOAM: The Open Source CFD Toolbox User
Guide. OpenFOAM Foundation. OpenFOAM Foundation, 2014b. OpenFOAM: The Open Source CFD Toolbox
Programmers Guide. OpenFOAM Foundation. Panagopoulos, I.K., Karayannis, A.N., Kassomenos, P., Aravossis, K., 2011. A CFD
Simulation Study of VOC and Formaldehyde Indoor Air Pollution Dispersion in an Apartment as Part of an Indoor Pollution Management Plan. Aerosol Air Qual. Res. 11, 758–762. doi:10.4209/aaqr.2010.11.0092
Pantelic, J., Sze-To, G.N., Tham, K.W., Chao, C.Y.H., Khoo, Y.C.M., 2009. Personalized ventilation as a control measure for airborne transmissible disease spread. J. R. Soc. Interface 6, S715–S726.
Peel, M.C., Finlayson, B.L., McMahon, T.A., 2007. Updated world map of the Köppen-Geiger climate classification. Hydrol Earth Syst Sci 11, 1633–1644. doi:10.5194/hess-11-1633-2007
REHVA Guidebooks No. 2, 2004. Ventilation Effectiveness. Federation of European Heating, Ventilation and Air Conditioning Associations, Forssa, Finland.
REHVA Guidebooks No. 10, 2007. Computational Fluid Dynamics in Ventilation Design. Federation of European Heating, Ventilation and Air Conditioning Associations, Forssa, Finland.
Rim, D., Novoselac, A., 2009. Transport of particulate and gaseous pollutants in the vicinity of a human body. Build. Environ. 44, 1840–1849. doi:10.1016/j.buildenv.2008.12.009
Rumsey, P., Weale, J., 2007. Chilled Beams in Labs Eliminating Reheat & Saving Energy on a Budget. ASHRAE J. 49, 18–25.
Sastry, G., Rumsey, P., 2014. VAV vs. Radiant Side-by-Side Comparison. ASHRAE J. 56, 16–24.
Schiavon, S., Bauman, F., Tully, B., Rimmer, J., 2012. Room air stratification in combined chilled ceiling and displacement ventilation systems. HVACR Res. 18, 147–159. doi:10.1080/10789669.2011.592105
Schiavon, S., Melikov, A.K., Sekhar, C., 2010. Energy analysis of the personalized ventilation system in hot and humid climates. Energy Build. 42, 699–707. doi:10.1016/j.enbuild.2009.11.009
Schiavon, S., Yang, B., Chang, W.-C., Nazaroff, W., 2015. Effect of air temperature and air movement on thermal comfort for tropically acclimatized persons. Presented at the the 3th International Conference on Building Energy and Environment (COBEE 2015), Tianjin, China.
Schmidt, D., 2009. Low exergy systems for high-performance buildings and communities. Energy Build. 41, 331–336. doi:10.1016/j.enbuild.2008.10.005
Sekhar, C., Tham, K.W., Cheong, D.K.W., Wong, N.H., 2006. Single-coil twin-fan variable-air-volume (VAV) system for energy-efficient conditioning of independent fresh and return air streams.
Sekhar, S.C., Ching, C.S., 2002. Indoor air quality and thermal comfort studies of an under-floor air-conditioning system in the tropics. Energy Build. 34, 431–444. doi:10.1016/S0378-7788(01)00128-1

199
Sekhar, S.C., Tan, L.T., 2009. Optimization of cooling coil performance during operation stages for improved humidity control. Energy Build. 41, 229–233. doi:10.1016/j.enbuild.2008.09.005
Sekhar, S.C., Yang, B., Tham, K.W., Cheong, D.K.W., 2007. IAQ and Energy Performance of the newly developed Single Coil Twin Fan air-conditioning and air distribution system – Results of a Field Trial, in: Proceedings of Clima. Presented at the Proceedings of Clima 2007 WellBeing Indoors, Helsinki, Finland.
Shirey, D.B., Henderson, H.I., 2004. Dehumidification at part load. ASHRAE J. 46, 42–47.
Siddiqui, M., Jayanti, S., Swaminathan, T., 2012. CFD analysis of dense gas dispersion in indoor environment for risk assessment and risk mitigation. J. Hazard. Mater. 209–210, 177–185. doi:10.1016/j.jhazmat.2012.01.007
Siegel, R., Howell, J.R., 1992. Thermal Radiation Heat Transfer. Hemisphere Publishing Corporation, Washington DC, USA.
Simons, M.W., Waters, J.R., 1998. Local ventilation effectiveness parameters in air distribution system design. Build. Serv. Eng. Res. Technol. 19, 135–140. doi:10.1177/014362449801900304
Šmíd, M., 1977. Ergonomické parametry. Praha : Státní nakladatelství technické literatury.
Sørensen, D.N., Voigt, L.K., 2003. Modelling flow and heat transfer around a seated human body by computational fluid dynamics. Build. Environ. 38, 753–762. doi:10.1016/S0360-1323(03)00027-1
SS 212, 2007. Specification for aluminium alloy windows. SPRING Singapore, Singapore.
SS 553, 2009. Code of practice for air-conditioning and mechanical ventilation in buildings. SPRING Singapore, Singapore.
SS 554, 2009. Code of practice for indoor air quality for air-conditioned buildings. SPRING Singapore, Singapore.
Tan, W., 2011. Practical research methods, Fourth edition. ed. Pearson Custom Publishing, Singapore.
Tian, Z., Love, J.A., 2009. Application of radiant cooling in different climates: assessment of office buildings through simulation, in: 11th International IBPSA Conference. Glasgow, Scotland.
Tolga Balta, M., Kalinci, Y., Hepbasli, A., 2008. Evaluating a low exergy heating system from the power plant through the heat pump to the building envelope. Energy Build. 40, 1799–1804. doi:10.1016/j.enbuild.2008.03.008
Tomasi, R., Krajčík, M., Simone, A., Olesen, B.W., 2013. Experimental evaluation of air distribution in mechanically ventilated residential rooms: Thermal comfort and ventilation effectiveness. Energy Build. 60, 28–37. doi:10.1016/j.enbuild.2013.01.003
van Dronkelaar, C., Cóstola, D., Mangkuto, R.A., Hensen, J.L.M., 2014. Heating and cooling energy demand in underground buildings: Potential for saving in various climates and functions. Energy Build. 71, 129–136. doi:10.1016/j.enbuild.2013.12.004
Vangtook, P., Chirarattananon, S., 2007. Application of radiant cooling as a passive cooling option in hot humid climate. Build. Environ. 42, 543–556. doi:10.1016/j.buildenv.2005.09.014
Wang, W., Tian, Z., 2013. Indoor thermal comfort research on the hybrid system of radiant cooling and dedicated outdoor air system. Front. Energy 7, 155–160. doi:10.1007/s11708-013-0244-z
200
WeatherSpark, 2015. Weather Graphs and Maps - WeatherSpark [WWW Document]. URL https://weatherspark.com/ (accessed 11.24.15).
Willem, H.C., Tham, K.W., 2007. Associations between thermal perception and physiological indicators under moderate thermal stress, in: 6th International Conference on Indoor Air Quality, Ventilation and Energy Conservation in Buildings: Sustainable Built Environment. Sendai, Japan.
Wong, N.., Feriadi, H., Lim, P.., Tham, K.., Sekhar, C., Cheong, K.., 2002. Thermal comfort evaluation of naturally ventilated public housing in Singapore. Build. Environ. 37, 1267–1277. doi:10.1016/S0360-1323(01)00103-2
Wyssen, I., Gasser, L., Wellig, B., Meier, M., 2010. Chiller with small temperature lift for efficient building cooling, in: Proc. Clima. Antalya, Turkey.
Yang, F., 2008. Progress in Applied Mathematical Modeling. Nova Publishers, New York, USA.
Yang, T., Cropper, P.C., Cook, M., Yousaf, R., Fiala, D., 2007. A new simulation system to predict human-environment thermal interactions in naturally ventilated buildings. Presented at the Building Simulation, Beijing, China.
Yao, Y., Lian, Z., Liu, W., Shen, Q., 2007. Experimental Study on Skin Temperature and Thermal Comfort of the Human Body in a Recumbent Posture under Uniform Thermal Environments. Indoor Built Environ. 16, 505–518. doi:10.1177/1420326X07084291
Yau, Y.H., Hasbi, S., 2013. Field analysis of indoor air quality in high rise and low rise green offices with radiant slab cooling systems in Malaysia. Indoor Built Environ. 24, 174–184. doi:10.1177/1420326X13506130
Yousaf, R., Wood, D., Cook, M., Yang, T., Hodder, S., Loveday, D., Passmore, M., 2011. CFD and PIV based investigation of indoor air flows dominated by buoyancy effects generated by human occupancy and equipment, in: 12th Conference of International Building Performance Simulation Association. Presented at the Building Simulation, Sydney, Australia.
Zhang, Z., Zhang, W., Zhai, Z.J., Chen, Q.Y., 2007. Evaluation of Various Turbulence Models in Predicting Airflow and Turbulence in Enclosed Environments by CFD: Part 2—Comparison with Experimental Data from Literature. HVACR Res. 13, 871–886.
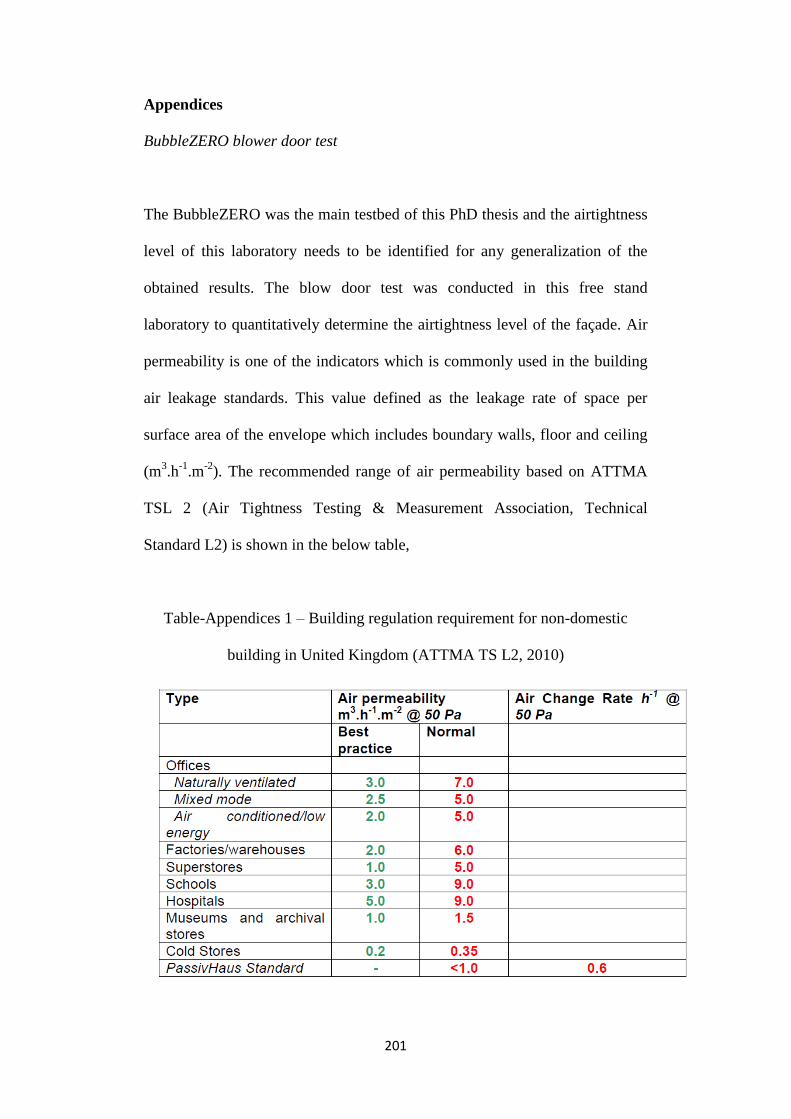
201
Appendices
BubbleZERO blower door test
The BubbleZERO was the main testbed of this PhD thesis and the airtightness
level of this laboratory needs to be identified for any generalization of the
obtained results. The blow door test was conducted in this free stand
laboratory to quantitatively determine the airtightness level of the façade. Air
permeability is one of the indicators which is commonly used in the building
air leakage standards. This value defined as the leakage rate of space per
surface area of the envelope which includes boundary walls, floor and ceiling
(m3.h
-1.m
-2). The recommended range of air permeability based on ATTMA
TSL 2 (Air Tightness Testing & Measurement Association, Technical
Standard L2) is shown in the below table,
Table-Appendices 1 – Building regulation requirement for non-domestic
building in United Kingdom (ATTMA TS L2, 2010)

202
The air permeability of the BubbleZERO based on the results of the conducted
blower door test is estimated to be 1.9 m3.h
-1.m
-2 (leakage rate: 63.65 L/s @ 50
Pa, Envelope ≈ 120 m2). Based on the recommended range in the above
Table, this value is close to the best practice façade of office space with air
conditioned / low energy settings. This result shows that the airtightness of the
BubbleZERO façade was in the acceptable range. The details of the conducted
blower door test in the BubbleZERO are shown in the following pictures.

203

204
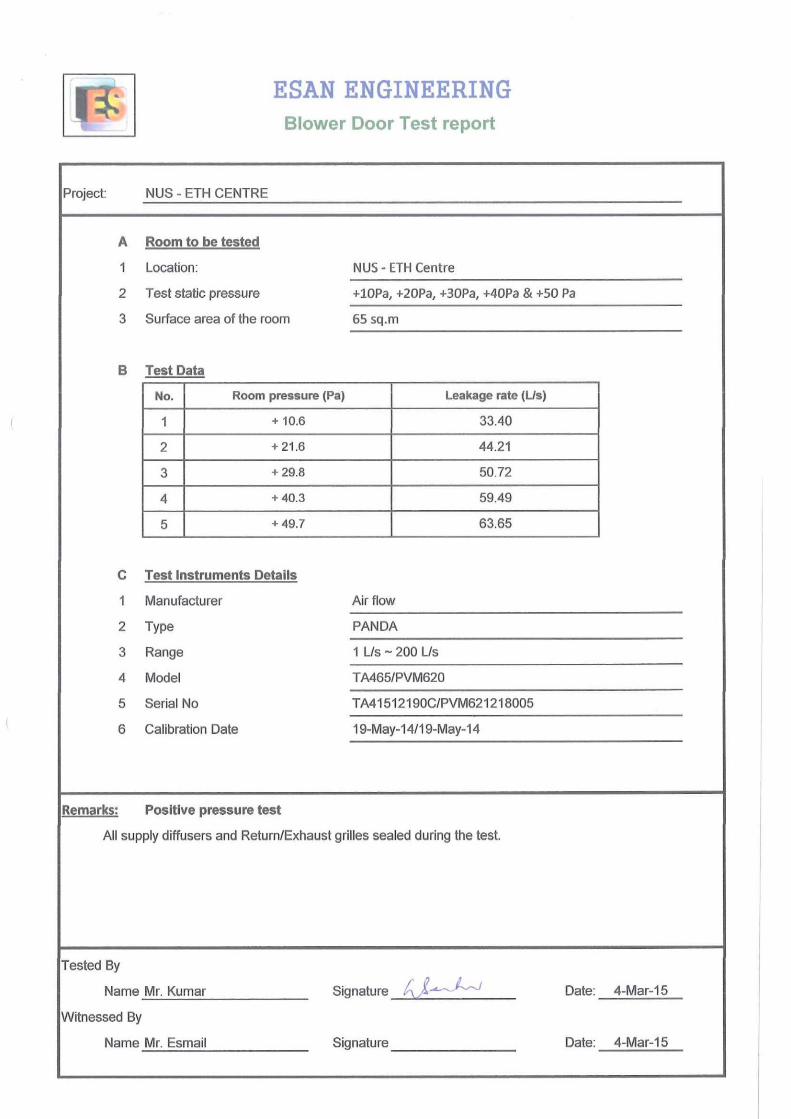
205

206

207

208
Scientific publications from the PhD thesis
Saber, E., Meggers, F. and Iyengar, R. (2013) The potential of low exergy
building systems in the tropics - Prototype evaluation from the BubbleZERO in
Singapore. In: Proceedings of Clima 2013: Energy efficient, smart and healthy
buildings, Prague, Czech Republic. (Saber et al., 2013)
Saber, E., Mast, M., Tham, K.W. and Leibundgut, H. (2014) Numerical
Modelling of an Indoor Space Conditioned with Low Exergy Cooling
Technologies in the Tropics. In: 13th International Conference on Indoor Air
Quality and Climate, Hong Kong. (E. Saber et al., 2014)
Saber, E.M., Iyengar, R., Mast, M., Meggers, F., Tham, K.W. and Leibundgut,
H. (2014) Thermal comfort and IAQ analysis of a decentralized DOAS system
coupled with radiant cooling for the tropics, Building and Environment, 82,
361–370. (E. M. Saber et al., 2014)
Saber, E.M., Mast, M., Tham, K.W. and Leibundgut, H. (2015)
Ventilation effectiveness and contaminant distribution in an occupied space
conditioned with low exergy ventilation technologies in the tropics, Healthy
Buildings 2015 Conference, Eindhoven, Netherlands. (Saber et al., 2015)
Saber, E.M., Tham, K.W. and Leibundgut, H. (2016) A review of high
temperature cooling systems in tropical buildings, Building and Environment,
96, 237–249. (Saber et al., 2016)
Saber, E.M. (2015) Green Cooling Systems in the Tropical Buildings,
ASHRAE Singapore Chapter Magazine, 76–77. (Saber, 2015)

209