performance evluation of biosignal ring … · performance evluation of biosignal ring for...
TRANSCRIPT
A report on
PERFORMANCE EVLUATION OF BIOSIGNAL RING FOR REDUCTION OF
POLLUTION LEVEL IN DIESEL AND PETROL ENGINES
submitted in the partial fulfilment of the requirement for the award of degree of
BACHELOR OF TECHNOLOGY
(Environmental Engineering)
by
ANKIT JAIN (2K14/EN/007)
RACHIT KRISHNA (2K14/EN/041)
SURBHI JAIN (2K14/EN/056)
TEJASVINI AHUJA (2K14/EN/057)
YUKTI SHARMA (2K14/EN/062)
NIDHI PATHAK (2K15/EN/501)
under supervision of
DR. S.K.SINGH

DEPARTMENT ENVIRONMENTAL ENGINEERING
DELHI TECHNOLOGICAL UNIVERSITY
2016-17

ii
Acknowledgement
This project would not have been possible without the kind support and help of many individuals and organizations, we would like to extend our sincerest thanks to all of them.
We are highly indebted to Prof. S. K. Singh for his guidance and constant supervision as well as for providing necessary information regarding the project & also for his support in completing the project.
We would also like to extend our gratitude towards Mr. Manoj from biodiesel Lab for his continuous support and helping us work in the biodiesel laboratory. Further, it would not have been possible without the efforts of Mr. Sunil to complete this project. He provided us great insights into the project and helped us in completion of the project.
We express our profound gratitude towards all of them.
Certificate
This is to certify ANKIT JAIN, RACHIT KRISHNA, SURBHI JAIN, TEJASVINI AHUJA, YUKTI SHARMA AND NIDHI PATHAK, B. Tech. students in the Department of
Environmental Engineering has submitted a project report on “PERFORMANCE EVLUATION OF BIOSIGNAL RING FOR REDUCTION OF POLLUTION
LEVEL IN DIESEL ENGINES” in partial fulfillment of the requirement for award of degree of Bachelor of Technology in Environmental Engineering, during the academic
year 2016-17. It is a record of the student’s research work prepared under my supervision and
guidance.
Dr. S.K. Singh
Professor Department of Environmental Engineering,
Delhi Technological University

iv
Declaration of Originality
I hereby undertake that we are the sole authors of this report. We undertake that this report
neither infringes upon anyone’s copyright nor violates any proprietary rights to the best of our
knowledge. Any ideas, techniques, quotations, or any other material form of work of other
people included in this report, published or otherwise, are fully acknowledged in accordance
with the standard referencing practices.
I declare that this is the true copy of my/our report, including all revisions, as approved by our
advisor and supervisor, and that this report has not been submitted for any other degree to any
other University or Institution.
v
Abstract
Air pollution has become a growing problem in megacities and large urban areas
throughout the globe, and transportation is recognized as the major source of air
pollution in many cities, especially in developing countries. Contribution of
automobiles is reported in the range of 40 to 80% of the total air pollution. The
challenge facing megacities is how to reduce the adverse environmental impacts and
other negative effects of transportation without giving up the benefits of mobility. This
research paper includes the testing of a biosignal ring developed by Wellan International
Limited. The ring when attached to the inlet of the engine acts on the fuel through
biosignals, the biosignals help in atomization of the fuel and reduces the pollutants by
further enhancing the combustion process, and thus reducing the unburnt pollutant
particles from the engine exhaust. The ring was tested on diesel and petrol engines. For
diesel engine reduction in smoke was measured, while in the petrol engine parameters
such as CO, CO2, SOx and NOx were measured before and after attaching the ring. The
percentage reduction of the pollutants obtained from the ring for the diesel engine is
about 15%, and in petrol engine, significant reduction in the pollutants is observed. If
this device is incorporated in the vehicles, it can substantially reduce the pollution
emitted from the vehicles and can even increases the efficiency of the engine.
Keywords: biosignal, vehicular pollution, efficiency of engine,atomization,diesel engine, petrol engine

vi
Contents
Abstract v
List of Tables viii
List of Figures viii
List of Symbols, Abbreviations, Nomenclature ix
Chapter 1 Introduction 1
1.1 Biosignals 1
1.2
1.3
1.4
Electrical biosignals
Non-electrical biosignals
Applications of biosignals
1
2
3
Chapter 2
2.1
2.2
2.3
2.4
2.5
Literature Review
Pollution control by biosignals
Functioning of power ring
Pollution control from vehicles
Parameters of vehicular pollution
Standards of vehicular pollution
5
5
5
8
9
10
Chapter 3 Methodology 12
3.1 Measurement of vehicular pollution 12
3.2
3.3
Methodology
Instruments used
13
14
Chapter 4 Data Analysis, Comparison, Results and Discussion 15
4.1 Data analysis 15
4.2 Comparison 16
4.3 Results 17
4.4 Discussion 17
Chapter 5 Conclusion 18
Chapter 6 Future Scope 19
References 59

vii
List of Tables
2.1
2.2
2.3
4.1
4.2
4.3
Emission norms for passenger cars
Emission norms for 2 or 3 wheelers
Emission norms for heavy diesel vehicles
Testing on diesel engine
Testing on petrol engine
Percentage reduction in emissions
13
13
13
14
14
15
viii
List of Figures
1.1 Types of signals 1
2.1 Functioning of biosignal ring 6
2.2 Interference of natural oscillations emitted by pollutants 7
2.3 Overlaying of natural oscillations emitted by pollutants 8
4.1 Petrol engine emission 16
4.2 Diesel engine emission 16
ix
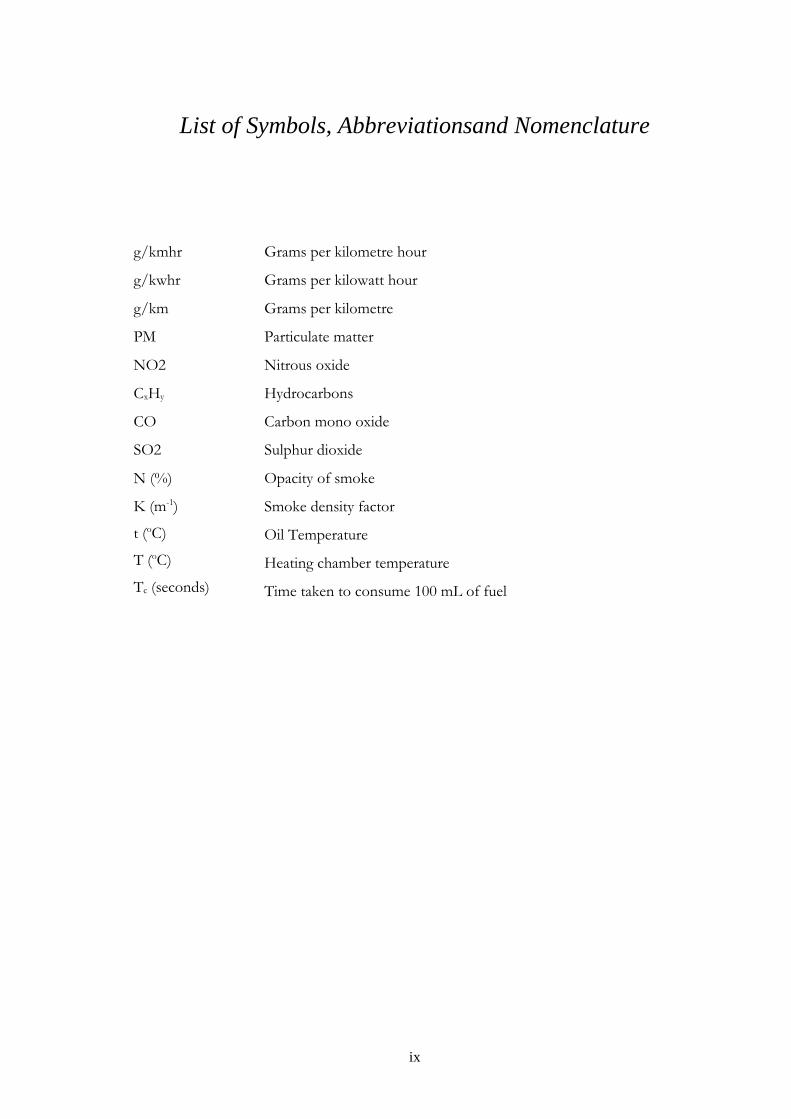
List of Symbols, Abbreviationsand Nomenclature
g/kmhr Grams per kilometre hour
g/kwhr Grams per kilowatt hour
g/km Grams per kilometre
PM Particulate matter
NO2
CxHy
CO
SO2
N (%)
K (m-1)
t (oC)
T (oC)
Tc (seconds)
Nitrous oxide
Hydrocarbons
Carbon mono oxide
Sulphur dioxide
Opacity of smoke
Smoke density factor
Oil Temperature
Heating chamber temperature
Time taken to consume 100 mL of fuel

1
Chapter 1 INTRODUCTION
1.1 BIOSIGNALS A biosignal is any signal in living beings that can be continually measured and monitored. The
term biosignal is often used to refer to bioelectrical signals, but it may refer to both electrical and
non-electrical signals [1, 2, 3]. The usual understanding is to refer only to time-varying signals,
although spatial parameter variations (e.g. the nucleotide sequence determining the genetic code)
are sometimes subsumed as well.
Figure 1.1: types of signals
1.2 ELECTRICAL BIOSIGNALS Electrical biosignals, or bioelectrical time signals, usually refers to the change in electric current
produced by the sum of an electrical potential difference across a specialized tissue, organ or cell
system like the nervous system[4,5]. Thus, among the best-known bioelectrical signals are:
1.2.1 Electroencephalogram (EEG): It is an electrophysiological monitoring method to record
electrical activity of the brain. EEG measures voltage fluctuations resulting from ionic
current within the neurons of the brain.
2
1.2.2 Electrocardiography (ECG): It is the process of recording the electrical activity of
the heart over a period of time using electrodes placed on the skin [6].
1.2.3 Electromyography (EMG): It is an electro diagnostic medicine technique for evaluating and
recording the electrical activity produced by skeletal muscles.
1.2.4 Mechanomyogram (MMG): It is the mechanical signal observable from the surface of
a muscle when the muscle is contracted. At the onset of muscle contraction, gross changes in the
muscle shape cause a large peak in the MMG.
1.2.5 Electrooculography (EOG/E.O.G.): It is a technique for measuring the cornea-retinal
standing potential that exists between the front and the back of the human eye. The resulting signal
is called the electrooculogram [7,8].
1.2.6 Electro dermal activity (EDA): It is the property of the human body that causes continuous
variation in the electrical characteristics of the skin.
1.2.7 Magneto encephalography (MEG): It is a functional neuroimaging technique for mapping
brain activity by recording magnetic fields produced by electrical currents occurring naturally in
the brain, using very sensitive magnetometers.
EEG, ECG, EOG and EMG are measured with a differential amplifier which registers the
difference between two electrodes attached to the skin. However, the galvanic skin response
measures electrical resistance and the MEG measures the magnetic field induced by electrical
currents (electroencephalogram) of the brain [9].
With the development of methods for remote measurement of electric fields using new sensor
technology, electric biosignals such as EEG and ECG can be measured without electric contact
with the skin. This can be applied for example for remote monitoring of brain waves and heartbeat
of patients who must not be touched, in particular patients with serious burns.
Electrical currents and changes in electrical resistances across tissues can also be measured from
plants.
1.3 NON ELECTRIC BIOSIGNALS
Biosignals may also refer to any non-electrical signal that is capable of being monitored from
biological beings, such as:
1.3.1 Mechanical signals (e.g. the mechanomyogram or MMG)
1.3.2 Acoustic signals (e.g. phonetic and non-phonetic utterances, breathing)
1.3.3 Chemical signals (e.g. pH, oxygenation)
1.3.4 Optical signals (e.g. movements).
3
1.4 APPLICATIONS OF BIOSIGNALS 1.4.1 Non-invasive diagnosis
In recent years, a particular challenge has arisen in non-invasive medical diagnostic procedures.
Because biosignals recorded on the body surface reflect the internal behavior and status of the
organism or its parts, they are ideally suited to provide essential information of these organs to the
clinician without any invasive measures [10-12]. This approach was used for classifying pre-
processed ECG signals to identify patients who were at high-risk of developing ventricular
tachycardia (VT).
1.4.2 Potential for direct interfaces and health monitoring
Biosignals are harnessed to enable enhanced computer interfaces. In particular, biosignals can
serve for passive health monitoring for the elderly who want to remain at home but need some
level of support as they age. Such devices can directly manipulate computer interfaces to give
people with limited peripheral mobility some control over their environment. In contrast to the
biosignal interfaces based on voluntary peripheral nerve signals, brain-to-computer interfaces are
also being researched.
1.4.3 Biosignal monitoring system for mobile telemedicine
A prototype integrated mobile telemedicine system has been designed that is compatible with
existing public mobile telecommunication network, CDMA 1xEVDO. The mobile telemedicine
system consists of two parts. One is a physiological signal measuring part, and the other is a PC
system for the signal processing and telecommunication. The system uses NetMeeting to transmit
video, audio and patient biosignals from a moving ambulance to a hospital and delivers to the
personal computer of the doctor. The patient biosignals are non-invasive blood pressure (NIBP),
arterial oxygen saturation, respiration pattern, electrocardiogram (ECG), heart sound, body core
temperature and blood glucose concentration. For the emergency medicine, vital signs are focused
and the remote medical monitoring, consulting, and health care are intended. The mobile
telemedicine system was implemented, and tested for real time medical consultation during
ambulance transport. This PC based mobile telemedicine system is flexible enough to
accommodate newer components in wireless communication and portable sensing technologies.
The present study suggests that the mobile telemedicine system using CDMA 1xEVDO is aids to
patient monitoring and diagnosis as well as a convenient means of communications in the
ambulance for the emergency medical care.
4
1.4.4 Ways of interactions using biosignals
A prototype earphone was developed with three kinds of biosignals - pulse wave, electromyogram
(EMG) and acceleration sensors. Using this system three new applications were invented, namely,
automatic music selection, tactile and visual communication and automatic metadata annotation.
1.4.5 Water purification
WELLAN RINGS work through bio-signals, which have been stored in the rings’ interior. These
signals penetrate all pipes and tubes to influence the water which is passing through. As a result,
the vibrations or oscillations created in the water are changed in such a way that lime, rust, scale or
bio-fouling matter no longer accumulate within a piped system and are washed out in minute
particles.
5
Chapter 2 LITERATURE REVIEW
2.1 POLLUTION CONTROL BY BIOSIGNALS Each elemental molecule has its own specific natural atomic/molecular oscillation. In simple
terms, oscillations are best described as vibrations or waves that are given off by that element.
Molecules are formed when atoms of different elements fuse together because of natural affinity.
This attraction is caused by the oscillations emitted by the atoms. In other words, elements
recognize each other by their unique oscillations. If the oscillations of various atoms are
neutralized their attraction ceases [13,14,15]. This is the basis of pollution control by biosignals.
The molecules of the fuel are targeted in order to reduce pollution cause by combustion of these
particles. When the fuel particles are acted upon by the biosignals, it leads to the atomization of
the fuel. So, when the fuel is burned in engine, it leads to the better and uniform combustion.
High frequency biosignals are modulated and stored into an appropriate device which is basically
high-quality information storage materials (base material crystals) which are capable of storing
such vibrations for indefinite periods of time and releasing them again. These biosignals penetrate
any kind of material and they are absorbed by the fuel as interference or resonance vibrations.
Whenever extra atoms are forcibly fused to form a molecule by the use of a catalyst, the resultant
molecule is unstable and will break apart. Biosignal emissions cause such a situation, resulting in a
breakdown within molecules. The dispersed atoms are then targeted by the ring to keep from
restructuring.
The high frequency oscillations that are generated by the energy field interact with the molecular
structure of the fuel, removing harmful elements from your fuel and oil. This causes the fuel to
become cleaner and finer, leading to better combustion and lesser number of unburnt particles or
pollutants and hence reducing pollution.
2.2 FUNCTIONING OF THE POWER RING WELLAN power ring consists of high-quality information storage materials (base material
crystals) which are capable of storing such vibrations for indefinite periods of time and releasing
them again. These vibrations penetrate any kind of material and they are absorbed by the water as
interference or resonance vibrations (hydrogen bridges or water molecules). Within fractions of a

6
second, this information passes through the pipe into the water and is effective even with high flow
rates.
WELLAN power rings can be deployed for water of any quality. No chemical substances,
magnetic fields or electromagnetic radiations are released into the environment [16].
The basis of this technology is the realization of the latest knowledge of modern quantum theory.
Frequency patterns from the ultra-fine range (quantum vibrations) are modulated onto WELLAN
RINGS by means of a laser technology.
Elements recognize each other by their unique oscillations. Thus, a water molecule is formed when
oxygen is attracted to combine with 2 atoms of hydrogen. If the oscillations of various atoms are
neutralized their attraction ceases. That is the function of Wellan emissions.
Whenever extra atoms are forcibly fused to form a molecule by the use of a catalyst, the resultant
molecule is unstable and will break apart. Wellan emissions cause such a situation, resulting in a
breakdown within molecules [17]. The dispersed atoms are then targeted by the ring to keep from
restructuring.
Figure 2.1Functioning of a biosignal ring
7
How are the signals harnessed
The molecular fundamental oscillations of various substances has been isolated, mapped and
stored in the Ring. Wellan technology works using specifically modulated molecular oscillations
not dependent upon magnetic forces or electrical pulses.
Based on these oscillations of elements and molecules, Wellan has developed new opposite/equal
active oscillations. The aim is to influence the original oscillation of the element that has been
targeted through new active oscillations in such a way that the physical properties of the element
or of the molecules are modified [18,19].
These manufactured oscillations are then programmed into the Wellan Ring and super imposed by
a proprietary Laser Technology. This alloy can store an almost unlimited number of active
oscillations and emit these to a liquid in a constant and stable format, independent of the ambient
temperature. The active oscillations create a field within the ring, which penetrates all piping
material and thus passes into the water or fluid [20-22]. The Principle results in an ‘Interference’
or ‘Overlaying’ of natural oscillations emitted by pollutants in the liquid.
Interference and Overlaying can best be described as cancelling sound using equal and opposite
waves or playing two adjacent musical notes together to create another note.
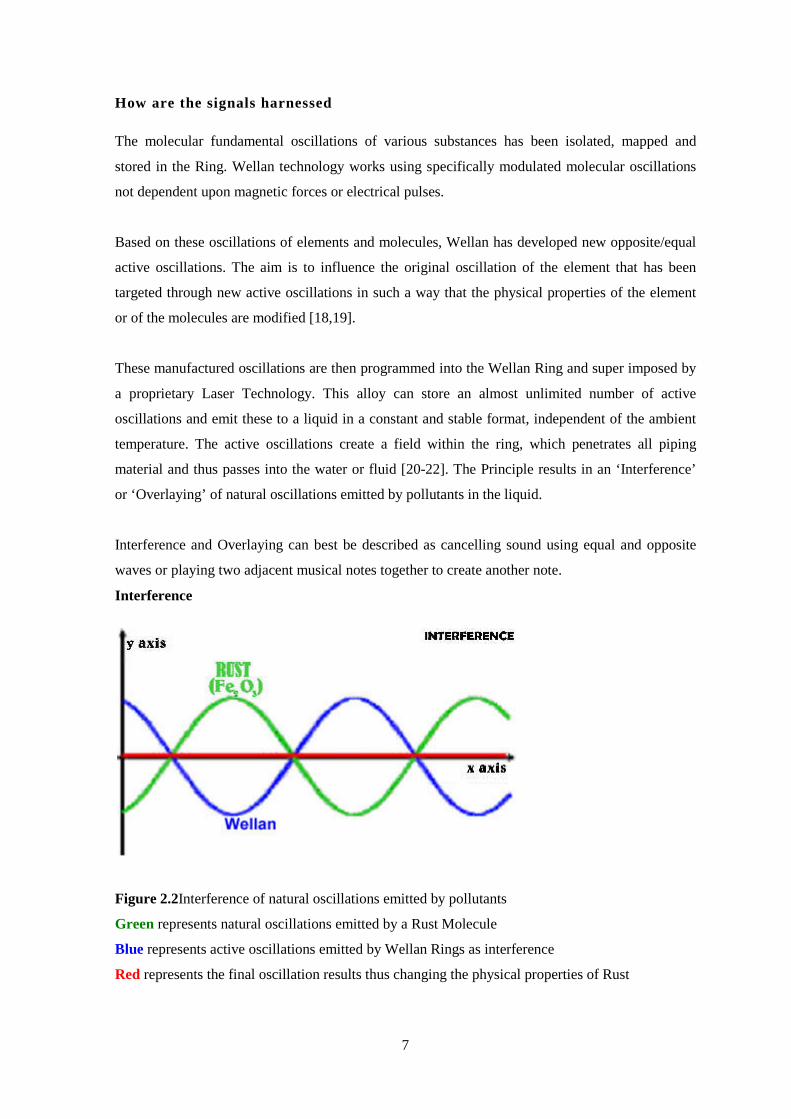
Interference
Figure 2.2Interference of natural oscillations emitted by pollutants
Green represents natural oscillations emitted by a Rust Molecule
Blue represents active oscillations emitted by Wellan Rings as interference
Red represents the final oscillation results thus changing the physical properties of Rust
8
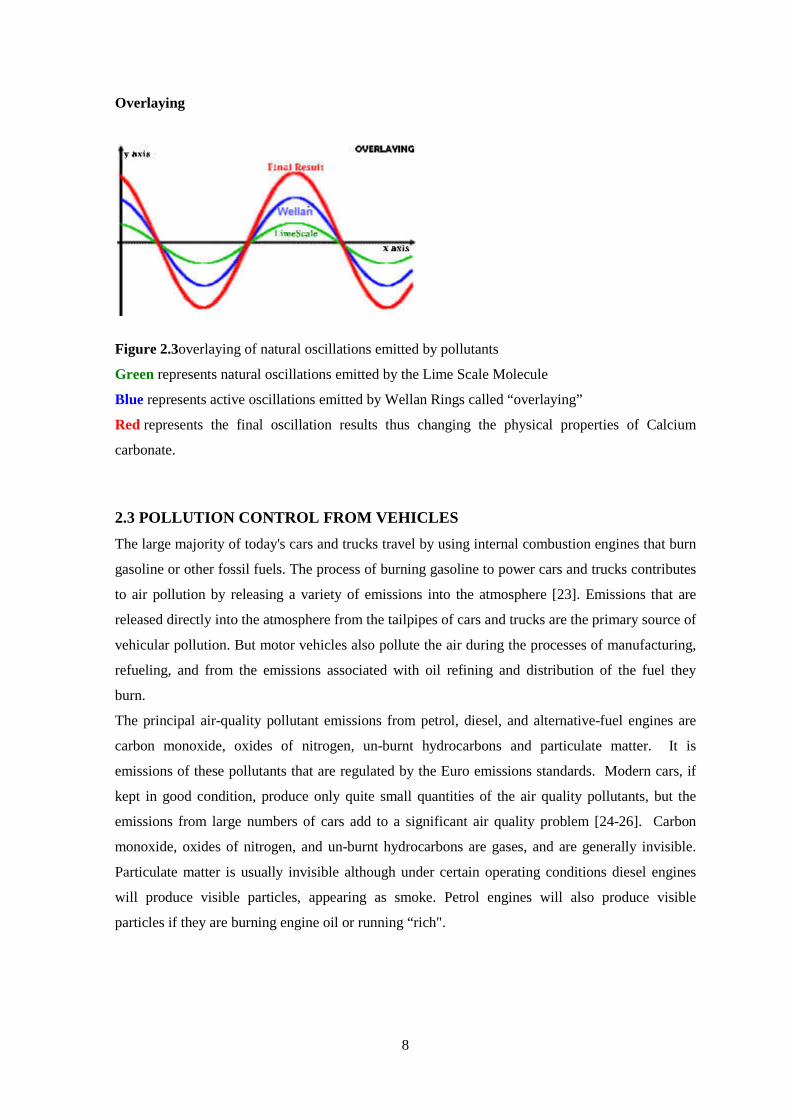
Overlaying
Figure 2.3overlaying of natural oscillations emitted by pollutants
Green represents natural oscillations emitted by the Lime Scale Molecule
Blue represents active oscillations emitted by Wellan Rings called “overlaying”
Red represents the final oscillation results thus changing the physical properties of Calcium
carbonate.
2.3 POLLUTION CONTROL FROM VEHICLES The large majority of today's cars and trucks travel by using internal combustion engines that burn
gasoline or other fossil fuels. The process of burning gasoline to power cars and trucks contributes
to air pollution by releasing a variety of emissions into the atmosphere [23]. Emissions that are
released directly into the atmosphere from the tailpipes of cars and trucks are the primary source of
vehicular pollution. But motor vehicles also pollute the air during the processes of manufacturing,
refueling, and from the emissions associated with oil refining and distribution of the fuel they
burn.
The principal air-quality pollutant emissions from petrol, diesel, and alternative-fuel engines are
carbon monoxide, oxides of nitrogen, un-burnt hydrocarbons and particulate matter. It is
emissions of these pollutants that are regulated by the Euro emissions standards. Modern cars, if
kept in good condition, produce only quite small quantities of the air quality pollutants, but the
emissions from large numbers of cars add to a significant air quality problem [24-26]. Carbon
monoxide, oxides of nitrogen, and un-burnt hydrocarbons are gases, and are generally invisible.
Particulate matter is usually invisible although under certain operating conditions diesel engines
will produce visible particles, appearing as smoke. Petrol engines will also produce visible
particles if they are burning engine oil or running “rich".
9
2.4 PARAMETERS OF VEHICULAR POLLUTION Cars and trucks produce air pollution throughout their life, including pollution emitted during
vehicle operation, refueling, manufacturing, and disposal. Additional emissions are associated with
the refining and distribution of vehicle fuel [27-30].
Air pollution from cars and trucks is split into primary and secondary pollution. Primary pollution
is emitted directly into the atmosphere; secondary pollution results from chemical reactions
between pollutants in the atmosphere. The following are the major pollutants from motor vehicles:
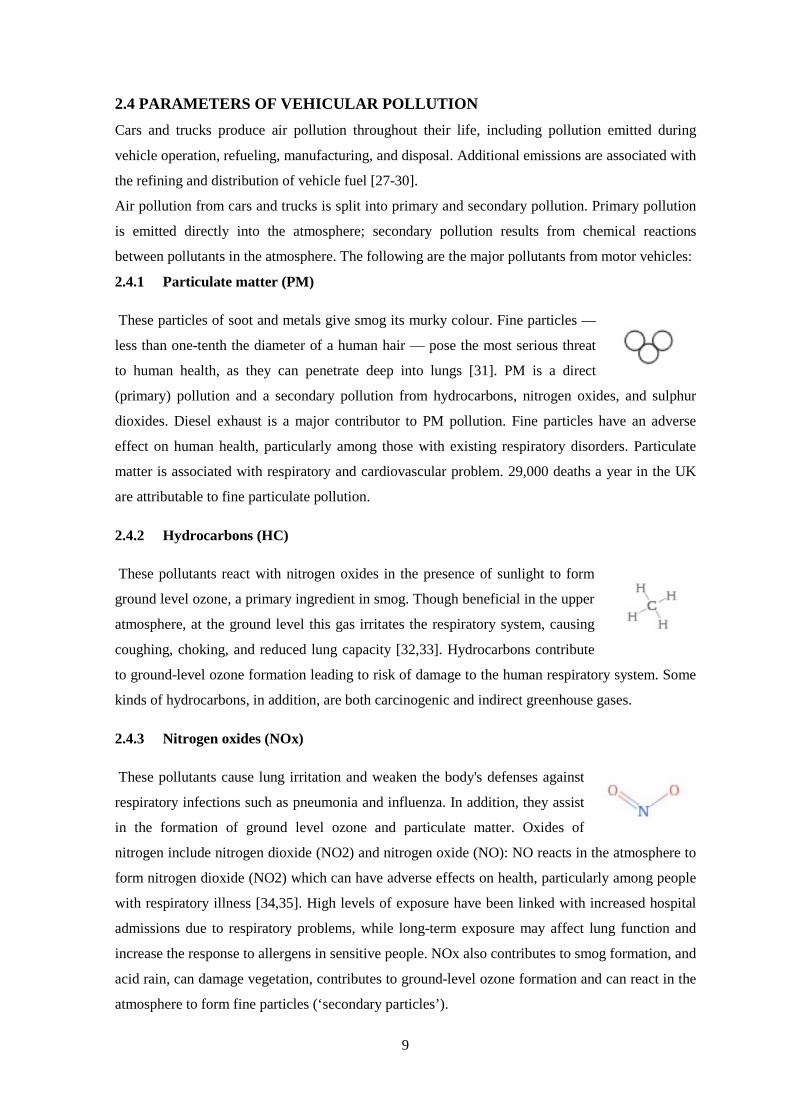
2.4.1 Particulate matter (PM)
These particles of soot and metals give smog its murky colour. Fine particles —
less than one-tenth the diameter of a human hair — pose the most serious threat
to human health, as they can penetrate deep into lungs [31]. PM is a direct
(primary) pollution and a secondary pollution from hydrocarbons, nitrogen oxides, and sulphur
dioxides. Diesel exhaust is a major contributor to PM pollution. Fine particles have an adverse
effect on human health, particularly among those with existing respiratory disorders. Particulate
matter is associated with respiratory and cardiovascular problem. 29,000 deaths a year in the UK
are attributable to fine particulate pollution.
2.4.2 Hydrocarbons (HC)
These pollutants react with nitrogen oxides in the presence of sunlight to form
ground level ozone, a primary ingredient in smog. Though beneficial in the upper
atmosphere, at the ground level this gas irritates the respiratory system, causing
coughing, choking, and reduced lung capacity [32,33]. Hydrocarbons contribute
to ground-level ozone formation leading to risk of damage to the human respiratory system. Some
kinds of hydrocarbons, in addition, are both carcinogenic and indirect greenhouse gases.
2.4.3 Nitrogen oxides (NOx)
These pollutants cause lung irritation and weaken the body's defenses against
respiratory infections such as pneumonia and influenza. In addition, they assist
in the formation of ground level ozone and particulate matter. Oxides of
nitrogen include nitrogen dioxide (NO2) and nitrogen oxide (NO): NO reacts in the atmosphere to
form nitrogen dioxide (NO2) which can have adverse effects on health, particularly among people
with respiratory illness [34,35]. High levels of exposure have been linked with increased hospital
admissions due to respiratory problems, while long-term exposure may affect lung function and
increase the response to allergens in sensitive people. NOx also contributes to smog formation, and
acid rain, can damage vegetation, contributes to ground-level ozone formation and can react in the
atmosphere to form fine particles (‘secondary particles’).
10
2.4.4 Carbon monoxide (CO)
This odourless, colourless, and poisonous gas is formed by the combustion of
fossil fuels such as gasoline and is emitted primarily from cars and trucks.
When inhaled, CO blocks oxygen from the brain, heart, and other vital organs.
Fetuses, new-born children, and people with chronic illnesses are especially susceptible to the
effects of CO [36]. Carbon monoxide reduces the blood’s oxygen-carrying capacity which can
reduce the availability of oxygen to key organs. Extreme levels of exposure, such as might occur
due to blocked flues in domestic boilers, can be fatal. At lower concentrations CO may pose a
health risk, particularly to those suffering from heart disease.
2.4.5 Sulphur dioxide (SO2)
Power plants and motor vehicles create this pollutant by burning sulphur-
containing fuels, especially diesel. Sulphur dioxide can react in the atmosphere to
form fine particles and poses the largest health risk to young children and
asthmatics.
2.4.6 Hazardous air pollutants (toxics)
These chemical compounds have been linked to birth defects, cancer, and other serious illnesses
[37]. The Environmental Protection Agency estimates that the air toxics emitted from cars and
trucks — which include Benzene, acetaldehyde, and 1, 3-butadiene — account for half of all
cancers caused by air pollution.
2.4.7 Greenhouse gases
Motor vehicles also emit pollutants, such as carbon dioxide, that contribute to
global climate change. In fact, cars and trucks account for over one-fifth of the
United States' total global warming pollution; transportation, which includes
freight, trains, and airplanes, accounts for around thirty per cent of all heat-trapping gas emissions.
2.5 STANDARDS OF VEHICULAR POLLUTION The standards are set by Central Pollution Control Board under the ministry of Environment and
Forests and climate change. These are called Bharat Stage Emission Standards that regulate the
output of the air pollutants from internal combustion engine equipment. These standards based on
European regulations were first introduced in 2000.The standard active now is Bharat Stage-IV
norms which has been implemented since 2012.These norms help in bringing down pollution
11
levels[38]. Exposure to air pollution can lead to a number of cardiovascular and respiratory
diseases.
Norms CO( g/km) HC+ NOx(g/km)
1991Norms 14.3-27.1 2.0(Only HC) 1996 Norms 8.68-12.40 3.00-4.36
1998Norms 4.34-6.20 1.50-2.18
India stage 2000 norms 2.72 0.97 Bharat stage-II 2.2 0.5 Bharat Stage-III 2.3 0.35(combined)
Bharat Stage-IV 1.0 0.18(combined) Table 2.1 Emission norms for passenger cars
Norms CO( g/km) HC+ NOx(g/km)
1991Norms 12-30 8-12 (only HC)
1996 Norms 4.5 3.6
India stage 2000 norms 2.0 2.0 Bharat stage-II 1.6 1.5 Bharat Stage-III 1.0 1.0
Table 2.2 Emission norms for two or three wheelers
Norms CO( g/kmhr) HC (g/kmhr) NOx (g/kmhr) PM(g/kwhr)
1991Norms 14 3.5 18 - 1996 Norms 11.2 2.4 14.4 -
India stage 2000 norms 4.5 1.1 8.0 0.36 Bharat stage-II 4.0 1.1 7.0 0.15 Bharat Stage-III 2.1 1.6 5.0 0.10 Bharat Stage-IV 1.5 0.96 3.5 0.02
Table 2.3 Emission norms for heavy diesel vehicles
12
Chapter 3 METHODOLOGY
3.1 MEASUREMENT OF VEHICULAR POLLUTION There are three approaches available today to measure vehicle emissions. The first approach
involves bringing vehicles into a laboratory, placing the vehicles on a dynamometer, and
measuring their emissions as they are operated. The second approach is to place emission
measurement and exhaust flow measurement equipment onto the vehicles and measure emissions
from the vehicles as they are operated in the field. The third option is to use remote sensing to
detect emissions from vehicles as they drive by.
The traditional way to measure emissions from vehicles is to bring them into the laboratory and
measure emissions as they are operated on a dynamometer. In the better laboratories, the
dynamometers can vary the load that they place on a vehicle on a second by second basis. Some
older dynamometers are only capable of maintaining a steady load that can be changed, but only
while the vehicle is not being tested. In either case, a load is placed on the vehicle that is
equivalent to a load that the vehicle might experience while it is operating on a roadway and the
emissions are measured from the vehicle. The actual emission measurements are typically made
using a Constant Volume Sampling (CVS) system. This system works by pulling a constant
volume of air that is larger than the amount of gases emitted by the vehicle being tested through a
sampling duct. The exhaust gases from the vehicle being tested are mixed with this makeup air.
The makeup air must, of course, be free of gases and particulate matter in order to not distort the
testing process.
On-road vehicle emissions measurement equipment has only become realistically available since
about 2003. The equipment is often referred to as portable emissions measurement equipment or
PEMs.
Remote testing of vehicles offers another useful option for measuring vehicle emissions. The
positive attributes of remote sensing for vehicle testing is that there are no vehicle acquisition
difficulties and many hundreds or thousands of vehicles can be tested in a short timeframe. The
negatives are that the emission measurements are less precise especially for the measurement of
mass emissions and the range of emissions under different vehicle power demands that can be
measured are limited.
The most common remote testing involves placing a beam across a lane of road and looking at the
absorption spectrum from the exhaust. The roadway can be a freeway on-ramp or almost any type
of street where a single lane can be isolated. The concentration of CO, VOC, NOx, and CO2 in the
13
exhaust can be estimated based on the concentration data that is collected from the vehicle exhaust
plume.
3.2 METHODOLOGY The methods of testing emissions from petrol engine and diesel engine are different:
3.2.1 Measurement Procedure for Diesel Engine(IS 8118:2008)
1. The test shall be carried out on an engine installed on a test bench or on a vehicle.
2. The engine shall first be brought to normal operating conditions during a road run or
dynamic run 2 on the test bench. The test shall be carried out immediately after completion
of the warming-up period.
3. The combustion chamber shall not be cooled or fouled by a prolonged period of idling
preceding the test.
4. The engine oil temperature should be measured' and test should be allowed to proceed
only after the engine oil temperature reaches 60°C.
5. During each free acceleration, maximum no load speed reached shall be within a band
width of ± 500 rpm of average value in respect of three wheeler vehicles and ±3oo rpm of
the average value for all other categories of vehicles. The average value of rpm is
calculated from last four readings, out of six readings during the initial flushing cycles.
6. With the engine at idling, the accelerator control shall be operated quickly, but not
violently, so as to obtain maximum delivery from the injection pump. This position shall
be maintained until maximum engine speed is reached and the governor gets activated
comes into action. As soon as this speed is attained the accelerator shall be released until
the engine resumes its idling speed and the opacity meter reverts to .the corresponding
conditions.
7. The operation specified in 6 shall be repeated not less than six times in order to clear the
exhaust system and to allow for any necessary adjustment of the apparatus. Subsequently,
the maximum opacity values obtained in each successive acceleration shall be taken as the
values obtained while, after, each acceleration, the engine shall be kept at idling. The
values obtained shall be considered as stabilized when four of such consecutive readings
are situated within a band width of 0.25/m and do not form a decreasing sequence. The
absorption coefficient so recorded shall be the arithmetical mean of these four valid
readings.
8. The web cam photo of the vehicle number-plate should appear in the emission certificate.
14
3.2.2 Measurement Procedure for Petrol Engine
To test the increased efficiency of the fuel by the installation of the Power Ring, the following
procedure is followed. Low gas analyzer was used to measure the emissions from petrol Engine.
The test also gives the reduction in air pollution due to incorporation of the Ring. The test
sequence is as follows:
1. Test a vehicle for the emissions at the exhaust pipe without installing the Power Ring.
2. Start the motor with empty gear. (if the vehicle is automatic, please set the gear to N)
3. Let the motor warm up for at least 30min.
4. Monitor the value of the emissions on the monitor.
4.1. Monitor the cooling water temperature and wait for a while until the temperature
stabilized. It must warm up to 90°C.
4.2. Then, the emissions are to be monitored. If the values of emissions are stable, record the
values.
5. Fill exactly the same amount of fuel into the tank as before installing the Power Ring.
6. Install one or more Power Rings on the fuel pipe i.e., at the inlet of the engine.
7. Repeat the steps 1-4 from above.
8. Compare the emission values of the both results.
3.3 INSTRUMENTS USED 3.3.1 Diesel Engine
The smoke meter primarily measures the opacity of the smoke received. Opacity is the degree to
which smoke blocks light, it is the measure of light reduction or loss over a smoke column path. It
is expressed as percentage. An opacity of 10% means that 90% of the source light power remains.
Smoke meter also measures K, which is the smoke density factor in units of inverse length, and L
is path length of the measured smoke sample column. Conceptually, the smoke density term
represents the exponential light loss sensitivity per unit length of the smoke column. Table 4.1
shows the readings obtained from the smoke meter with and without the ring
3.3.2 Analysis for Petrol Engine
Low gas analyzer was used for the measurement of emissions from petrol engine. Various
parameters were recorded from the low gas analyzer. Table 4.2 gives the readings of various
parameters recorded from the instrument.
15
Chapter 4 Data analysis, comparison, results and discussion
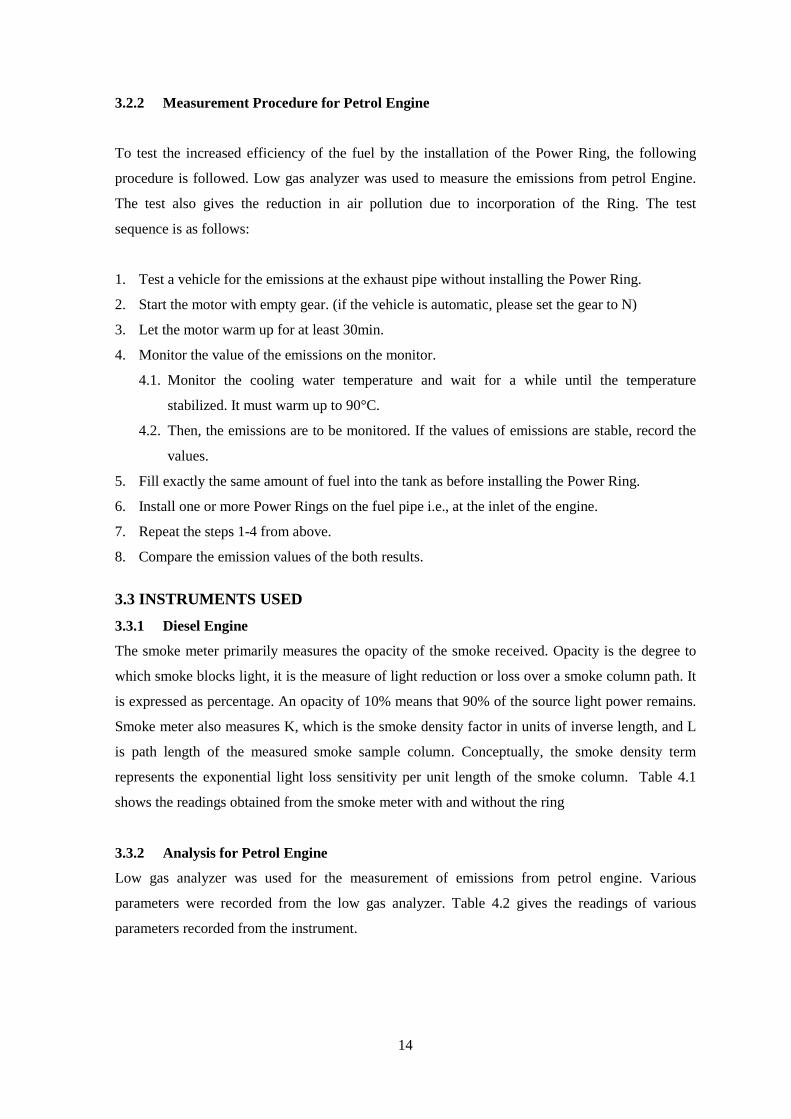
4.1 Data analysis
WITHOUT RING
S.No N (%) K(m-1) T(oC) n(min-1) t(oC) R.P.M.
1 17.3 0.42 52 972 25 974
2 16.9 0.41 55 972 26 974
WITH RING
S.No N (%) K(m-1) T(oC) n(min-1) t(oC) R.P.M.
1 14.4 0.36 55 970 24 974
2 14.6 0.37 56 970 24 972 Table 4.1 Testing on diesel engine
WITHOUT RING
S.No CO NO CxHy SO2 NOx Fuel Efficiency (%) Tc
1 277.1 42.3 1306 1.5 160.1 90.40 144s
WITH RING
S.No CO NO CxHy SO2 NOx Fuel Efficiency (%) Tc
1 265.1 87.5 975.4 0 114.9 95.30 158s
Table 4.2 Testing on petrol engine
Diesel Engine (using smoke meter)
Petrol Engine (using Low gas Analyser)
16
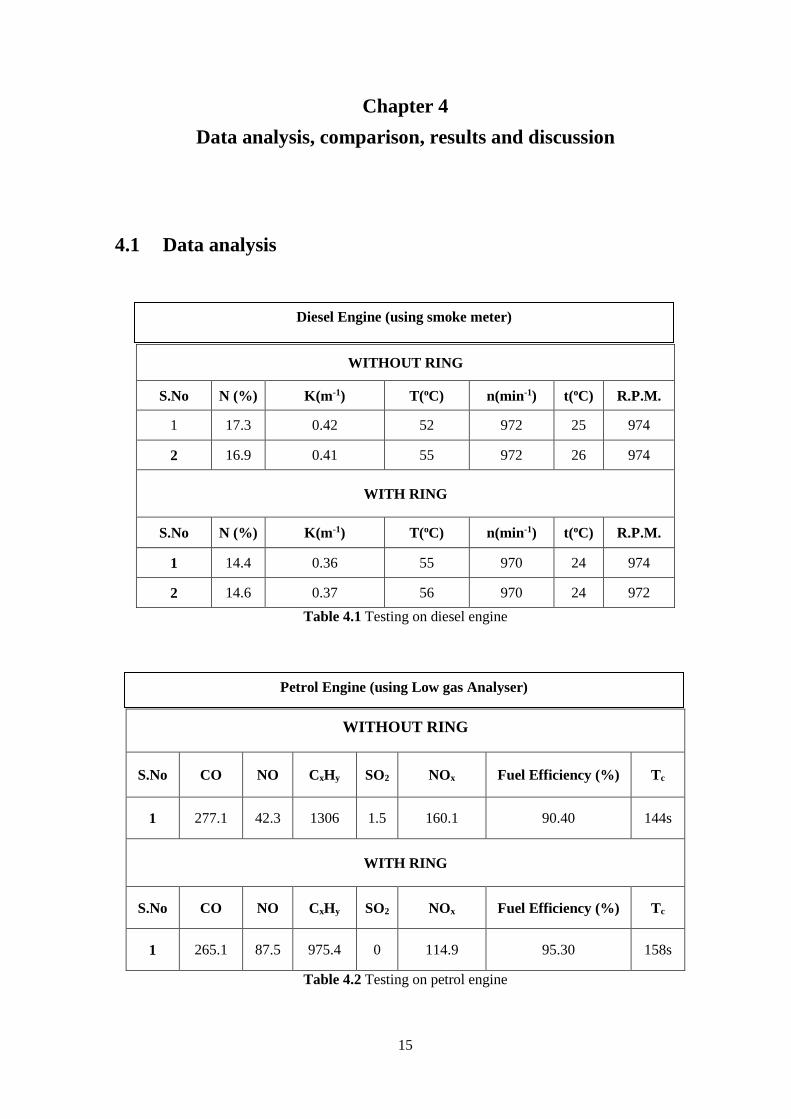
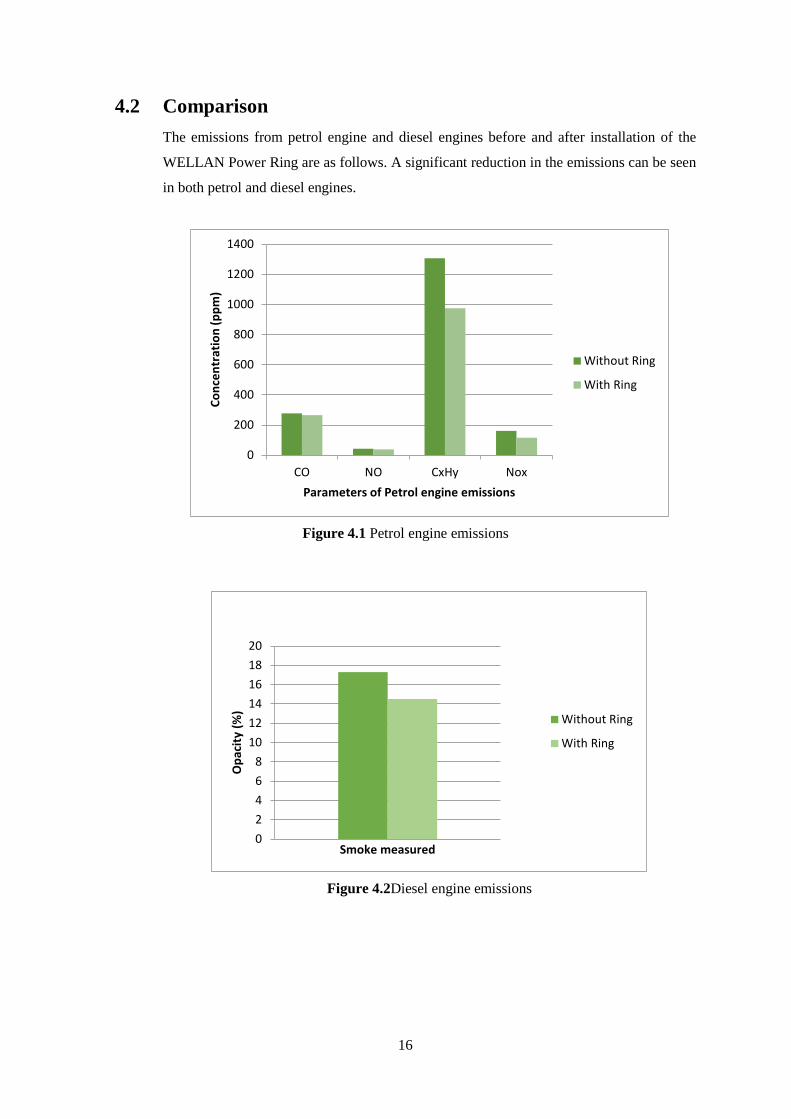
4.2 Comparison The emissions from petrol engine and diesel engines before and after installation of the
WELLAN Power Ring are as follows. A significant reduction in the emissions can be seen
in both petrol and diesel engines.
Figure 4.1 Petrol engine emissions
Figure 4.2Diesel engine emissions
0
200
400
600
800
1000
1200
1400
CO NO CxHy Nox
Conc
entr
atio
n (p
pm)
Parameters of Petrol engine emissions
Without Ring
With Ring
02468
101214161820
Opa
city
(%)
Smoke measured
Without Ring
With Ring
17
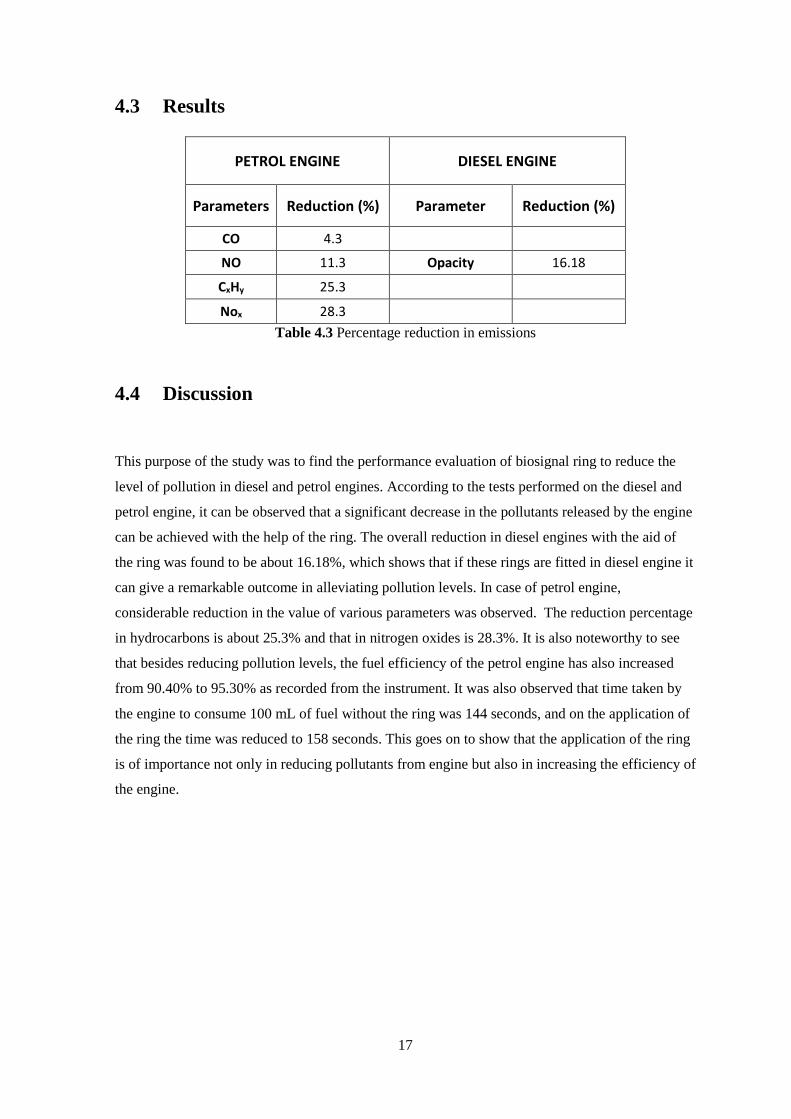
4.3 Results
PETROL ENGINE DIESEL ENGINE
Parameters Reduction (%) Parameter Reduction (%)
CO 4.3 NO 11.3 Opacity 16.18
CxHy 25.3 Nox 28.3
Table 4.3 Percentage reduction in emissions
4.4 Discussion
This purpose of the study was to find the performance evaluation of biosignal ring to reduce the
level of pollution in diesel and petrol engines. According to the tests performed on the diesel and
petrol engine, it can be observed that a significant decrease in the pollutants released by the engine
can be achieved with the help of the ring. The overall reduction in diesel engines with the aid of
the ring was found to be about 16.18%, which shows that if these rings are fitted in diesel engine it
can give a remarkable outcome in alleviating pollution levels. In case of petrol engine,
considerable reduction in the value of various parameters was observed. The reduction percentage
in hydrocarbons is about 25.3% and that in nitrogen oxides is 28.3%. It is also noteworthy to see
that besides reducing pollution levels, the fuel efficiency of the petrol engine has also increased
from 90.40% to 95.30% as recorded from the instrument. It was also observed that time taken by
the engine to consume 100 mL of fuel without the ring was 144 seconds, and on the application of
the ring the time was reduced to 158 seconds. This goes on to show that the application of the ring
is of importance not only in reducing pollutants from engine but also in increasing the efficiency of
the engine.
18
Chapter 5 Conclusion
From the results obtained, we see that the Power Ring is very efficient in reducing the pollutants
from the atmosphere. Various parameters constituting the smoke have significantly decreased in
the engine exhaust after installation of the ring. The ring works effectively on diesel as well as
petrol engines. In petrol engines, maximum reduction is in the oxides of nitrogen. Besides
reducing the pollution, it proves to be economical to install the ring into to engine inlets of the
motor vehicles. It is so because an increase in burning capacity of the fuel is observed. This
indicates increase in fuel efficiency which makes the fuel last longer.
If the ring is incorporated in vehicles, it can prove to be beneficial for consumers on a daily basis.
With the results obtained, a person saves fuel worth of 7 minutes travelling time on 1 litre of fuel
with the help of the ring. From this calculation, if a person uses 1 litre of petrol per day, he or she
can save fuel worth of 1 hour of travelling time, which means 1 litre of petrol is saved if a person
travels 10 Km on road in vehicles incorporated with the ring. And, on an even larger scale 55 litres
of the fuel can be saved in a year.
The ring can reduce around 15% of pollutants from the diesel engine, and also leads to remarkable
reduction in the emissions produced by petrol engine.
Hence, it can be concluded that the Power Ring is the much needed means to get the rising levels
of pollution in control and further also proves to be economical.
19
Chapter 6 Future scope
Innumerous methods to control pollution have been employed since the awareness of pollution rise
has been spread. For example, a muffler is installed in the engine to control the noise and
vibrations due to knocking. Earlier, a positive Crankcase Ventilation (PCV) system was used in the
automobiles. In this system, the exhaust gasses were sent back into the crankcase so that complete
combustion of the un-burnt particles could be carried out. But, this did not prove to be an effective
method since the efficiency was not as desired. Also, the exhaust gasses caused harm to the
crankcase. These days, a new technology has been developed. IC engines employ catalytic
convertor at their exhaust valves to reduce the smoke emissions. Inside the catalytic convertor, the
smoke emissions are adsorbed on the catalyst which makes them unstable, thereby atomizing
them. The atomized exhaust gets converted into non-toxic molecules which enter the atmosphere.
It proves to be very efficient in reducing the smoke emissions from the engine exhaust valves. The
idea of the Power Ring is to atomize the fuel at the very inlet of the engine. This gives two positive
results, firstly, burning the fuel much more efficiently and secondly, minimizing the emission of
the un-burnt carbon particles. This not only helps in reducing the pollution at the exhaust valve,
but also increases the efficiency of the fuel by about 5-30%, making it last longer. The Power Ring
can be installed in petrol engines, diesel engines and generators. The installation process being
simple, it can be attached on the fuel pipe by any individual. Since, automobiles contribute to 80-
90% of the air pollution; there is tremendous scope of this Power Ring in the present as well as in
the future as it is high time for mankind to act on the rising levels of air pollution especially in
megacities.
20
REFERENCES
[1] "Remote heartbeat monitor will outperform current technology". University of Sussex Bulletin. 8 February 2002. Retrieved 14 June 2015.
[2] "New non-invasive sensor can detect brainwaves remotely". University of Sussex. 24 October 2002. Retrieved 14 June 2015.
[3] T. J. Sullivan; S.R. Deiss; G. Cauwenberghs (November 2007). A Low-Noise, Non-Contact EEG/ECG Sensor. Biomedical Circuits and Systems Conference, 2007 (BIOCAS 2007, IEEE). pp. 154–157. doi:10.1109/BIOCAS.2007.4463332.
[4] Yu M. Chi; Patrick Ng; Eric Kang; Joseph Kang; Jennifer Fang; Gert Cauwenberghs. Wireless non-contact cardiac and neural monitoring. Proceedings of Wireless Health 2010 (WH'10). pp. 15–23. doi:10.1145/1921081.1921085.
[5] C J Harland; T D Clark; R J Prance (February 2002). "Electric potential probes - new directions in the remote sensing of the human body". Measurement Science and Technology. 13 (2): 163 ff. doi:10.1088/0957-0233/13/2/304.
[6] C.J. Harland; T.D. Clark; N.S. Peters; M.J. Everitt; P.B. Stiffell. "A compact electric potential sensor array for the acquisition and reconstruction of the 7-lead electrocardiogram without electrical charge contact with the skin". Physiological Measurement. 26 (6): 939 ff. doi:10.1088/0967-3334/26/6/005.
[7] M. Oehler; V. Ling; K. Melhorn; M. Schilling. "A multichannel portable ECG system with capacitive sensors". Physiological Measurement. 29 (7): 783 ff. doi:10.1088/0967-3334/29/7/007.
[8] Brouse, Andrew. "A Young Person's Guide to Brainwave Music: Forty years of audio from the human EEG." eContact! 14.2 — Biotechnological Performance Practice / Pratiques de performance biotechnologique (July 2012). Montréal: CEC.
[9] Ortiz, Miguel. "A Brief History of Biosignal-Driven Art: From biofeedback to biophysical performance." eContact! 14.2 — Biotechnological Performance Practice / Pratiques de performance biotechnologique (July 2012). Montréal: CEC.
[10] Lopes, Pedro and jef chippewa. "Performing Biological Bodies: An open conversation with Marco Donnarumma, Claudia Robles and Peter Kirn at Body Controlled #4 — Bio Interfacing." eContact! 14.2 — Biotechnological Performance Practice / Pratiques de performance biotechnologique (July 2012). Montréal: CEC.
[11] eContact! 14.2 — Biotechnological Performance Practice / Pratiques de performance biotechnologique (July 2012). Montréal: CEC.
[12] ForEG, GümşelEB, OzgonO, Prediction of ABC Removal by Different Materials from Landfill Leachate: Modeling of Experimental Results XYZ Technique, The Scientific World Journal, vol. 52, no. 2, 2013,DOI: 10.1155/2013/240158
[13] Rosen (Ed.), Erwin M. (1975). The Peterson automotive troubleshooting & repair manual. Grosset & Dunlap, Inc. ISBN 978-0-448-11946-5.
[14] "Infrared Remote Sensing Of On-Road Motor Vehicle Emissions In Washington State" [15] Mulliken, Robert S. (July 1932). "Electronic Structures of Polyatomic Molecules and
Valence. II. General Considerations". Physical Review. 41 (1): 49–71. Bibcode:1932PhRv...41...49M. doi:10.1103/PhysRev.41.49.
[16] F. Hund, "Zur Deutung einiger Erscheinungen in den Molekelspektren" [On the interpretation of some phenomena in molecular spectra] Zeitschrift für Physik, vol. 36, pages 657-674 (1926).
[17] F. Hund, "Zur Deutung der Molekelspektren", Zeitschrift für Physik, Part I, vol. 40, pages 742-764 (1927); Part II, vol. 42, pages 93–120 (1927); Part III, vol. 43, pages 805-826 (1927); Part IV, vol. 51, pages 759-795 (1928); Part V, vol. 63, pages 719-751 (1930).
21
[18] R. S. Mulliken, "Electronic states. IV. Hund's theory; second positive nitrogen and Swan bands; alternate intensities", Physical Review, vol. 29, pages 637–649 (1927).
[19] R. S. Mulliken, "The assignment of quantum numbers for electrons in molecules", Physical Review, vol. 32, pages 186–222 (1928).
[20] Friedrich Hund and Chemistry, Werner Kutzelnigg, on the occasion of Hund's 100th birthday, Angewandte Chemie International Edition, 35, 573–586, (1996)
[21] Robert S. Mulliken's Nobel Lecture, Science, 157, no. 3785, 13-24. Available on-line at: Nobelprize.org
[22] Sir John Lennard-Jones, "The electronic structure of some diatomic molecules", Transactions of the Faraday Society, vol. 25, pages 668-686 (1929).
[23] Gary L. Miessler; Donald A. Tarr. Inorganic Chemistry. Pearson Prentice Hall, 3rd ed., 2004.
[24] Catherine E. Housecroft, Alan G. Sharpe, Inorganic Chemistry, Pearson Prentice Hall; 2nd Edition, 2005, p. 29-33.
[25] Peter Atkins; Julio De Paula. Atkins’ Physical Chemistry. Oxford University Press, 8th ed., 2006.
[26] Yves Jean; François Volatron. An Introduction to Molecular Orbitals. Oxford University Press, 1993.
[27] HE Kebin,ZHANGQiang, HOU Hong, Point source of pollution: Local effects and its control,Types and amount of vehicular pollution, 2010, vol.1.
[28] WegmullerM, von der WeidJ. P., ObersonP., GisinN., High resolution fiber distributed measurements with coherent OFDR, in Proc. ECOC’00, 2000, paper 11.3.4, p. 109.
[29] SoraceRE, Reinhardt VS,VaughnSA, High-speed digital-to-RF converter, U.S. Patent 5 668 842, Sept. 16, 1997.
[30] Coalition for Commercial Application of Superconductors Website, 2015, [Online]. Available: http://www.cca.org/upconductivity/#image1
[31] Shell M,2002,IEEEtran homepage on CTAN. [Online]. Available: http://www.ctan.org/techive/macros/latex/contrib/supported/IEEEtran/
[32] FLEXChip Signal Processor (MC68175/D), Motorola, 1996. [33] PDCA12-70 data sheet, Opto Speed SA, Mezzovico, Switzerland. [34] Karnik A, Performance of TCP congestion control with rate feedback: TCP/ABR and rate
adaptive TCP/IP, M. Eng. thesis, Indian Institute of Science, Bangalore, India, Jan. 1999. [35] Basic Research Needs For Superconductivity, Report on the Basic Energy Sciences
Workshop on Superconductivity 2006. [Online]. Available: http://www.sc.doe.gov/bes/reports/files/SC_rpt.pdf.
[36] Wireless LAN Medium Access Control (MAC) and Physical Layer (PHY) Specification, IEEE Std. 802.11, 1997.
[37] Jones, M., 2002. “Advanced opacitymeters: their potential role in future emission testing legislation for Diesel vehicles”, Proc. of the 6th ETH Conference on Nanoparticle Measurement, Zurich, August 2002, http://nanoparticles.ch/archive/2002_Jones_PR.pdf
[38] Zahoransky, R.A., Z. Wizard, 2000. “On-line/in-line measurements of particle emissions by optical multi-wavelength technique”, Proc. of the ETH Conference on Nanoparticle Measurement, Zurich, August 2000, http://nanoparticles.ch/archive/2000_Zahoransky_PR.pdf