performance measurement and attribution in asset...
TRANSCRIPT
Performance Measurement and Attribution in Asset Management
Prof. Massimo Guidolin
Portfolio Management
Spring 2017

Outline and objectives
2Performance Measurement and Attribution (Hints)
The problem of isolating skill from lucko Guidolin-Pedio, chapter 7, sec. 7.1
Simple risk-adjusted performance measureso Guidolin-Pedio, chapter 7, sec. 7.2
Performance decompositiono Guidolin-Pedio, chapter 7, sec. 7.3

Key Concepts/1
3
The goal of performance analysis is to distinguish skilled from unskilled investment managers, in an ex-post realized perspective
The mere existence of positive returns does not prove skill because important issues remain: how much risk was taken on in generating that return?
Two kinds of skill matter: ① Superior risk-adjusted returns can be derived through either superior timing or superior security selection; ② The ability to diversify the portfolio completely to eliminate all unsystematic risk, relative to some benchmark
The first, key step is to adjust for the risk taken any reported time-weighted average performance
Total risk is sensible for large, already well-diversified portfolios Systematic risk is instead sensible when the portfolio is smaller
either in size or in breadth, or because constraints have been imposed on its overall diversification
Performance Measurement and Attribution (Hints)

Key Concepts/2
4
Peer-group comparison performs a benchmarking with randomly drawn managers that select from identical asset menu and are subject to identical constraints
Risk-adjustment is applied by selecting peers that have similar risk exposures, total and/or systematic
The Sharpe ratio is
and it is appropriatefor well-diversified, large ptfs. The Capital Market Line Alpha
is the plus/minus of a manager vs. a naïve (leveraged) investment in the market ptf., say an index mutual fund
In the plot, manager A has generated a plus
Performance Measurement and Attribution (Hints)
CML alpha
Key Concepts/3
5
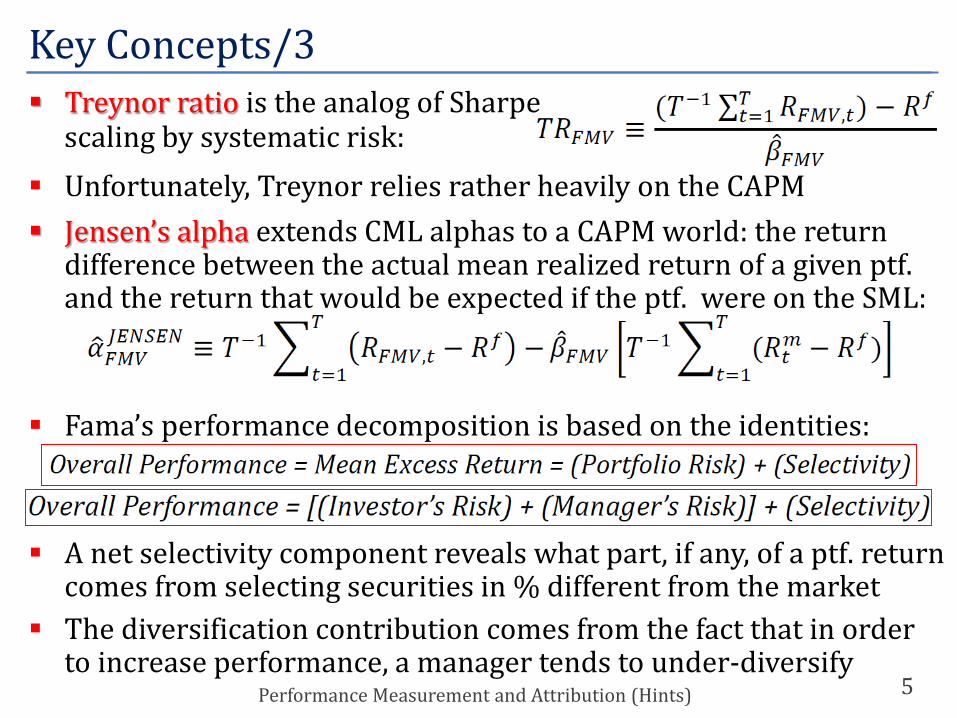
Treynor ratio is the analog of Sharpescaling by systematic risk:
Unfortunately, Treynor relies rather heavily on the CAPM Jensen’s alpha extends CML alphas to a CAPM world: the return
difference between the actual mean realized return of a given ptf. and the return that would be expected if the ptf. were on the SML:
Fama’s performance decomposition is based on the identities:
A net selectivity component reveals what part, if any, of a ptf. return comes from selecting securities in % different from the market
The diversification contribution comes from the fact that in order to increase performance, a manager tends to under-diversify
Performance Measurement and Attribution (Hints)

Skill vs. Luck, that’s the question…
6
We now adopt and ex-post perspective: was asset management successful, given assigned goals?o Assigned goals == preferences of the investors, presumed or effective
The goal of performance analysis is to distinguish skilled from unskilled investment managers. But, how do you tell them apart?o In a population of 100 investment managers, say 5 percent, or 5, should
have exceptional performance by chance aloneo None of the successful managers will admit to being lucky; all of the
unsuccessful managers will cite bad lucko Those with both skill and luck are blessed; they deserve to thrive, and
they willo Those with neither skill nor luck are doomed and will be wiped out by
natural selection. But what about the two other categories? o Managers with skill but no luck will be unjustly expelled from the
industry because their historical performance will not reflect true skill The mere existence of positive returns does not prove skill because
important issues remain: how much risk was taken on in generating that return?
Performance Measurement and Attribution (Hints)

Two types of rewarded skills
7
Two kinds of skill:① Superior risk-adjusted returns can be derived through either superior timing or superior security selection② The ability to diversify the portfolio completely to eliminate all unsystematic risk, relative to the portfolio’s benchmarko When restrictions have been imposed on the operations pursued by
delegated ptf. management (e.g., social responsibility limits to the asset menu, or specialization constraints in terms of asset classes, sectors, countries, etc.), performance measurement represents a crucial step to understand the realized, ex-post costs deriving from such restrictions
The evaluation of portfolio performance is essentially concerned with comparing the return earned by some portfolio with the return earned on one or more benchmarks
It is important that ptfs chosen for comparison are truly comparable, by carrying similar risk and being bound by similar constraints
A first important choice consists of whether total or systematic riskshould be used to perform any risk-adjustment
Performance Measurement and Attribution (Hints)

Two types of rewarded skills
8
Even if the money manager herself may be risk-neutral, it seems appropriate that risk discounting be applied
Total risk is sensible for large, already well-diversified portfolioso For instance, sovereign and endowment funds may easily be ranked in
this way because they will normally find very little comfort in the fact that part of the risk could be diversified away if they held other assets when the portfolio under consideration contains their total asset
Total risk means that indicators based on (say) portfolio variance or standard deviation, for instance, the Sharpe ratio, should be used
Systematic risk is instead sensible when the portfolio is smaller either in size or in breadth, or because constraints have been imposed on its overall diversificationo For instance, a specialized domestic small cap equity fund faces limits to
diversification; risk-adjusting on the basis of its market beta or the set of its betas estimated vs. a range of well-recognized factors is sensible
o A first, simple technique works in the following way: a synthetic portfolio of assets having approximately the same amount of risk is randomly built by drawing securities for a given, wide universe of assets
Performance Measurement and Attribution (Hints)
Peer-group comparisons
9
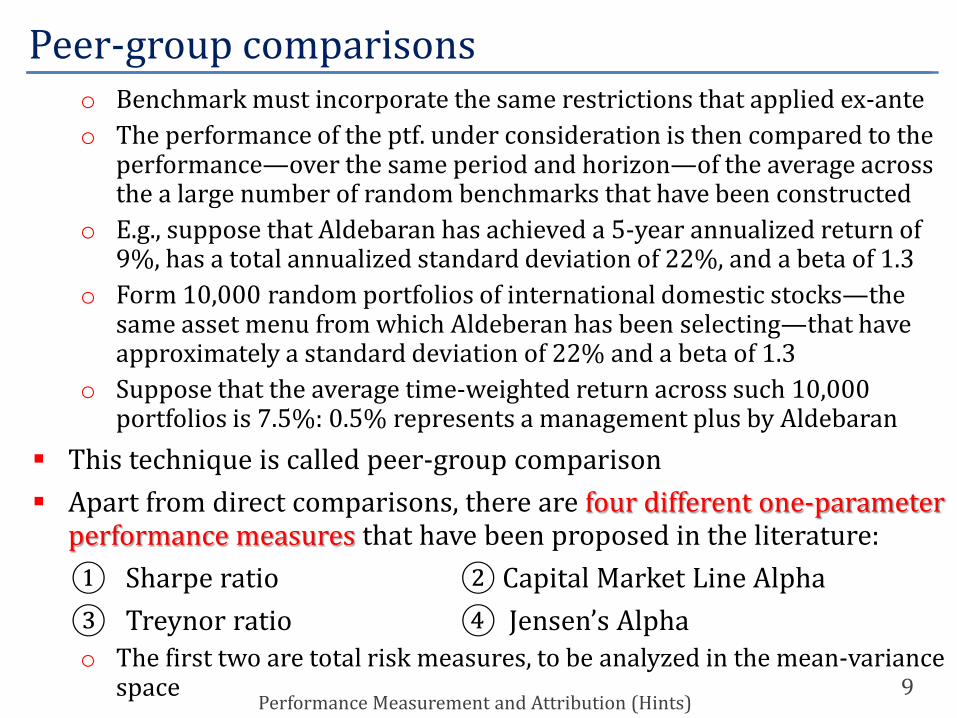
o Benchmark must incorporate the same restrictions that applied ex-anteo The performance of the ptf. under consideration is then compared to the
performance—over the same period and horizon—of the average across the a large number of random benchmarks that have been constructed
o E.g., suppose that Aldebaran has achieved a 5-year annualized return of 9%, has a total annualized standard deviation of 22%, and a beta of 1.3
o Form 10,000 random portfolios of international domestic stocks—the same asset menu from which Aldeberan has been selecting—that have approximately a standard deviation of 22% and a beta of 1.3
o Suppose that the average time-weighted return across such 10,000 portfolios is 7.5%: 0.5% represents a management plus by Aldebaran
This technique is called peer-group comparison Apart from direct comparisons, there are four different one-parameter
performance measures that have been proposed in the literature:① Sharpe ratio ② Capital Market Line Alpha③ Treynor ratio ④ Jensen’s Alphao The first two are total risk measures, to be analyzed in the mean-variance
spacePerformance Measurement and Attribution (Hints)
Sharpe ratio and CML alpha
10
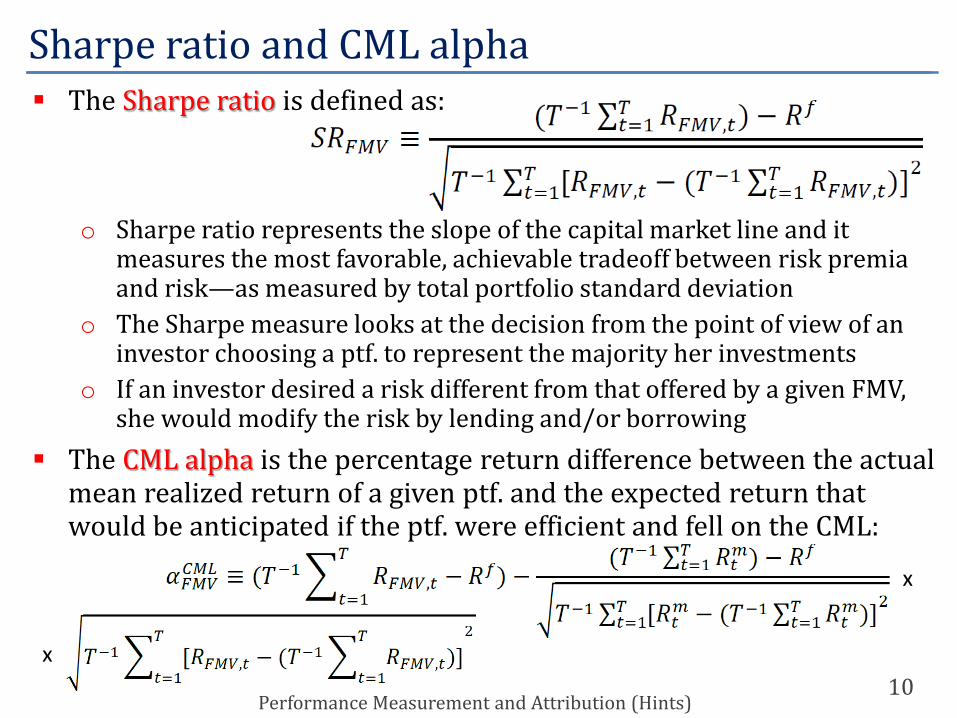
The Sharpe ratio is defined as:
o Sharpe ratio represents the slope of the capital market line and it measures the most favorable, achievable tradeoff between risk premia and risk—as measured by total portfolio standard deviation
o The Sharpe measure looks at the decision from the point of view of an investor choosing a ptf. to represent the majority her investments
o If an investor desired a risk different from that offered by a given FMV, she would modify the risk by lending and/or borrowing
The CML alpha is the percentage return difference between the actual mean realized return of a given ptf. and the expected return that would be anticipated if the ptf. were efficient and fell on the CML:
Performance Measurement and Attribution (Hints)
x
x

Treynor ratio
11
CML alpha measures the plus/minus vs. a naïve strategy of investing in the market ptf.o CML alpha > 0 implies that in mean-standard deviation space, a given
portfolio lies above the CMLo Only ptfs. with positive CML
alpha should be boughto In the figure, two pts. receive a
different ranking from the Sharperatios and CML alpha criteria
o SRB > SRA, but the CML alpha of Aexceeds that of B
The Treynor ratio is:
o The logic of is that a ptf. should be as close as possible to the Security Market Line, ideally positioned on it or even above it
o The expression measures the portfolio’s risk premium per unit of systematic risk
Performance Measurement and Attribution (Hints)

Jensen’s alpha
12
o Comparing a portfolio’s TR value to a similar measure for the market portfolio—which equals the market risk premium as the market’s beta equals 1—indicates whether the portfolio would plot above the SML
o The Treynor measure looks at the decision from the point of view of an investor choosing a ptf. that represents a portion of her financial wealth, and for which the overall contribution to systematic risk needs to be as efficient as possible, i.e., rewarded in a way consistent with CAPM
Jensen’s alpha extends CML alphas to a CAPM/APT world: the return difference between the actual mean realized return of a given ptf. and the return that would be expected if the ptf. were on the SML:
o Jensen’s alpha > 0 implies that in risk premium-beta deviation space, a given portfolio lies above the SML
o Jensen’s alpha can also be directly estimated and its statistical signifi-cance tested, when it is written as the intercept in a regression:
o Extensions to multi-factor, APT-style return models are obviousPerformance Measurement and Attribution (Hints)

The information ratio
13
o Another widely used performance measure is Goodwin’s (1998) information ratio (also known as an signal-to-noise ratio)
o It measures a portfolio’s average return in excess of that of a benchmark portfolio divided by the standard deviation of this excess return:
o Sometimes the numerator is simply stated as the difference between the sample mean excess return on a portfolio and the same quantity for some appropriate benchmark, the average tracking error
o Goodwin (1998) has noted that the Sharpe ratio is a special case of the IR where the risk-free asset is the benchmark portfolio and should be zero for passively managed portfolios
Another important tool consists of performance decompositions: separating skill from luck and different types of skill
The commonly employed performance decomposition is Fama’s(1972): basic premise is that overall performance of a ptf., can be decomposed into measures of risk-taking and security selection skill
Performance Measurement and Attribution (Hints)

Fama’s performance decomposition
14
o If there is a difference between the risk level specified by the investor and the actual risk level adopted by the portfolio manager (in cases where these are separate individuals), this calculation can be further refined to
o Skill = selectivity component, portion of the portfolio’s actual return beyond that available to an unmanaged portfolio with identical systematic risk
o Luck = various forms of risk, compensated
o The Jensen’s alpha for some ptf. A isthe height above the SML, A – A’
o This is (total) return from selectivityo However, A and A' do not have the same
total risk: the risk of portfolio A’ is completely non-diversifiable
Performance Measurement and Attribution (Hints)
SML

SML
Fama’s performance decomposition
15
o Is the extra return measured by the difference A – A’ is worth the extra risk?
o Compare A with a portfolio with a ptf. with the same total risk, A’’
o Only calculations can isolate the coordinates of A’’, i.e., you are not supposed to spot it
o But A’’ is efficient and hence on the SMLo If A’’ has the same risk as A, that has greater
total risk than portfolio A’ has, then
o This implies that
o Hence portfolio A’’ is located to the right of the initial ptf. Ao This show that
Performance Measurement and Attribution (Hints)

SML
Fama’s performance decomposition
16
Net selectivity reveals what part, if any, of the managed ptf. return comes from selecting securities in % different from the market
The diversification contribution comes from the fact that in order to increase performance, a manager tends to under-diversify
A ptf. manager that over time tries and gets a large contribution from net selectivity is said to be an active manager in the cross sectiono The second part of a Fama-style
decomposition occurs to the lefto This further decomposition is
possible only if the customershave specified a desired level of market risk, which is typical of pension funds
o Assume the manager had been assigned a systematic target risk level, say, 𝛽𝛽𝑇𝑇
o The difference in return between E[RA’] and E[RT] is the extra return due tothe manager’s risk appetite (“reach for yield”)
Performance Measurement and Attribution (Hints)

A portfolio manager that over time receives a large contribution to her performance from risk reward is said to be an active manager in the time series dimension
She would be actively changing over time the amount of risk exposure around a define mandate/target level 𝛽𝛽𝑇𝑇
Tactical asset allocation (TAA) is a ptf. management strategy that aims at producing active surplus returns solely through allocation decisionso TAA managers adjust their asset class exposures based on perceived
changes in the relative valuation of those classes o A typical TAA fund shifts money between three asset classes—stocks,
bonds, and cash equivalents—although many definitions of these categories (e.g., large cap versus small cap, long term versus short term) are also used in practice
o Sometimes, ptf. managers do “beta-timing”: when the stock market is expected to surge (decline), the manager increases (decreases) her portfolio beta to obtain a portfolio with a greater responsiveness to market changes
Tactical asset allocation
17Performance Measurement and Attribution (Hints)