performance measurement chapter 14. sustainable earnings likely level of future cash flows is...
Post on 19-Dec-2015
214 views
TRANSCRIPT

Performance Measurement
CHAPTER
14

Sustainable EarningsSustainable Earnings
• Likely level of Likely level of future cash flowsfuture cash flows is is generated by earningsgenerated by earnings
• Sustainable earnings is net earnings Sustainable earnings is net earnings adjusted for irregular itemsadjusted for irregular items

Irregular ItemsIrregular Items
• Three types of irregular items are Three types of irregular items are reported (all net of taxes)reported (all net of taxes)– Discontinued operationsDiscontinued operations
– Extraordinary itemsExtraordinary items
– Change in accounting principleChange in accounting principle

Discontinued OperationsDiscontinued Operations
• Disposal of a significant segment of a Disposal of a significant segment of a businessbusiness
• Report separately in statement of earningsReport separately in statement of earnings– Earnings (loss) from Earnings (loss) from continuing operationscontinuing operations, ,
andand
– Earnings (loss) from Earnings (loss) from discontinued operationsdiscontinued operations

Discontinued OperationsDiscontinued Operations
• Earnings (loss) from discontinued operations Earnings (loss) from discontinued operations consists of:consists of:– Earnings (loss) from operations andEarnings (loss) from operations and– Gain (loss) on disposal of the segmentGain (loss) on disposal of the segment
• Both components are reported net of Both components are reported net of applicable taxes in a section entitled applicable taxes in a section entitled Discontinued OperationsDiscontinued Operations, which follows , which follows Earnings from Continuing OperationsEarnings from Continuing Operations

Extraordinary ItemsExtraordinary Items
• Events and transactions that are:Events and transactions that are:– Infrequent in occurrenceInfrequent in occurrence– Unusual in natureUnusual in nature– Not subject to management determinationNot subject to management determination

Change in Change in Accounting PrincipleAccounting Principle
• Occurs when the principle used in the current Occurs when the principle used in the current year is different from the one used in the year is different from the one used in the preceding yearpreceding year
• Is permitted, when:Is permitted, when:– There has been a change in reporting There has been a change in reporting
circumstances, andcircumstances, and
– Management can show that the new principle Management can show that the new principle is preferable to the oldis preferable to the old

Comparative AnalysisComparative Analysis
• Three types of Three types of comparisons:comparisons:– Intracompany basisIntracompany basis
– Intercompany basisIntercompany basis
– Industry averages Industry averages

Comparative AnalysisComparative Analysis
• Three tools:Three tools:– Horizontal analysisHorizontal analysis
– Vertical analysisVertical analysis
– Ratio analysisRatio analysis

Horizontal AnalysisHorizontal Analysis
127%127% 121%121% 119%119% 112%112% 100%100%
ANY COMPANY INC.Assumed Net Sales (in thousands)
2005 2004 2003 2002 2001$ 6,562.8 $ 6,295.4 $ 6,190.6 $ 5,786.6 $ 5,181.4
Change since base
period

Vertical AnalysisVertical Analysis
• Expresses each item in a financial statement as a Expresses each item in a financial statement as a percent of a base amount (total assets or net sales)percent of a base amount (total assets or net sales)
ANY COMPANY, INC.ANY COMPANY, INC.Condensed Balance SheetsCondensed Balance SheetsDecember 31 (in thousands)December 31 (in thousands)
20052005 20042004
AssetsAssets Amount Amount PercentPercent AmountAmount PercentPercent
Current assetsCurrent assets
Property, plant, and Property, plant, and equipment equipment
Other assetsOther assets
Total assetsTotal assets
$1,496.5$1,496.5
2,888.82,888.8
666.2666.2
$5,051.5$5,051.5
29.6%29.6%
57.2%57.2%
13.2% 13.2%
100.0%100.0%
$1,467.7$1,467.7
2,733.32,733.3
636.6636.6
$4,837.6$4,837.6
30.1%30.1%
56.9%56.9%
13.0%13.0%
100.0%100.0%

Liquidity Ratios
Measure short-term ability of the enterprise to pay its maturing obligations and to meet unexpected needs for cash
Profitability Ratios
Measure the earnings or operating success of an enterprise for a given period of time
Solvency Ratios
Measure the ability of the enterprise to survive over a long period of time
Revenues Expenses
- = Net Earnings
XYZ Co.
Since 1892
Ratio AnalysisRatio Analysis
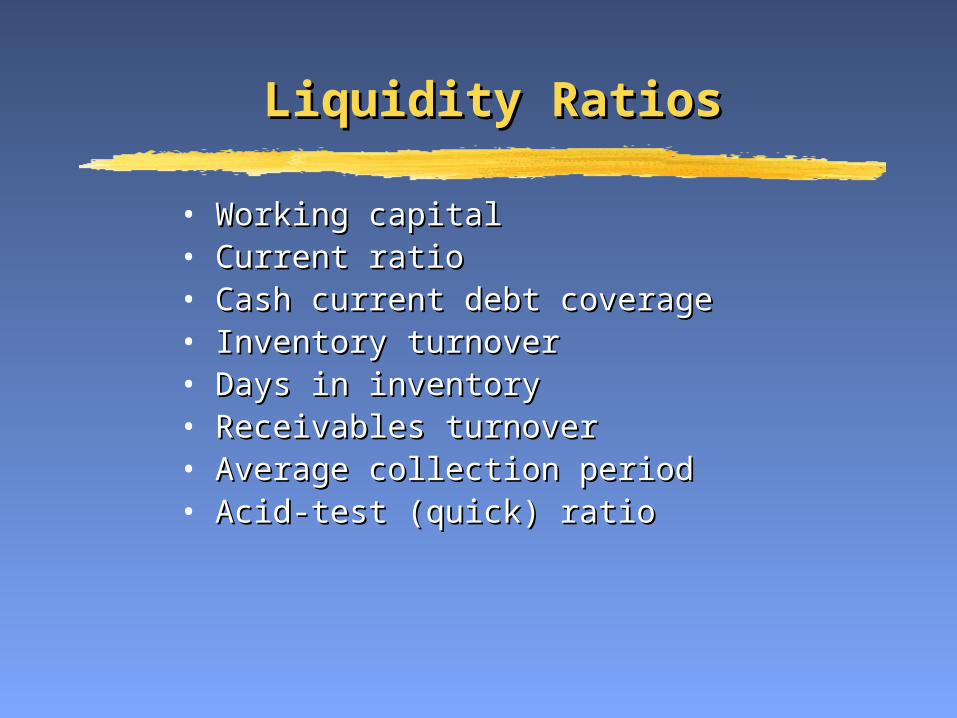
Liquidity RatiosLiquidity Ratios
• Working capitalWorking capital• Current ratioCurrent ratio• Cash current debt coverageCash current debt coverage• Inventory turnoverInventory turnover• Days in inventoryDays in inventory• Receivables turnoverReceivables turnover• Average collection periodAverage collection period• Acid-test (quick) ratioAcid-test (quick) ratio

Working CapitalWorking Capital
• Measures short-term debt-paying abilityMeasures short-term debt-paying ability
Working Capital = Current Assets – Current LiabilitiesWorking Capital = Current Assets – Current Liabilities
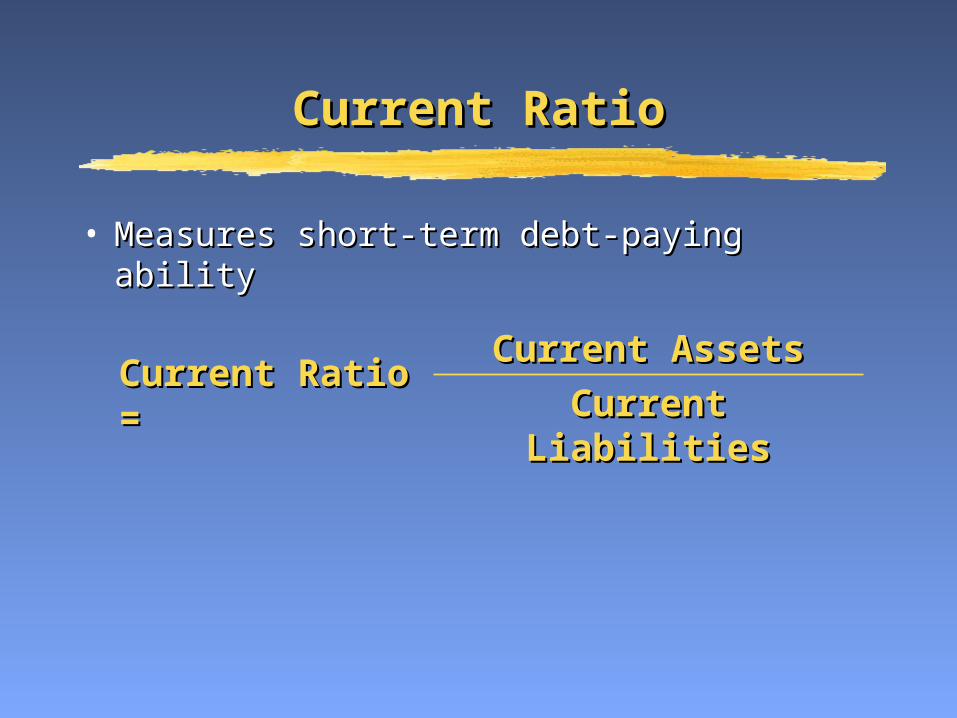
Current RatioCurrent Ratio
• Measures short-term debt-paying abilityMeasures short-term debt-paying ability
Current Ratio =Current Ratio =Current AssetsCurrent Assets
Current LiabilitiesCurrent Liabilities

Cash Current Debt CoverageCash Current Debt Coverage
• Measures short-term debt-paying ability Measures short-term debt-paying ability (cash basis)(cash basis)
Cash Current Debt Cash Current Debt Coverage =Coverage =
Cash Provided Cash Provided by Operating Activitiesby Operating Activities
Average Current LiabilitiesAverage Current Liabilities
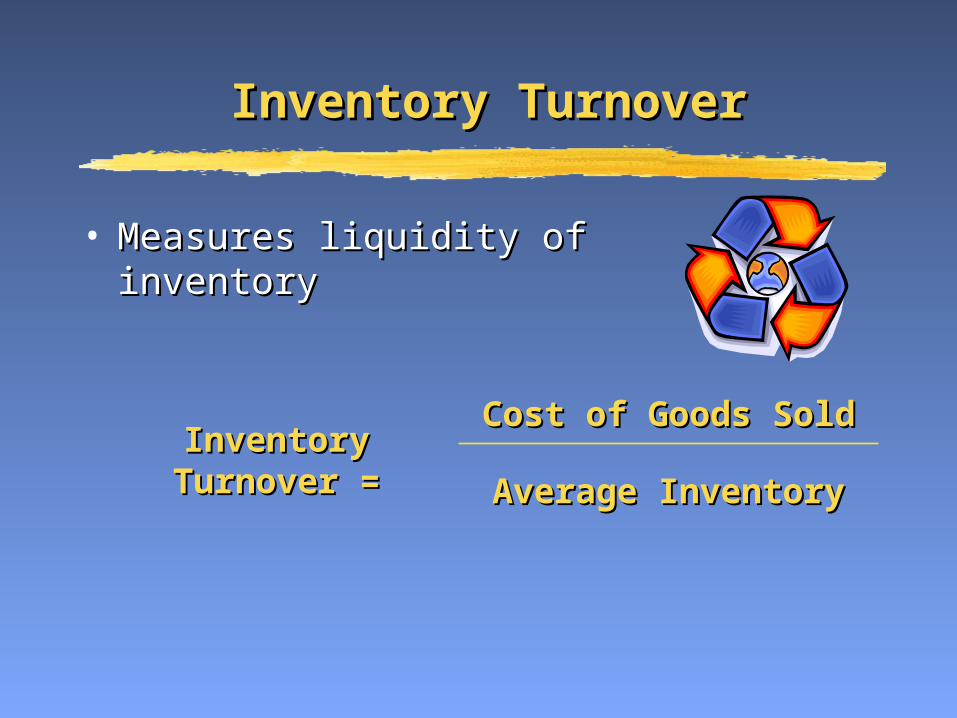
Inventory TurnoverInventory Turnover
• Measures liquidity of inventoryMeasures liquidity of inventory
Inventory TurnoverInventory Turnover ==
Cost of Goods SoldCost of Goods Sold
Average InventoryAverage Inventory

Days in InventoryDays in Inventory
• Measures number of days inventory is on Measures number of days inventory is on handhand
Days in Inventory =Days in Inventory =365 Days365 Days
Inventory TurnoverInventory Turnover

Receivables TurnoverReceivables Turnover
• Measures liquidity of receivablesMeasures liquidity of receivables
Receivables TurnoverReceivables Turnover ==Net Credit SalesNet Credit Sales
Average Gross Average Gross ReceivablesReceivables

Average Collection PeriodAverage Collection Period
• Measures number of days receivables are Measures number of days receivables are outstandingoutstanding
Average Collection Period =Average Collection Period = 365 Days365 Days
Receivables TurnoverReceivables Turnover

Acid-Test RatioAcid-Test Ratio
• Measures immediate short-term Measures immediate short-term debt-paying abilitydebt-paying ability
Acid-Test RatioAcid-Test Ratio ==
Cash + Short-Term Cash + Short-Term Investments + Net Investments + Net
ReceivablesReceivables
Current LiabilitiesCurrent Liabilities

Solvency RatiosSolvency Ratios
• Debt to total assetsDebt to total assets• Cash total debt coverageCash total debt coverage• Times interest earnedTimes interest earned• Free cash flowFree cash flow
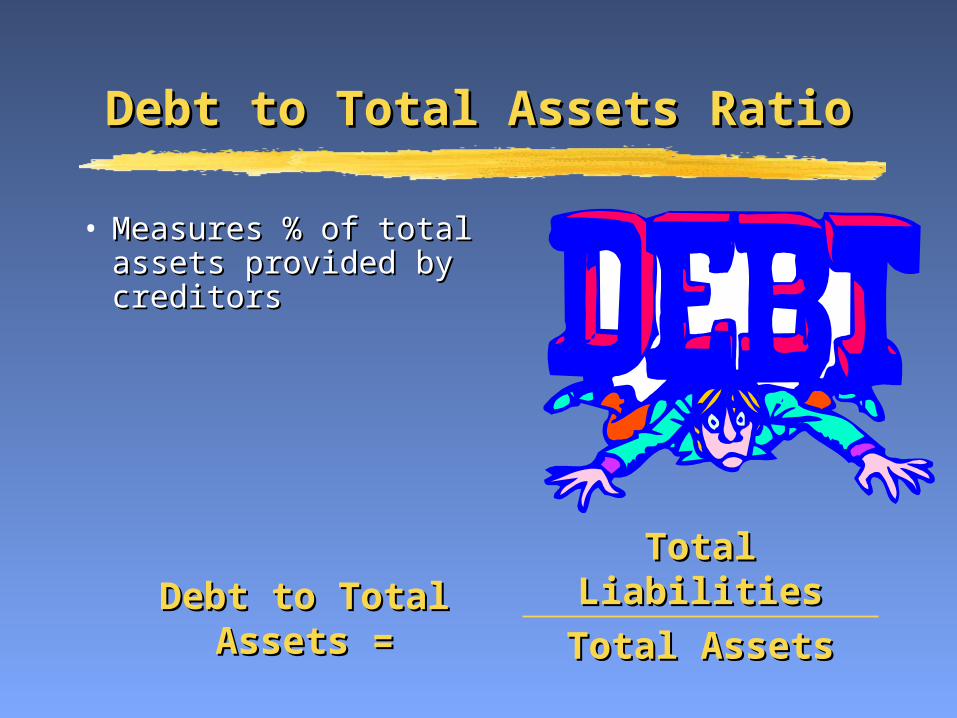
Debt to Total Assets RatioDebt to Total Assets Ratio
• Measures % of total Measures % of total assets provided by assets provided by creditorscreditors
Debt to Total AssetsDebt to Total Assets ==Total LiabilitiesTotal Liabilities
Total AssetsTotal Assets

Cash Total Debt CoverageCash Total Debt Coverage
• Measures long-term debt-paying ability Measures long-term debt-paying ability (cash basis)(cash basis)
Cash Total Debt CoverageCash Total Debt Coverage ==
Cash Provided by Cash Provided by Operating ActivitiesOperating Activities
Average Total Average Total LiabilitiesLiabilities
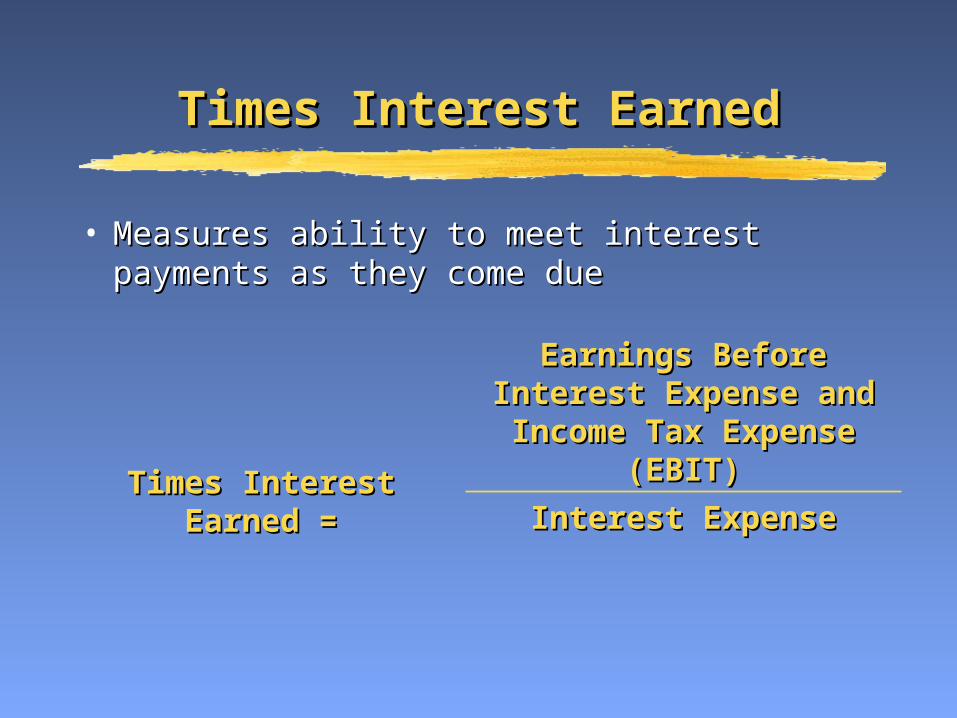
Times Interest EarnedTimes Interest Earned
• Measures ability to meet interest payments Measures ability to meet interest payments as they come dueas they come due
Times Interest Earned =Times Interest Earned =
Earnings Before Interest Earnings Before Interest Expense and Income Tax Expense and Income Tax
Expense (EBIT)Expense (EBIT)
Interest ExpenseInterest Expense

Free Cash FlowFree Cash Flow
• Measures cash available for paying Measures cash available for paying dividends or expanding operationsdividends or expanding operations
Cash Cash Provided Provided
by by Operating Operating ActivitiesActivities
-- Capital Capital ExpendituresExpenditures
-- Dividends Dividends PaidPaid
== Free Free Cash Cash FlowFlow

Profitability RatiosProfitability Ratios
• Earnings per share (EPS)Earnings per share (EPS)• Price-earnings (P-E) ratioPrice-earnings (P-E) ratio• Gross profit marginGross profit margin• Profit marginProfit margin• Return on assetsReturn on assets• Asset turnoverAsset turnover• Return on common shareholders’ equityReturn on common shareholders’ equity• Payout ratioPayout ratio

Earnings Per Share (EPS)Earnings Per Share (EPS)
• Measures net earnings earned on each Measures net earnings earned on each common sharecommon share
Earnings Per ShareEarnings Per Share ==
Earnings Available to Earnings Available to Common ShareholdersCommon Shareholders
Average Number of Average Number of Common SharesCommon Shares

Price-Earnings (P-E) RatioPrice-Earnings (P-E) Ratio
• Measures relationship between market Measures relationship between market price per share and earnings per shareprice per share and earnings per share
Price-Earnings RatioPrice-Earnings Ratio ==Share PriceShare Price
Earnings Per Earnings Per ShareShare

Gross Profit MarginGross Profit Margin
• Measures margin between selling price and Measures margin between selling price and cost of goods soldcost of goods sold
Gross Profit MarginGross Profit Margin ==Gross ProfitGross Profit
Net SalesNet Sales

Profit MarginProfit Margin
• Measures net earnings generated by Measures net earnings generated by each dollar of saleseach dollar of sales
Profit MarginProfit Margin ==Net EarningsNet Earnings
Net SalesNet Sales

Return On AssetsReturn On Assets
• Measures overall profitability of assetsMeasures overall profitability of assets
Return on AssetsReturn on Assets ==Net EarningsNet Earnings
Average Total AssetsAverage Total Assets
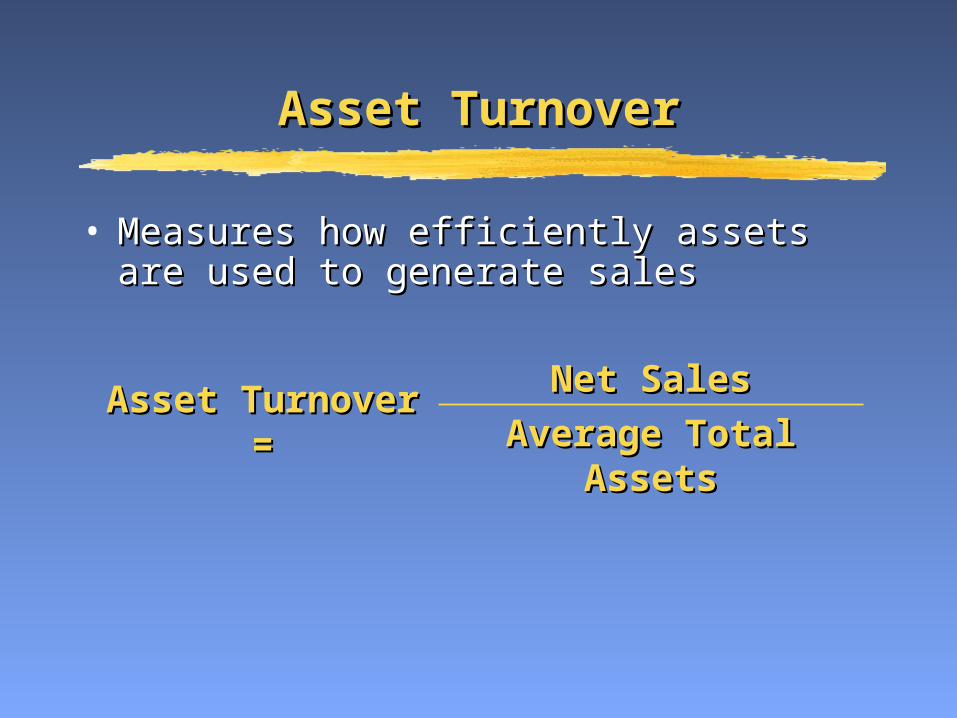
Asset TurnoverAsset Turnover
• Measures how efficiently assets are used to Measures how efficiently assets are used to generate salesgenerate sales
Asset TurnoverAsset Turnover ==Net SalesNet Sales
Average Total AssetsAverage Total Assets

Return on CommonReturn on CommonShareholders’ EquityShareholders’ Equity
• Measures profitability of common Measures profitability of common shareholders’ investmentshareholders’ investment
Return on Common Return on Common Shareholders’ EquityShareholders’ Equity ==
Net Earnings – Net Earnings – Preferred DividendsPreferred Dividends
Average Common Average Common Shareholders’ EquityShareholders’ Equity

Payout RatioPayout Ratio
• Measures % of earnings distributed in the Measures % of earnings distributed in the form of cash dividendsform of cash dividends
Payout RatioPayout Ratio ==Cash DividendsCash Dividends
Net EarningsNet Earnings

Quality of EarningsQuality of Earnings
• Increased importance today due to recent Increased importance today due to recent corporate scandalscorporate scandals
• Can be impacted by alternative accounting Can be impacted by alternative accounting principles (variation and discretion in principles (variation and discretion in selection of GAAP)selection of GAAP)
• Companies report pro forma earnings which Companies report pro forma earnings which are a non-GAAP earnings measureare a non-GAAP earnings measure
• Quality of earnings also affected by improper Quality of earnings also affected by improper recognition of revenues and liabilities recognition of revenues and liabilities