performance of the gses at the metropolitan level
TRANSCRIPT

Performance of the GSEs at the Metropolitan Level
Cityscape 145Cityscape: A Journal of Policy Development and Research • Volume 5, Number 3 • 2001U.S. Department of Housing and Urban Development • Office of Policy Development and Research
Performance of the GSEs atthe Metropolitan LevelPatrick BoxallKRA Corporation
Joshua B. SilverNational Community Reinvestment Coalition
AbstractThis article examines differences in the number and percent of government-sponsoredenterprise (GSE) purchases of single-family loans made to minorities and low- andmoderate-income borrowers in metropolitan statistical areas (MSAs) across the coun-try. The objective of the research was to determine whether differences in the extent ofinstitutional relationships among the GSEs, lending institutions, Government agen-cies, and nonprofit community-based organizations explain differences across MSAsin the GSEs’ purchases of loans made to traditionally underserved populations.
The article begins with a review of the national context for considering GSE perfor-mance at the metropolitan level. The authors show that, across all MSAs, the percent-age of GSE loan purchases that qualify for the affordable housing goals is greatest inmarkets where lenders themselves make more loans to underserved populations andwhere median incomes are relatively high.
The article includes four metropolitan-area case studies that examine the contribu-tion of institutional relationships to GSE purchases of loans made to minority andlow- and moderate-income populations in Washington, D.C.; Houston, Texas; Co-lumbus, Ohio; and Pittsburgh, Pennsylvania. The authors find that the GSEs pur-chase higher percentages of loans made to underserved populations in case studyareas where linkages are the strongest between the GSEs and the local affordablehousing system. They conclude that institutional relationships can bolster the GSEs’efforts to serve minority and low- and moderate-income populations.
The article concludes with recommendations regarding local planning processes, thenational GSE affordable housing goals, and the GSE data reporting system.
The Federal Housing Enterprises Financial Safety and Soundness Act of 1992 acknowl-edged the special role that the Federal National Mortgage Association (Fannie Mae) andthe Federal Home Loan Mortgage Corporation (Freddie Mac), the two major housing-related Government-sponsored enterprises (GSEs), must play in extending the availabilityof mortgage credit. Through this legislation, Congress directed the U.S. Department of
Boxall and Silver
146 Cityscape
Housing and Urban Development (HUD) to devise quantifiable, national goals that wouldhold the GSEs accountable for financing housing traditionally underserved by the mort-gage market.
The resulting GSE affordable housing goals target housing for low- and moderate-incomefamilies, as well as loans made in underserved areas, and mortgages to benefit familieswith very low incomes. The goals are expressed as national percent-of-business or dollar-volume targets, which the GSEs are required to make a good-faith effort to meet annually,under threat of sanction by the HUD Secretary. Since introduction of the housing goals in1993, HUD has implemented several changes to increase the share of the GSEs’ businessthat must finance housing for targeted families and neighborhoods. HUD has announcedplans for the affordable housing goals for the year 2000 and beyond that would requireadditional increases in the GSEs’ support for targeted housing.1
Study ObjectivesTo inform HUD’s reevaluation of the housing goals, this study investigated the GSEs’activities at the metropolitan level. The rationale for the study was essentially twofold.
First, the study aimed to address the information vacuum that currently exists regardingthe GSEs’ activity at the subnational level. Although the affordable housing goals providea consistent, annual gauge of the GSEs’ aggregate activity, little is known about how theGSEs perform locally. This is a significant gap in HUD’s understanding of the GSEsbecause, despite recent consolidation in the mortgage industry, the vast majority of lend-ing decisions are still made in the context of local economic conditions and demographiccharacteristics. Accordingly, the opportunity for the GSEs to finance housing for tradi-tional underserved borrowers and communities depends on local lending activity, and theopportunity for lenders in a particular metropolitan area to extend credit to targeted bor-rowers and communities depends on GSE activity. The study therefore examined howFannie Mae and Freddie Mac perform when the national affordable housing goal mea-sures are applied at a metropolitan level.
Second, the study examined how Fannie Mae’s and Freddie Mac’s relationships withmortgage and housing industry institutions influence their respective performance at themetropolitan level. The GSEs have, of course, always interacted with lenders and otherpublic- and private-sector institutions that operate in local housing markets. However,these relationships have taken on additional import in the context of the housing goals.As demonstrated by the GSEs’ annual housing activities reports to HUD, Fannie Mae andFreddie Mac have relied in part on localized strategies to help achieve their regulatoryobligations. There can be little doubt that these efforts—such as experiments with newmortgage products, financial and capacity-building support for affordable housing devel-opers, and, in some instances, the opening of satellite offices—have increased the profileof the GSEs at the local level. However, little is known about the significance of theseinitiatives in terms of the GSEs’ affordable housing goal performance. This study aimedto fill this gap.
The GSEs’ Relationships With Housingand Mortgage Industry InstitutionsTo facilitate the investigation of these issues, the study adopted a conceptual frameworkregarding the GSEs’ relationships with metropolitan-area housing and mortgage industryinstitutions. This framework differentiates between the relationships that the GSEs havebuilt as part of two systems related to the delivery of housing credit. Though distinct, thetwo systems interact at the local level.
Performance of the GSEs at the Metropolitan Level
Cityscape 147
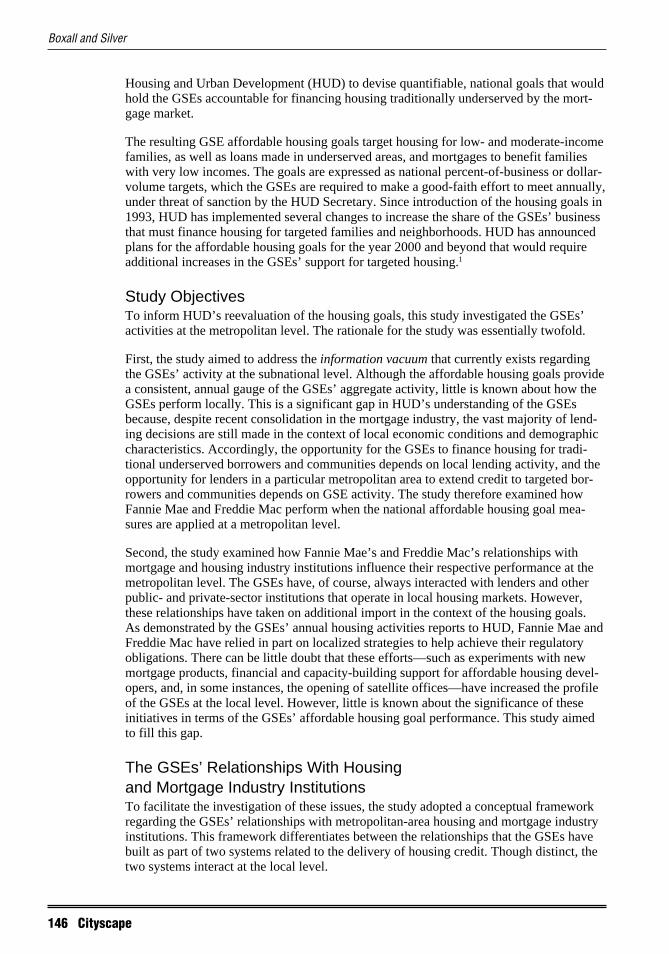
The first system—referred to here as the GSEs’ business system—is composed of therelationships between the GSEs and lenders (and, through them, borrowers) and capturesthe GSEs’ traditional function in providing a secondary mortgage market (see exhibit 1).Fannie Mae and Freddie Mac sign contracts with lenders that, in simple terms, commitlenders to deliver specified volumes of different mortgage products at negotiated prices.For example, forward commitments (or special negotiated commitments on loans alreadyclosed) stipulate the type, dollar volume, underwriting guidelines, and pricing formulasfor lenders’ deliveries to the GSEs, with penalties for failing to do so by the contract date.Lenders can also enter into standby (usually flow) commitments that lock in certain loanparameters, including underwriting deviations, but do not require delivery to the GSEs.Regardless of the nature of the commitment, a sale, once agreed to, becomes mandatory,with associated penalties for nondelivery.
Such contractual relationships figure prominently in the GSEs’ ability to penetrate spe-cific metropolitan housing markets—in order to purchase loans in a particular area,Fannie Mae or Freddie Mac must have a business relationship with lenders that are activein that area. However, with consolidation of the banking and mortgage industries, thesecontracts often function at a national or regional (that is, multistate) level, giving lendersfull discretion over the geographic origin and other characteristics of loans that are actu-ally sold to the GSEs. Therefore, although the GSEs’ business relationships with lendersare a necessary precondition for their purchase of loans in a given metropolitan area, theyare not sufficient to guarantee that many loans originating from that area will meet therequirements of the national affordable housing goals.
Exhibit 1
GSEs’ Core Business System
GSEs Lenders Borrowers
Economic and demographic conditions
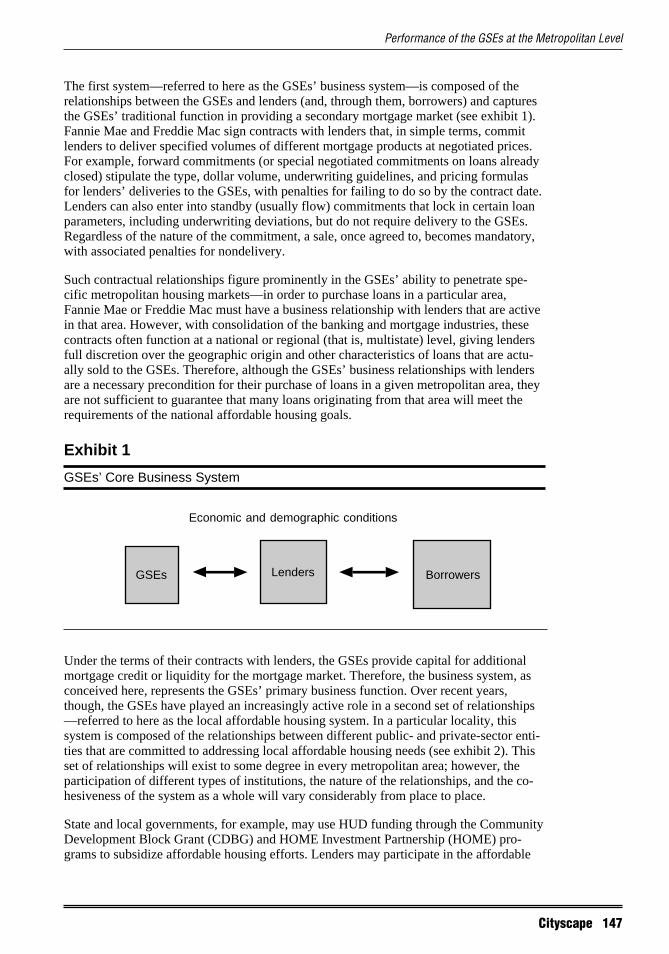
Under the terms of their contracts with lenders, the GSEs provide capital for additionalmortgage credit or liquidity for the mortgage market. Therefore, the business system, asconceived here, represents the GSEs’ primary business function. Over recent years,though, the GSEs have played an increasingly active role in a second set of relationships—referred to here as the local affordable housing system. In a particular locality, thissystem is composed of the relationships between different public- and private-sector enti-ties that are committed to addressing local affordable housing needs (see exhibit 2). Thisset of relationships will exist to some degree in every metropolitan area; however, theparticipation of different types of institutions, the nature of the relationships, and the co-hesiveness of the system as a whole will vary considerably from place to place.
State and local governments, for example, may use HUD funding through the CommunityDevelopment Block Grant (CDBG) and HOME Investment Partnership (HOME) pro-grams to subsidize affordable housing efforts. Lenders may participate in the affordable
Boxall and Silver
148 Cityscape
housing system by offering first mortgages that are often accompanied by subsidizedsecond mortgages. Other contributors to local affordable housing efforts may includenonprofit and for-profit developers, housing counseling agencies, local housing partner-ships, and the local or regional offices of national housing intermediaries.
Exhibit 2
Local Affordable Housing System
GSEs Borrowers
Economic and demographic conditions
Lenders
Public sector andother local institutions
For their part, the GSEs have become active participants in local affordable housing sys-tems through various initiatives. A high-profile example is the wide range of support forlocal affordable housing efforts provided by Fannie Mae’s local partnership offices.Freddie Mac also has participated in community-based initiatives such as the provisionof technical and financial support for the nonprofit housing industry. Furthermore, bothGSEs have undertaken initiatives to tailor their underwriting criteria in particular localesso they can purchase publicly and privately subsidized mortgages.
Through their combined efforts, this diverse set of institutions can influence the flow ofcapital, technical assistance, and political support for the provision of affordable housingin a particular metropolitan area. However, the strength of a local affordable housingsystem—and the GSEs’ participation in that system—will not necessarily improve theGSEs’ performance pursuant to the affordable housing goals. Even if a local affordablehousing system generates a large volume of loans for underserved populations and com-munities, this will only improve Fannie Mae’s and Freddie Mac’s performances if theGSEs and area lenders have business relationships that will deliver the loans to the sec-ondary market.
In short, the study’s underlying premise was that the GSEs will perform best in financingunits targeted by the affordable housing goals in metropolitan areas in which there is aconvergence of the GSEs’ business system and the local affordable housing system. Nei-ther element is sufficient alone to guarantee the performance of the GSEs at the metro-politan level. However, in metropolitan areas in which the GSEs have strong businessrelationships with local lenders and there is a strong local affordable housing system, itwill be easier for the GSEs to target housing that meets the GSE affordable housing goals.

Performance of the GSEs at the Metropolitan Level
Cityscape 149
This is especially likely, we hypothesize, in metropolitan areas in which the GSEs havecollaborated with other housing and mortgage institutions to develop mortgage productstailored to local housing needs.
An additional element of the study’s conceptual framework is the impact of national andlocal economic conditions and demographic characteristics. As demonstrated by exhibits1 and 2, national and local economic conditions and demographic characteristics are in-cluded here as external influences. Metropolitan housing prices, income levels, employ-ment and population growth, and the national or regional interest rate environment arevariables that clearly influence the ability of the local affordable housing system to fi-nance units that meet the GSEs’ affordable housing goals. In other words, economic anddemographic conditions can either inhibit or facilitate the joint efforts of the business andaffordable housing systems.
Study MethodologyIn investigating the activity of the GSEs at the metropolitan level, this research employeda variety of data sources and methods.
We used existing information on the GSEs’ mortgage purchases to provide a nationalcontext for the study and to examine how Fannie Mae and Freddie Mac perform whenGSE performance measures are applied at the metropolitan level. Two sources were em-ployed: data compiled by HUD in the Public Use Database (PUDB) and data compiled bythe Federal Financial Institutions Examination Council under the auspices of the HomeMortgage Disclosure Act (HMDA). We relied on data for 1995 and 1996, the most recentyears for which data were available when analysis began.
The study also included field visits to four metropolitan areas—Washington, D.C.; Hous-ton, Texas; Columbus, Ohio; and Pittsburgh, Pennsylvania—selected to represent thediversity in the GSEs’ performance at the metropolitan level. Site visits involved inter-views with local representatives of the GSEs and others active in the local affordablehousing system to explain observed differences in the GSEs’ metropolitan performance inlight of the institutional and programmatic strategies the GSEs pursue and the relation-ships the GSEs have with other mortgage industry institutions at a local level. For the casestudy communities, we also used HMDA data to compare GSE performance to bench-marks that take into account differences in metropolitan-area demographics and lendingactivity.
The study focused on the GSEs’ acquisition of loans that finance owner-occupied units(including home purchase, refinance, and home improvement loans). Except to provide anational framework for the study as a whole, this article does not examine GSE activitiesthat finance housing for renters in single-family or multifamily properties. This exclusionwas determined partly by the availability of data to assess GSE performance at the metro-politan level for owner-occupied units (or, rather, the lack of publicly available data to dothe same for renter-occupied units). However, there also is a compelling policy rationalefor confining the analysis to owner-occupied housing: the expansion of homeownershipopportunities remains a top national priority, as initiatives such as the National Home-ownership Strategy clearly demonstrate. The national commitment to homeownershipalso has been evident in HUD’s oversight of the GSEs. In fact, in establishing the currenthousing goals, HUD underscored the GSEs’ responsibility for increasing the availabilityof mortgage credit to homebuyers, especially among minority and lower income popula-tions that traditionally have been underserved.

Boxall and Silver
150 Cityscape
This article provides a case study assessment of the GSEs’ performance in purchasingloans on owner-occupied housing at the metropolitan level. Because of resource con-straints, the study does not attempt to definitively account for performance variations ofthe GSEs at the metropolitan level. However, it does offer important insight into the rela-tionship among GSE performance, institutional structure, and programmatic strategies ona metropolitan level and thereby informs HUD’s deliberations regarding the GSE afford-able housing goals.
Organization of the ArticleThe main body of this article is divided into eight sections. To provide a context for theremainder of the article, section 2 examines the contribution that owner-occupied housingmakes to the GSEs’ performance at the national level. This section also analyzes theGSEs’ performance at the metropolitan level, focusing on differences between FannieMae and Freddie Mac and the relationship that appears to exist between the GSEs’ activ-ity and local demographic and lending characteristics.
Section 3 presents an overview of the metropolitan area case studies. It recaps the study’sconceptual framework, reviews the criteria used to select areas for study, and describescrosscutting methodological issues that apply to all the case studies. The next four sec-tions present the findings from an examination of the GSEs’ performance in four metro-politan areas—Washington, D.C.; Houston, Texas; Columbus, Ohio; and Pittsburgh,Pennsylvania. Each section uses HMDA and other data to compare the GSEs’ perfor-mance to local benchmarks; however, the discussion relies predominantly on insightsgleaned from interviews with affordable housing-sector representatives in each area.
Finally, section 8 summarizes the study’s findings and provides recommendations regard-ing specific actions HUD might want to consider in the ongoing reevaluation of the GSEaffordable housing goals. It specifically examines the potential utility of metropolitanhousing goals (or subgoals), although effecting this would require action by Congress.It also considers measures HUD could implement within its existing mandate.
GSE Housing Goal PerformanceThis section quantifies the performance of Fannie Mae and Freddie Mac in deliveringcredit to traditionally underserved populations and communities, thereby providing acontext for the subsequent case study assessment of the linkages between the GSEs’ per-formance and institutional relationships at a metropolitan level. The discussion is dividedinto two parts. First, it examines GSE performance nationwide, illustrating the contribu-tion made by metropolitan owner-occupied housing to the GSEs’ overall attainment of thehousing goals. Second, it focuses on the GSEs’ purchase of loans on single-family owner-occupied housing in metropolitan areas.
National Affordable Housing Goal PerformanceThrough the national affordable housing goals, HUD holds the GSEs accountable forfinancing traditionally underserved housing populations. On an annual basis, the GSEs arerequired to achieve each of the housing goals, expressed as a percent of units financed oras a dollar value of investments in targeted housing. Specifically, the goals target:
■ Low- and moderate-income housing—housing for families at or below area medianincome.
Performance of the GSEs at the Metropolitan Level
Cityscape 151
■ Underserved areas—housing in low-income neighborhoods or in middle-incomeneighborhoods with concentrations of minorities.
■ Special affordable housing—housing for very low-income families or for low-incomefamilies in low-income areas.
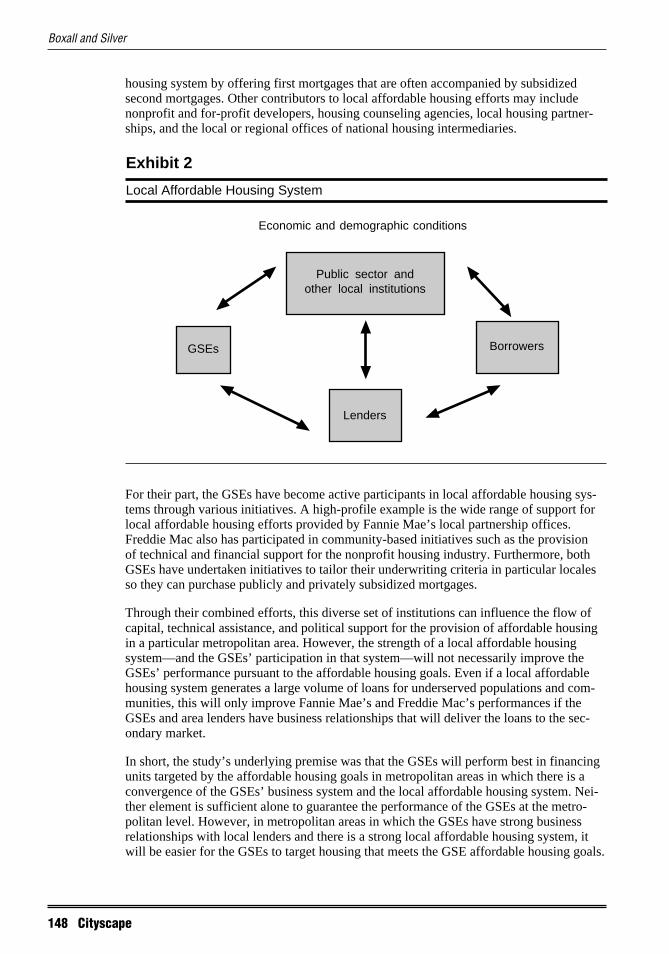
Exhibit 3 presents the affordable housing goals and the GSEs’ performance according tothese goals for 1996, the most recent year for which data were available when the studybegan.2 As indicated, both GSEs achieved all of the percent-of-business goals in 1996.Exhibit 3 also reveals the differential performance of the two GSEs; as in previous years,Fannie Mae outperformed Freddie Mac on each of the goals specified by HUD in 1996.
Although the affordable housing goals provide a framework for GSE accountability, theydo not dictate the GSEs’ business strategies. Rather, HUD allows the GSEs to decidewhat type of units to finance and where to purchase loans to meet the housing goals. As apoint of reference, however, the following discussion examines the contribution that met-ropolitan owner-occupied housing—the focus of this article—makes to the GSEs’ goalattainment. In other words, how important are single-family owner-occupied units locatedin metropolitan areas to the GSEs’ efforts to meet the targets set by HUD?
Exhibit 3
GSEs’ Affordable Housing Goal Performance, 1996
Goal (%)
Low- andModerate-Incomea Underserved Special Affordable
Housing Areasb Housingc
Goal 40.0 21.0 12.0
Fannie Mae 45.6 28.1 15.4
Freddie Mac 41.1 25.0 14.0
a Units occupied by households with income less than or equal to area median income.b Units located in metropolitan census tracts with (a) median family income less than or equal to 90percent of area median income or (b) median family income less than or equal to 120 percent of areamedian income and a population that is at least 30 percent minority. Units located in nonmetropolitancounties with (a) median family income less than or equal to 95 percent of the greater of State ornational nonmetropolitan median income or (b) median family income less than or equal to 120 per-cent of State nonmetropolitan median income and a population that is at least 30 percent minority.c Units occupied by households with income less than or equal to 60 percent of area median incomeor households with income less than or equal to 80 percent of area median income located in low-income areas (census tracts with median income less than or equal to 80 percent of area medianincome).
Source: U.S. Department of Housing and Urban Development, based on analysis of the GSEs’ loan-level data.
Single-family owner-occupied units constitute the bulk of the housing financed by theGSEs’ mortgage purchases at a national level. However, the extent to which the GSEs’business is focused on single-family owner-occupied housing belies the importance ofsingle-family and multifamily rental units to the GSEs’ accomplishment of the affordablehousing goals.

Boxall and Silver
152 Cityscape
The contribution that owner-occupied housing makes to the GSEs’ goal performance isshown in exhibit 4, which reproduces figures that have appeared in previous HUD reports.As indicated, single-family owner-occupied units represent an overwhelming majority ofthe units financed by the GSEs—in 1996, 82 percent of the total units financed by FannieMae and Freddie Mac, or 2,748,185 units. However, owner-occupied units do not consti-tute an equivalent share of the units that qualify for each of the housing goals. Single-family owner-occupied units account for less than three-quarters (72 percent) of theGSEs’ units located in underserved areas, less than two-thirds (65 percent) of the unitsthat qualify for the low- and moderate-income housing goal, and just one-half (50 per-cent) of the units that meet the criteria for the special affordable housing goal. By con-trast, rental housing represented just 18 percent of the GSEs’ combined business in 1996,but a greater share of the units qualifying for each of the housing goals.
Exhibit 4
Contribution of Different Unit Types to the GSEs’ Overall Business and HousingGoal Attainment, 1996
Low- andModerate- Special
Income AffordableHousing Underserved Housing
Unit Type Units Percent Goal Areas Goal Goal
Single-familyowner occupieda 2,748,185 82 65 72 50
Single-family/multifamily rental 587,072 18 35 28 50
Total 3,335,257 100 100 100 100
a This category does not include owner-occupied units in two- to four-unit properties.
Sources: Compiled from Manchester, Paul B., Characteristics of Mortgages Purchased by Fannie Maeand Freddie Mac: 1996–97 Update, Working Paper No. HF–006 (August 1998), U.S. Department ofHousing and Urban Development; and DiVenti, Theresa R., The GSEs’ Purchases of Single-FamilyRental Property Mortgages, Working Paper No. HF–004 (March 1998), U.S. Department of Housingand Urban Development.
In addition to its focus on single-family owner-occupied housing, this study profiles theGSEs’ activities in metropolitan areas. To reiterate, HUD does not dictate where the GSEsmust purchase loans to meet the housing goals. Not surprisingly, however, exhibit 5 re-veals that a clear majority of the single-family units financed by the GSEs are located inmetropolitan areas—85.7 percent in 1996. Exhibit 5 also indicates the extent to whichowner-occupied housing located in metropolitan and nonmetropolitan areas qualify foreach of the housing goals. As shown, loans on owner-occupied housing in metropolitanareas are more likely to meet the low- and moderate-income and special affordable hous-ing goals than loans on similar housing in nonmetropolitan areas. Approximately 35.8 and10.3 percent of owner-occupied units located in metropolitan areas qualify for these goals,respectively, compared to 27.6 and 6.4 percent of similar nonmetropolitan units. How-ever, for the underserved areas goal this pattern is reversed: the share of GSE-financedunits that qualify for this goal in nonmetropolitan areas (36.5 percent) is greater than theshare in metropolitan areas (22.6 percent).
Percentage Share ofGSE-Financed Units ThatQualify for Housing Goals
Share of GSEs’Overall Business

Performance of the GSEs at the Metropolitan Level
Cityscape 153
Exhibit 5 also underlines another aspect of the GSEs’ single-family business that is im-portant for interpreting the study results—the extent to which the GSEs reach the nationalhousing goal targets for the purchase of loans on metropolitan-area single-family owner-occupied units. For all property types combined, Fannie Mae and Freddie Mac exceededeach of the 1996 housing goal targets (as shown in exhibit 3). However, neither GSEachieved the national targets for low- and moderate-income or special affordable housingwith the single-family owner-occupied portion of its business. Therefore, although thisstudy focuses on the most important component of the GSEs’ business in terms of volumeof units financed, the metropolitan area performance levels discussed below do not neces-sarily equal the performance levels that the GSEs are required to, and do, achieve for allunits combined.
Exhibit 5
Share of GSE-Financed, Single-Family, Owner-Occupied Units That Qualify forthe Housing Goals by Metropolitan Area Status, 1996a
Goal
Low- and SpecialShare of Moderate-Income Underserved Affordable
Area Units Housing Areas Housing
Metropolitanb 85.7% 35.8% 22.6% 10.3%
Nonmetropolitan 14.3 27.6 36.5 6.4
All 100.0 34.7 24.6 9.7
a Because these figures are derived from loan-level data, they include investor-owned, renter-occupied units.b In this and subsequent tables, metropolitan areas consist of metropolitan statistical areas andprimary metropolitan statistical areas designated by the Office of Management and Budget.
Source: Compiled from the GSE Public Use Database, Single-Family Properties Census Tract File,1996.
Metropolitan-Area PerformanceThe remainder of this section presents results from an assessment of Fannie Mae andFreddie Mac performances in each of the Nation’s metropolitan areas, reproducing on ametropolitan level the same measures used by HUD to assess GSE performance nation-ally. It is intended to answer a number of questions. Clearly, GSE performance will varyacross metropolitan areas, but do the disparities between Fannie Mae and Freddie Macperformances at a metropolitan level parallel differences nationwide? How does the per-formance of the GSEs compare to the performance of primary lenders that operate inmetropolitan-area affordable housing systems? The analysis here is predominantly de-scriptive and is not designed to explain performance variations between the GSEs oracross metropolitan areas. Nevertheless, it does describe some of the relationships thatappear to exist between GSE performance and primary market and demographic charac-teristics at a metropolitan level.
This section focuses entirely on loans for single-family owner-occupied units in metro-politan areas. Furthermore, to facilitate comparisons with the primary lending market, theanalysis is limited to conventional, conforming loans, which comprise the overwhelmingmajority of Fannie Mae and Freddie Mac purchases. The analysis uses HMDA Loan/Application Register data instead of the PUDB. This choice permits direct comparison of

Boxall and Silver
154 Cityscape
the GSEs with primary market lenders, but also was dictated by the level of detail pub-licly accessible in the two data sources: it is not possible to distinguish between mort-gages on owner-occupied versus rental properties using the PUDB single-family censustract file. Although there are a number of concerns regarding the quality and coverage ofthe HMDA data, previous HUD research has demonstrated the comparability of theHMDA data and HUD’s proprietary version of the GSE database.3
Exhibit 6 demonstrates the variations that exist in the GSEs’ performance at the metro-politan level. The exhibit shows the extent to which GSE-financed owner-occupied unitsqualify for each of the affordable housing goals in metropolitan areas, as expressed bytwo statistics: the share of all metropolitan area units, combined, that qualify for the goalsand the average share of units that qualify for the goals, calculated across all metropolitanareas on an unweighted basis—that is, each metropolitan statistical area (MSA) or pri-mary metropolitan statistical area (PMSA) is given equal weight regardless of loan vol-ume.4 For both GSEs, the average percent of loan purchases that meet each of the housinggoals is less than the weighted share for all metropolitan loans combined. Therefore, inmetropolitan areas where they purchase a greater volume of loans, the GSEs achieve ahigher performance level in terms of the share of loans that qualify for the housing goals.This finding underscores the importance of the GSEs’ business system—that is, theircontractual relationship with lenders—in determining performance at the metropolitanlevel.
Exhibit 6 also illustrates the relative performance of the GSEs compared with primarymarket lenders and with each other. The exhibit shows that the percent of primary marketloans that qualify for the housing goals consistently outpaced the performance of bothGSEs. The exhibit also demonstrates that Fannie Mae consistently, though marginally,outperformed Freddie Mac in the purchase of targeted single-family owner-occupiedloans in 1996. For example, 38.0 percent of the single-family owner-occupied units thatFannie Mae assisted in metropolitan areas met the low- and moderate-income housinggoal, compared to 36.6 percent of the units assisted by Freddie Mac. However, it shouldbe noted that the ratio of Fannie Mae to Freddie Mac performance for the type of unitsshown here—single-family owner-occupied units financed by conventional, conformingloans and located in metropolitan areas—is not as great as that exhibited for all unitscombined on a national level (see exhibit 3).
Exhibit 7 further reveals the nature of the GSEs’ relative performance at the metropolitanlevel. The exhibit shows that although, on average, Fannie Mae outperformed FreddieMac when the national housing goal measures are applied at the metropolitan level, thereis a significant portion of metropolitan areas where the reverse is true. For each housinggoal, metropolitan areas were divided into three groups: metropolitan areas in which theshare of Fannie Mae’s purchases meeting the goal exceeded the corresponding measurefor Freddie Mac by 10 percent (not percentage points), areas in which Freddie Mac out-performed Fannie Mae according to the same criterion by 10 percent, and areas in whichthe GSEs were within 10 percent of each other. As exhibit 7 shows, Fannie Mae outper-formed Freddie Mac according to this standard in at least one-third (32 percent) of allmetropolitan areas for each of the housing goals. However, Freddie Mac also outper-formed Fannie Mae in between 12 percent (low- and moderate-income housing goal) and18 percent (special affordable housing goal) of all metropolitan areas.

Performance of the GSEs at the Metropolitan Level
Cityscape 155
Exhibit 7
GSEs’ Relative Housing Goal Performance in Metropolitan Areas, 1996a
Goal
Low- and SpecialShare of Metropolitan Moderate-Income Underserved Affordable
Areas in Whichb Housing Areas Housing
Fannie Mae > Freddie Mac 32% 42% 49%
Fannie Mae = Freddie Mac 56 41 33
Freddie Mac > Fannie Mae 12 17 18
Total 100 100 100
a Single-family owner-occupied units financed by conventional, conforming loans originated and/orpurchased by an HMDA respondent in 1996.b For each housing goal, metropolitan areas were divided into three categories based on the GSEs’relative performance. “Fannie Mae = Freddie Mac” means that there is a less than 10-percent differ-ence in the share of Fannie Mae and Freddie Mac loans that meet a particular goal—56 percent ofmetropolitan areas fell into this category for the low- and moderate-income housing goal. The othertwo categories include metropolitan areas in which one of the GSEs outperformed the other by 10percent or more.
Source: Compiled from HMDA Loan/Application Register data, 1996.
Exhibit 6
Share of GSE- and Primary Lender-Financed Units That Qualify for the HousingGoals in Metropolitan Areas, 1996a
Goal
Low- and Moderate- Underserved Special AffordableIncome Housing Areas Housing
Fannie Freddie Primary Fannie Freddie Primary Fannie Freddie PrimaryMae Mac Lendersb Mae Mac Lenders Mae Mac Lenders
All Metropoli- 38.0% 36.6% 43.0% 22.0% 19.8% 27.3% 11.0% 10.3% 16.3%tan area loanscombined
Metropolitan 33.8 32.2 41.4 20.3 19.0 26.6 9.5 8.6 15.7area averagec
a Single-family owner-occupied units financed by conventional, conforming loans originated and/orpurchased by an HMDA respondent in 1996.b Primary lenders consist of all HMDA respondents, including both depository and nondepositoryinstitutions. The performance data for primary lenders indicate the share of units financed (originatedand/or purchased) by HMDA respondents that qualify for each of the GSE housing goals. For ex-ample, in the average metropolitan area, 41.4 percent of units financed by primary lenders in 1996met the requirements of the low- and moderate-income housing goal.c The unweighted average share of units qualifying for each of the GSE housing goals across metro-politan areas.
Source: Compiled from HMDA Loan/Application Register data, 1996.

Boxall and Silver
156 Cityscape
To investigate the relationship between the GSEs’ performances at the metropolitan leveland local lending and demographic characteristics, metropolitan areas were divided intofour equal groups (or quartiles) based on a number of measures. For each group of metro-politan areas, the percent of the GSEs’ business meeting the housing goals was calculated.Exhibit 8 presents the results of this analysis.
The first metropolitan-area characteristic shown is the total volume of conforming, con-ventional loans originated (or purchased) by the primary market lenders in 1996. Accord-ingly, the first quartile represents metropolitan areas in which the volume of primarymarket lending was lowest and the fourth quartile represents metropolitan areas in whichthe greatest number of loans were originated. As exhibit 8 indicates, for the low- andmoderate-income and special affordable housing goals, there is a clear relationship be-tween the GSEs’ performance and activity in the primary market. Proportionately, bothGSEs purchased a greater share of loans targeted according to these two housing goalsin metropolitan areas in which the volume of originations was greatest. For example, anaverage of 26.1 percent of loans purchased by Fannie Mae in metropolitan areas in whichthe loan volume was lowest met the low- and moderate-income housing goal, whereas36.9 percent of Fannie Mae’s loans met this goal in areas with the greatest primary marketloan volume. In markets in which there was a greater demand for mortgages, lenders (andthrough them, the GSEs) were more likely to serve households targeted by the affordablehousing goals.
The linkage between the GSEs’ activity and the local primary lending market is, if any-thing, more clearly demonstrated by the metropolitan-area characteristics presented in thenext three panels of exhibit 8—the share of primary-lender loans that qualified for each ofthe housing goals. Not surprisingly, both GSEs purchased the greatest share of loans thatmet all three of the housing goals in metropolitan areas in which the greatest share ofprimary market loans qualified for the housing goals (fourth quartile). They purchased thefewest loans proportionately in metropolitan areas in which the smallest share of primarymarket loans qualified (first quartile). As suggested by the study’s conceptual framework,the performance of GSEs should, all other things being equal, improve along with theperformance of the local affordable housing system.
Finally, exhibit 8 examines the relationship between Fannie Mae and Freddie Mac perfor-mance and median family income. Our conceptual model acknowledges that the perfor-mance of the GSEs at the metropolitan level will be determined, to a certain extent, by ametropolitan area’s demographic, housing market, and economic characteristics. Thispremise is substantiated, at least for two housing goals.
As exhibit 8 indicates, the share of the GSEs’ loans that qualified for the low- and moderate-income and special affordable housing goals increased with greater metropolitan-areaincome levels. For example, in metropolitan areas in which average income levels werelowest (first quartile), just 6.4 percent of the conventional, conforming loans financed byFannie Mae qualified for the special affordable housing goal. By contrast, 12.2 percent ofFannie Mae’s purchases qualified for the same goal in metropolitan areas with the great-est incomes (fourth quartile), or nearly twice the rate in areas with the lowest incomes. Inmetropolitan areas with higher incomes, it is easier for lower income families to qualifyfor conventional, conforming loans and therefore more likely, all other things being equal,that loans financed by Fannie Mae and Freddie Mac will qualify for the GSE goals thattarget affordable housing.

Performance of the GSEs at the Metropolitan Level
Cityscape 157
Exhibit 8
Share of GSE-Financed Units That Qualify for the Housing Goals byMetropolitan-Area Primary Market and Demographic Characteristics, 1996a
Goal
Low- and Special Moderate-Income Underserved Affordable
Housing (%) Areas (%) Housing (%)
Characteristic/ Fannie Freddie Fannie Freddie Fannie FreddieGroupingb Mae Mac Mae Mac Mae Mac
Primary-lender originations and purchasesc
1st quartile 26.1 25.0 20.4 18.5 7.2 6.5
2nd quartile 33.7 31.9 20.7 19.4 9.3 8.1
3rd quartile 36.5 34.6 19.3 18.2 10.4 9.6
4th quartile 36.9 35.4 20.9 19.8 10.5 9.8
Loans that qualify for goals.d
1st quartile 22.9 21.5 12.8 11.0 6.7 6.2
2nd quartile 30.0 29.4 16.5 15.0 8.3 7.5
3rd quartile 37.8 35.6 19.8 19.2 10.4 9.3
4th quartile 42.5 35.6 32.1 30.6 12.1 11.0
Median family incomee
1st quartile 23.8 22.8 21.0 20.0 6.4 5.52nd quartile 32.0 30.7 18.6 17.5 8.9 8.33rd quartile 37.5 35.2 18.8 17.4 10.6 9.54th quartile 41.8 39.9 22.7 21.3 12.2 11.2
a Single-family owner-occupied units financed by conventional, conforming loans originated and/orpurchased by an HMDA respondent in 1996.b For each characteristic, metropolitan areas are divided into four equal groups or quartiles. The firstquartile includes metropolitan areas in which the characteristic is lowest in occurrence; the fourthquartile includes metropolitan areas in which the characteristic is highest in occurrence.c The number of loans originated or purchased by HMDA respondents in 1996. For example, in metro-politan areas in which the volume of loan originations and purchases by primary lenders was lowest(i.e., the first quartile), an estimated 26.1 percent of the single-family owner-occupied units financedby Fannie Mae qualified for the low- and moderate-income housing goal.d The share of loans originated or purchased by HMDA respondents that qualified for each of the GSEhousing goals.e Area median family income, 1996.
Source: Compiled from HMDA Loan/Application Register data, 1996.
Metropolitan-Area
Boxall and Silver
158 Cityscape
Not surprisingly, the relationship between metropolitan-area income and the underservedareas goal is not as clear cut. The percent of loans financed by the GSEs that qualified forthis goal was relatively high in metropolitan areas with the highest average income (fourthquartile), but it was also relatively high where incomes were lowest (first quartile). In addi-tion to overall income levels, the extent to which GSE-financed loans in a particular metro-politan area qualify for the underserved areas goal is likely to depend on demographiccharacteristics that do not appear in exhibit 8. These might include spatial variation infamily income, the portion of the area’s population that consists of minorities, and theextent to which the minority population is concentrated geographically.
ConclusionThis section shows that although metropolitan-area owner-occupied housing—the focusof this article—is the most important component of the GSEs’ business in terms of vol-ume, it makes a smaller contribution to the GSEs’ attainment of the affordable housinggoals. Single-family owner-occupied units are an overwhelming majority of the unitsfinanced by the GSEs (82 percent in 1996), but a smaller share of those financed byFannie Mae and Freddie Mac that qualify for each goal.
This section also shows that Fannie Mae does better than Freddie Mac, on average, whenthe affordable housing goals are applied to single-family loan purchases at the metropoli-tan level, just as it does nationwide for all units combined. However, this pattern is notuniversal. In a significant number of metropolitan areas (at least 1 in 10), Freddie Macoutperforms Fannie Mae by a margin of 10 percent or more.
Finally, this section indicates how the GSEs’ purchase of qualifying loans compares tovarious primary market and demographic benchmarks. At the metropolitan level, lendersdo better than both GSEs, on average, under all three housing goals. Having said that,the GSEs’ activity clearly is influenced by what happens in a metropolitan area’s primarymarket. The GSEs do better according to the housing goals in areas in which primarylenders also perform best. Furthermore, the GSEs purchase the greatest number ofincome-targeted loans (loans that qualify for the low- and moderate-income and specialaffordable housing goals) in metropolitan areas that have the greatest volume of primarymarket activity. The GSEs also are more likely to purchase income-targeted loans in areaswith higher incomes. In other words, the performance of the GSEs improves along withthe performance of the local affordable housing system but is sensitive to local economicconditions.
The following sections examine the interaction of these and other factors in four case-study communities.
Overview of the Metropolitan Case StudiesThis section introduces the study’s indepth examination of four metropolitan areas—Washington, D.C.; Houston, Texas; Columbus, Ohio; and Pittsburgh, Pennsylvania—selected to represent the diversity in the GSEs’ performance according to the affordablehousing goal measures at the metropolitan level. The case studies investigate the extent towhich institutional relationships among the GSEs, lenders, public agencies, and nonprofitorganizations influence the volume and proportion of GSE purchases of single-familyhome loans made to underserved populations.

Performance of the GSEs at the Metropolitan Level
Cityscape 159
The section begins with a recap of the study’s conceptual framework. It then summarizesthe criteria used to select the case-study communities, and provides an overview of thestructure of the individual case studies and crosscutting methodological issues.
Sections 4 through 7 present the findings from each case-study community, in turn.A cross-site summary appears in section 8 along with policy implications.
Conceptual Framework for Investigating Institutional RelationshipsAs discussed in section 1, we hypothesize that the GSEs have established two major cat-egories of institutional relationships over the years that interact at the metropolitan level.The first category—referred to here as the GSEs’ business system—is composed of thecontractual relationships between the GSEs and lenders. The GSEs and lenders sign con-tracts that commit the GSEs to purchase a specified number of single-family and multi-family loans at established prices. The second major category of institutional relationshipsis the local affordable housing system, which consists of public- and private-sector enti-ties that are committed to increasing affordable housing opportunities for minority andlow- and moderate-income populations and neighborhoods in a particular locality. Localand national economic conditions and demographic characteristics are included in bothsystems as external influences.
The case studies below investigate our hypothesis that the GSEs will purchase higherlevels of home loans in metropolitan areas in which there is convergence of the businesssystem and the affordable housing system. If the hypothesis approximates reality, theGSEs will purchase low levels of home loans made to traditionally underserved popula-tions in metropolitan areas in which the relationships that make up the business systemare not integrated with the local affordable housing system. For example, the GSEs andlenders may enter into contracts that specify overall purchase goals without targetingloans made to minorities and low- and moderate-income populations. Public agencies andnonprofit community organizations in a given locality may have little influence over thekinds of loans financed by the GSEs because the GSEs’ contractual relationships witharea lenders are developed without regard to the loans’ geographic origins.
In contrast, we hypothesize that either GSE would purchase high levels of home loansmade to minorities and low- and moderate-income borrowers in metropolitan areas inwhich their business system and the local affordable housing system overlap, or are nolonger distinct systems. This might occur, for example, in metropolitan areas in whichlenders, public agencies, and nonprofit organizations design affordable housing productsand then negotiate with either or both GSEs over purchasing targets. Alternatively, theGSEs may participate directly in the design of home-loan products that are tailored to theaffordable housing needs of a particular community.
Economic and demographic conditions can either inhibit or facilitate the joint efforts ofthe business and affordable housing systems. If housing prices are rising faster than theincomes of low- and moderate-income populations, for example, lenders may not be ableto make high numbers of loans to low- and moderate-income borrowers and the GSEswould not be able to purchase considerable numbers of loans made to these borrowers.On the other hand, if income growth outstrips housing price hikes (especially in low- andmoderate-income neighborhoods), affordable housing programs developed by the GSEs,lenders, local public agencies, and nonprofit organizations may thrive, ultimately resultingin high levels of GSE purchases of home loans made in the particular metropolitan area.

Boxall and Silver
160 Cityscape
Selection of the Case-Study Metropolitan AreasTo investigate the hypotheses concerning the GSEs’ institutional relationships, HMDAdata were used to identify metropolitan areas in which the GSEs exhibited distinct levelsof purchasing activity. We calculated the percent of the GSEs’ single-family home loanpurchases that met the criteria for each of the affordable housing goals—the low- andmoderate-income housing goal, the underserved areas goal, and the special affordablehousing goal. Based on a composite of these scores for each GSE in 1995 and 1996, met-ropolitan statistical areas (PMSAs/MSAs) were divided into four categories. One metro-politan area was selected for indepth study from each category:
■ Both GSEs Perform Well. Metropolitan areas in which both GSEs performed wellpursuant to the housing goals (compared to their performance in other metropolitanareas) and in which they both performed at about the same level. In other words, bothFannie Mae and Freddie Mac purchased a high percentage of mortgages that quali-fied for each of the three housing goals. These areas are expected to exhibit a merg-ing of the business and affordable housing systems. In addition, economic and demo-graphic conditions should be conducive to good performance in terms of meeting thehousing goals. Washington, D.C., was selected as a case-study site because it fell intothis category.
■ Fannie Mae Performs Relatively Well. Metropolitan areas in which Fannie Mae didrelatively well compared to its performance elsewhere, whereas Freddie Mac did notperform well. In other words, Fannie Mae purchased a relatively high percentage ofloans that qualified under the three goals, whereas Freddie Mac did not. For FannieMae, the business and affordable housing systems should exhibit convergence. Hous-ton, Texas, was selected because it was in this category.
■ Freddie Mac Performs Relatively Well. Metropolitan areas in which Freddie Macperformed relatively well compared to its performance elsewhere, whereas FannieMae did not. This is the mirror opposite of the preceding category. Freddie Mac pur-chased a relatively high percentage of loans that qualified under the three goals,whereas Fannie Mae did not. For Freddie Mac, the business and affordable housingsystems should merge. Columbus, Ohio, fell into this category.
■ Both GSEs Perform Poorly. Metropolitan areas in which neither GSE performedwell compared with its performance elsewhere and in which they both performedat about the same level. Neither GSE purchased a high level of loans that qualifiedunder the three affordable housing goals. The business system and the affordablehousing system are expected to be separate. Pittsburgh, Pennsylvania, was selectedas a case study for this category.
Appendix B describes the selection criteria and process employed in more detail.
Case Study Organization and Crosscutting Methodological IssuesThe case studies that follow are organized into four main sections. Following an introduc-tion, each case study examines the GSEs’ performances locally, compared to variousprimary market and demographic benchmarks. An overview follows of local economicand demographic characteristics that may have facilitated or inhibited the GSEs’ efforts tofinance housing for underserved populations and neighborhoods. Next, each case studydetails the influence of institutional factors on the GSEs’ performances. This discussion isbased predominantly on interviews with representatives from the local affordable housingsystem, including area lenders, developers, public-sector agencies, and representativesfrom the GSEs. Finally, there is a summary assessment of the extent to which institutional
Performance of the GSEs at the Metropolitan Level
Cityscape 161
relationships among the GSEs and local housing and mortgage industry institutions haveinfluenced the local performance of the GSEs.
Before proceeding with the individual case studies, it is worth noting several cross-cutting methodological issues pertaining to the comparison of GSE performance to localbenchmarks.
For each community, HMDA data were used to provide detailed portraits of GSE pur-chasing activity and the volume and percentage of single-family loans primary lendersmade to minority and low- and moderate-income borrowers and neighborhoods. Theanalysis combines data for 1995 and 1996, the two most recent years for which data wereavailable. As with the analysis of HMDA data in section 2, the discussion here is limited(unless otherwise noted) to conventional, conforming loans on owner-occupied single-family properties.
The case studies use income levels that are lower than the income targets in the existingGSE affordable housing goals. Specifically, the study uses the Community ReinvestmentAct (CRA) definitions of low and moderate incomes. Whereas the GSE affordable hous-ing goals use area median income to define low- and moderate-income households, thisstudy adopts income levels of 50 percent or less of area median income to designate low-income borrowers and between 50 and 80 percent of area median income to identifymoderate-income borrowers. Likewise, the case studies use lower income levels for geo-graphical areas than the current affordable housing goals. In the analysis presented here,low-income census tracts are those in which the median income level is 50 percent or lessof the median income level of the metropolitan area. Similarly, moderate-income tractsare those in which the median income level is between 50 and 80 percent of the medianincome level of the metropolitan area.
These definitions were adopted for two main reasons. For the past 22 years, banks andthrifts have had an affirmative obligation under CRA to meet the credit needs of low- andmoderate-income borrowers and neighborhoods. We therefore anticipated that CRA mayhave motivated banks to establish institutional relationships with local public agencies,nonprofit community organizations, and the GSEs that help banks lend to low- andmoderate-income populations. In addition, two HUD programs that provide a criticalstimulus for local affordable housing system initiatives—the Community DevelopmentBlock Grant (CDBG) and HOME Investment Partnership (HOME) programs—also em-ploy the CRA low- and moderate-income limits. Local homeownership programs fundedby CDBG and HOME primarily target populations and neighborhoods with incomes lessthan or equal to 80 percent of the area median.5
Finally, this research uses data on creditworthiness provided by Financial Modeling Con-cepts (FMC) as another benchmark for assessing local GSE performance. Specifically, thestudy uses FMC data on the geographic distribution of creditworthy and likely borrowersas a point of comparison for the distribution of the GSEs’ loan purchases. Armed with theFICO (Fair Isaac and Company) scores for residents of low- and moderate-income censustracts, FMC uses a series of regression analyses to identify creditworthy residents likely toapply for home purchase, refinance, and home improvement loans.6 For example, theanalyses use household-level demographic variables (such as age, size, and composition)to identify the probability that creditworthy renter households will apply for a home pur-chase loan. Likewise, the regression analyses identify the probabilities of homeowners’demand for refinance and home improvement loans. Using FMC’s data as a benchmarktherefore helps the case studies account for the influence of demographic characteristics onthe ability of the GSEs to purchase loans made to traditionally underserved populations.

Boxall and Silver
162 Cityscape
Washington, D.C.The Washington, D.C., MSA is an area in which both Fannie Mae and Freddie Mac pur-chased a high level of affordable mortgages relative to their performance in other areas.The D.C. case study neither refutes nor supports the study’s institutional hypothesis. Itappears that favorable economic and demographic conditions are largely responsible forhigh levels of GSE purchases of home loans made to minorities and low- and moderate-income populations and neighborhoods in Washington, D.C.
The GSEs’ participation in the local affordable housing system has not been extensive buthas been increasing over the years. Fannie Mae, for example, has established a partner-ship office in D.C. and Freddie Mac has committed to purchasing home loans of clients ofa local counseling agency. However, GSE participation in such efforts has not yet contrib-uted to a significant merging of the local affordable housing system and the GSEs’ busi-ness system. National lenders interviewed for this study report that headquarters’ officeslocated outside the metropolitan area are responsible for contract negotiations with the GSEs.
In the past, local banks also did not integrate their affordable products into their businessrelationships with the GSEs. One local bank interviewed for this study was a portfoliolender for many years. This may change, however, as that bank has established an afford-able homeownership initiative with local churches and Fannie Mae. Another local bankentered into contracts with the GSEs to sell area loans, but an emphasis on purchasingloans made to minorities and low- and moderate-income borrowers did not seem apparentin contract negotiations.
Economic conditions are one of the major factors in determining the extent of the GSEs’goals-related activity in the Washington area. The Washington, D.C., MSA is a rapid-growth area with many high-income employment opportunities. Therefore, while the costof housing is high, so are family incomes. According to Fannie Mae and Freddie Macofficials interviewed for this research, this makes it easier for low- and moderate-incomehouseholds to participate in the mortgage market and increases the opportunity for theGSEs to purchase loans targeted by the affordable housing goals. The high volume oflending activity in the D.C. market also contributes to the GSEs’ performance in the met-ropolitan area.
At the same time, the Washington, D.C., MSA is plagued by a growing inequality be-tween the District of Columbia and the burgeoning suburbs. Even the older, inner suburbsare beginning to feel the strain of aging infrastructure and housing stock as they start togrow less rapidly than the outer suburbs in Virginia and Maryland. Reflecting this dispar-ity, Fannie Mae’s partnership office focuses exclusively on increasing homeownershipopportunities in the District of Columbia. Lenders interviewed also focus their CRA lend-ing in the District and the inner suburbs, where a considerable minority population re-sides. Therefore, the need to comply with CRA generates a substantial number of loansthat can qualify for the existing housing goals.
GSE PerformanceThe Washington, D.C., metropolitan area is an area in which high volumes of loans helpedthe GSEs purchase relatively high levels of loans to minority and low- and moderate-income borrowers. In 1995 and 1996, primary lenders (that is, respondents under HMDA)originated and purchased 183,609 conventional, conforming single-family loans in theWashington metropolitan area. This is the highest level of loan purchases and originationsobserved in any of the sites selected for field visits. Fannie Mae, Freddie Mac, and otherinstitutions purchased 50 percent of these loans. This is a slightly higher level of second-ary market purchases than that found in Houston and Columbus, and is twice as much, in

Performance of the GSEs at the Metropolitan Level
Cityscape 163
percentage terms, as the level of purchases in Pittsburgh. Fannie Mae purchased 17 per-cent of all the single-family loans. Freddie Mac purchased 11 percent of the total (seeexhibit 9).
Lending institutions and the GSEs also came closer to serving low- and moderate-incomehouseholds in proportion to their population in the Washington, D.C., area than in theother metropolitan areas analyzed.7 Exhibit 10 shows that low- and moderate-incomehouseholds (with incomes up to 80 percent of median) constitute 38 percent of the house-hold population. All lenders, as a group, made 37 percent of their conventional, conform-ing single-family loans to these households. About 32 percent and 31 percent of FannieMae’s and Freddie Mac’s purchases, respectively, were loans offered to low- and moder-ate-income households.
There is, however, a clear disparity in the extent to which primary market lenders and theGSEs served moderate-income as opposed to low-income households in the D.C. area.Financial institutions served moderate-income households in proportion to their popula-tion. Moderate-income households constituted 18 percent of the population (see exhibit10). Primary lenders offered 25 percent of their conventional, conforming single-familyloans to this income group. Fannie Mae and Freddie Mac were not far behind at 24 per-cent and 23 percent, respectively. In contrast, low-income households made up 20 percentof the household population and received just 12 percent of all loans. About 8 percent ofboth GSEs’ purchases were mortgages made to low-income populations.
Lending institutions in the D.C. area reached a larger proportion of Black households thanGSEs. Black households received 18 percent of all conventional, conforming single-family loans issued in the Washington, D.C., MSA, as exhibit 10 shows. Loans to Blackhouseholds were only 14 percent and 13 percent of Fannie Mae’s and Freddie Mac’spurchases, respectively. Black households constituted one-quarter of all households in themetropolitan area. Both lenders and GSEs were more successful in reaching Hispanichouseholds, which constituted 4 percent of the households in the MSA. All lenders, as agroup, made 3 percent of their loans to Hispanics. Four and 3 percent of the GSEs’ pur-chases were loans made to Hispanics.
GSE performance in serving D.C. area low- and moderate-income neighborhoods (censustracts with a median income of up to 80 percent of area median income) was similar tothat of primary lending institutions. Exhibit 11 indicates that primary lenders, as a group,issued 16 percent of their conventional, conforming single-family loans in low- and
Exhibit 9
Washington, D.C., Metropolitan Area Primary and Secondary Market Activity,1995–96a
Primary Number of Percentage ShareMarketb Loans of Loans Sold Fannie Mae Freddie Mac
Originated 152,745 51% 17% 11%
Purchased 30,864 48 16 12
Total 183,609 50 17 11
a Conventional, conforming loans on owner-occupied single-family properties.b Action reported by the HMDA respondent.
Source: Compiled from HMDA Loan/Application Register data, 1995–96.
Percentage Share Purchased

Boxall and Silver
164 Cityscape
Exhibit 10
Washington, D.C., Metropolitan Area Single-Family Loans by Borrower Incomeand Race/Ethnicity, 1995–96a
Percentage SharePercentage Share Purchased
Households Primary Marketb Fannie Mae Freddie Mac
Borrower income (% of AMI)
Low (up to 50% 20 12 8 8
Moderate(51–80%) 18 25 24 23
Middle(81–120%) 23 33 38 38
Upper (above 120%) 39 30 30 31
Totalc 100 100 100 100
Borrower race/ethnicity
White, non-Hispanic 67 70 71 73
Black, non-Hispanic 25 18 14 13
Other, non-Hispanic 4 3 4 4
Hispanic 4 3 4 3
Mixed NA 6 7 7
Total 100 100 100 100
Note: AMI = area median income.a Conventional, conforming loans on owner-occupied single-family properties.b Share of loans originated or purchased by HMDA respondents.
Sources: Compiled from HMDA Loan/Application Register data, 1995–96, and U.S. Census, 1990.
moderate-income census tracts. About 12 percent of both GSEs’ purchases were loansmade in these census tracts. According to Financial Modeling Concepts (FMC) 17 percentof the creditworthy and potential borrower households in the D.C. MSA resided in low-and moderate income census tracts. Therefore, primary lenders and the GSEs were serv-ing households in low- and moderate-income neighborhoods almost in proportion to thenumber of these households that were creditworthy and likely to borrow.
By contrast, lenders and the GSEs did not offer home purchase loans in proportion to thepopulation of creditworthy renters in low- and moderate-income census tracts. Accordingto FMC, approximately 24 percent of renters who are creditworthy and likely to want tobuy homes lived in low- and moderate-income census tracts. All lenders, as a group, is-sued just 12 percent of their home purchase loans in these areas. About 11 percent of bothGSEs’ home purchase loans were made in low- and moderate-income census tracts (seeexhibit 12).
Economic and Demographic ContextFannie Mae and Freddie Mac officials stated during interviews that the GSEs tend topurchase a greater volume of mortgages made to minorities and low-income populationsin areas such as the D.C. MSA, where median incomes are high relative to housingprices. The D.C. MSA is a rapid-growth area with high-income employment opportunit-ies in Federal agencies, large law firms and trade associations, and technology-related

Performance of the GSEs at the Metropolitan Level
Cityscape 165
Exhibit 11
Washington, D.C., Metropolitan Area Single-Family Loans by NeighborhoodIncome, 1995–96a
Percentage Share
Likely andTract Median Creditworthy PrimaryIncome Households Borrowersb Market3 Fannie Mae Freddie Mac
Low/moderate(up to 80% of AMI) 22 17 16 12 12
Middle/upper(above 80% of AMI) 78 83 84 88 88
Total 100 100 100 100 100
a Conventional, conforming loans on owner-occupied single-family properties.b See Case Study Organization and Crosscutting Methodological Issues section for definition of likelyand creditworthy borrowers.c Share of loans originated or purchased by HMDA respondents.
Sources: Compiled from HMDA Loan/Application Register data, 1995–96; U.S. Census, 1990; andFinancial Modeling Concepts, 1997.
industries. Blue-collar workers and office support staff earn high pay relative to theircounterparts elsewhere. Therefore, while the cost of housing is high, so are family in-comes. Although the housing price-to-income ratio is not as low in the D.C. MSA as inthe other metropolitan areas analyzed for this research, low- and moderate-income bor-rowers in the D.C. MSA may have fewer difficulties with downpayment and closing costrequirements.8 Low- and moderate-income borrowers in the Washington metropolitanarea have income levels that are considerably higher than those in the other case-study areas.Thus, more D.C. borrowers may have been able to accumulate savings for downpaymentsand closing costs.
Exhibit 12
Washington, D.C., Metropolitan Area Home Purchase Loans by NeighborhoodIncome, 1995–96a
Percentage Share
Likely andTract Median Renter Creditworthy PrimaryIncome Households Homebuyersb Marketc Fannie Mae Freddie Mac
Low/moderate(up to 80% of AMI) 29 24 12 11 11
Middle/upper(above 80% of AMI) 71 76 88 89 89
Total 100 100 100 100 100
a Conventional, conforming home purchase loans on owner-occupied single-family properties.b See Case Study Organization and Crosscutting Methodological Issues section for definition of likelyand creditworthy borrowers.c Share of loans originated or purchased by HMDA respondents.
Sources: Compiled from HMDA Loan/Application Register data, 1995–96; U.S. Census, 1990; andFinancial Modeling Concepts, 1997.
Percentage SharePurchased
Percentage SharePurchased

Boxall and Silver
166 Cityscape
Despite the favorable impact of economic conditions in the D.C. area on the opportunityfor the GSEs to finance loans meeting the affordable housing goals, considerable dispari-ties across the region have influenced local affordable housing initiatives. The Washing-ton metropolitan area has experienced the stresses and strains of uneven population andemployment growth. While the District of Columbia has lost population at a rapid rateand the inner suburbs have grown slowly, the outer suburbs have experienced almostexponential growth. Since 1990 the District of Columbia has lost more than 65,000 resi-dents. According to the Council of Governments of Metropolitan Washington, the innersuburbs will continue to have the largest number of people, 2.6 million, of any part ofthe metropolitan area by 2000. The outer suburbs, however, will experience the fastestgrowth, from a population base of 700,000 in 1990 to a projected 947,000 in 2000.
Public- and private-sector agencies interviewed for this study have pursued strategiesto reverse the population flight out of the District of Columbia, particularly amongmoderate- and middle-income homeowners. Given the condition of public schools andthe job growth in the suburbs, this will be a challenge, but not an impossible proposition.According to the District of Columbia Tax Revision Commission, the city lost only 4percent of its households with annual incomes between $50,000 and $99,999 from 1990to 1996, and actually experienced an 11-percent increase in its households with annualincomes over $100,000. The $50,000 to $99,999 income bracket is part of the populationgroup that local officials hope to attract and retain in the city.
Perhaps the key to the retention of moderate- and middle-income households in the Dis-trict will be the city’s attractiveness to its new immigrant and traditional African Ameri-can populations. Consisting largely of working-class Hispanics, the immigrant populationoriginally settled in city neighborhoods such as Adams-Morgan but is now moving inlarger numbers to Northern Virginia and other suburban neighborhoods. While most ofthe District is still African American, a considerable African American professional classnow resides in the inner suburbs of Prince George’s County, Maryland.
The District of Columbia Housing Finance Agency (DCHFA) is one agency that is deter-mined to stem population loss by retaining middle-income homeowners and attractingothers back into the city. The Fannie Mae partnership office is also focused exclusively onD.C., concentrating on a few well-executed moderate- and middle-income homeowner-ship projects around the city. Lenders, for their part, have concentrated their CRA-relatedlending in the city and inner suburbs because these areas are most likely to generate loansto low- and moderate-income populations that count for CRA exams.
It is noteworthy, however, that although these public and private agencies have pursuedinner-city development strategies, they have not felt compelled to come together in anextensive collaborative effort. Therefore, in terms of the framework developed for thisresearch, the local affordable housing system and the GSEs’ business system remainlargely separate.
Descriptions of Affordable Lending ProgramsFannie Mae Partnership Office. As stated above, the Fannie Mae partnership office haschosen to focus its energies on the District of Columbia. Fannie Mae has established part-nership offices around the country that help meet housing needs through a variety of strat-egies. As the case studies illustrate, the partnership offices operate on a decentralizedbasis and have chosen different strategies for promoting homeownership.

Performance of the GSEs at the Metropolitan Level
Cityscape 167
Fannie Mae’s District of Columbia partnership office acts more like a developer than afinance agency. It concentrates on actual housing developments in the city as opposed tomodifying Fannie Mae products for local conditions. Partnership office staff indicated thatthe flexibility of Fannie Mae’s products and other affordability issues were not as pressingin the D.C. metropolitan area as the need to revitalize the city. Moreover, they suggestedthat the provision of quality homeowner housing is just as important to the goal of attract-ing middle-income residents as higher profile efforts to improve schools and reduce crime.The partnership office hopes that it can produce models of successful homeownershipdevelopments in the city that developers and lenders will want to replicate.
Since 1994 the partnership office has embarked on two major development projects. TheWoodridge development in northeast D.C. consisted of approximately 40 new homes inits first phase. The homes ranged in price from $140,000 to $180,000. There were no in-come limits for the home purchasers. Completely sold out, the Woodridge developmentdemonstrates that middle-income people will buy new homes in the District and live inmixed-income communities, according to the partnership office. The Woodridge develop-ment is adjacent to a public housing complex that also has been rehabilitated.
The other major project undertaken by the partnership office is in the Ledroit neighbor-hood near Howard University. The university owned several housing properties that hadbecome vacant over the years. In an effort to revitalize the neighborhood and to reduce itsstock of underutilized real estate, the university started to rehabilitate and sell homes at noprofit. Fannie Mae used its Housing Impact Fund to provide both predevelopment andconstruction financing for the project. The development consists of about 42 homes withprice ranges of $90,000 to $160,000. Howard University employees as well as some long-time neighborhood residents have used a university-sponsored program to obtain assis-tance with downpayments.
District of Columbia Housing Finance Agency. As noted, DCHFA also has adopted amoderate- and middle-income retention strategy, financing subsidized loans in Washing-ton, D.C.
According to officials interviewed for the study, the agency’s strategy has benefited fromthe highest income limits of any housing finance agency in the country. In the mid-1990s,DCHFA’s income limits ranged from approximately the median income to substantiallyhigher than the median income. Furthermore, officials hope that the agency’s marketpresence in the District will contribute to the continued success of its efforts to targetmoderate- and middle-income earners. DCHFA finances 360 to 400 mortgages a year,which was about 10 percent of the loans issued in the District annually during the studyyears.
Two factors have restricted the extent to which the GSEs’ business system has supportedthis local affordable housing initiative. First, although Fannie Mae purchases bonds thatthe agency floats to finance its homeownership products, lately DCHFA has marketed itsbonds aggressively to banks and other investors in an effort to stimulate competition andthereby obtain favorable rates. Second, most mortgages financed by DCHFA are Govern-ment insured. Therefore, on the back end, DCHFA-financed loans are likely to be sold onthe secondary market to the Government National Mortgage Association (Ginnie Mae)instead of the GSEs. In this case, therefore, the GSEs’ business system has not yet mergedwith the affordable housing system to facilitate the purchase of mortgages made tounderserved populations.

Boxall and Silver
168 Cityscape
Locally Owned Banks. Riggs Bank, NA, is a locally owned bank that offers a high vol-ume of loans to minorities. For a number of years, Riggs remained a portfolio lender thatdid not have extensive business relationships with either GSE. This was partly because ofpricing issues and partly because of an interest rate environment that reduced the bank’sexposure to risk on its portfolio loans. The bank’s policy may change in the future, how-ever, since the bank has established an affordable housing program in conjunction withlocal churches and Fannie Mae.
Riggs excels in making loans to minorities. All lenders, as a group, issued 19 percent oftheir single-family loans to African Americans in 1996.9 Riggs made nearly 40 percent ofits loans to African Americans in that year. Likewise, Riggs made more than 6 percent ofits loans to Hispanics, whereas all lenders, as a group, made about 3 percent of their loansto Hispanics. Riggs’ record of offering loans to low- and moderate-income borrowers alsooutstrips the performance of other primary lenders in the D.C. area market.
Riggs’ success, particularly with minority borrowers, can be attributed to its marketingstrategy and its institutional relationships. Riggs officials stated that they instruct corre-spondents to concentrate their home lending in predominantly African American sectionsof the metropolitan area such as Anacostia in the District and Prince George’s County inMaryland. When the bank markets its products in the outer suburbs, it finds that the cus-tomer base is mostly White and has a narrower income range.
Riggs has partnerships with community organizations that provide homeownership coun-seling and offer homeownership products with flexible underwriting criteria. The bankcontinues to expand its partnerships with community organizations. Recently, Riggs wasselected as the only nonminority-owned bank that will participate in a homeownershipprogram offered by a coalition of more than 100 African American churches (the coalitionalso chose three other minority-owned banks as partners). The churches will coordinatehomebuyer clubs and homeownership counseling efforts. Riggs will be one of the banksoriginating mortgages and Fannie Mae will purchase the mortgages.
The bank offers a range of affordable products that include 3-percent downpayment Fed-eral Housing Administration (FHA) and Fannie Mae products and below-market interestmortgages. Although many of Riggs’ mortgages conform to secondary market criteria,Riggs has chosen to be a portfolio lender for a number of years. Because interest rateshave declined in the past few years, the loans in portfolio have higher interest rates andthus are earning good returns. Riggs periodically sells seasoned loans to Fannie Mae butoften finds that the price for which Fannie Mae offers to buy the loans is too low in rela-tion to the returns the loans are making by remaining in portfolio. Riggs has also estab-lished a construction loan fund with Fannie Mae. Each institution has contributed $10million to the fund. The fund helped finance the Ledroit project discussed previously.Since Riggs is a relatively small local bank, it does not have the same resources as largerfinancial institutions to develop business relationships with both Fannie Mae and FreddieMac. Riggs has not sold loans to Freddie Mac.
Like Riggs Bank, Chevy Chase Bank has not focused its business relationship withFannie Mae and Freddie Mac on affordable housing programs. A locally owned bank,Chevy Chase and its affiliate, B.F. Saul Mortgage Company, is usually within the top 10or 20 lenders in terms of overall market share of home loans in the Washington, D.C.,area. Like Riggs, Chevy Chase makes a substantial number of loans to African Ameri-cans. In 1996 the bank made 30 percent of its loans to African Americans—a portionthat is 10 percentage points higher than the aggregate peer figure.

Performance of the GSEs at the Metropolitan Level
Cityscape 169
Complying with the CRA seems to be more of a factor than relationships with GSEs inChevy Chase’s lending record. In a 1994 settlement with the U.S. Department of Justiceover alleged violations of CRA and other fair lending laws, Chevy Chase agreed to pro-vide about $140 million in mortgage financing for minority communities. The mortgageproducts featured below-market interest rates, fee waivers, and bank-funded grants fordownpayments. In particular, Chevy Chase has closed approximately $18 million of loansoffered to borrowers that completed HomeFree’s counseling course (described below).Chevy Chase has targeted much of its affordable lending to the District of Columbia andPrince George’s County, Maryland, in a successful effort to reach African Americanpopulations.
HomeFree USA is a nonprofit homeownership-counseling agency that works with ChevyChase and other banks. It has established a relationship with Freddie Mac that has resultedin a relatively new and promising program. The program, however, has not reached alarge enough scale to have a direct impact on Freddie Mac’s performance under the GSEgoals in the Washington metropolitan area. Like Fannie Mae’s relationship with RiggsBank, HomeFree’s program may eventually lead to closer linkages between Freddie Mac’sbusiness relationships with several area lenders and those lenders’ affordable housinginitiatives.
HomeFree attracts program participants through its relationships with churches. Home-Free has established numerous affordable homeownership programs with lenders. Recently,it established a program featuring a $500 downpayment product called the Freedom Fundmortgage. Chevy Chase and Crestar Banks will originate the mortgages, and MGIC(Mortgage Guaranty Insurance Corporation) will provide mortgage insurance on the loans.Freddie Mac has agreed to purchase the loans. In addition, because HomeFree will pro-vide pre- and postpurchase counseling, Freddie Mac has agreed to flexible underwritingguidelines. Freddie Mac has also agreed to assume losses normally assumed by lenderson foreclosed loans.
National Lending Institutions. So far, the Norwest Corporation’s business relationshipswith the GSEs have not been used to leverage affordable lending opportunities, at leastnot in the D.C. metropolitan area. The lender’s Minneapolis, Minnesota, office negotiatescontracts with Fannie Mae and Freddie Mac. Furthermore, while Norwest has a majormarket presence in D.C., it does not outstrip its peers in lending to underserved popula-tions. This may be because it has not concentrated its public-private partnership buildingin the D.C. metropolitan area. Norwest cites a lack of public-sector funding for affordablehome purchase products that can be sold to the GSEs; however, Norwest has not ap-proached public agencies in the D.C. metropolitan area to increase public subsidies forhome mortgage downpayments.
According to the representative interviewed for this research, Norwest used Fannie Mae’sproducts more than Freddie Mac’s for the time period considered by the study. (This willprobably change in the future, however, since a recent contract with Freddie Mac commitsNorwest to selling more loans to Freddie Mac.) In 1995 and 1996, Fannie Mae made avail-able a greater quantity of flexible underwriting products such as those that involve totaldebt-to-income ratios as high as 41 percent. Norwest, for example, uses Fannie Mae’s Flex97 product that requires low 3-percent downpayments, allows mortgage insurance to becanceled when mortgage payments equal 15 percent of the house’s value, and has a debt-to-income ratio of 41 percent. Norwest, however, also uses a menu of Freddie Mac pro-jects, including the innovative product offered through HomeFree USA described above.

Boxall and Silver
170 Cityscape
Norwest created the Homeownership Assistance Program to increase its volume usingFannie Mae’s Community Lending products. Under Fannie Mae’s 3/2 program, the bor-rower pays a 3-percent downpayment and can use grants from nonprofit organizations orGovernment agencies for the other 2 percent. Norwest found that funding for the grantportion was limited. It thus used its access to the Federal Home Loan Bank (FHLB)Affordable Housing Program (AHP) to secure funding for the 2-percent portion of thedownpayment that can be paid using a grant. Under its Homeownership Assistance Pro-gram, Norwest will use AHP funding to provide a grant of up to $2,000 for downpay-ments made by low-income homebuyers.
North American Mortgage Corporation representatives stated that master sales contractswith the GSEs are negotiated with their headquarters office in Tampa, Florida. As is thecase with Norwest, the lender has not integrated its decisionmaking under its affordablehousing initiatives in the D.C. area with its business dealings with the GSEs.
North American had the 10th largest market share of single-family mortgages in theWashington, D.C., market in 1996. Approximately one-third of its mortgage originationsare Government insured. North American offers standard Fannie Mae and Freddie Macproducts. The company has a range of affordable products, including 3-percent down-payment home purchase loans and purchase-rehabilitation loans.
ConclusionAs stated above, favorable economic and demographic factors contributed to Fannie Maeand Freddie Mac purchasing a relatively high level of home loans made to traditionallyunderserved populations. Although housing prices are relatively high, so are median in-come levels. This means that minority and low- and moderate-income households willhave higher incomes in D.C. than in other MSAs, making it easier for them to afforddownpayments for home purchase loans or to qualify for home improvement and refi-nance loans if they are already homeowners. GSE representatives interviewed for thisarticle stated that the GSEs tend to purchase a higher level of loans in markets with rela-tively high incomes and favorable income-to-housing-value ratios.
During the study years—1995 and 1996—the GSEs’ business relationships with arealenders had not been integrated extensively with the local affordable housing system.Local lenders, such as Riggs Bank and Chevy Chase Bank, that made substantial amountsof loans to underserved communities engaged in much portfolio lending and did not em-phasize the sale of loans made to minorities and low- and moderate-income borrowers intheir contract negotiations with the GSEs. Likewise, Norwest and North American, largelenders with a national presence, conducted contract negotiations (associated with thebusiness system) in offices outside the Washington, D.C., metropolitan area. Represen-tatives of these lenders did not know if these contract negotiations included targets forhome loans made to minority and low- and moderate-income populations in the D.C. area.
DCHFA plays a major role in financing homeownership for District residents. How-ever, during the study years neither Fannie Mae nor Freddie Mac purchased significantamounts of DCHFA-financed mortgages. Fannie Mae has a partnership office in the Dis-trict but the office acts in large part like a developer of moderate- and middle-incomeproperties.
In future years, it is possible that stronger links will be developed between the local af-fordable housing system and the GSEs’ business system. Riggs Bank is participating ina major initiative with other local lenders and churches to sell loans made to African

Performance of the GSEs at the Metropolitan Level
Cityscape 171
Americans and low- and moderate-income borrowers to Fannie Mae. Freddie Mac, forits part, buys loans made to graduates of a local homeownership-counseling program.
Houston, TexasHouston is a case study of a metropolitan area in which Fannie Mae performed well rela-tive to its performance in other areas, whereas Freddie Mac did not. Our research suggeststhat this pattern results largely from Fannie Mae’s business relationships with the area’smajor mortgage lenders—that is, Fannie Mae’s business system relationships. However,we also found that institutional developments specific to the local affordable housingsystem contributed to Fannie Mae’s performance. In terms of the volume and characteris-tics of loans sold to the secondary market, therefore, this case study demonstrates thatinstitutional relationships between and among the GSEs and the local affordable housingindustry do matter.
The Houston metropolitan area enjoys relatively low-cost homeownership opportunities.However, area median incomes also are low (especially in the city of Houston), so theobstacles to homeownership can be prohibitive for many prospective buyers. During the1990s lenders, public agencies, and others in the local housing industry collaborated tomake homeownership more accessible, primarily through homebuyer counseling anddownpayment and closing cost assistance programs. These efforts, some of whichachieved national acclaim, successfully improved low- and moderate-income homebuy-ers’ access to credit. More important for this research, these efforts also increased theGSEs’ opportunities to purchase Houston area loans that meet the national housing goals.This fact, along with the predisposition of area lenders to sell to Fannie Mae and FannieMae’s development of affordable products tailored specifically for the Houston market,helps explain the GSEs’ differing performances.
Both GSEs have pursued a number of community-oriented initiatives in Houston, al-though Fannie Mae’s efforts have achieved a higher profile, largely because they havebeen coordinated by a local partnership office that opened in 1995. Through its supportfor the city’s housing and redevelopment efforts, the partnership office has played animportant role in increasing the efficiency of the local affordable housing system and inpriming the market for housing in some of the city’s neediest neighborhoods. However,because of the nature and scale of its activities, the local partnership office has not had adirect influence on Fannie Mae’s performance in terms of the characteristics of loanspurchased from Houston area lenders. Interestingly, although Fannie Mae’s businesssystem and the local affordable housing system have come closer together in Houstonthan in the other case-study sites, this results more from direct negotiations between locallenders and Fannie Mae than from the activities of Fannie Mae’s partnership office.
GSE PerformanceThis section examines the performance of the GSEs in the Houston area and compares themortgage purchase activities of Fannie Mae and Freddie Mac to various demographic andprimary market benchmarks. As discussed below, Fannie Mae clearly outperformedFreddie Mac in the purchase of loans for lower income and minority borrowers. FannieMae also marginally outperformed Freddie Mac in the targeting of loans for low- andmoderate-income neighborhoods. Fannie Mae’s activity closely matched the activity ofthe primary market in terms of income and racial/ethnic characteristics of borrowers andin the purchase of home purchase loans in low- and moderate-income areas. However,both the primary market and the GSEs fell short of demographic benchmarks for the samemeasures during the study period.
Boxall and Silver
172 Cityscape
According to HMDA data, primary market lenders originated or purchased a total of133,182 conventional, conforming loans in 1995 and 1996 combined. As exhibit 13 shows,approximately one-half (49 percent) of these loans subsequently were sold. Together, theGSEs purchased approximately one-third of the loans made by the primary market in theseyears, with Fannie Mae accounting for a larger share of the Houston area secondary marketthan Freddie Mac with 20 versus 12 percent of all purchases.
Fannie Mae not only outpaced Freddie Mac in terms of the volume of loans it purchasedin the Houston metropolitan area, it also performed better than Freddie Mac in the pur-chase of loans made to lower income borrowers. Exhibit 14 compares the two GSEs’activities in terms of the share of conventional, conforming loan purchases that weremade to borrowers at different income levels.
As indicated, a greater share of Fannie Mae’s purchases involved loans for low- andmoderate-income borrowers with incomes up to 80 percent of the area median income.Specifically, 6 percent of Fannie Mae’s purchases assisted low-income borrowers (up to50 percent of area median income), twice the 3-percent share achieved by Freddie Mac.Similarly, 18 percent of Fannie Mae’s purchases assisted moderate-income buyers (be-tween 51 and 80 percent of area median income) compared to just 12 percent for FreddieMac. Exhibit 14 also shows that Fannie Mae’s loan purchases closely matched the distri-bution of conventional, conforming loans made by primary market institutions, with theexception of loans to low-income borrowers, for which Fannie Mae’s performance fellmarginally short of the primary market activity. Compared to the share of households thatfell into each income category, the GSEs and the primary market fell short in the provi-sion of mortgages for low-income borrowers. Low-income households constituted a quar-ter (24 percent) of all Houston area households, considerably higher than the share ofloans made to such households by the primary market or the share of loans purchased byeither GSE.
Exhibit 14 indicates a similar pattern in terms of the share of the GSEs’ loan purchasesmade to minority borrowers. In other words, a greater share of the loans purchased byFannie Mae were made to minorities than were loans purchased by Freddie Mac, with thegreatest disparity occurring for loans to Hispanics. Also, Fannie Mae’s performance inthe purchase of loans to minorities echoed the activity of Houston-area primary lenders,whereas Freddie Mac’s did not. In contrast to the pattern for borrower income, the shareof loans to minority buyers that were made by the primary market or purchased by FannieMae matched, at least in part, the minority share of all households. White, non-Hispanichouseholds represented approximately two-thirds (65 percent) of Houston area house-holds and approximately the same share of loans made by the primary market (69 percent)and purchased by Fannie Mae (67 percent). By contrast, more than three-quarters (77percent) of the loans purchased by Freddie Mac between 1995 and 1996 were made toWhite, non-Hispanic buyers. The exception to this pattern was loans made to Black, non-Hispanic households. Activity by both GSEs and primary lenders fell short of this group’sshare of the household population.
The disparity between Fannie Mae and Freddie Mac was marginal in terms of targetingmortgages on properties located in low- and moderate-income areas (that is, census tractswith median incomes up to 80 percent of area median income). As shown in exhibit 15,10 percent of loans purchased by Fannie Mae met these geographic criteria, compared to7 percent of loans purchased by Freddie Mac. However, both GSEs did a poorer job oftargeting loans to low- and moderate-income neighborhoods than Houston-area primarymarket lenders—lenders, by contrast, made 14 percent of their loans in such areas—andboth GSEs fell even further short of the two demographic benchmarks. Based on the

Performance of the GSEs at the Metropolitan Level
Cityscape 173
Exhibit 13
Houston, Texas, Metropolitan Area Primary and Secondary Market Activity,1995–96a
Primary Number of Percentage ShareMarketb Loans of Loans Sold Fannie Mae Freddie Mac
Originated 113,455 47 19 10
Purchased 19,727 63 25 25
Total 133,182 49 20 12
a Conventional, conforming loans on owner-occupied single-family properties.b Action reported by the HMDA respondent.
Source: Compiled from HMDA Loan/Application Register data, 1995–96.
demographic profile and credit scores of potential borrowers, Financial Modeling Con-cepts (FMC) estimated that approximately one in five (19 percent) Houston-area house-holds likely to seek a mortgage resided in low- and moderate-income neighborhoods.Nearly one in four (24 percent) households resided in the same type of neighborhood.
Exhibit 16 indicates that for home purchase (as opposed to refinance or home improve-ment) loans, the geographic distribution of Fannie Mae’s activity was closer to the primarymarket. In the portion of the market that provided new homeownership opportunities,
Exhibit 14
Houston, Texas, Metropolitan Area Single-Family Loans by Borrower Income andRace/Ethnicity, 1995–96a
Percentage Share Percentage Share Purchased
Households Primary Marketb Fannie Mae Freddie Mac
Borrower income (% of AMI)
Low (up to 50%) 24 9 6 3
Moderate (51–80%) 16 18 18 12
Middle (81–120%) 19 23 24 24
Upper (above 120%) 41 51 51 61
Totalc 100 100 100 100
Borrower race/ethnicity
White, non-Hispanic 65 69 67 77
Black, non-Hispanic 17 8 8 5
Other, non-Hispanic 3 3 3 3
Hispanic 15 14 15 8
Mixed NA 6 7 6
Totalc 100 100 100 100
a Conventional, conforming loans on owner-occupied single-family properties.b Share of loans originated or purchased by HMDA respondents.c Percentages may not sum to 100 due to rounding.
Sources: Compiled from HMDA Loan/Application Register data, 1995–96, and U.S. Census, 1990.
PercentageShare Purchased

Boxall and Silver
174 Cityscape
therefore, Fannie Mae did as good a job as the primary market in extending credit to theneediest neighborhood.
Economic and Demographic ContextThe Houston MSA consists of six counties, including Harris County (which incorporatesthe city of Houston) and the surrounding counties of Chambers, Waller, Liberty, Mont-gomery, and Fort Bend. In 1996 the population of the MSA stood at approximately 3.8million, and the city of Houston had a population of approximately 1.7 million, whichmakes it the fourth largest city in the country. Between the 1990 census and 1996, thepopulation of the entire MSA grew approximately 14 percent. This growth occurredthroughout the metropolitan area. However, in a continuance of recent historical patterns,the outer counties and the unincorporated portion of Harris County grew at a faster ratethan the city, where population grew just 7 percent.
For several reasons, Houston-area housing prices are comparatively low, with a medianprice of just $83,000 in 1996, according to the Houston Multiple Listing Service. In partthis is determined by the relative abundance of inexpensive land. In addition, the Houston-area market was severely depressed following the oil bust and further undermined by thesavings and loan association crisis and failure of several Houston-area institutions. Untilfairly recently, therefore, the market did not support much new construction of low-costhousing because it was not possible to build a low-cost home that would be competitivewith existing homes. The production of new housing in the outer counties and the fringesof the city in the 1970s and early 1980s attracted many residents from the inner city. Thispopulation shift exacerbated the abandonment of housing and disinvestment in olderneighborhoods. Approximately 16,000 housing units in the lower income communities inthe eastern half of the city have been lost, resulting in a serious problem with overcrowd-ing and a shortage of quality affordable housing—most single-family homes within thecity’s inner loop were constructed prior to 1939.
Despite the area’s low housing prices, the affordability of homeownership has been anongoing concern for local policymakers. In part this concern is driven by the fact that areaincomes are low, especially in the city. In recent years it also has been driven by the re-vival of the local housing market. With an incremental drop in the area’s unemploymentrate and the continued growth of the region’s population, there has been upward pressureon housing prices in all but the neediest of the city’s neighborhoods. Recently, housingprices in general, and new housing prices in particular, have started to rise, with theHouston-area median sales price exceeding $100,000 for the first time in 1998.
Influence of Institutional Factors on Government-SponsoredEnterprise PerformanceTo investigate what role, if any, institutional relationships play in determining the differ-ing performances of the GSEs in the Houston metropolitan area, we conducted interviewswith representatives from the local housing industry, including lenders, public-sectorhousing agencies, and nonprofit and for-profit housing developers. The insights gleanedfrom these interviews about the local affordable housing system, in general, and the localperformance of the GSEs, in particular, are detailed below.
Lenders’ Business Relationships With Government-Sponsored Enterprises. Thelenders interviewed for this research—Bank United, Bank One Texas, Chase Bank ofTexas, and NationsBanc Mortgage Corporation—demonstrate how lenders’ relationshipswith the secondary market can vary. All but one of these institutions, Bank United, ac-tively market Fannie Mae and Freddie Mac affordable lending products in the Houston

Performance of the GSEs at the Metropolitan Level
Cityscape 175
Exhibit 15
Houston, Texas, Metropolitan Area Single-Family Loans by NeighborhoodIncome, 1995–98a
Percentage Share
Likely andTract Median CreditworthyIncome Households Borrowersb Primary Marketc Fannie Mae Freddie Mac
Low/moderate(up to 80% ofAMI) 24 19 14 10 7
Middle/upper(above 80%of AMI) 76 81 86 90 93
Total 100 100 100 100 100
a Conventional, conforming loans on owner-occupied single-family properties.b See Case Study Organization and Crosscutting Methodological Issues section for definition of likelyand creditworthy borrowers.c Share of loans originated or purchased by HMDA respondents.
Sources: Compiled from HMDA Loan/Application Register data, 1995–96; U.S. Census, 1990; andFinancial Modeling Concepts, 1997.
Exhibit 16
Houston, Texas, Metropolitan Area Home Purchase Loans by NeighborhoodIncome, 1995–96a
Percentage Share
Likely andTract Median Renter CreditworthyIncome Households Homebuyersb Primary Marketc Fannie Mae Freddie Mac
Low/moderate(up to 80% of AMI) 32 27 12 11 7
Middle/upper(above 80% of AMI) 68 73 88 89 93
Total 100 100 100 100 100
a Conventional, conforming home purchase loans on owner-occupied single-family properties.b See Case Study Organization and Crosscutting Methodological Issues section for definition of likelyand creditworthy borrowers.c Share of loans originated or purchased by HMDA respondents.
Sources: Compiled from HMDA Loan/Application Register data, 1995–96; U.S. Census, 1990; andFinancial Modeling Concepts, 1997.
area; however, the extent to which loans are underwritten for sale to the secondary mar-ket varies considerably even among the three that do. NationsBanc Mortgage underwritesnearly all of its loans for sale to the secondary market, while Bank One Texas and ChaseBank of Texas, both depository institutions, rely more heavily on their own portfolioproducts.
Bank United once used Fannie Mae’s 3/2 and Fannie 97 products extensively. However,because of concerns about the pricing of Fannie Mae’s affordable products, Bank United
PercentageShare Purchased
PercentageShare Purchased

Boxall and Silver
176 Cityscape
developed a low-income affordable mortgage for its own portfolio. This portfolio productfeatured a 97-percent loan-to-value (LTV) ratio and a cap on closing costs. Through 1996,originations totaled approximately $80 million nationwide. In 1997 Bank United soldmuch of its mortgage business; however, it continues to market an affordable productthrough its remaining retail and wholesale operations in Texas and elsewhere in theSouthwest. Currently, it provides an affordable product that uses funds from the DallasFederal Home Loan Bank (FHLB) Helping Hand Program, an incentive program intendedto encourage the use of FHLB advances. With $2.5 million from the Dallas FHLB, BankUnited offers qualified homebuyers grants of up to $5,000, with a cap on closing costs. In1997, approximately 1,000 mortgages were originated under this program in the Houstonarea and other parts of the bank’s Texas assessment area under CRA.
The lenders interviewed in the Houston area also reported that decisions about sales to thesecondary market typically are made without regard to location. At NationsBanc Mort-gage, for example, loans that are originated in the Houston area are underwritten for saleto the secondary market; however, these loans are pooled with mortgages originatedaround the country and sold in accordance with national sales agreements negotiated inCharlotte, North Carolina. Similarly, the volume and characteristics of loans sold byChase and Bank One to Fannie Mae and Freddie Mac are determined by national mastersales agreements. Bank United, the one locally headquartered bank interviewed, alsodemonstrated how the business relationship with the GSEs influences Fannie Mae andFreddie Mac performance in the Houston area. Even though Bank United stopped market-ing Fannie Mae’s affordable products in 1993, Fannie Mae recently negotiated to pur-chase approximately 50 percent of the seasoned portfolio product originated by the bankbetween 1993 and 1996, or approximately $40 million in loans.
Public-Sector Homeownership Initiatives. Although the performance of the GSEs in theHouston metropolitan area is, at one level, a function of their business relationships witharea lenders, a number of recent institutional developments within the local affordablehousing industry have reinforced Fannie Mae’s ability to purchase loans that meet thenational housing goals. Strong relationships among local lenders, Government agencies,and others in the housing industry have produced several public-sector initiatives to ad-dress the obstacles to affordable home-ownership, both in the city of Houston and sur-rounding counties. The public sector’s initiatives have increased the volume ofHouston-area mortgages that meet the GSEs’ national housing goals.
In the city of Houston, the Houston Housing Finance Corporation (HHFC) is responsiblefor providing homeownership assistance to low- and moderate-income households. In1991 HHFC collaborated with the Houston Housing Partnership, a consortium of sevenlocal lenders, to establish the city’s first homebuyer assistance program using proceedsfrom the refinancing of HHFC bonds issued in the high-interest-rate environment of theearly 1980s. This program, which met HHFC’s obligations for the use of bond proceedsand lenders’ obligations under CRA, originally consisted of three parts. HHFC offeredborrowers zero-percent interest on soft second mortgages to assist with downpayment andclosing costs. Participating lenders provided first mortgages with preferential terms in-cluding a cap on certain closing costs and a below-market interest rate. Finally, the lend-ers’ consortium funded a local housing nonprofit to provide homebuyer education.
In the years since its inception, HHFC’s program has evolved significantly. Since 1993the city has contributed HOME program funds to assist homebuyers who earn up to 80percent of the area median income, while HHFC has continued to use refinanced bondproceeds for buyers who earn up to the median income. There also has been an incremen-tal increase in the amount of support offered under the program, including the introduc-tion of special incentives to encourage the purchase of newly constructed housing. Today,
Performance of the GSEs at the Metropolitan Level
Cityscape 177
low- and moderate-income homebuyers can qualify for a forgivable loan of up to $3,500for the purchase of an existing home or $9,500 for the purchase of a new home. Middle-income buyers can qualify for a zero-percent 10-year loan of up to $5,000 for the pur-chase of a new home. Perhaps most important, however, former Mayor Bob Lanierincorporated HHFC’s program as a part of his Homes for Houston commitment to provide(rental and homeowner) housing assistance to 5,000 families annually for 5 years.
The net result of these changes has been twofold. First, the program has enlisted a muchwider network of partners, including real estate agents, homebuilders, homebuyer educa-tion providers, and nearly 70 lenders. This shift is a testament to the program’s impor-tance in the city’s housing market, although the broadening of the program has dilutedsome of its features—for example, participating lenders no longer finance the program’shomebuyer counseling component. Second, the program has seen a significant increase inthe number of homebuyers assisted. The volume of loan closings by HHFC has risen fromapproximately 650 in 1995 to approximately 1,700 in just the first 6 months of 1998.(These figures also include loans purchased from the local chapter of Habitat for Human-ity.) In fact, in recent years the program has assisted between 15 and 20 percent of alllow- and moderate-income homebuyers within the city limits.
Outside the city of Houston, the counties that make up the Houston metropolitan areaalso initiated homeownership programs, although these efforts have assisted fewer home-buyers due to lower funding levels. Harris County’s Community Development Agency,for example, uses HOME funds to provide homebuyers with downpayment and closingcost assistance. As with the city program, income-eligible homebuyers can qualify forassistance on the purchase of an existing or newly constructed home anywhere within thecounty’s service area—that is, unincorporated portions of Harris County plus a number ofsmall, incorporated cities that participate in the county’s HOME program. Participantsreceive homebuyer education and financial assistance through one of the county’ssubrecipients. In addition, assistance is provided through developers for the purchase ofnewly constructed housing in the county’s low-income neighborhoods. Under both por-tions of the county program, homebuyers can qualify for assistance up to the differencebetween the actual downpayment and closing cost requirements and the buyer’s minimumcontribution of $500. On average, the county’s soft second lien is approximately $3,000for existing housing and $8,000 for newly constructed housing. In the 1997 program year,Harris County assisted approximately 350 low-income homebuyers.
Fannie Mae’s Houston Area Products. While public-sector initiatives have spurred theorigination of loans that would qualify for the national affordable housing goals, the ex-tent to which such loans are sold to Fannie Mae has been influenced, at least in part, byFannie Mae’s development of mortgage products specifically for the Houston area. Ac-cording to lenders interviewed for this research, Fannie Mae’s development of mortgageproducts for the Houston area dates to the city’s decision to support HHFC’s downpay-ment and closing cost assistance program with HOME funds. With the increase in volumethat accompanied the use of HOME funds, members of the Houston Housing Partnershipwanted to ensure that first mortgages originated under the program could be sold to thesecondary market (previously, most loans had been held in portfolio). Although partici-pating lenders had existing business relationships with Fannie Mae, the sale of these mort-gages required Fannie Mae’s approval of several program features, including high LTVratios and the use of HHFC’s second lien for downpayments. Negotiations over theseissues were complicated—HHFC originally balked at making changes to the second lienrequested by Fannie Mae—but ultimately successful, and as a result there has been astrong incentive for lenders participating in HHFC to underwrite their mortgages for saleto Fannie Mae.10
Boxall and Silver
178 Cityscape
Today, Fannie Mae offers three mortgage programs tailored specifically for the Houstonmarket. The first, the Community Home Buyers Program, permits lenders to use one offive mortgage products including Fannie 97 and the 3/2 Option for first-time and low- andmoderate-income homebuyers. This program is now used in conjunction with HHFC’sdownpayment and closing cost assistance program. In addition, Fannie Mae has intro-duced the Flexible 97 for Houston, an experimental, 3-percent downpayment product forhomebuyers of all income levels throughout the metropolitan area. Finally, within the cityof Houston, Fannie Mae offers a mortgage product for low- and moderate-income bor-rowers that permits a back-end debt-to-income ratio as high as 41 percent, when thehigher ratio is the result of a car payment.
The last of these products, also known as the Drive-to-Work program, has not been mar-keted aggressively by area lenders. However, its development illustrates the comparativestrength of Fannie Mae’s institutional relationships with the Houston-area affordablehousing industry. Initially, HHFC approached both GSEs to develop a program thatwould raise the back-end ratio to accommodate car loans. HHFC recommended that,in return, the program should include stronger mortgage insurance coverage with a cityguarantee, a strong postpurchase counseling component, and a local, segregated loanservicing pool to allow more intensive loss mitigation. Although it did not incorporate allof HHFC’s recommendations, Fannie Mae ultimately agreed to partner with the city andPMI Mortgage Insurance Company to create a $20 million mortgage experiment forHouston residents. By contrast, Freddie Mac opted not to pursue such a program, al-though shortly thereafter it did implement a similar program in collaboration with Mort-gage Guaranty Insurance Corporation and local nonprofits in several other communitiesnationwide.
Fannie Mae’s Partnership Office. As with the development of mortgage products, thereis a disparity between Fannie Mae and Freddie Mac in terms of the community-orientedactivities they have pursued in the Houston area. Freddie Mac has pursued initiatives withthree Houston-area Community Development Corporations (CDCs), but Fannie Mae’sactivities have achieved a much higher profile. This is because Fannie Mae’s activitieshave been more numerous and a local partnership office has coordinated them. The part-nership office’s efforts have reinforced Fannie Mae’s relationships with others in the localaffordable housing sector. However, because of the nature and scope of its activities, thepartnership office has not had a major impact on Fannie Mae’s performance in meetingthe national housing goals.
Fannie Mae announced the establishment of the Houston partnership office in October1995, but did not staff the office until January 1996. This timing is important for the cur-rent research for two reasons. First, because the office did not open until the start of 1996,it had little impact on Fannie Mae’s local business during the period under study. Second,the fact that the official announcement of the office predated the staffing of its operationhighlights the office’s symbolic value. Today the partnership office has three staff mem-bers—two professional and one support. Intermittently, staff members from the nationalpartnership office also provide support, especially when Houston is selected as the loca-tion to kick off a nationwide initiative or highlight a local experiment such as the Drive-to-Work program. In addition, the partnership office coordinates with the Fannie MaeFoundation on the implementation of Foundation activities in the Houston area.
The primary focus of the partnership office’s activities is to support local partners withimplementation of their own affordable housing strategies. Principally, this means assist-ing the city of Houston with its housing and rehabilitation plan since the partnershipoffice’s operation is focused almost entirely within city limits. As discussed below, the

Performance of the GSEs at the Metropolitan Level
Cityscape 179
partnership office’s efforts have encompassed three main types of activity. These includeproviding financial support to prime the market for redevelopment in some of the city’sneediest neighborhoods, building capacity in the local nonprofit sector to conduct devel-opment and provide homebuyer education, and promoting communication with andamong others in the local affordable housing sector.
The partnership office administers a $10 million revolving line of credit to assist housingdevelopers in the city’s most distressed neighborhoods. This fund is not large enough tosinglehandedly underwrite widespread redevelopment. However, it can be used on a tar-geted basis to prime the local market for privately or publicly funded activities. The fundhas been used, for example, to support the development of middle-income housing as partof the city’s efforts to rebuild the tax base and diversify the housing in some inner-cityneighborhoods. In the Third Ward, the Third Ward Redevelopment Corporation is spon-soring the development of 60 new middle-income units over 3 years. Here the partnershipoffice has negotiated an equity investment that will allow the minority-owned developerto secure private project financing. Fannie Mae also played a pivotal role in the creationof a tax-increment investment zone to underwrite some of the project’s infrastructurecosts.
One testament to the benefit accrued from the local partnership office’s investments isthat others in the local affordable housing sector now examine the possibility of FannieMae participation in any redevelopment effort. However, partnership office staff membersreport that technical assistance is the most valuable service they provide to many localnonprofit developers. Community groups frequently approach the partnership office forsupport needed to pursue proposed developments. As a result, the partnership office’sefforts focus on building the capacity of local partners. One CDC, for example, proposedthe development of an 80-unit project, even though the group lacked any developmentexperience. The partnership office provided direction in terms of the issues the CDCneeded to address to translate its vision into reality, including the retention of a staffmember to lead the effort full time, the development of a market study, and the selectionof a builder.
The partnership office also has sought to build capacity among Houston-area nonprofitsthat provide homebuyer counseling. In 1997 the partnership office played a key role in thedevelopment of a new Housing Counseling Collaborative that totally revamped the sys-tem for providing education to homebuyers participating in the HHFC downpayment andclosing cost assistance program. Previously, homebuyer education had been conducted bya single nonprofit organization—Housing Opportunities for Houston. However, manylocal nonprofits saw the provision of homebuyer education for their community to be oneof the critical roles they could play in increasing neighborhood opportunities for home-ownership, so there was increasing pressure to open up this business to more organiza-tions. The new collaborative achieves this goal by permitting any organization to offercounseling so long as its staff have been certified by HHFC. Furthermore, because theprogram uses a standard curriculum and provides training for trainers, it offers a mecha-nism for achieving an incremental increase in the quality of local homebuyer education.The collaborative also ties funding for homebuyer education to the number of loans thatare actually closed instead of to the number of participants in homebuyer sessions, soprogram costs are contained. This is particularly important since participating lenders nolonger underwrite homebuyer education financially.
In addition to its role in financing and building capacity in the local development sector,the partnership office plays an important role in facilitating communication between andamong different local institutions. At one level this function is pursued formally with the

Boxall and Silver
180 Cityscape
sponsorship of a housing roundtable group that examines new approaches to addressingthe housing needs of low-income families. At another level, communication is at the coreof everything that the partnership office does. This is underlined by comments from oth-ers in the local affordable-housing sector who believe that the partnership office plays animportant role in collecting and disseminating information and is an important symbol ofFannie Mae’s commitment to the Houston area but that it has little direct impact in termsof loan production.
ConclusionThe Houston case study confirms that a convergence of the GSEs’ (in this instance,Fannie Mae’s) business system and the local affordable housing system can improve theGSEs’ metropolitan area performance. On one level, the GSEs’ business relationshipswith area lenders remain separate from the local affordable housing system, with lenders’headquarters offices outside Houston negotiating contracts with the GSEs. However, arealenders negotiated a commitment from Fannie Mae to purchase affordable loans origi-nated in conjunction with subsidized homeownership programs in the city of Houston andother local jurisdictions. This fact, along with the predisposition of area lenders to sell toFannie Mae and Fannie Mae’s development of affordable products tailored specificallyfor the Houston market, helps explain the GSEs’ differing performances.
Columbus, OhioThe Columbus MSA is an area in which Freddie Mac performed well relative to its per-formance in other areas, whereas Fannie Mae did not, during the study period. FreddieMac’s relatively good performance in the Columbus area was probably due to its contrac-tual relationships with lenders. Although purchasing mortgages made to traditionallyunderserved populations was not an explicit component of the contractual process as faras we could observe, Freddie Mac may have been able to reach underserved populationsdue to the volume of loans it had committed to purchase in its contracts with Columbusarea lenders.
In terms of the framework developed for this research, the local affordable housing sys-tem is not yet integrated with the business system for either GSE in Columbus. However,Fannie Mae has begun an effort to establish links with the affordable housing system inthe Columbus metropolitan area. In addition to the usual business relationships with lend-ers, Fannie Mae has developed affordable housing products with the Ohio Housing Fi-nance Agency (OHFA), the city of Columbus, Ohio State University, and the localaffiliate of the Enterprise Foundation. Fannie Mae also has a partnership office in theColumbus metropolitan area. These institutional relationships are relatively new; there-fore, they did not have a major impact on Fannie Mae’s performance in the Columbusarea according to the GSE affordable housing goals in the time period used for this re-search—1995 and 1996.
During 1995 and 1996, economic conditions may have contributed to the ability of banksand the GSEs to serve low- and moderate-income populations. Housing prices were af-fordable, and the Columbus area was experiencing steady growth, making it an attractivearea for lenders and the GSEs to do business. However, because the Columbus metropoli-tan area has experienced steady growth, the policymakers interviewed for this studyvoiced a concern about the continued availability of affordable homeownership units,especially for lower income, service-sector workers. The public- and private-sectorofficials interviewed did not have pressing concerns about the ability to move mortgagesto the secondary market. While lenders in Columbus have engaged in aggressive CRA

Performance of the GSEs at the Metropolitan Level
Cityscape 181
lending, there are relatively few nonconforming products accumulating in lenders’ port-folios compared, for example, to the Pittsburgh MSA.
Given the economic conditions in Columbus, the challenge for the primary and secondarymarket will be to maintain, let alone increase, affordable lending. The private- and public-sector institutions seem to be gearing up their programs in anticipation of strains on thelocal housing and labor markets.
GSE PerformanceIn 1996 and 1995 lenders originated and purchased 85,407 conventional, conformingsingle-family loans in the Columbus metropolitan area. As shown in exhibit 17, the GSEsand other institutions purchased 47 percent of these single-family loans. Fannie Mae pur-chased 19 percent of the loans while Freddie Mac purchased 11 percent of the loans.
On a percentage basis, Fannie Mae and Freddie Mac purchased roughly equal shares ofsingle-family mortgages that were made to traditionally underserved populations, asshown in exhibit 18. Nevertheless, the Columbus metropolitan area is an MSA in whichFreddie Mac did relatively well compared to its performance elsewhere. In other MSAs,Freddie Mac tended to trail Fannie Mae, on average, in the percentage of affordable mort-gages purchased (see exhibits 6 and 7).
Neither GSE purchased mortgages in proportion to the percentage of single-family loansmade to low- and moderate-income and minority borrowers. Low- and moderate-incomehouseholds constituted 40 percent of Columbus’ household population. In 1996 and 1995,they received 29 percent of all conventional, conforming single-family loans made inColumbus. About 22 percent of both GSEs’ purchases were mortgages made to low- andmoderate-income households. Low-income households constituted 23 percent of thehousehold population but received 9 percent of single-family loans. About 5 percent ofboth GSEs’ purchases were mortgages made to low-income households. All lenders, as agroup, originated about 20 percent of their conventional, conforming mortgages to moder-ate-income households—a greater percentage than the percentage of households that weremoderate income (17 percent). Between 16 and 17 percent of both GSEs’ purchases weremortgages provided to moderate-income households.
As revealed by exhibit 18, Black households constituted 11 percent of all households inthe Columbus metropolitan area. They received 7 percent of all conventional, conformingsingle-family loans in 1995 and 1996. Approximately 5 percent of Fannie Mae’s and 3percent of Freddie Mac’s purchases were loans made to Black households. Other minori-ties are not analyzed here because they were not a significant portion of the ColumbusMSA population according to 1990 census data.
In contrast to the GSEs, lending institutions were serving creditworthy households in low-and moderate-income census tracts in proportion to their population. According to Finan-cial Modeling Concepts (FMC) data, approximately 17 percent of creditworthy house-holds that were likely to borrow resided in low- and moderate-income census tracts (seeexhibit 19). All lenders, as a group, issued 16 percent of their conventional, conformingsingle-family loans in these census tracts in 1995 and 1996. Approximately 9 percentof Fannie Mae’s and Freddie Mac’s purchases were loans that were made in low- andmoderate-income census tracts.
In the area of home purchase (as opposed to refinance and home improvement) lending,both the primary market and the GSEs did not reach creditworthy households in propor-tion to their population. Twenty-three percent of all creditworthy renters who were most

Boxall and Silver
182 Cityscape
Exhibit 17
Columbus, Ohio, Metropolitan Area Primary and Secondary Market Activity,1995–96a
Primary Percentage ShareMarketb Number of Loans of Loans Sold Fannie Mae Freddie Mac
Originated 73,967 45 18 10
Purchased 11,440 63 26 18
Total 85,407 47 19 11
a Conventional, conforming loans on owner-occupied single-family properties.b Action reported by the HMDA respondent.
Source: Compiled from HMDA Loan/Application Register data, 1995–96.
likely to buy homes lived in low- and moderate-income census tracts. All lenders, as agroup, issued 11 percent of their conventional conforming home purchase loans to resi-dents of low and moderate-income tracts. About 8 percent and 7 percent, respectively,of Fannie Mae’s and Freddie Mac’s purchases were issued to residents of low- andmoderate-income census tracts (see exhibit 20).
Economic and Demographic ContextThe Columbus MSA is conducive to GSE purchases because of steady appreciation ofhouse values. At the same time, however, it is not an MSA where both GSEs performwell relative to their performance elsewhere (in contrast to the Washington, D.C., MSA).This could be because housing values have climbed faster than the incomes of low- andmoderate-income workers, meaning that lenders and the GSEs may have experienceddifficulties serving low- and moderate-income households. While the housing stock in theColumbus MSA was still more affordable than in other parts of the country during thestudy years 1995 and 1996,11 housing affordability was becoming more of a concern,according to policymakers interviewed for this research.
The Columbus MSA has experienced steady growth and upward pressure on housingprices. A representative from the development industry estimates that property valueshave appreciated 4 to 5 percent annually (the industry representative characterized thisgrowth as steady but not rapid). The new home market, according to this official, is anindication of the price increases in Columbus. He stated that 2,000 Columbus area newhomes sold for less than $100,000 in 1990, but only 95 new homes sold for that amount in1995. Lack of competition in the building industry and population growth have contrib-uted to the price hikes. The same industry representative stated that three builders control80 percent of the market in the Columbus metropolitan area.
Several factors have contributed to the strength of the Columbus area labor market. Co-lumbus is a major transportation hub in the Midwest, with many assembly and warehous-ing operations. Columbus also is a foreign trade zone offering tax exemptions on goodsshipped from overseas. It has a good distribution network of railroad lines and an AirForce Base. This type of industrial mix creates a demand for entry-level service workers,especially in the suburban portions of the metropolitan area. Homeownership costs, how-ever, have increased faster than the wages of these entry-level service workers.
PercentageShare Purchased
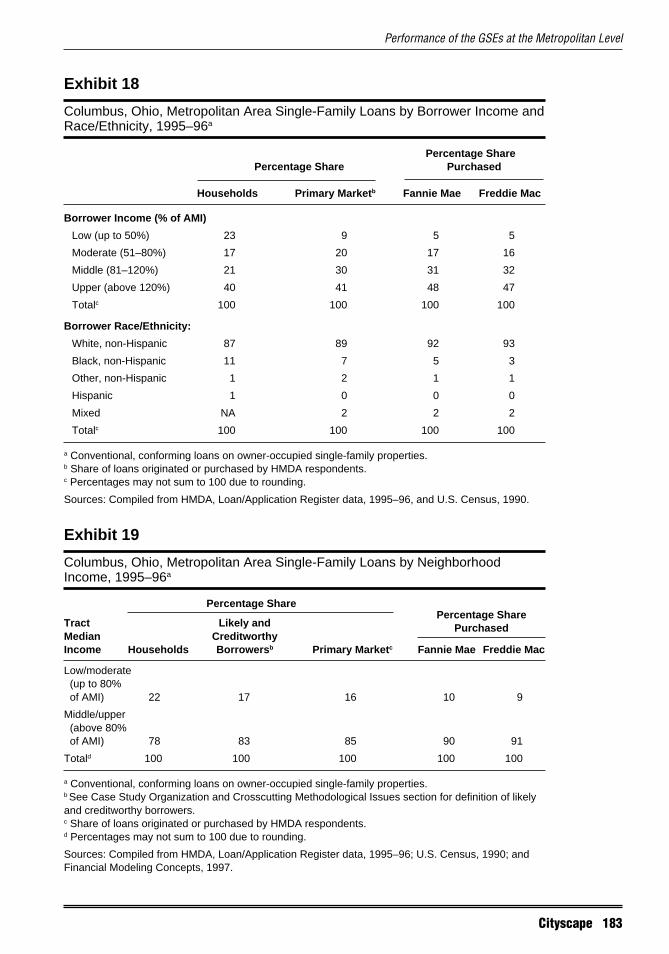
Performance of the GSEs at the Metropolitan Level
Cityscape 183
Exhibit 18
Columbus, Ohio, Metropolitan Area Single-Family Loans by Borrower Income andRace/Ethnicity, 1995–96a
Percentage SharePercentage Share Purchased
Households Primary Marketb Fannie Mae Freddie Mac
Borrower Income (% of AMI)
Low (up to 50%) 23 9 5 5
Moderate (51–80%) 17 20 17 16
Middle (81–120%) 21 30 31 32
Upper (above 120%) 40 41 48 47
Totalc 100 100 100 100
Borrower Race/Ethnicity:
White, non-Hispanic 87 89 92 93
Black, non-Hispanic 11 7 5 3
Other, non-Hispanic 1 2 1 1
Hispanic 1 0 0 0
Mixed NA 2 2 2
Totalc 100 100 100 100
a Conventional, conforming loans on owner-occupied single-family properties.b Share of loans originated or purchased by HMDA respondents.c Percentages may not sum to 100 due to rounding.
Sources: Compiled from HMDA, Loan/Application Register data, 1995–96, and U.S. Census, 1990.
Exhibit 19
Columbus, Ohio, Metropolitan Area Single-Family Loans by NeighborhoodIncome, 1995–96a
Percentage Share
Tract Likely andMedian CreditworthyIncome Households Borrowersb Primary Marketc Fannie Mae Freddie Mac
Low/moderate (up to 80% of AMI) 22 17 16 10 9
Middle/upper (above 80% of AMI) 78 83 85 90 91
Totald 100 100 100 100 100
a Conventional, conforming loans on owner-occupied single-family properties.b See Case Study Organization and Crosscutting Methodological Issues section for definition of likelyand creditworthy borrowers.c Share of loans originated or purchased by HMDA respondents.d Percentages may not sum to 100 due to rounding.
Sources: Compiled from HMDA, Loan/Application Register data, 1995–96; U.S. Census, 1990; andFinancial Modeling Concepts, 1997.
Percentage SharePurchased

Boxall and Silver
184 Cityscape
Affordable Lending ProgramsIn terms of the framework developed for this research, the GSEs’ business system was notintegrated with the Columbus area affordable housing system during the study years 1995and 1996. Freddie Mac did well in Columbus relative to its performance elsewhere, prob-ably because of its business system relationships with major lenders in Columbus. Asdescribed below, Fannie Mae was establishing links with the affordable housing system inColumbus. Most of this activity occurred since 1996, so it did not have a direct impact onFannie Mae’s performance during the study years.
Exhibit 20
Columbus, Ohio, Metropolitan Area Home Purchase Loans by NeighborhoodIncome, 1995–96a
Percentage Share
Tract Likely andMedian Renter CreditworthyIncome Households Borrowersb Primary Marketc Fannie Mae Freddie Mac
Low/moderate (up to 80% of AMI) 28 23 11 8 7
Middle/upper (above 80% of AMI) 72 77 89 92 93
Total 100 100 100 100 100
a Conventional conforming home purchase loans on owner-occupied single-family properties.b See Case Study Organization and Crosscutting Methodological Issues Section for definition of likelyand creditworthy borrowers.c Share of loans originated or purchased by HMDA respondents.
Sources: Compiled from HMDA, Loan/Application Register data, 1995–96; U.S. Census, 1990; andFinancial Modeling Concepts, 1997.
National City Bank. Historically, National City Bank offered a high volume of aggres-sive CRA-related loans that the GSEs could not purchase because of a lack of mortgageinsurance and other credit enhancements. This situation has changed, however, as Na-tional City has adopted tighter underwriting standards and cooperated with Fannie Mae’spartnership office in developing loan products for the Columbus market. While NationalCity did not sell a sizable share of its loans to either GSE during the study years, it intendsto move more of its loans made in Columbus to the secondary market in the future.
National City offers a substantial share of its loans to low- and moderate-income borrow-ers. In 1996 National City issued 34 percent of its single-family loans to this population inthe Columbus MSA, an amount that is higher than the aggregate peer (all lenders) per-centage by 6 percentage points.12
National City is ahead of its peers in CRA lending because it was the first aggressiveCRA lender among major banks in Columbus, according to bank officials interviewed forthis research. National City, for example, was the first major lender in Columbus to offera 100-percent LTV product with no mortgage insurance. Other features of this portfolioproduct, called Right Loan, included waiving cash reserve requirements and establishinga maximum of $500 required from the borrower for downpayment and all other closingcosts. Because Right Loan experienced delinquency rates that were too high, the bank
Percentage SharePurchased

Performance of the GSEs at the Metropolitan Level
Cityscape 185
approached several community organizations, including a statewide coalition of housingand homeless advocacy organizations, for input on how to redesign its CRA product. Thisprocess revealed a greater demand for a waiver of private mortgage insurance as opposedto relaxed downpayment requirements. So, National City introduced Home at Last, whichis a 97-percent LTV product with no private mortgage insurance. This product requires 1month of cash reserves, in contrast to Right Loan, which did not require reserves.
Because of National City’s focus on CRA portfolio lending, it sold only a small share ofits loans to Fannie Mae and Freddie Mac in 1996. Of the 1,339 conventional home mort-gage loans it originated or purchased in the Columbus area during 1996, National Cityretained 693 loans or 51 percent. The bank sold 331 loans (or 24.7 percent of the total)to its affiliates.
To the extent that National City does sell loans to the GSEs, it tends to favor Fannie Maeproducts. The decision to sell loans to the GSEs is made in National City’s headquartersin Miamisburgh, Ohio. Therefore, bank officials in Columbus could not offer insight intopricing or other issues driving secondary market decisions, but they credit Fannie Mae’spartnership office with helping Columbus lenders adapt Fannie Mae’s products. Previ-ously, lenders had access to Fannie Mae Community Lending products that typicallyoffered 5-percent downpayments. The partnership office helped introduce products thatwere more flexible in addressing the housing needs in the Columbus area, such as Flex97, which is now available and offers 3-percent downpayments and waives income limitsbut requires borrowers to have credit histories that pass thresholds established by FannieMae’s Desktop Underwriter. Finally, the emphasis on Fannie Mae products also reflectsresource constraints, according to bank officials. Given staff limitations, the bank decidedto focus its attention on Fannie Mae’s products. However, this is a fluid situation, sincethe bank uses both Freddie Mac’s Loan Prospector and Fannie Mae’s Desktop Under-writer and is comparing both underwriting systems against each other.
Huntington Bank. Huntington Bank is ahead of its peers in CRA lending but not as farahead as National City Bank. Huntington offered 30 percent of its single-family loans tolow- and moderate-income borrowers, while all lenders, as a group, issued about 28 per-cent of their loans to these borrowers in 1996. Unlike National City, Huntington sold mostof the loans it originated or purchased in Columbus to the secondary market. The banksold 57.3 percent of its 1,671 conventional loans in 1996. Fannie Mae bought a greatershare of these loans than Freddie Mac; however, the bank offers both Fannie Mae andFreddie Mac affordable products, including Freddie Mac’s Affordable Gold, FannieMae’s Flex 97, and Fannie Mae’s Community Home Buyers. Huntington officials re-ported no significant impediments in getting affordable loans to the secondary marketor to the GSEs.
City of Columbus. The city of Columbus recently implemented two major homeowner-ship programs. The city’s Department of Trade and Development operates a relativelynew downpayment assistance program for low- and moderate-income families (thosewho earn up to 80 percent of the median income). Established in 1995, the Downpay-ment Assistance Program (DAP) offers a downpayment grant of up to $3,500 funded byCDBG. DAP assists approximately 400 homebuyers each year. FHA insures most of thefirst mortgages originated in conjunction with the program. Therefore, despite its scale,DAP does not have a major impact on the GSEs’ activities in Columbus.
The city’s second downpayment assistance product grew out of discussions between themayor, area lenders, and Fannie Mae’s partnership office. Under the Your Home Colum-bus program, the city finances downpayment loans of as high as $4,000. Several local

Boxall and Silver
186 Cityscape
banks originate loans in conjunction with the program. Huntington Bank consolidatesand services these loans. Fannie Mae helped finance the program with the purchase of a$600,000 tax note from the city. The program is an attempt to revitalize inner-city andinner-suburban areas by promoting economic diversity. It targets a higher income groupthan the city’s other downpayment assistance program to attract middle-income familiesinto city neighborhoods and stem population flight from the older neighborhoods. Spe-cifically, it targets lower middle- and middle-income families (those who earn 80 to 120percent of the median income)—the income group one notch higher than DAP. The firstloans closed under the Your Home Columbus program in the fall of 1998.
Ohio Housing Finance Agency. Created in 1983, the Ohio Housing Finance Agency(OHFA) issues tax-exempt bonds to finance affordable home mortgages. In fiscal year1997 the agency financed a total of $132 million in mortgages throughout the State ofOhio. This translated into 1,919 loans with an average loan amount of $69,154. The aver-age income of the borrowers was $32,310, or about 80 percent of the median family in-come in most of the State’s metropolitan areas. Franklin County and the Columbusmetropolitan area receive a substantial portion of the mortgages on an annual basis. Infact, OHFA’s director stated that the proceeds from each bond issue easily could be de-voted entirely to the Columbus area, if the agency was not committed to assistinghomebuyers statewide.
Like its participation in the Your Home Columbus program, Fannie Mae helps financeOHFA’s program through the purchase of bonds. Although Fannie Mae’s purchases typi-cally constitute less than a majority of each bond issue, they reportedly send a strongsignal to other investors about the quality of OHFA’s paper. OHFA therefore viewsFannie Mae’s participation as important to the overall success of its program. Apart fromthis, however, the GSEs’ participation in OHFA’s program is limited. Freddie Mac hasnot invested in the program. Also, FHA insures most of the mortgages financed by theagency. Therefore, most are sold on the secondary market to Ginnie Mae.
Columbus Housing Partnership. The Columbus Housing Partnership is an affiliate ofthe Enterprise Foundation. The Housing Partnership develops mostly multifamily rentalapartments but engages in some single-family development as well. According to a repre-sentative of the Housing Partnership, Fannie Mae has invested in four of the Partnership’smultifamily Low-Income Housing Tax Credit projects. In addition, Fannie Mae financed$160,000 in infrastructure-related costs for a single-family project. Freddie Mac has notparticipated in the Housing Partnership’s projects. This is additional evidence that FannieMae is developing institutional relationships with a broad array of actors while FreddieMac deals directly with lenders that do business in the Columbus metropolitan area.
Fannie Mae’s Partnership Office. The main focus of Fannie Mae’s recent efforts tobuild institutional relationships in the Columbus area has been its partnership office. Thepartnership office was not in operation in 1995 and 1996, the research period for thisstudy. But in its more than 2 years of operation, the partnership office has introduced anumber of innovative affordable housing programs. Its initiatives have not yet achieveda great enough scale to have a major impact on secondary market performance. In otherwords, it has yet to link the local affordable housing system and Fannie Mae’s businessrelationships with area lenders. The partnership office, however, is making headway inbecoming a significant component of Columbus’ affordable housing system.
The office has an advisory board that consists of public-sector officials from the city ofColumbus and Franklin County, as well as representatives of lenders, nonprofit commu-nity organizations, and private-sector developers. In its quarterly meetings, the advisory

Performance of the GSEs at the Metropolitan Level
Cityscape 187
board discusses specific affordable housing issues and identifies housing needs. Thesediscussions then lead to program development.
In its short existence, the partnership office has designed homeownership programs thatare being offered in conjunction with lenders and public-sector organizations. These pro-grams waive some requirements of the usual Fannie Mae affordable loan products,thereby encouraging lending that can contribute to Fannie Mae’s attainment of the GSEaffordable housing goals.
An example of a product developed specifically for the Columbus area is the downpay-ment assistance program developed with Ohio State University. Borrowers can receive adownpayment loan of up to $3,000 from Ohio State University. The borrower then usu-ally has to contribute only 2 percent toward the downpayment. This program has no in-come caps. In contrast, Fannie Mae’s typical 3/2 program (3-percent downpaymentloan or grant, 2-percent borrower contribution) has a limit of 115 percent of the areamedian income.
The partnership office is also involved in a major initiative to coordinate homeownershipcounseling programs throughout the metropolitan area. The office has created an organi-zation called Homeownership Network Services that will document the range and varietyof counseling programs and identify gaps in the types of counseling offered and types ofcounseling needed in Columbus. The aim is to form a “continuum” of counseling ser-vices. The partnership office’s involvement with this initiative may eventually increaseFannie Mae’s opportunity to purchase loans made to counseling program graduates. Forexample, the use of Fannie Mae’s underwriting system, Desktop Underwriter, may influ-ence the ultimate secondary market destination of loans made to recipients of counseling.
The Columbus partnership office has a 5-year investment plan totaling $1.5 billion. Thisfigure reflects all types of financing, including Fannie Mae’s mortgage purchases, bondpurchases, investments in low-income housing tax credits, and construction loans (offeredto nonprofit developers through intermediaries). The partnership office’s 5-year plan is partof Fannie Mae’s overall $1 trillion commitment to the financing of affordable housing.
The Columbus area investment goal is not directly analogous to the application of thenational GSE affordable housing goals at the metropolitan level. The publicly availableportions of the investment plan did not specify the number of mortgages made to minorityand low- and moderate-income populations that would be purchased by Fannie Mae. Theinvestment goal, however, is an aspect of metropolitan-level planning that could helpFannie Mae establish itself as an integral part of Columbus’ affordable housing system.To do so, Fannie Mae would have to coordinate its targets with the goal setting of public-sector agencies and lenders doing business in Columbus.
ConclusionThe Columbus MSA was a metropolitan area in which Freddie Mac performed well rela-tive to its performance elsewhere. It is possible that this is because of Freddie Mac’s busi-ness relationship with major lenders in the Columbus market. During the study years 1995and 1996, neither GSE had established significant links between its business system andthe Columbus affordable housing system. After 1996 Fannie Mae established a Columbuspartnership office and has made a concerted effort to become involved in the local afford-able housing system. The narrative above describes how some of these efforts, such asworking with banks to tailor Fannie Mae products to the Columbus market, may helpFannie Mae bolster its purchases of loans made to underserved populations in future years.

Boxall and Silver
188 Cityscape
Major lenders in Columbus had been engaging in portfolio lending and offering aggres-sive CRA-related loan products. The banks are now trying to sell more of the loans madeto minority and low- and moderate-income borrowers to the secondary market. The dataon single-family lending to low- and moderate-income neighborhoods show that lenderswere making higher percentages of their loans to these communities in 1995 and 1996than the GSEs were purchasing. While economic and demographic factors were condu-cive to GSE purchases in Columbus, policymakers in Columbus were concerned thatsteady (although not rapid) appreciation in housing values was starting to make it harderfor low- and moderate-income populations to buy homes. The GSEs could be motivatedby these concerns to involve themselves to a greater extent in the local affordable housingsystem in future years.
Pittsburgh, PennsylvaniaPittsburgh is a metropolitan area in which neither Fannie Mae nor Freddie Mac purchaseda high percentage of affordable mortgages relative to their performance elsewhere duringthe study period. Pittsburgh is a fascinating study of a well-developed affordable housingsystem that has not involved the GSEs in a significant manner. The city of Pittsburgh,nonprofit organizations, and lenders have established public- and private-sector affordablehousing programs over the past several years. Now, however, the local affordable housingsystem is starting to experience some capacity constraints. The public sector and banksare soliciting GSE participation, but in fits and starts. Because the GSEs historically havenot been involved in Pittsburgh’s affordable housing system, their business relationshipswith area lenders do not involve explicit subgoals for purchases of loans made to tradi-tionally underserved populations, as far as this study could determine.
Economic and institutional factors contributed to poor performance of the GSEs relativeto their performance in other metropolitan areas. During site visits, public- and private-sector officials mentioned that the GSEs do not tend to purchase high volumes of mort-gages in markets such as Pittsburgh’s that are experiencing relatively stagnant homevalues.
Pittsburgh-based lenders have a long tradition of portfolio lending and not selling to theGSEs, partly as a result of community group activism regarding CRA. Starting in the late1980s, the Pittsburgh Community Reinvestment Group (PCRG), a coalition of communitydevelopment corporations (CDCs), and other communitybased organizations became activein the bank-merger approval process. As a result, Pittsburgh area banks signed a numberof CRA agreements, committing banks to aggressive lending to lower income and minorityneighborhoods. Major lenders held most CRA-related loans in portfolio since the homeloans featured flexible underwriting criteria such as high LTV ratios and no mortgageinsurance. Fannie Mae’s and Freddie Mac’s charters prohibited the GSEs from purchasinga substantial number of the loans, since they had LTVs above 80 percent and did notrequire mortgage insurance or other credit enhancements.
Lenders are now attempting to convert some of their CRA products into loans that FannieMae and Freddie Mac can purchase. Major banks are starting to encounter liquidity crun-ches because of the buildup of portfolio loans. As lenders move to tighten underwritingcriteria to qualify the loans for GSE purchase, community organizations, public officials,and the area’s most aggressive CRA lenders are concerned that fewer lower income andminority borrowers will be served.
A Fannie Mae product called the Residential Mortgage Underwriting Experiment hasbeen introduced to the Pittsburgh market, but its fate remains uncertain. This mortgageproduct features a 97-percent LTV ratio, and gifts and grants can be used for most of the
Performance of the GSEs at the Metropolitan Level
Cityscape 189
3-percent downpayment requirement. A major portfolio lender is intent on offering loanswith no mortgage insurance at a cost to the borrower that is very competitive with theFannie Mae product. In addition, lenders and financial intermediaries are establishingalternatives to GSEs. Mellon Bank, for example, has sold a sizable amount of its CRAloan portfolio through the Wall Street firm Bear Stearns. The FHLB of Pittsburgh is at-tempting to fashion a product that will serve some of the secondary market functions ofFannie Mae’s and Freddie Mac’s products.
The GSEs may make some inroads into Pittsburgh in the next few years, although thereare particular institutional arrangements and economic circumstances in this metropolitanarea that could well prevent the GSEs from becoming the secondary market force they arein other areas. This limited GSE role in Pittsburgh does not necessarily spell the end ofCRA-related lending. Lenders, public officials, and community organizations did notforesee a substantial decrease in affordable lending over the next year or two if portfoliolending continues. However, the consensus seemed to be that reducing the incidence ofportfolio lending was a medium-term issue that needed to be addressed. The challenge forthe GSEs, lenders, community organizations, and public-sector agencies will be whetherthey can fashion secondary loan products that will relieve pressures on lenders’ portfolioswhile still being able to reach as far down the income scale as possible.
GSE PerformanceIn 1995 and 1996, lending institutions made or purchased 99,336 conventional, conform-ing single-family loans in the Pittsburgh area, as shown in exhibit 21. Fannie Mae,Freddie Mac, and other financial institutions purchased only 26 percent of the single-family loans. Fannie Mae and Freddie Mac purchased 7 and 5 percent of all originationsand purchases, respectively. In other metropolitan areas selected for this study, a muchhigher percentage of loans were purchased. In the Washington, D.C., metropolitan area,for example, 50 percent were purchased.
Neither lenders nor the GSEs reached low- and moderate-income households in proportionto their household population in the Pittsburgh area, but the GSEs trailed lenders in serv-ing these income groups. Low-income households (50 percent of median income) consti-tuted 25 percent of the MSA’s households but received only 8 percent of all conventional,conforming single-family loans in the Pittsburgh area in 1995 and 1996 (see exhibit 22).Two percent of Fannie Mae’s and Freddie Mac’s purchases were loans offered to low-income borrowers. Moderate-income borrowers were 16 percent of the household popula-tion. Lenders offered 18 percent of single-family loans to this income group—a percentageof loans commensurate with their population share. Only 10 percent of Fannie Mae’s andFreddie Mac’s purchases were single-family loans issued to moderate-income borrowers.Overall, lenders as a group made 26 percent of their conventional, conforming single-family loans to low- and moderate-income borrowers, while only 12 percent of the GSEs’purchases were mortgages made to this population.
The GSEs fell behind the primary market in reaching minorities, but the gap was not asgreat as it was for low- and moderate-income groups. As shown in exhibit 22, primarymarket lenders issued 4 percent of their conventional, conforming loans to Blacks. Be-tween 1 and 2 percent of Fannie Mae’s and Freddie Mac’s purchases were loans made toBlacks. (Other minority groups are not analyzed here because they do not account for asignificant portion of the population of metropolitan Pittsburgh.)
Lending institutions were issuing loans in proportion to the percentage of creditworthy andlikely borrowers in low- and moderate-income census tracts, while the GSEs were far

Boxall and Silver
190 Cityscape
behind in Pittsburgh. Financial Modeling Concepts (FMC) provided data on the numbersof creditworthy and likely borrowers in census tracts of different income categories. Low-and moderate-income census tracts contained 15 percent of the household population inPittsburgh that was creditworthy and likely to borrow. All lenders, as a group, issued 17percent of their conventional, conforming single-family loans to residents of low- andmoderate-income census tracts in 1995 and 1996. Six percent of Fannie Mae’s and FreddieMac’s purchases were loans made in these census tract categories (see exhibit 23).
In the category of home purchase lending, lending institutions almost lent in proportion tocreditworthy and potential borrowers in low- and moderate-income census tracts. Asexhibit 24 shows, low- and moderate-income census tracts contained about 19 percent ofthe total renter household population that was creditworthy and likely to buy homes.These census tracts received 16 percent of all conventional, conforming home purchaseloans in the Pittsburgh MSA during 1995 and 1996. Five percent of Fannie Mae’s andFreddie Mac’s purchases were home purchase loans made in low- and moderate-incomecensus tracts.
Economic and Demographic ContextThe economic and demographic conditions in Pittsburgh do not favor a high degree ofsecondary market activity, according to those interviewed. The Pittsburgh housing marketwas described as stable with very little housing appreciation. As mentioned above, a sub-stantial portion of Pittsburgh’s affordable lending was high LTV with no mortgage insur-ance. It takes a homeowner a longer time to build equity equal to 20 percent or more ofthe value of the home in a metropolitan area with flat housing values than in areas withappreciating values. If a mortgage has no insurance, it can still be sold to the GSEs oncea homeowner’s equity exceeds 20 percent of the home’s value (when equity exceeds 20percent of value, mortgage insurance is no longer required). Thus, even selling seasonedloans is more difficult in Pittsburgh than it would be elsewhere because of the nature ofthe housing market. 13
Several factors contribute to flat housing prices in Pittsburgh. During the interviews, itwas mentioned that several thousand people move out of the metropolitan area each year.As a result, the Pittsburgh area has one of the highest concentrations of senior citizens ofany MSA in the country. In addition, Pittsburgh has one of the lowest job growth rates ofall MSAs. Population outflows and slow job creation create a buyer’s market for single-family houses. It is still possible to purchase a good-quality home in Pittsburgh for
Exhibit 21
Pittsburgh, Pennsylvania, Metropolitan Area Primary and Secondary MarketActivity, 1995–96a
Primary Percentage ShareMarketb Number of Loans of Loans Sold Fannie Mae Freddie Mac
Originated 89,823 26 7 4
Purchased 9,513 35 11 9
Total 99,336 26 7 5
a Conventional, conforming loans on owner-occupied single-family properties.b Action reported by the HMDA respondent.
Source: Compiled from HMDA, Loan/Application Register data, 1995–96.
Percentage SharePurchased

Performance of the GSEs at the Metropolitan Level
Cityscape 191
approximately $40,000. In 1996 the HUD-estimated median family income was $38,200in Pittsburgh. Thus, the income-to-loan ratio is favorable for the borrower in the Pitts-burgh area.14
Affordable Lending ProgramsAs stated above, Pittsburgh-area lenders have been engaging in aggressive CRA-relatedlending featuring no private mortgage insurance and high LTVs. In an effort to moveaway from portfolio lending, banks worked with Fannie Mae and PCRG to design a newmortgage product in 1998. As the Fannie Mae product was being introduced into themarketplace, PNC Bank declined at the last minute to offer the product. PNC continuedwith a strategy of offering substantial amounts of loans with no private mortgage insur-ance. Other major lenders were not pleased, claiming that PNC was pursuing its owncompetitive ends without regard to local lenders’ collective need to start selling a signifi-cant amount of their loans to the secondary market. These lenders claimed that low- andmoderate-income borrowers would still have access to homeownership opportunities asportfolio lending declined. Although more mortgages would have private mortgage insur-ance, reduced downpayments and other features would make them accessible for those ofmodest means, according to this group of lenders.
A pioneer in the affordable lending arena is the Urban Redevelopment Authority (URA).URA used bond financing to issue affordable mortgages before the lenders started theiraggressive CRA lending program. This section describes the new Fannie Mae product andthe URA programs, as well as the affordable mortgage products of some Pittsburgh-arealenders.
Exhibit 22
Pittsburgh, Pennsylvania, Metropolitan Area Single-Family Loans by BorrowerIncome and Race/Ethnicity, 1995–96a
Percentage Share Percentage Share Purchased
Households Primary Marketb Fannie Mae Freddie Mac
Borrower income
Low (up to 50% of AMI) 25 8 2 2
Moderate (51–80% of AMI) 16 18 10 10
Middle (81–120% of AMI) 18 26 26 26
Upper (above 120% of AMI) 41 47 62 62
Totalc 100 100 100 100
Borrower race/ethnicity
White, non-Hispanic 91 94 96 96
Black, non-Hispanic 8 4 1 2
Other, non-Hispanic 1 1 1 1
Mixed NA 1 1 2
Totalc 100 100 100 100
a Conventional, conforming loans on owner-occupied single-family properties.b Share of loans originated or purchased by HMDA respondents.c Percentages may not sum to 100 due to rounding.
Sources: Compiled from HMDA, Loan/Application Register data, 1995–96, and U.S. Census, 1990.

Boxall and Silver
192 Cityscape
Residential Mortgage Underwriting Experiment. Lenders, community organizations,and Fannie Mae worked together to develop an affordable mortgage product that could besold to Fannie Mae. The Residential Mortgage Underwriting Experiment features a 97-percent LTV product that can be offered to families with incomes of up to 100 percent ofthe area median income. Although a 3-percent downpayment is required, gifts and grantscan cover up to 2 percent of the downpayment. Mortgage insurance is required. Ratios area generous 33/41, meaning that housing expenses can equal 33 percent of yearly incomeand total debt payments can equal 41 percent of annual income. Fannie Mae’s typicalproducts have ratios of 33/38.
In most metropolitan areas, a product featuring a 1-percent downpayment would be em-braced warmly by most actors in the affordable housing field. In Pittsburgh, however,reaction has been mixed. URA, PCRG, and some banks have expressed concerns that theproduct cannot reach as far down the income ladder as traditional no-mortgage insuranceproducts being offered in Pittsburgh.
The Urban Redevelopment Authority. The Urban Redevelopment Authority of the cityof Pittsburgh has been operating innovative home purchase and rehabilitation programsthat involve a combination of bond financing, CDBG funding, and secondary marketfinancing. Fannie Mae is involved in URA’s Pittsburgh Home Ownership Program(PHOP) and the Housing Recovery Program (HRP). PHOP is a first-time homebuyersprogram, and HRP is a purchase-rehab program. URA issues bonds to finance both PHOPand HRP. Lenders in the Pittsburgh area originate first mortgages in conjunction with theprograms. Then PNC Bank, the “master servicer,” purchases the first mortgages, usingURA’s bond proceeds to acquire the mortgages. Fannie Mae securitizes PNC’s portfolioof PHOP and HRP mortgages.
The PHOP and HRP mortgages are affordable because they require no mortgage insur-ance and feature low downpayments. URA is able to offer no mortgage insurance because
Exhibit 23
Pittsburgh, Pennsylvania, Metropolitan Area Single-Family Loans byNeighborhood Income, 1995–96a
Percentage Shares
Tract Likely andMedian CreditworthyIncome Households Borrowersb Primary Marketc Fannie Mae Freddie Mac
Low/moderate (up to 80% of AMI) 20 15 17 6 6
Middle/upper (above 80% of AMI) 80 85 83 94 94
Total 100 100 100 100 100
a Conventional, conforming loans on owner-occupied single-family properties.b See Case Study Organization and Crosscutting Methodological Issues section for definition of likelyand creditworthy borrowers.c Share of loans originated or purchased by HMDA respondents.
Sources: Compiled from HMDA, Loan/Application Register data, 1995–96; U.S. Census, 1990; andFinancial Modeling Concepts, 1997.
Percentage SharePurchased

Performance of the GSEs at the Metropolitan Level
Cityscape 193
Exhibit 24
Pittsburgh, Pennsylvania, Metropolitan Area Home Purchase Loans byNeighborhood Income, 1995–96a
Percentage Share
Tract Likely andMedian Renter CreditworthyIncome Households Borrowersb Primary Marketc Fannie Mae Freddie Mac
Low/moderate (up to 80% of AMI) 24 19 16 5 5
Middle/upper (above 80% of AMI) 76 81 84 95 95
Total 100 100 100 100 100
a Conventional, conforming home purchase loans on owner-occupied single-family properties.b See Case Study Organization and Crosscutting Methodological Issues section for definition of likelyand creditworthy borrowers.c Share of loans originated or purchased by HMDA respondents.
Sources: Compiled from HMDA, Loan/Application Register data, 1995–96; U.S. Census, 1990; andFinancial Modeling Concepts, 1997.
the lenders issuing the first mortgage have agreed to full recourse. In the event of a de-fault, the lenders have agreed to assume full costs. URA offers a $1,000 closing-costassistance grant funded by CDBG for PHOP and HRP mortgages. URA also offers asecond mortgage under HRP, which, depending on rehabilitation needs and borrowerincome levels, can be a deferred loan of up to 20 to 40 percent of the total mortgage.Lower income families receive more generous deferred loans. Families with incomes ashigh as 100 percent of the median income can use both PHOP and HRP.
PHOP was likely to undergo significant changes after the field interviews were conductedfor this research. Lending institutions have concluded that they can no longer afford toassume full recourse for the mortgages issued under the program. URA has been negotiat-ing to have Fannie Mae assume partial recourse. At this point, Fannie Mae has declined toassume partial recourse. URA believes it may have to convert PHOP into a product thatwill carry mortgage insurance and that will not be as affordable for the borrower. URAbelieves that HRP, will continue with full lender recourse because the number of loansmade during a typical year is considerably less than PHOP. URA estimated annual PHOPvolume at 300 loans and HRP volume at 100.
PNC Bank Corporation. PNC Bank is a major lender that exemplifies the tentative ap-proach lenders seem to have toward the GSEs in the Pittsburgh market. The GSEs do notpurchase high volumes of mortgages, because some major lenders such as PNC are am-bivalent about ending their portfolio lending. In fact, PNC’s overall secondary marketvolume is relatively low. For example, the bank and its affiliated mortgage companyoriginated 2,198 conventional loans in 1996. It sold only 90 of these to Fannie Mae and193 of them to Freddie Mac.
In 1996 PNC Bank issued 4,941 single-family loans, which was approximately 9 percentof all single-family loans made in the Pittsburgh MSA. PNC extended 36.2 percent of its
Percentage SharePurchased
Boxall and Silver
194 Cityscape
loans to low- and moderate-income borrowers in 1996, while all lenders as a group issued25.6 percent of their loans to these income groups.15
Since 1987, PNC has been offering its Neighborhood Mortgage Program (NMP) in thePittsburgh market. This is an aggressive product that features no downpayments (100-percent LTV) and no mortgage insurance. It also has flexible underwriting criteria. PNCrepresentatives stated that NMP underwriting looks at 12 months of credit history, incontrast to most products with mortgage insurance that will consider 24 months of credithistory.
The NMP product is designed to overcome the major barriers of cash to close and credithistory that confront lower income borrowers in Pittsburgh, according to bank officials.Lower income homebuyers do not have difficulties with monthly mortgage paymentssince housing is affordable in Pittsburgh. Although NMP has a market interest rate, bor-rowers have not had problems paying on time. Delinquency and default rates are low onNMP portfolio loans, according to PNC.
A few years ago, PNC attempted to tighten up the NMP product so that it could qualify asa Fannie Mae product. The bank, however, experienced volume losses that it did not wantto sustain in the low- and moderate-income market. The bank loosened up the NMP prod-uct in 1997. As mentioned above, PNC decided not to offer the Residential MortgageUnderwriting Experiment product, much to the consternation of its competitors.
Even PNC is not immune to portfolio pressures. Although the bank holds fast to the port-folio lending tradition, its overall NMP lending volume has declined. PNC has lowered itsgoal for its NMP product to about $25 million in total loans in 1998. This is down consid-erably from $60 million in previous years. At the same time, PNC Mortgage Corporationis rolling out a Freddie Mac product. This is a 97-percent LTV product offered by itsmortgage company in markets across the country. It is possible that PNC Bank loweredthe dollar goals for its NMP product because it wants the Freddie Mac product to serve asegment of the customers in the NMP market.
National City Bank. National City Bank is one of the major lenders in the overall Pitts-burgh market and in the low- and moderate-income portion of the market in particular.The bank has pulled back a bit from its aggressive CRA products to reduce the buildupon its portfolio.
National City has a 100-percent LTV product with no mortgage insurance. It increasedthe interest rate on this product 2 years ago to encourage more borrowers to use otherNational City products that can be sold to the secondary market. National City offersmortgages under the Residential Mortgage Underwriting Experiment discussed above. Italso offers Fannie Mae’s Flex 97 product with a 3-percent downpayment feature and noincome limits. This product is designed for people with good credit history but with lim-ited savings for downpayments.
Mellon Bank Corporation. Mellon Bank dealt with portfolio pressure recently by sellingloans on Wall Street rather than striking long-term business deals with either GSE. In 1998Mellon sold $335 million of its CRA portfolio of loans to low- and moderate-income bor-rowers on Wall Street. The investment firm handling the deal was Bear Stearns.
Market demand for CRA portfolio loans is currently high, according to Mellon officials.Reportedly, investment firms prefer CRA portfolios because there is less risk of loansbeing prepaid before their term is up. The low- and moderate-income purchasers acquired

Performance of the GSEs at the Metropolitan Level
Cityscape 195
the loans at a lower interest rate than they can currently obtain if they seek to refinance.Thus investors’ prepayment risk is minimized. Mellon Bank’s experience indicates that inthe current interest rate environment, the GSEs face serious competition from Wall Streetinvestors for CRA loans.
Federal Home Loan Bank of Pittsburgh. The FHLB of Pittsburgh is another potentialsource of competition for Fannie Mae and Freddie Mac. The FHLB official interviewedfor this research stated that the GSEs enjoy a “risk reward” in some parts of the country.That is, the price they charge to buy mortgages from banks more than compensates themfor the risk they assume with the mortgage purchases. Since the field interviews wereconducted, FHLB of Pittsburgh has implemented the pilot program of FHLB of Chicagoas a means of competing with Fannie Mae and Freddie Mac. Under the pilot program, theFHLB system assumes the interest rate risk of mortgages while banks assume the creditrisk associated with mortgages. This program alleviates some of the risk for banks andthus provides benefits similar to those that occur when a bank sells mortgages to FannieMae and Freddie Mac.
FHLB also works with banks and Fannie Mae and Freddie Mac to increase the level ofaffordable lending in Pennsylvania. FHLB of Pittsburgh has a Homebuyer Equity Fund(HBEF) that offers grant assistance for downpayments of low- and moderate-incomepurchasers. For every $1 that a borrower commits for a downpayment, FHLB will offera $3 match, up to a maximum of $5,000. HBEF is used in conjunction with Fannie 97,which is one of Fannie Mae’s 3-percent downpayment products. A borrower using HBEFgrants must undergo homebuyer counseling. So far HBEF has been used mostly in Altoona,Pennsylvania, but will be expanded into Pittsburgh in the near future. National City is oneof the participating lenders.
ConclusionThe affordable housing system in Pittsburgh is well developed. URA has been operatinginnovative bond-financed home purchase and rehabilitation programs that also combinebank loans and subsidies from HUD programs. The banks have been offering aggressivehigh-LTV products for a number of years. Starting in the late 1980s, a citywide CRAadvocacy group, PCRG, established partnerships with a number of local lenders to helpthem pursue profitable lending opportunities in inner-city neighborhoods. The results ofthe partnerships between the city, PCRG, and the lenders are impressive. Lenders in thePittsburgh MSA come closer than lenders in the other case-study MSAs in serving credit-worthy renters living in low- and moderate-income census tracts in proportion to theirpopulation. According to FMC data, 19 percent of the creditworthy renters likely to buyhomes resided in low- and moderate-income neighborhoods. All lenders, as a group, made16 percent of their conventional, conforming home purchase loans in these census tracts.Only 5 percent of Fannie Mae’s and Freddie Mac’s purchases of similar mortgages wereloans made in low- and moderate-income census tracts.
Economic and demographic conditions were not conducive to an active secondary mar-ket in the Pittsburgh area. It is also clear that the GSEs performed poorly in Pittsburghrelative to their performance elsewhere because their business relationships with arealenders were not integrated with the efforts of the local affordable housing system. Theaffordable housing system in Pittsburgh has been well established in the city for a numberof years, long before the GSE housing goals motivated the GSEs to increase their businessin low- and moderate-income markets. An attempt to introduce a Fannie Mae product inthe Pittsburgh market remains uncertain. While the banks in the Pittsburgh MSA desire toreduce the amount of their portfolio lending, it is likely that they will continue exploring

Boxall and Silver
196 Cityscape
alternatives to the GSEs, including the FHLB system and Wall Street. In contrast to Pitts-burgh, the GSEs in Washington, D.C.; Houston, Texas; and Columbus, Ohio, seemed tobe more successful in establishing linkages in the affordable housing system and offeringnew products.
Conclusions and Policy ImplicationsThis section summarizes the study’s conclusions and provides recommendations regard-ing the potential utility of metropolitan housing goals and other measures and strategiesthat HUD might consider in its oversight of the GSEs.
Cross-Site SummaryInstitutional Relationships: The Affordable Housing and Business System.Institutional relationships can bolster the GSEs’ efforts to serve minority and low- andmoderate-income populations. In the Houston case study, institutional relationshipsplayed a significant role in Fannie Mae’s ability to reach traditionally underserved popu-lations. In the Washington, D.C., and Columbus case studies, institutional relationshipswere not as well developed but helped serve niche markets or particular neighborhoods.In the Pittsburgh case study, the absence of linkages between the affordable housing andbusiness systems contributed to an inability of the GSEs to serve minority and lowerincome households.
In Houston, a convergence between the local affordable housing system and the GSEs’business system significantly improved the performance of Fannie Mae in terms of theaffordable housing goals. A consortium of lenders successfully negotiated with FannieMae to purchase mortgages from an affordable homeownership program that has served15 to 20 percent of the low- and moderate-income homebuyers in the city of Houston inrecent years.
In the Washington, D.C., and Columbus metropolitan areas, institutional relationshipswere in an earlier stage of development than in Houston. In Washington, D.C., a handfulof local lenders had negotiated with Fannie Mae to purchase the mortgages offered tograduates of local counseling programs. Freddie Mac had also joined forces with locallenders and a homeownership counseling organization. In Columbus, the Fannie Maepartnership office was busy involving itself with the affordable housing programs of lend-ers and public-sector entities. It is not clear to what extent the local affordable housingsystem and the GSEs’ business system will merge in Columbus and Washington, D.C.While the GSEs’ participation in the affordable housing system in Columbus and Wash-ington, D.C., has helped serve particular credit needs and niche markets, it has not con-tributed significantly to GSE performance under the housing goals. Favorable economicand demographic characteristics account more for the GSEs’ performance in Washington,D.C., and Columbus than the institutional relationships. This will likely continue to be thecase until the affordable housing system and the GSEs’ business system grow closer. Thatis, either or both GSEs will have to collaborate to a greater extent with local affordablehousing institutions to develop mortgage products that serve a broader section of theunderserved population in these areas.
In Pittsburgh, the local affordable housing system and the GSEs’ business system wereseparate and are likely to remain so. Lenders had established aggressive CRA lendingprograms and held most loans in portfolio in the late 1980s and early 1990s. Lenders andpublic-sector agencies have approached the GSEs in fits and starts. Secondary marketprograms are started and then abandoned or lessened in scale. In addition to institutionalbottlenecks, economic and demographic conditions are not conducive to GSE purchases.

Performance of the GSEs at the Metropolitan Level
Cityscape 197
The case studies also demonstrate that institutional relationships among the GSEs, banks,local public agencies, and nonprofit organizations are necessary to overcome the consid-erable information barriers that remain between low- and moderate-income and minoritypopulations and financial institutions. A substantial proportion of this population has nothad any interaction with financial institutions. Consequently they do not know how toestablish solid credit histories and otherwise prepare themselves for homeownership op-portunities. Lending institutions and GSEs, for their part, are learning how to evaluate thecreditworthiness of traditionally underserved populations. They are also gaining experi-ence in combining public and private financing for affordable homeownership opportuni-ties in a safe and sound manner. The case studies include a number of notable examples ofaffordable homeownership programs that overcame information barriers and successfullyserved large numbers of minority and lower income populations. The case studies alsodescribe a variety of private- and public-sector actors making coordinated and sustainedefforts to direct loans and investments to neighborhoods struggling to revitalize them-selves after years of disinvestment.
Government-Sponsored Enterprise Performance. Overall, in the four case-study met-ropolitan areas, as for all metropolitan areas in the country combined (see exhibit 6), theGSEs did not purchase loans to minority and lower income populations in the same pro-portions that lending institutions made loans to these populations. The gaps varied, beingthe widest in Pittsburgh and the narrowest in the Washington, D.C., metropolitan area.Not surprisingly, both lenders and the GSEs were able to serve moderate-income popula-tions in a proportion closer to their percentage of the household population than low-income populations. Both lenders and the GSEs, however, consistently failed to reachminorities, particularly Black households, in proportion to their population share (with theGSEs further from the mark than lenders).
Serving Minority and Low- and Moderate-Income Borrowers. The data on lending totargeted borrowers support the institutional hypothesis presented in this article. In theHouston metropolitan area, for example, Fannie Mae was consistently ahead of FreddieMac in the percentage of purchases of loans made to underserved populations. FannieMae and lenders came closer to merging their business relationships with the local afford-able housing system in Houston than in the other areas examined. The data also show thatGSE performance in Washington, D.C., and, to a lesser extent, Columbus, was better thanin Pittsburgh, where the GSEs had the most difficulty establishing institutional relation-ships in the local affordable housing system.
Serving Low- and Moderate-Income Neighborhoods. The GSEs and lenders camecloser to serving, in proportion to their population, creditworthy and likely borrowers inlow- and moderate-income neighborhoods for refinance and home improvement loansthan for home purchase loans. In three of the four case-study metropolitan areas, bothlenders and GSEs were far off the mark in providing home purchase loans in proportion tocreditworthy renters in these neighborhoods. For example, in the Washington, D.C.,MSA, 24 percent of the creditworthy renters likely to buy homes resided in low- andmoderate-income tracts. All lenders, as a group, made only 12 percent of their home pur-chase loans to residents of low- and moderate-income tracts and only 11 percent of theGSEs’ purchases were mortgage loans made to these residents.
The one exception to this trend was Pittsburgh, where lenders offered home purchaseloans almost in proportion to creditworthy renters, while the GSEs’ purchases were notclose to being in proportion. As shown by the case study, aggressive CRA-related mort-gage lending to low- and moderate-income census tracts was making significant strides inPittsburgh. The question is to what extent the GSEs’ revision of their own policies as well

Boxall and Silver
198 Cityscape
as revised affordable housing goals can result in more GSE purchases of safe and soundmortgage loans made in lower income neighborhoods in markets such as Pittsburgh.
Policy ImplicationsRevised HUD Housing Goals. Regulatory and legislative developments have been partlyresponsible for lenders serving a higher percentage of minority and low- and moderate-income borrowers than GSEs. CRA and HMDA have empowered community organiza-tions to engage in advocacy and to establish partnerships with lending institutions toincrease access to credit for traditionally underserved populations. Also, HUD and theU.S. Department of Justice have stepped up enforcement of the Fair Housing Act, whichhas encouraged lenders to serve more minorities.16
As trend analyses by HUD show, the affordable housing goals contributed to an increasein GSE purchases of mortgages made to underserved populations yet not at levels that areproportional to the number of mortgages made to those populations. The Pittsburgh casestudy and to a lesser extent the Columbus case study illustrate that lenders cannot indefi-nitely sustain vigorous CRA lending without more of an outlet to the secondary market.Our case studies used alternative benchmarks based on CRA income definitions as a wayto illustrate how the affordable housing goals could be amended.
In particular, it is possible and perhaps desirable for income targets in the affordable hous-ing goals to include targets for serving borrowers with incomes below 80 percent of areamedian income, although this would require a change to existing legislation. The currentlow- and moderate-income goal specifies a percentage of GSE purchases that must beloans made to borrowers at or below 100 percent of area median income. This articleshows that lenders in the case-study metropolitan areas and in all metropolitan areas com-bined make a higher percentage of single-family loans to borrowers who earn 80 percentof area median income than the GSEs are purchasing. CRA has been a key in motivatinglenders to make loans to borrowers with incomes below 80 percent of area median income.The low- and moderate-income goal could include a subgoal for below 80 percent of areamedian income to encourage the GSEs to come closer to the lenders’ portion of businesstargeted to this income category. Alternatively, HUD could increase the existing specialaffordable housing goal to improve the GSEs’ targeting of lower income borrowers.
In addition, the GSE affordable housing goals could include targets for reaching indi-vidual minority borrowers as well as high-minority areas, since lenders and the GSEsconsistently did not serve minorities (particularly Blacks) in proportion to their share ofthe household population. The CRA regulations could also be amended to require that thelending test of the CRA exam explicitly consider lending to minorities in the same man-ner as it considers lending to low- and moderate-income borrowers.17
Finally, subgoals or reporting requirements in the GSE annual reports to HUD could differ-entiate among types of loans. Research for this article found that the GSEs and lenders weredoing a better job reaching low- and moderate-income neighborhoods with refinance andhome improvement lending than with home purchase mortgage lending. If subgoals by typeof loan are not adopted, the GSEs should continue reporting purchases by loan type in theirannual reports to HUD and explain their progress in purchasing different types of loans.Reporting on progress made in the area of home purchase lending should be emphasized,since this was the type of loan that both lenders and the GSEs had the most difficultyoffering in low- and moderate-income neighborhoods in the case-study cities. This wouldhelp policymakers and all concerned parties boost home purchase lending and other typesof loans that are not reaching underserved borrowers and neighborhoods.

Performance of the GSEs at the Metropolitan Level
Cityscape 199
Local Housing Strategies. For the most part, the officials interviewed did not recommendmetropolitan housing goals. Metropolitan housing goals would specify, on a metropolitanlevel, the percentage of mortgages that the GSEs would be required to purchase undergoals similar to the current nationwide low- and moderate-income goal, underserved-areasgoal, and special affordable-housing goal. We concur with this conclusion, since businessdecisions made by lenders to sell mortgages to the GSEs do not correspond neatly withindividual metropolitan areas. In many instances, lenders’ offices located outside of aparticular metropolitan area negotiate with the GSEs over the loans that will be sold to theGSEs. Since secondary market decisions are often made on a national or regional level, itwould be difficult to tailor the GSE affordable housing goals to a metropolitan level. Thisdoes not mean, however, that metropolitan housing strategies would not be useful. FannieMae, for example, develops multiyear investment goals for its partnership offices ex-pressed in terms of the dollar amount of affordable housing financed at the local level.
We believe these efforts should be broadened. First, it would be useful for the GSEs toreport, in their annual reports, the percentage of loans purchased by the GSEs on a metro-politan level, as is done in appendix A of this article. HUD also could improve the acces-sibility of information on borrower and loan characteristics at the census tract level.Policymakers, GSEs, lenders, and community organizations could then observe in whichareas the GSEs are purchasing a high percentage of loans made to minority and low- andmoderate-income borrowers and neighborhoods and in which areas the GSEs could bol-ster the percentage of mortgages made to these populations.
Second, the HUD Consolidated Planning and Analysis of Impediments processes couldinclude studying lending patterns and GSE purchases at the local level. The Houston casestudy illustrated how ambitious lending goals may motivate public- and private-sectoractors to redouble their efforts to provide homeownership opportunities for working-classand minority borrowers. If goals are based on solid analyses and implementation strate-gies, they can indeed lead to increases in affordable housing and contribute to the revital-ization of neighborhoods.
Local and State agencies receiving HUD funding for community development programs(such as the CDBG and HOME programs) must submit Consolidated Plans to HUDshowing how housing strategies and planned program expenditures are based on analysesof housing needs. As part of the Consolidated Plan, communities are required to submit acertification to affirmatively further fair housing through an Analysis of Impediments.Community groups and interested citizens are provided opportunities to review drafts ofConsolidated Plans and then make their recommendations regarding the priorities estab-lished by local and State agency housing strategies and programs. HUD also has a role inreviewing the Consolidated Plans.
In the development of Consolidated Plans, HUD encourages local jurisdictions to usehousing needs data. This information includes the number and percentage of housing unitsthat are in substandard condition, the number and percentage of households that live inovercrowded units, and the number and percentage of households that cannot affordmonthly rent and mortgage payments (these are payments that exceed 30 percent ofmonthly income). The analysis of housing needs data informs choices about housingprograms.
We recommend that HUD encourage public agencies to conduct analyses of patterns oflending and GSE purchases as part of the Consolidated Planning and Analysis of Impedi-ments processes.18 If jurisdictions analyze the data in a manner similar to this article’sanalysis, public agencies could identify imbalances between the number of minority and

Boxall and Silver
200 Cityscape
low- and moderate-income households and the portion of loans and GSE purchases serv-ing these households. Jurisdictions could then work with lenders, the GSEs, and nonprofitcommunity organizations to address these imbalances with affordable housing programsand partnerships. The jurisdictions would then be maximizing the extent of private-sectoractivity in meeting credit needs and hopefully would be minimizing the need for publicsubsidies. Comprehensive planning as part of the Consolidated Plans may motivate acloser connection between the affordable housing and business systems if it convincesprivate-sector actors that profitable lending and purchasing opportunities are beingmissed.
Postscript. Since our interviews with GSE officials and lending institutions in 1998,Fannie Mae and Freddie Mac have embarked on a number of noteworthy initiatives thatinvolve linking their business systems with local affordable housing systems. In Novem-ber 1999, for example, Fannie Mae and FleetBoston Financial Corporation announcedthat Fannie Mae would purchase $2.5 billion of mortgages FleetBoston intends to make tolow- and moderate-income borrowers in New England over the next 5 years.19 In a speechin September 1999, Franklin D. Raines, Fannie Mae’s Chairman and Chief ExecutiveOfficer, stated that Fannie Mae has purchased $3 billion in CRA loans so far, and the GSEpledges to purchase $10 billion by 2002. He added that 25 percent of the loans Fannie Maepurchased in 1998 were made to borrowers with incomes at 80 percent or less of areamedian income.20
Freddie Mac is also publicizing the links it is forming with the affordable housing systemin localities across the country. In the summer of 1999, for example, Freddie Mac pledgedto purchase $60 million in mortgages for 1,000 low- and moderate-income borrowers inthe “Quad” cities of Rock Island and Moline, Illinois, and Davenport and Bettendorf,Iowa. Freddie Mac will be working in partnership with local public agencies, nonprofitorganizations, American Bank & Trust, First Midwest Mortgage, and Mercantile Bank.21
We hope this article sheds some light on efforts by the GSEs, lenders, public agencies,nonprofit community organizations, and HUD to increase linkages between local afford-able housing systems and the GSEs’ business systems.
AcknowledgmentsThis article was written by Patrick Boxall of KRA Corporation (KRA) and Joshua B.Silver of the National Community Reinvestment Coalition (NCRC). KRA Research As-sistant Danielle Boyce and NCRC Research Analyst Peter Notaro assisted with quantita-tive data analysis.
The authors acknowledge the insightful and thorough commentary of Paul B. Manchester,Government Technical Representative at HUD. In addition, we thank John L. Gardnerand Harold L. Bunce of HUD for their valuable input. We also are grateful for the usefulcomments provided by two anonymous reviewers.
We especially wish to thank the many officials from Fannie Mae, Freddie Mac, and otherpublic- and private-sector lending and housing organizations who took the time to speakwith us during our field visits. Their contributions were vital to this effort.
Performance of the GSEs at the Metropolitan Level
Cityscape 201
AuthorsPatrick Boxall is a senior analyst with KRA Corporation, a professional and technicalservices firm based in Silver Spring, Maryland, where he oversees research on housing,community development, and transportation policy. His current work focuses on the useof HUD funds by State and local governments for economic development and on theneighborhood impacts of the Community Development Block Grant program. He alsodirects a study on the application of the rent reasonableness requirement in the tenant-based Section 8 program.
Joshua B. Silver is vice president of research and policy with the National CommunityReinvestment Coalition (NCRC). He develops NCRC’s policy positions, writes congres-sional testimony, and conducts research on topics including financial modernization, theeffectiveness of the Community Reinvestment Act (CRA), and the regulation of the GSEs.In his technical advisory role, Silver helps community organizations devise neighborhoodreinvestment strategies and interpret Home Mortgage Disclosure Act and CRA data onlending activity. He was previously involved in writing a community reinvestment text-book funded by a grant from the Fannie Mae Foundation to the NCRC.
Notes1. See “Cuomo Announces Action To Provide $2.4 Trillion in Mortgages for Affordable
Housing for 28.1 Million Families,” HUD Press Release No. 99–131, July 29, 1999.
2. In addition to the goals detailed in exhibit 3, HUD required that mortgages on afford-able multifamily housing account for a fixed portion of GSE purchases in dollar terms.
3. Among its principal shortcomings, HMDA does not include the universe of loansacquired by GSEs, and the data that are reported under HMDA do not provide anentirely accurate portrayal of GSE activity. HMDA does not include informationfrom a portion of the institutions that may have sold loans to the GSEs, especiallysmaller lenders and lenders based in nonmetropolitan areas that are not required toreport for HMDA. Further, some lenders that are required to report for HMDA failto do so accurately. Also, end-of-year sales to the GSEs will be underrepresented inHMDA because respondents only report a loan sale if the transaction occurs in thesame calendar year as the origination or purchase. Moreover, lenders need not reportrace, national origin, or gender if a loan application is made entirely by telephone.See Scheessele, Randall M., 1998. “HMDA Coverage of the Mortgage Market,” U.S.Department of Housing and Urban Development, Office of Policy Development andResearch, Housing Finance Working Paper Series No. HF–007.
4. Appendix A presents HMDA-derived GSE performance data (the percent of loansmeeting each of the affordable housing goals) for individual metropolitan areas.
5. The primary national objective of the CDBG program is to benefit persons with lowand moderate incomes, that is, those with incomes less than or equal to 80 percent ofarea median income. The HOME program targets families in the same income cat-egory; however, the program labels this income category low income.
6. FMC obtains FICO scores from three credit bureaus for renters and homeowners inlow- and moderate-income census tracts. Developed by the private firm Fair Isaacand Company, FICO scores are based on credit history and indicate the creditworthi-ness of families and individuals. FMC uses a threshold FICO score of 660 to indicatecreditworthiness. Scores of 660 and above are generally considered indicative that therisk of default and delinquency is low and acceptable for offering home loans.
Boxall and Silver
202 Cityscape
7. The information presented for Washington, D.C., and other case studies does notinclude Government-insured loans, unless noted otherwise. It is possible that theexclusion of Government-insured mortgages limits the usefulness of household distri-bution as a benchmark for activity by the GSEs and primary lenders. As shown byaggregate HMDA data, lower income borrowers are most likely to use Government-insured loan products. It could be argued, therefore, that Government-insured loansshould be included in determining whether lending activity is “in proportion” tothe household income distribution. This analysis, however, excluded Government-insured loans to facilitate the comparison of activity by the GSEs and primarylenders—the GSEs by and large do not purchase this type of loan.
8. In 1996 the average median value of housing in the Washington, D.C., metropolitanarea was $177,912 and the HUD-estimated median family income was $68,300. Theaverage conventional loan was $166,468 for all income groups and was $112,055 formoderate-income borrowers in 1996.
9. For the Washington, D.C., case study, the lender-by-lender analysis includes allsingle-family loans, not only those that conform to GSE limits.
10. If all mortgages originated in conjunction with the HHFC program were sold toFannie Mae in 1995–96, they would have made up approximately 20 percent of thelow- and moderate-income loans purchased by Fannie Mae in the Houston metropoli-tan area.
11. The HUD-estimated median family income was $46,200 in 1996. The median homevalue was $74,004 while the average conventional mortgage loan amount was$112,527.
12. Data for the Columbus case study lender-by-lender analysis include all single-familyhome loans, not only those that conform to GSE limits.
13. This example illustrates the point about equity being built up quicker in marketswhere house values are appreciating. Suppose the original sales prices of two identi-cal homes were $47,500 in two different markets. Both homebuyers take a 100-percent LTV mortgage without private mortgage insurance or other credit enhance-ments, so their loans cannot be sold to GSEs. In one market the house appreciates invalue to $50,000 in year two, while in the other market the house is still valued at$47,500. Excluding repayment of principal, the homeowner in the appreciating mar-ket already has built $2,500 of equity, or 5 percent of the home’s value. The borrowerin the stagnant market still has not accumulated any equity. If this pattern continuesover several years, the loan on the home in the appreciating market will soon be eli-gible for sale to the GSEs because the owner has accumulated equity that equals 20percent of the home’s new value. Appreciation alone, therefore, can help get loans tothe GSEs faster.
14. The median value of homes is about $57,400. The average conventional mortgagemade in 1996 was for $84,410; moderate income home purchasers borrowed$42,205, on average.
15. In the Pittsburgh case study, the lender-by-lender analysis includes all single-familyloans, not only those that conform to GSE limits.
16. The U.S. Department of Justice, for example, settled a number of suits with lendersover violations of the Fair Housing Act and the Equal Credit Opportunity Act in theearly and mid-1990s.

Performance of the GSEs at the Metropolitan Level
Cityscape 203
17. CRA exams for large banks (those with assets of $250 million or more) consist of alending test, an investment test, and a service test. The lending test for a bank mea-sures the number and percentages of loans issued to low- and moderate-income bor-rowers and neighborhoods (as defined in the CRA regulations as income below 80percent of area median income). The CRA statute and regulations do not requireexaminers to measure lending to minorities in the same manner. Small banks (thosewith assets of less than $250 million) have a lending test similar to large banks butnot an investment or service test.
18. For more information on the Analysis of Impediments process, see Fair HousingPlanning Guide, Vols. I & II. 1996. Washington, DC: U.S. Department of Housingand Urban Development.
19. See “FleetBoston, Fannie in $2.5 Billion Housing Plan,” by Joshua Brockman in theAmerican Banker, November 22, 1999.
20. See “Fannie Mae and the CRA,” by Franklin D. Raines, reprinted in Banking andCommunity Perspectives, Fourth Quarter 1999, Federal Reserve Bank of Dallas.
21. Freddie Mac press release, June 1999.
Appendix AExhibit A–1
Percentage of GSE Single-Family Loan Purchases Qualifying for the AffordableHousing Goals at the Metropolitan Level, 1996
Low- and Underserved SpecialModerate-Income Areas AffordableHousing Goal (%) Goal (%) Housing Goal (%)
Metropolitan Fannie Freddie Fannie Freddie Fannie FreddieStatistical Area Mae Mac Mae Mac Mae Mac
Abilene, TX (MSA) 25.4 21.9 14.3 14.8 12.3 6.3
Akron, OH (PMSA) 40.7 39.3 22.3 20.8 14.1 12.2
Albany, GA (MSA) 18.8 18.2 24.3 25.2 6.2 6.4
Albany-Schenectady-Troy, NY (MSA) 32.0 31.1 13.1 10.8 7.9 7.8
Albuquerque, NM (MSA) 38.6 34.4 41.8 40.8 12.6 10.2
Alexandria, LA (MSA) 19.8 19.6 10.5 16.7 3.9 4.3
Allentown-Bethlehem-Easton, PA (MSA) 32.1 33.3 16.6 16.6 8.1 8.2
Altoona, PA (MSA) 19.1 29.5 19.6 19.8 1.5 6.5
Amarillo, TX (MSA) 21.8 18.2 12.1 10.1 6.1 3.2
Anchorage, AK (MSA) 42.7 38.7 21.0 17.4 14.0 14.2
Ann Arbor, MI (PMSA) 44.5 40.6 22.3 16.1 14.6 11.0
Anniston, AL (MSA) 24.2 19.9 7.9 4.5 5.9 2.9
Appleton-Oshkosh-Neenah, WI (MSA) 40.7 37.7 17.3 13.8 7.8 7.1
Asheville, NC (MSA) 38.3 33.1 14.1 12.0 11.1 8.3

Boxall and Silver
204 Cityscape
Exhibit A-1 (continued)
Percentage of GSE Single-Family Loan Purchases Qualifying for the AffordableHousing Goals at the Metropolitan Level, 1996
Low- and Underserved SpecialModerate-Income Areas AffordableHousing Goal (%) Goal (%) Housing Goal (%)
Metropolitan Fannie Freddie Fannie Freddie Fannie FreddieStatistical Area Mae Mac Mae Mac Mae Mac
Athens, GA, (MSA) 32.5 27.8 30.3 22.4 13.3 9.0
Atlanta, GA (MSA) 44.6 42.8 19.3 19.1 12.9 13.0
Atlantic-Cape May, NJ(PMSA) 34.2 34.1 23.7 16.5 8.1 7.1
Augusta-Aiken, GA-SC(MSA) 33.3 31.4 22.7 20.3 9.2 7.1
Austin-San Marcos, TX(MSA) 25.6 22.6 15.2 14.4 6.7 5.9
Bakersfield, CA (MSA) 26.4 25.4 20.7 16.2 11.1 9.1
Baltimore, MD (PMSA) 39.5 37.5 15.7 15.2 11.8 10.6
Bangor, ME (MSA) 27.2 31.7 15.9 10.9 5.9 6.2
Barnstable-Yarmouth, MA(MSA) 34.8 32.1 24.7 21.8 10.9 7.0
Baton Rouge, LA (MSA) 25.6 22.8 19.7 18.7 7.0 5.0
Beaumont-Port Arthur, TX(MSA) 25.3 19.4 16.6 16.6 8.7 3.8
Bellingham, WA (MSA) 34.3 38.4 18.4 20.5 8.3 10.9
Benton Harbor, MI (MSA) 42.3 40.2 13.2 8.5 13.9 9.4
Bergen-Passaic, NJ(PMSA) 42.6 44.2 26.6 23.8 10.0 9.3
Billings, MT (MSA) 38.3 34.4 17.1 16.2 10.4 10.2
Biloxi-Gulfport-Pascagoula, MS (MSA) 22.8 19.8 21.6 26.3 5.3 5.4
Binghamton, NY (MSA) 28.3 31.6 13.2 16.5 7.4 9.1
Birmingham, AL (MSA) 26.4 26.5 14.0 14.0 5.3 5.8
Bismarck, ND (MSA) 28.9 28.7 10.6 14.8 8.6 5.1
Bloomington, IN (MSA) 29.3 35.6 17.2 14.1 10.0 10.2
Bloomington-Normal, IL(MSA) 45.6 42.3 31.2 25.9 14.1 10.6
Boise City, ID (MSA) 42.9 41.9 22.3 20.7 10.7 12.9
Boston, MA-NH (PMSA) 40.6 37.9 23.1 20.8 10.6 9.4
Boulder-Longmont, CO(PMSA) 47.6 46.6 20.0 21.8 14.6 16.2
Brazoria, TX (PMSA) 25.5 25.0 10.8 12.2 7.1 3.6
Bremerton, WA (PMSA) 35.8 36.1 12.9 10.3 7.6 7.5
Bridgeport, CT (PMSA) 42.5 40.7 9.1 9.6 10.6 9.5
Brockton, MA (PMSA) 46.1 41.1 9.5 6.8 11.9 10.7
Brownsville-Harlingen-San Benito, TX (MSA) 11.1 5.1 46.8 39.1 1.7 0.9
Bryan-College Station,TX (MSA) 26.6 17.3 17.1 23.8 6.8 4.4

Performance of the GSEs at the Metropolitan Level
Cityscape 205
Exhibit A-1 (continued)
Percentage of GSE Single-Family Loan Purchases Qualifying for the AffordableHousing Goals at the Metropolitan Level, 1996
Low- and Underserved SpecialModerate-Income Areas AffordableHousing Goal (%) Goal (%) Housing Goal (%)
Metropolitan Fannie Freddie Fannie Freddie Fannie FreddieStatistical Area Mae Mac Mae Mac Mae Mac
Buffalo-Niagara Falls,NY (MSA) 29.1 27.6 10.6 9.7 6.0 6.2
Burlington, VT (MSA) 38.5 36.2 18.1 15.1 10.1 8.5
Canton-Massillon, OH(MSA) 47.1 44.7 15.5 12.1 13.8 11.8
Casper, WY (MSA) 40.1 43.5 18.5 16.0 13.2 13.7
Cedar Rapids, IA (MSA) 50.3 45.4 18.4 15.0 14.6 11.2Champaign-Urbana, IL(MSA) 45.2 38.6 14.6 15.2 17.0 12.9Charleston, WV (MSA) 22.2 21.6 22.0 16.7 5.2 5.0
Charleston-NorthCharleston, SC (MSA) 27.6 28.4 21.6 20.8 7.1 7.1Charlotte-Gastonia-Rock Hill, NC-SC (MSA) 33.8 35.9 18.7 19.3 8.6 9.2Charlottesville, VA (MSA) 41.9 39.1 16.6 21.7 15.1 14.4
Chattanooga, TN-GA(MSA) 25.7 25.0 14.2 13.2 4.7 4.9
Cheyenne, WY (MSA) 41.8 35.4 18.3 15.5 13.8 12.6
Chicago, IL (PMSA) 44.9 42.7 19.3 19.2 12.7 12.3
Chico-Paradise, CA(MSA) 24.6 23.7 22.9 24.7 5.3 5.6
Cincinnati, OH-KY-IN(PMSA) 43.1 39.6 20.3 17.9 14.0 12.8
Clarksville-Hopkinsville,TN-KY (MSA) 17.6 25.0 12.6 12.7 4.0 6.7
Cleveland-Lorain-Elyria,OH (PMSA) 42.8 40.1 19.6 18.1 11.9 10.5
Colorado Springs, CO(MSA) 37.9 33.3 22.5 21.2 11.2 9.2
Columbia, MO (MSA) 39.9 37.8 18.6 14.3 9.8 12.1
Columbia, SC (MSA) 32.1 30.0 20.2 20.3 7.0 7.0
Columbus, GA-AL (MSA) 28.1 24.3 22.7 18.9 11.4 6.2Columbus, OH (MSA) 37.4 38.0 16.2 18.4 10.9 10.4
Corpus Christi, TX (MSA) 13.6 13.6 22.3 25.1 2.8 2.2
Cumberland, MD-WV(MSA) 16.7 19.4 10.1 10.8 4.0 3.7
Dallas, TX (PMSA) 30.0 24.4 16.1 13.1 9.8 7.1
Danbury, CT (PMSA) 60.6 54.7 20.9 17.0 18.7 16.5Danville, VA (MSA) 26.8 24.3 23.1 14.7 8.5 4.7
Davenport-Moline-Rock Island, IA-IL (MSA) 39.5 37.8 20.3 20.7 13.7 11.4

Boxall and Silver
206 Cityscape
Exhibit A-1 (continued)
Percentage of GSE Single-Family Loan Purchases Qualifying for the AffordableHousing Goals at the Metropolitan Level, 1996
Low- and Underserved SpecialModerate-Income Areas AffordableHousing Goal (%) Goal (%) Housing Goal (%)
Metropolitan Fannie Freddie Fannie Freddie Fannie FreddieStatistical Area Mae Mac Mae Mac Mae Mac
Dayton-Springfield, OH(MSA) 40.9 40.1 19.2 19.3 12.3 13.1
Daytona Beach, FL(MSA) 41.8 39.6 11.8 11.7 12.7 12.1
Decatur, AL (MSA) 33.3 26.6 10.1 8.9 11.2 4.9Decatur, IL (MSA) 40.7 42.2 22.3 24.1 11.0 16.5
Denver, CO (PMSA) 45.4 46.5 20.4 19.6 15.1 15.8
Des Moines, IA (MSA) 43.9 44.3 16.1 13.2 12.7 12.3
Detroit, MI (PMSA) 41.0 41.2 15.2 14.4 12.0 12.0Dothan, AL (MSA) 22.8 25.8 13.3 19.9 4.6 6.5
Dover, DE (MSA) 35.5 33.8 20.3 17.7 10.0 10.6
Dubuque, IA (MSA) 52.8 44.4 17.5 12.1 15.1 10.6
Duluth-Superior, MN-WI(MSA) 41.4 36.7 14.6 14.6 13.1 9.9
Dutchess County, NY(PMSA) 45.3 36.8 19.5 18.7 11.4 6.4
Eau Claire, WI (MSA) 34.7 33.0 16.9 20.5 10.7 5.9El Paso, TX (MSA) 19.4 13.8 46.2 40.0 5.5 4.2
Elkhart-Goshen, IN (MSA) 47.4 50.8 10.2 7.5 12.8 12.9
Elmira, NY (MSA) 21.8 28.6 17.2 10.2 1.8 7.5
Enid, OK (MSA) 14.9 18.6 20.6 12.6 1.5 4.9
Erie, PA (MSA) 30.3 31.8 13.0 14.5 6.6 3.6
Eugene-Springfield,OR (MSA) 29.9 27.5 25.0 32.1 6.9 7.0
Evansville-Henderson,IN-KY (MSA) 36.3 42.7 15.1 18.5 11.0 20.1
Fargo-Moorhead,ND-MN (MSA) 24.1 27.4 18.4 15.1 7.3 5.3
Fayetteville, NC (MSA) 22.2 24.2 46.3 48.7 4.8 5.1
Fayetteville-Springdale-Rogers, AR (MSA) 27.0 24.7 14.8 15.3 5.2 4.9
Fitchburg-Leominster,MA (PMSA) 40.3 37.5 10.1 8.1 8.0 6.3
Flagstaff, AZ-UT (MSA) 26.9 24.4 24.3 17.9 8.2 5.0Flint, MI (PMSA) 38.2 33.4 10.1 7.8 10.7 8.6
Florence, AL (MSA) 23.7 25.9 13.6 15.8 3.8 5.1
Florence, SC (MSA) 29.0 24.5 31.6 20.8 8.2 4.3
Fort Collins-Loveland,CO (MSA) 42.8 40.7 26.9 25.4 12.8 11.5
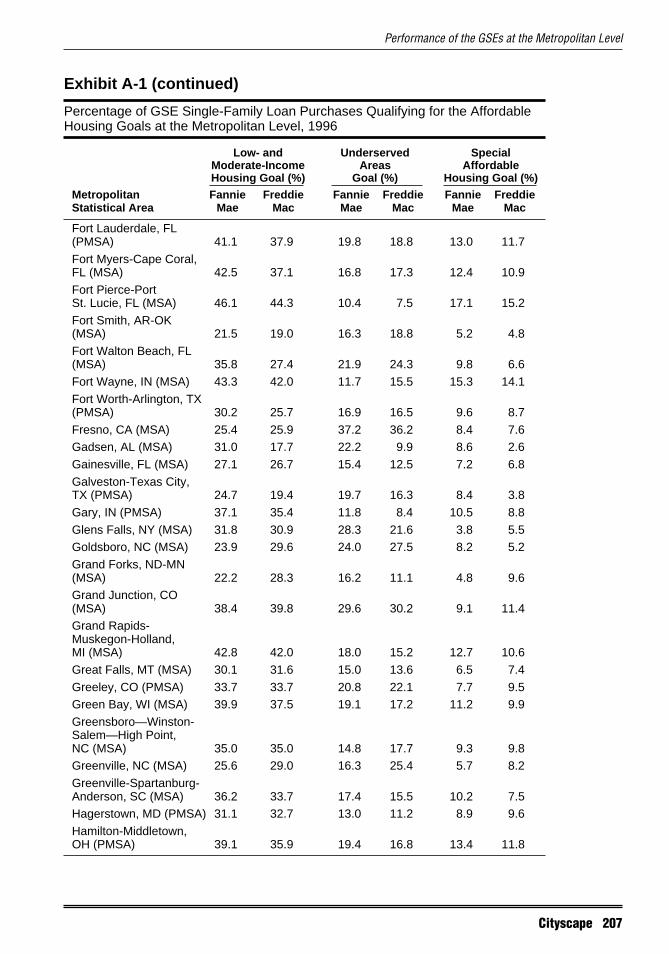
Performance of the GSEs at the Metropolitan Level
Cityscape 207
Exhibit A-1 (continued)
Percentage of GSE Single-Family Loan Purchases Qualifying for the AffordableHousing Goals at the Metropolitan Level, 1996
Low- and Underserved SpecialModerate-Income Areas AffordableHousing Goal (%) Goal (%) Housing Goal (%)
Metropolitan Fannie Freddie Fannie Freddie Fannie FreddieStatistical Area Mae Mac Mae Mac Mae Mac
Fort Lauderdale, FL(PMSA) 41.1 37.9 19.8 18.8 13.0 11.7
Fort Myers-Cape Coral,FL (MSA) 42.5 37.1 16.8 17.3 12.4 10.9
Fort Pierce-PortSt. Lucie, FL (MSA) 46.1 44.3 10.4 7.5 17.1 15.2
Fort Smith, AR-OK(MSA) 21.5 19.0 16.3 18.8 5.2 4.8
Fort Walton Beach, FL(MSA) 35.8 27.4 21.9 24.3 9.8 6.6
Fort Wayne, IN (MSA) 43.3 42.0 11.7 15.5 15.3 14.1
Fort Worth-Arlington, TX(PMSA) 30.2 25.7 16.9 16.5 9.6 8.7
Fresno, CA (MSA) 25.4 25.9 37.2 36.2 8.4 7.6Gadsen, AL (MSA) 31.0 17.7 22.2 9.9 8.6 2.6
Gainesville, FL (MSA) 27.1 26.7 15.4 12.5 7.2 6.8
Galveston-Texas City,TX (PMSA) 24.7 19.4 19.7 16.3 8.4 3.8
Gary, IN (PMSA) 37.1 35.4 11.8 8.4 10.5 8.8
Glens Falls, NY (MSA) 31.8 30.9 28.3 21.6 3.8 5.5Goldsboro, NC (MSA) 23.9 29.6 24.0 27.5 8.2 5.2
Grand Forks, ND-MN(MSA) 22.2 28.3 16.2 11.1 4.8 9.6Grand Junction, CO(MSA) 38.4 39.8 29.6 30.2 9.1 11.4Grand Rapids-Muskegon-Holland,MI (MSA) 42.8 42.0 18.0 15.2 12.7 10.6
Great Falls, MT (MSA) 30.1 31.6 15.0 13.6 6.5 7.4
Greeley, CO (PMSA) 33.7 33.7 20.8 22.1 7.7 9.5Green Bay, WI (MSA) 39.9 37.5 19.1 17.2 11.2 9.9
Greensboro—Winston-Salem—High Point,NC (MSA) 35.0 35.0 14.8 17.7 9.3 9.8Greenville, NC (MSA) 25.6 29.0 16.3 25.4 5.7 8.2
Greenville-Spartanburg-Anderson, SC (MSA) 36.2 33.7 17.4 15.5 10.2 7.5Hagerstown, MD (PMSA) 31.1 32.7 13.0 11.2 8.9 9.6
Hamilton-Middletown,OH (PMSA) 39.1 35.9 19.4 16.8 13.4 11.8

Boxall and Silver
208 Cityscape
Exhibit A-1 (continued)
Percentage of GSE Single-Family Loan Purchases Qualifying for the AffordableHousing Goals at the Metropolitan Level, 1996
Low- and Underserved SpecialModerate-Income Areas AffordableHousing Goal (%) Goal (%) Housing Goal (%)
Metropolitan Fannie Freddie Fannie Freddie Fannie FreddieStatistical Area Mae Mac Mae Mac Mae Mac
Harrisburg-Lebanon-Carlisle, PA (MSA) 37.4 38.6 17.6 19.4 9.9 9.3
Hartford, CT (MSA) 41.3 40.4 11.5 12.9 10.5 10.0Hattiesburg, MS (MSA) 16.4 14.8 12.8 19.9 3.5 0.8
Hickory-Morganton,NC (MSA) 44.3 37.1 15.8 10.1 14.7 9.8
Honolulu, HI (MSA) 57.7 54.0 68.7 63.8 14.9 15.5
Houma, LA (MSA) 18.3 15.2 26.5 23.0 5.4 1.5
Houston, TX (PMSA) 35.4 26.1 29.0 23.2 12.7 7.1Huntington-Ashland,WV-KY-OH (MSA) 20.7 20.6 18.5 18.0 7.5 4.4Huntsville, AL (MSA) 37.2 34.8 28.3 32.5 11.2 12.1
Indianapolis, IN (MSA) 39.4 37.1 17.5 14.3 12.0 10.4
Iowa City, IA (MSA) 45.2 40.9 23.1 19.1 10.4 6.3
Jackson, MI (MSA) 35.8 35.7 11.3 9.5 9.9 10.1Jackson, MS (MSA) 20.1 15.6 20.8 23.7 4.1 3.1
Jackson, TN (MSA) 15.1 18.8 14.3 11.5 1.5 2.7
Jacksonville, FL (MSA) 39.1 34.3 14.2 14.5 11.6 9.0
Jacksonville, NC (MSA) 17.5 22.4 21.8 19.4 2.9 3.2Jamestown, NY (MSA) 28.1 31.5 9.0 9.8 10.3 9.0
Janesville-Beloit, WI(MSA) 41.8 37.2 23.2 23.1 8.6 7.4
Jersey City, NJ (PMSA) 17.2 22.4 57.3 59.4 2.6 5.0
Johnson City-Kingsport-Bristol, TN-VA (MSA) 28.6 23.6 17.3 20.8 8.4 6.4
Johnstown, PA (MSA) 13.0 28.7 11.7 7.7 2.7 6.9
Joplin, MO (MSA) 41.8 32.0 13.8 16.0 13.1 9.9
Kalamazoo-Battle Creek,MI (MSA) 35.4 34.3 22.1 20.7 10.3 9.1
Kankakee, IL (PMSA) 37.1 31.3 8.6 7.1 9.9 9.4Kansas City, MO-KS(MSA) 39.7 37.9 14.6 14.1 12.9 10.9Kenosha, WI (PMSA) 34.4 31.5 12.7 11.3 7.0 6.1
Killeen-Temple, TX (MSA) 13.9 17.7 17.1 21.4 3.1 3.6
Knoxville, TN (MSA) 27.6 26.2 17.3 16.8 7.4 6.3
Kokomo, IN (MSA) 39.2 42.2 20.3 21.0 12.0 15.9La Crosse, WI-MN (MSA) 37.1 29.9 13.7 10.9 8.1 6.5
Lafayette, IN (MSA) 37.0 37.6 4.8 5.8 10.8 13.9
Lafayette, LA (MSA) 24.2 21.0 13.7 9.5 5.2 4.3
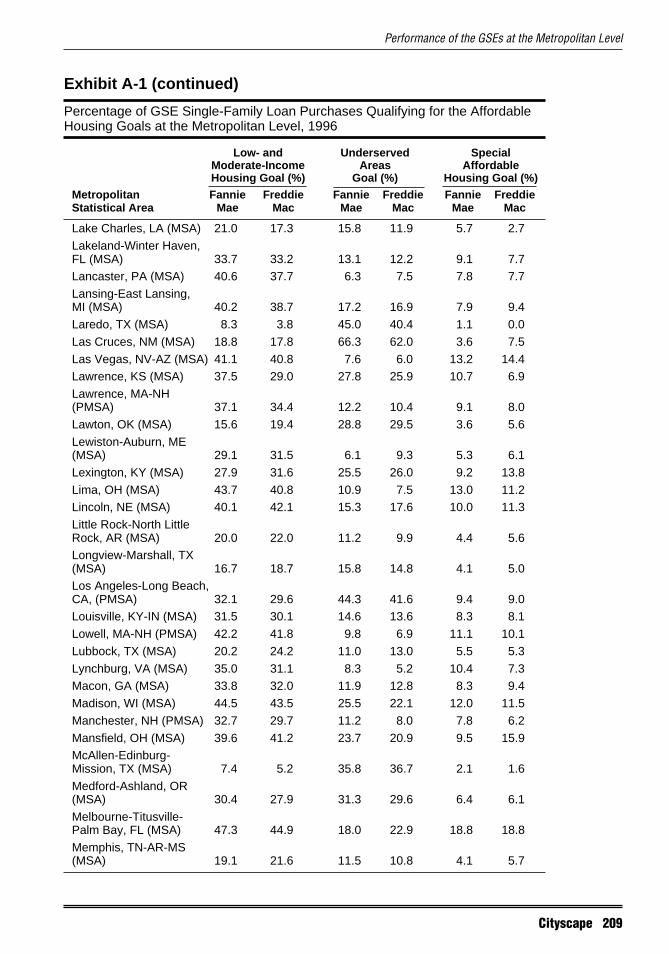
Performance of the GSEs at the Metropolitan Level
Cityscape 209
Exhibit A-1 (continued)
Percentage of GSE Single-Family Loan Purchases Qualifying for the AffordableHousing Goals at the Metropolitan Level, 1996
Low- and Underserved SpecialModerate-Income Areas AffordableHousing Goal (%) Goal (%) Housing Goal (%)
Metropolitan Fannie Freddie Fannie Freddie Fannie FreddieStatistical Area Mae Mac Mae Mac Mae Mac
Lake Charles, LA (MSA) 21.0 17.3 15.8 11.9 5.7 2.7
Lakeland-Winter Haven,FL (MSA) 33.7 33.2 13.1 12.2 9.1 7.7Lancaster, PA (MSA) 40.6 37.7 6.3 7.5 7.8 7.7
Lansing-East Lansing,MI (MSA) 40.2 38.7 17.2 16.9 7.9 9.4
Laredo, TX (MSA) 8.3 3.8 45.0 40.4 1.1 0.0
Las Cruces, NM (MSA) 18.8 17.8 66.3 62.0 3.6 7.5
Las Vegas, NV-AZ (MSA) 41.1 40.8 7.6 6.0 13.2 14.4Lawrence, KS (MSA) 37.5 29.0 27.8 25.9 10.7 6.9
Lawrence, MA-NH(PMSA) 37.1 34.4 12.2 10.4 9.1 8.0
Lawton, OK (MSA) 15.6 19.4 28.8 29.5 3.6 5.6
Lewiston-Auburn, ME(MSA) 29.1 31.5 6.1 9.3 5.3 6.1
Lexington, KY (MSA) 27.9 31.6 25.5 26.0 9.2 13.8
Lima, OH (MSA) 43.7 40.8 10.9 7.5 13.0 11.2Lincoln, NE (MSA) 40.1 42.1 15.3 17.6 10.0 11.3
Little Rock-North LittleRock, AR (MSA) 20.0 22.0 11.2 9.9 4.4 5.6Longview-Marshall, TX(MSA) 16.7 18.7 15.8 14.8 4.1 5.0Los Angeles-Long Beach,CA, (PMSA) 32.1 29.6 44.3 41.6 9.4 9.0Louisville, KY-IN (MSA) 31.5 30.1 14.6 13.6 8.3 8.1
Lowell, MA-NH (PMSA) 42.2 41.8 9.8 6.9 11.1 10.1
Lubbock, TX (MSA) 20.2 24.2 11.0 13.0 5.5 5.3
Lynchburg, VA (MSA) 35.0 31.1 8.3 5.2 10.4 7.3Macon, GA (MSA) 33.8 32.0 11.9 12.8 8.3 9.4
Madison, WI (MSA) 44.5 43.5 25.5 22.1 12.0 11.5
Manchester, NH (PMSA) 32.7 29.7 11.2 8.0 7.8 6.2
Mansfield, OH (MSA) 39.6 41.2 23.7 20.9 9.5 15.9McAllen-Edinburg-Mission, TX (MSA) 7.4 5.2 35.8 36.7 2.1 1.6
Medford-Ashland, OR(MSA) 30.4 27.9 31.3 29.6 6.4 6.1
Melbourne-Titusville-Palm Bay, FL (MSA) 47.3 44.9 18.0 22.9 18.8 18.8
Memphis, TN-AR-MS(MSA) 19.1 21.6 11.5 10.8 4.1 5.7
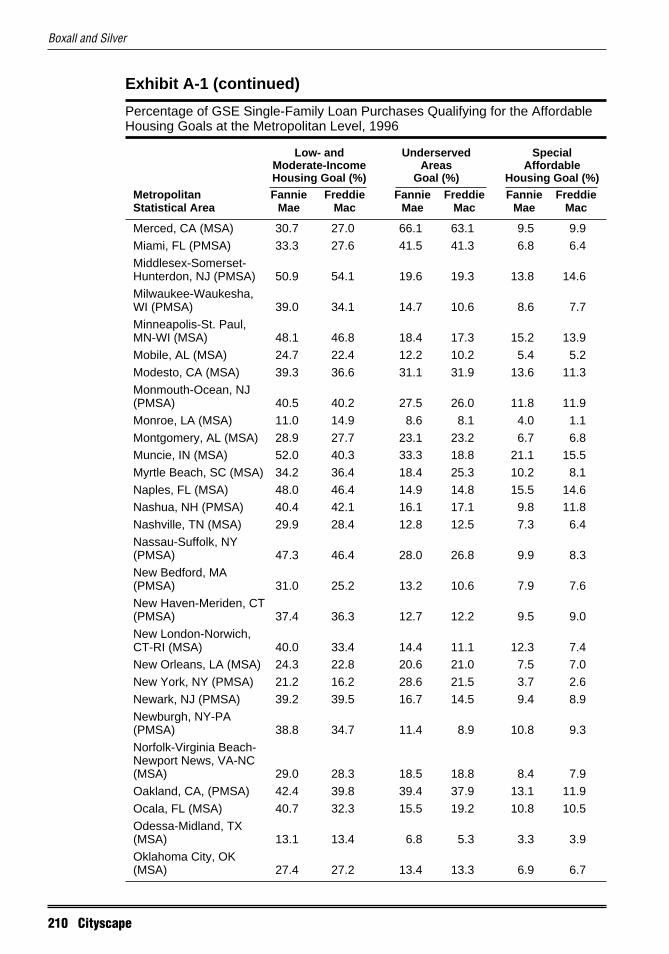
Boxall and Silver
210 Cityscape
Exhibit A-1 (continued)
Percentage of GSE Single-Family Loan Purchases Qualifying for the AffordableHousing Goals at the Metropolitan Level, 1996
Low- and Underserved SpecialModerate-Income Areas AffordableHousing Goal (%) Goal (%) Housing Goal (%)
Metropolitan Fannie Freddie Fannie Freddie Fannie FreddieStatistical Area Mae Mac Mae Mac Mae Mac
Merced, CA (MSA) 30.7 27.0 66.1 63.1 9.5 9.9
Miami, FL (PMSA) 33.3 27.6 41.5 41.3 6.8 6.4
Middlesex-Somerset-Hunterdon, NJ (PMSA) 50.9 54.1 19.6 19.3 13.8 14.6
Milwaukee-Waukesha,WI (PMSA) 39.0 34.1 14.7 10.6 8.6 7.7
Minneapolis-St. Paul,MN-WI (MSA) 48.1 46.8 18.4 17.3 15.2 13.9
Mobile, AL (MSA) 24.7 22.4 12.2 10.2 5.4 5.2
Modesto, CA (MSA) 39.3 36.6 31.1 31.9 13.6 11.3
Monmouth-Ocean, NJ(PMSA) 40.5 40.2 27.5 26.0 11.8 11.9
Monroe, LA (MSA) 11.0 14.9 8.6 8.1 4.0 1.1
Montgomery, AL (MSA) 28.9 27.7 23.1 23.2 6.7 6.8Muncie, IN (MSA) 52.0 40.3 33.3 18.8 21.1 15.5
Myrtle Beach, SC (MSA) 34.2 36.4 18.4 25.3 10.2 8.1
Naples, FL (MSA) 48.0 46.4 14.9 14.8 15.5 14.6Nashua, NH (PMSA) 40.4 42.1 16.1 17.1 9.8 11.8
Nashville, TN (MSA) 29.9 28.4 12.8 12.5 7.3 6.4
Nassau-Suffolk, NY(PMSA) 47.3 46.4 28.0 26.8 9.9 8.3
New Bedford, MA(PMSA) 31.0 25.2 13.2 10.6 7.9 7.6
New Haven-Meriden, CT(PMSA) 37.4 36.3 12.7 12.2 9.5 9.0
New London-Norwich,CT-RI (MSA) 40.0 33.4 14.4 11.1 12.3 7.4New Orleans, LA (MSA) 24.3 22.8 20.6 21.0 7.5 7.0
New York, NY (PMSA) 21.2 16.2 28.6 21.5 3.7 2.6
Newark, NJ (PMSA) 39.2 39.5 16.7 14.5 9.4 8.9
Newburgh, NY-PA(PMSA) 38.8 34.7 11.4 8.9 10.8 9.3
Norfolk-Virginia Beach-Newport News, VA-NC(MSA) 29.0 28.3 18.5 18.8 8.4 7.9
Oakland, CA, (PMSA) 42.4 39.8 39.4 37.9 13.1 11.9
Ocala, FL (MSA) 40.7 32.3 15.5 19.2 10.8 10.5
Odessa-Midland, TX(MSA) 13.1 13.4 6.8 5.3 3.3 3.9
Oklahoma City, OK(MSA) 27.4 27.2 13.4 13.3 6.9 6.7
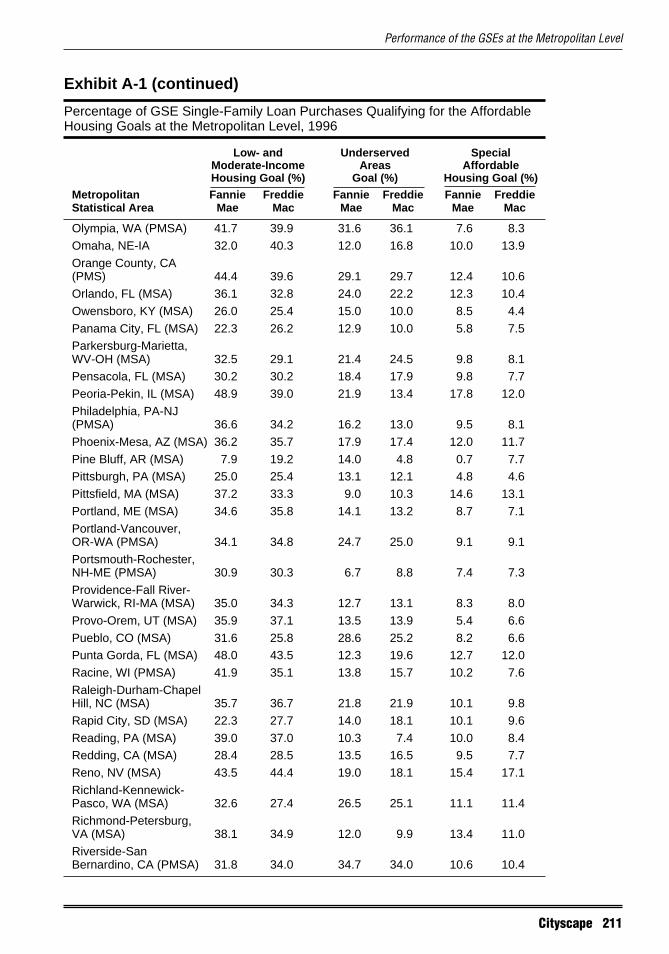
Performance of the GSEs at the Metropolitan Level
Cityscape 211
Exhibit A-1 (continued)
Percentage of GSE Single-Family Loan Purchases Qualifying for the AffordableHousing Goals at the Metropolitan Level, 1996
Low- and Underserved SpecialModerate-Income Areas AffordableHousing Goal (%) Goal (%) Housing Goal (%)
Metropolitan Fannie Freddie Fannie Freddie Fannie FreddieStatistical Area Mae Mac Mae Mac Mae Mac
Olympia, WA (PMSA) 41.7 39.9 31.6 36.1 7.6 8.3
Omaha, NE-IA 32.0 40.3 12.0 16.8 10.0 13.9
Orange County, CA(PMS) 44.4 39.6 29.1 29.7 12.4 10.6
Orlando, FL (MSA) 36.1 32.8 24.0 22.2 12.3 10.4
Owensboro, KY (MSA) 26.0 25.4 15.0 10.0 8.5 4.4
Panama City, FL (MSA) 22.3 26.2 12.9 10.0 5.8 7.5Parkersburg-Marietta,WV-OH (MSA) 32.5 29.1 21.4 24.5 9.8 8.1Pensacola, FL (MSA) 30.2 30.2 18.4 17.9 9.8 7.7
Peoria-Pekin, IL (MSA) 48.9 39.0 21.9 13.4 17.8 12.0
Philadelphia, PA-NJ(PMSA) 36.6 34.2 16.2 13.0 9.5 8.1
Phoenix-Mesa, AZ (MSA) 36.2 35.7 17.9 17.4 12.0 11.7
Pine Bluff, AR (MSA) 7.9 19.2 14.0 4.8 0.7 7.7Pittsburgh, PA (MSA) 25.0 25.4 13.1 12.1 4.8 4.6
Pittsfield, MA (MSA) 37.2 33.3 9.0 10.3 14.6 13.1
Portland, ME (MSA) 34.6 35.8 14.1 13.2 8.7 7.1
Portland-Vancouver,OR-WA (PMSA) 34.1 34.8 24.7 25.0 9.1 9.1
Portsmouth-Rochester,NH-ME (PMSA) 30.9 30.3 6.7 8.8 7.4 7.3
Providence-Fall River-Warwick, RI-MA (MSA) 35.0 34.3 12.7 13.1 8.3 8.0
Provo-Orem, UT (MSA) 35.9 37.1 13.5 13.9 5.4 6.6
Pueblo, CO (MSA) 31.6 25.8 28.6 25.2 8.2 6.6Punta Gorda, FL (MSA) 48.0 43.5 12.3 19.6 12.7 12.0
Racine, WI (PMSA) 41.9 35.1 13.8 15.7 10.2 7.6
Raleigh-Durham-ChapelHill, NC (MSA) 35.7 36.7 21.8 21.9 10.1 9.8
Rapid City, SD (MSA) 22.3 27.7 14.0 18.1 10.1 9.6
Reading, PA (MSA) 39.0 37.0 10.3 7.4 10.0 8.4Redding, CA (MSA) 28.4 28.5 13.5 16.5 9.5 7.7
Reno, NV (MSA) 43.5 44.4 19.0 18.1 15.4 17.1
Richland-Kennewick-Pasco, WA (MSA) 32.6 27.4 26.5 25.1 11.1 11.4
Richmond-Petersburg,VA (MSA) 38.1 34.9 12.0 9.9 13.4 11.0
Riverside-SanBernardino, CA (PMSA) 31.8 34.0 34.7 34.0 10.6 10.4

Boxall and Silver
212 Cityscape
Exhibit A-1 (continued)
Percentage of GSE Single-Family Loan Purchases Qualifying for the AffordableHousing Goals at the Metropolitan Level, 1996
Low- and Underserved SpecialModerate-Income Areas AffordableHousing Goal (%) Goal (%) Housing Goal (%)
Metropolitan Fannie Freddie Fannie Freddie Fannie FreddieStatistical Area Mae Mac Mae Mac Mae Mac
Roanoke, VA (MSA) 44.0 38.1 16.9 14.0 17.9 14.3
Rochester, MN (MSA) 59.3 52.4 23.7 22.8 23.5 15.9
Rochester, NY (MSA) 35.8 32.5 12.5 11.2 8.8 7.0
Rockford, IL (MSA) 42.3 37.6 14.2 13.6 12.5 12.0Rocky Mount, NC (MSA) 31.7 25.6 39.8 36.8 8.5 7.5
Sacramento, CA (PMSA) 34.7 34.3 23.0 22.2 10.3 10.7
Saginaw-Bay City-Midland, MI (MSA) 46.5 39.2 26.0 19.0 16.6 11.8
St. Cloud, MN (MSA) 42.3 42.0 19.8 16.3 7.4 9.2
St. Joseph, MO (MSA) 30.6 35.2 14.0 11.1 11.3 9.2
St. Louis, MO-IL (MSA) 40.5 38.7 17.0 16.1 13.5 12.9Salem, OR (PMSA) 29.8 29.9 11.7 11.7 5.2 5.0
Salinas, CA (MSA) 31.0 28.1 60.0 54.0 8.4 4.9
Salt Lake City-Ogden,UT (MSA) 44.8 44.6 21.7 21.1 13.0 13.3
San Angelo, TX (MSA) 24.1 22.7 21.9 16.8 3.6 0.8
San Antonio, TX (MSA) 17.2 17.7 17.2 16.5 3.9 4.2San Diego, CA (MSA) 29.1 26.5 25.4 23.8 8.1 6.7
San Francisco, CA(PMSA) 48.3 47.8 50.7 47.5 13.4 14.3
San Jose, CA (PMSA) 52.9 50.7 59.8 57.7 15.0 14.2
San Luis Obispo-Atascadero-Paso Robles,CA (MSA) 31.0 28.8 19.0 22.2 6.0 6.3Santa Barbara-SantaMaria-Lompoc, CA (MSA) 31.0 34.5 24.2 22.4 9.3 10.7Santa Cruz-Watsonville,CA (PMSA) 34.1 37.9 40.0 37.2 7.8 9.4Santa FE, NM (MSA) 42.5 49.2 76.9 75.8 19.6 17.1
Santa Rosa, CA (PMSA) 33.9 35.6 15.4 13.6 6.9 7.2
Sarasota-Bradenton, FL(MSA) 46.7 41.7 14.4 13.3 13.5 11.2
Savannah, GA (MSA) 27.9 29.7 18.2 16.3 8.8 7.4
Scranton—Wilkes-Barre—Hazleton, PA (MSA) 31.1 28.3 16.1 16.6 7.8 5.2
Seattle-Bellevue-Everett,WA (PMSA) 42.4 42.0 26.2 25.7 10.9 12.0
Sharon, PA (MSA) 21.1 26.7 8.7 10.9 3.2 4.7
Sheboygan, WI (MSA) 40.1 35.0 14.3 14.5 7.4 7.2Sherman-Denison, TX(MSA) 20.1 24.8 13.0 16.2 9.1 6.3

Performance of the GSEs at the Metropolitan Level
Cityscape 213
Exhibit A-1 (continued)
Percentage of GSE Single-Family Loan Purchases Qualifying for the AffordableHousing Goals at the Metropolitan Level, 1996
Low- and Underserved SpecialModerate-Income Areas AffordableHousing Goal (%) Goal (%) Housing Goal (%)
Metropolitan Fannie Freddie Fannie Freddie Fannie FreddieStatistical Area Mae Mac Mae Mac Mae Mac
Shreveport-Bossier City,LA (MSA) 16.9 13.7 9.6 6.5 3.5 2.3
Sioux City, IA-NE (MSA) 39.9 39.4 24.1 27.2 14.9 11.4Sioux Falls, SD (MSA) 40.6 34.9 18.0 19.5 12.5 8.1
South Bend, IN (MSA) 43.0 41.3 28.1 16.6 17.8 12.8
Spokane, WA (MSA) 34.5 34.5 23.5 22.3 11.1 11.7
Springfield, IL (MSA) 41.1 40.8 20.8 17.8 14.3 12.3Springfield, MA (MSA) 37.0 31.6 13.9 10.5 9.2 7.3
Springfield, MO (MSA) 41.9 35.8 14.1 12.5 16.0 11.2
Stamford-Norwalk, CT(PMSA) 65.2 62.8 50.0 49.1 28.0 28.2
State College, PA (MSA) 25.9 26.1 34.7 39.4 3.1 3.9
Steubenville-Weirton,OH-WV (MSA) 31.9 29.3 17.1 18.2 7.4 8.8
Stockton-Lodi, CA (MSA) 33.9 33.8 34.5 31.2 13.5 12.1Sumter, SC (MSA) 21.8 21.8 19.5 23.5 2.0 8.0
Syracuse, NY (MSA) 26.3 26.7 11.3 17.1 5.1 5.8
Tacoma, WA (PMSA) 35.1 33.5 19.1 17.5 7.5 8.3
Tallahassee, FL (MSA) 33.9 33.0 26.6 28.3 10.4 10.1Tampa-St. Petersburg-Clearwater, FL (MSA) 40.0 35.2 21.2 19.4 13.6 11.6Terre Haute, IN (MSA) 28.4 32.0 16.7 13.0 13.6 9.0
Texarkana, TX-Texarkana, AR (MSA) 24.4 14.9 20.0 19.8 5.7 4.1Toledo, OH (MSA) 39.1 35.2 15.6 10.4 11.8 9.4
Topeka, KS (MSA) 45.7 38.8 13.2 7.9 17.1 12.5
Trenton, NJ (PMSA) 38.6 41.7 16.4 14.1 11.0 10.3
Tucson, AZ (MSA) 32.7 31.6 19.2 18.0 10.0 9.5Tulsa, OK (MSA) 25.6 25.3 11.6 13.4 6.6 6.7
Tuscaloosa, AL (MSA) 22.6 20.4 19.7 17.2 4.9 2.6
Tyler, TX (MSA) 24.1 23.0 11.1 10.9 2.5 5.1
Utica-Rome, NY (MSA) 30.3 22.3 17.8 12.1 4.1 4.0Vallejo-Fairfield-Napa,CA (PMSA) 34.2 32.3 37.7 37.2 8.6 7.6Ventura, CA (PMSA) 44.0 42.6 32.9 31.6 12.8 12.2
Victoria, TX (MSA) 17.0 14.1 40.3 34.4 7.5 3.8
Vineland-Millville-Bridgeton, NJ (PMSA) 33.3 30.8 24.3 24.0 8.3 4.2
Visalia-Tulare-Porterville,CA (MSA) 29.9 28.3 48.8 49.6 11.9 11.2

Boxall and Silver
214 Cityscape
Exhibit A-1 (continued)
Percentage of GSE Single-Family Loan Purchases Qualifying for the AffordableHousing Goals at the Metropolitan Level, 1996
Low- and Underserved SpecialModerate-Income Areas AffordableHousing Goal (%) Goal (%) Housing Goal (%)
Metropolitan Fannie Freddie Fannie Freddie Fannie FreddieStatistical Area Mae Mac Mae Mac Mae Mac
Waco, TX (MSA) 25.8 14.6 15.6 10.1 8.5 3.1
Washington, DC-MD-VA-WV (PMSA) 55.1 54.1 32.8 33.1 17.9 18.0Waterbury, CT (PMSA) 48.0 41.1 11.0 4.5 11.1 9.9
Waterloo-Cedar Falls,IA (MSA) 43.5 36.7 27.3 17.5 16.3 9.7
Wausau, WI (MSA) 38.3 41.0 13.5 10.4 6.0 12.0
West Palm Beach-BocaRaton, FL (MSA) 44.5 39.4 20.7 17.3 15.0 11.9
Wheeling, WV-OH (MSA) 26.9 17.2 20.7 14.7 5.4 3.4
Wichita, KS (MSA) 41.2 37.1 17.0 12.7 9.8 9.8Wichita Falls, TX (MSA) 20.3 17.1 15.5 8.6 2.7 4.5
Williamsport, PA (MSA) 29.7 23.4 17.4 15.6 3.1 3.6
Wilmington, NC (MSA) 34.6 31.6 17.3 15.4 8.9 7.6
Wilmington-Newark,DE-MD (PMSA) 47.0 47.8 18.8 18.5 14.3 14.6
Worchester, MA-CT(PMSA) 35.7 33.4 8.4 6.1 8.3 5.9
Yakima, WA (MSA) 29.2 24.8 32.4 31.0 10.8 8.4
Yolo, CA (PMSA) 36.0 31.8 37.2 34.7 9.7 9.3York, PA (MSA) 37.9 37.7 10.3 11.0 8.4 8.7
Youngstown-Warren,OH (MSA) 35.3 35.4 13.7 14.1 11.9 10.7
Yuba City, CA (MSA) 26.6 28.1 27.5 24.2 9.7 6.9
Yuma, AZ (MSA) 36.7 23.9 36.4 27.5 19.6 7.8
Notes: Includes conventional, conforming loans on owner-occupied single-family housing.Excludes loans with insufficient data to determine goal qualification.Source: Compiled from HMDA, Loan/Application Register data, 1996.
Appendix BSelection of Case-Study Metropolitan AreasThis study involved an institutional analysis to explain observed differences in the perfor-mance of Fannie Mae and Freddie Mac in a subset of metropolitan areas. This part of theinvestigation was conducted through onsite interviews and focused on the local institu-tional structure and programmatic strategies of the GSEs as well as the institutional rela-tionships among the GSEs, public-sector agencies, lenders, and nonprofit and for-profithousing organizations.

Performance of the GSEs at the Metropolitan Level
Cityscape 215
To examine the impact of the institutional context in which the GSEs operate, we neededto differentiate metropolitan areas in terms of GSE performance. We developed four met-ropolitan categories to do this:
■ PMSAs/MSAs in which both GSEs performed well pursuant to the housing goalscompared to their performance in other metropolitan areas and in which they bothperformed at about the same level.
■ PMSAs/MSAs in which Fannie Mae performed relatively well compared to its per-formance elsewhere, whereas Freddie Mac did not.
■ PMSAs/MSAs in which Freddie Mac performed relatively well compared to its per-formance elsewhere, whereas Fannie Mae did not.
■ PMSAs/MSAs in which neither GSE performed well compared to its performanceelsewhere and in which they both performed at about the same level.
This appendix details the criteria and procedures employed to select metropolitan areasfor the institutional analysis.
Selection CriteriaWe selected four PMSAs/MSAs for the institutional analysis, one from each of the cat-egories described above, using the following criteria:
1. Known characteristics of GSE performance. We used HMDA data on Fannie Maeand Freddie Mac purchases of conventional, conforming loans in 1995 and 1996 tocategorize individual metropolitan areas.
2. Known characteristics of GSE local institutional structure. One of the main fo-cuses of the institutional analysis was to determine the impact of the GSEs’ localinstitutional structure. We therefore considered the location of Fannie Mae partner-ship offices and other known characteristics of the GSEs’ local institutional activitiesin selecting MSAs for this analysis.
3. Location. We selected MSAs to ensure some measure of geographic diversity.In addition, because we used the National Community Reinvestment Coalition’s(NCRC’s) local members to assist in identifying potential interviewees, MSAschosen for field visits included areas in which NCRC had participating members.
4. Resource Constraints. After full consideration of the criteria listed above, MSAswere selected to ensure that the cost of conducting site visits would fit within theproject budget.
The next section details our categorization of metropolitan areas based on GSE perfor-mance in 1995 and 1996. This is followed by a presentation of our rationale for the selec-tion of metropolitan areas from each of four performance categories, pursuant to criteria2, 3, and 4.
Categorization of MSAsWe classified metropolitan areas based on a measure of GSE performance in each PMSAor MSA relative to their performance elsewhere. This process involved five main stepsand produced a list of candidate metropolitan areas in each of the four metropolitan-areacategories.
Boxall and Silver
216 Cityscape
The main steps involved in classifying metropolitan areas were as follows:
■ To ensure that the selection process would not be unduly influenced by GSE activityin metropolitan areas with a relatively small pool of loans available for sale to thesecondary market, first we used HMDA to identify and exclude metropolitan areaswith below-average mortgage market activity. Specifically, we excluded PMSAs/MSAs in which the total number of mortgage originations secured by single-family,owner-occupied properties fell below the median for all metropolitan areas in either1995 or 1996.
■ We then used HMDA to determine each GSE’s performance in the remaining 162metropolitan areas, according to the 1996 housing goals. That is, we calculated theshare of each GSE’s loan acquisitions in a metropolitan area that qualified for thelow- and moderate-income, underserved area, and special affordability housing goals.These scores, stated as a percent of business, were combined into a single compositescore, with equal weight given to each component. This step was conducted sepa-rately for 1995 and 1996.
■ We then used the composite performance scores to divide the 162 metropolitan areasinto quintiles, both for Fannie Mae and Freddie Mac and separately for 1995 and1996. On a scale of 1 to 5, metropolitan areas in which a GSE performed worst fellinto the first quintile and areas in which it performed best fell into the fifth.
■ By combining the quintile scores for the two GSEs, we grouped the metropolitanareas into the four categories indicated above. Category 1 consists of metropolitanareas in which scores for both GSEs fell in the top two quintiles; category 4 in which,those scores for both GSEs fell in the bottom two quintiles; and categories 2 and 3,those in which the GSEs’ quintile scores varied. Metropolitan areas in which bothGSEs performed at an average rate compared with their performance elsewhere(PMSAs/MSAs in the third quintile) were not included in any of the four categories.Again, this step was conducted separately for 1995 and 1996.
■ Finally, we excluded metropolitan areas if they met either of the following criteria:
– PMSAs/MSAs that shifted categories between 1995 and 1996—we wanted to select MSAs demonstrating a consistent pattern of GSE performance over the 2-year period.
– PMSA/MSAs in categories 1 or 4 when one GSE significantly outperformed the other—that is, when the composite performance measure for Fannie Mae either exceeded or fell short of the same measure for Freddie Mac (in either 1995 or 1996) by 10 percent or more.
MSAs Selected for Site VisitsWe made our final choice of representative metropolitan areas from each category byapplying the three other selection criteria, in consultation with HUD’s Government Tech-nical Representative as well as staff from Fannie Mae and Freddie Mac. As indicatedbelow, our final selection of sites for the fieldwork portion of the research was determinedlargely by what we know about the institutional context in different communities:
■ Category 1—Washington, D.C. We selected Washington, D.C., for this category forboth substantive and logistical reasons. Substantively, the D.C. metropolitan area wasof interest because it is the location of one of Fannie Mae’s partnership offices andthe home base for both GSEs. Not surprisingly, both GSEs are engaged in majorinitiatives in the D.C. metropolitan area. For example, Fannie Mae has embarked on

Performance of the GSEs at the Metropolitan Level
Cityscape 217
neighborhood-specific projects, partnering with Howard University in the Ledroitneighborhood and tapping into its America’s Communities Fund to channel equitycapital into the development of homes in Southeast D.C. Freddie Mac has an interest-ing partnership with HomeFree USA, a nonprofit homeownership counseling organi-zation in the District. In addition, the relatively low cost of conducting interviews inthe Washington, D.C., area offset some of the higher costs involved in conducting theother three site visits.
■ Category 2—Houston, Texas. We selected Houston for this category becauseFannie Mae has a partnership office here and has pledged $2 billion in affordablehousing finance for this metropolitan area. Fannie Mae has played an important rolein supporting affordable homeownership efforts by the local public sector. Houstonalso was selected because of local NCRC contacts in the affordable lending commu-nity, and because this metropolitan area would ensure some geographic diversity inthe institutional analysis—the other areas all being east of the Mississippi and in thenorth/mid-Atlantic region.
■ Category 3—Columbus, Ohio. We selected Columbus in part because this was oneof the locations in which Fannie Mae opened a new partnership office in 1997. Thisaction may or may not have resulted from Fannie Mae’s poor performance relative toits own performance in other communities and to Freddie Mac’s performance locally.Freddie Mac’s last two annual reports to HUD do not mention Columbus as a citywhere exciting or innovative activity is occurring. Yet the absence of publicity doesnot mean there is no ongoing program; Freddie Mac provided a number of contactsin the Columbus area.
■ Category 4—Pittsburgh, Pennsylvania. Fannie Mae recently pursued an initiativein the Pittsburgh area to purchase seasoned loans from local bank portfolios, suggest-ing that there has been an underutilization of the secondary market here. One ofNCRC’s members, the Pittsburgh Community Reinvestment Group, helped brokerthis recent initiative, and was a good point of contact for securing interviews.
