performance of wick drains in new orleans...
TRANSCRIPT

TRANSPORTATION RESEARCH RECORD 1159 39
Performance of Wick Drains in New Orleans Clays
SUBAL K. SARKAR AND RAYMOND J. CASTELLI
Prefabricated wick drains and a preloading program were employed In the construction of a wharf facility in the city of New Orleans to accelerate consolidation of a thick layer of soft clayey soils. Preloadlng and wick drains were used for a portion of the wharf platform and for an adjoining 10-acre storage area. A proposed future storage area of approximately 32 acres was preloaded without the use of wick drains. A total of approximately 2 million linear feet of drains were installed for the project. Various Instrumentations were monitored during construction to evaluate the performance of the preload program in areas both with and without wick drains. Consolidation parameters calculated from the field data are presented and compared with values used in the design of the wick drain Installation. After a 12-mo preload period, the clayey soils In the wick drain area had reached an average of 80 percent consolidation in comparison to only about 28 percent consolidation In the nondrain area. The construction preload in the wick drain area successfully preconsolidated the clayey subsoils for the design load condition.
New Orleans, the second busiest port in the United States, has initiated the development of a major new facility on the Mississippi River-Gulf Outlet (MR-GO) within the city of New Orleans (Figure 1). This facility, called the Jourdan Road Terminal, will eventually include a total of ten berths, with related container and roll on/roll off terminals, and cargo handling areas.
The first stage in the development of the Jourdan Road Terminal was the completion, in 1983, of a 1400-ft-long wharf for Berths 4 and 5 (Figure 2). Construction for Berths 4 and 5 also included a 10-acre container storage area (Area A in Figure 2) adjoining the wharf platform, and a 32-acre storage area (Area B in Figure 2) proposed for future development. These two areas are separated by a U.S. Army Corps of Engineers flood protection levee. Area A was required to be in service at the completion of Berths 4 and 5. Development of Area B, however, would not be required until many years afterward
The site of the Jourdan Road Terminal is underlain by approximately 60 ft of soft and highly compressible clays. During construction for Berths 4 and 5, various ground treatment techniques were employed to improve stability and limit postconstruction settlements of these soils. A portion of the wharf area was constructed using vibro-replacement stone columns and reinforced earth construction. In addition, preloading and wick drains were extensively used for a portion of the wharf area and for the 10-acre storage area (Area A)
Parsons, Brinckerhoff, Quade & Douglas, Inc., 1 Penn Plaza, New York, N.Y. 10119.
immediately behind the wharf. The 32-acre storage area (Area B) was preloaded without vertical drains since development of this area was to be delayed.
The wick drains had an average length of 65 ft and were installed at a spacing of 5 ft. A total of approximately 2 million linear feet of wick drains were installed for this project. At the time of construction in 1981 this was the largest installation of wick drains in the United States.
The design and construction of the wharf were described by Castelli et al. (J) and Sarkar et al. (2) and are not addressed in this paper. This paper discusses the preloading program at Areas A and B, and includes a description of subsurface conditions, a summary of assumptions and criteria used for design of the wick drains, details of drain installation, and an analysis of the findings of a construction instrumentation monitoring program.
SUBSURFACE CONDITIONS
Geologic Setting
The project site lies within the Mississippi River Deltaic Plain, which consists of recent deltaic deposits overlying soils of Pleistocene age (3, 4).
The Pleistocene soils are deltaic deposits formed by the ancestral Mississippi during interglacial periods. As the glaciers advanced, the lowered sea level exposed the Pleistocene deposits to subaerial weathering, desiccation, and erosion. Consequently, the Pleistocene deposits are typically composed of stiff clays and dense sands, which provide a favorable bearing layer for foundations.
As the Pleistocene ended and sea levels rose, recent deltaic deposition began. Recent deltaic deposits present at the project site can be classified as marine, fiuvial-marine, and paludal. The marine deposits were formed in a bay-sound environment on the surface of the Pleistocene soils, and generally consist of shelly fine sand containing silt and clay. Marine deposition gradually built up the sea floor until active deltaic advance became possible. This stage included the deposition of prodelta clays at a distance from the mouth of the existing delta. The gradual reduction in river velocity with increasing distance from shore resulted in deposits grading from silty clays near the river mouth to more plastic clays further from shore. Intradelta silts and fine sands were deposited by the distributary channels which built out over the prodelta deposits. Interdistributary deposits of clay with lenses of silt and fine sand then filled the depressions between distributary channels.

40
Scale Scale in Miles
Scale in Kmo..,"""lll'llllij-. ...
FIGURE 1 Project location map.
AREA B
FIGURE 2 Site plan for Berths 4 and S.
The most recent deposits consist of paludal, backswamp deposits. These deposits are composed of fine grained organic soils formed by sediments laid down in shallow areas by river floodwaters. Backswamp soils are generally slightly overconsolidated due to desiccation caused by alternate wetting and drying (3).
Subsoil Conditions
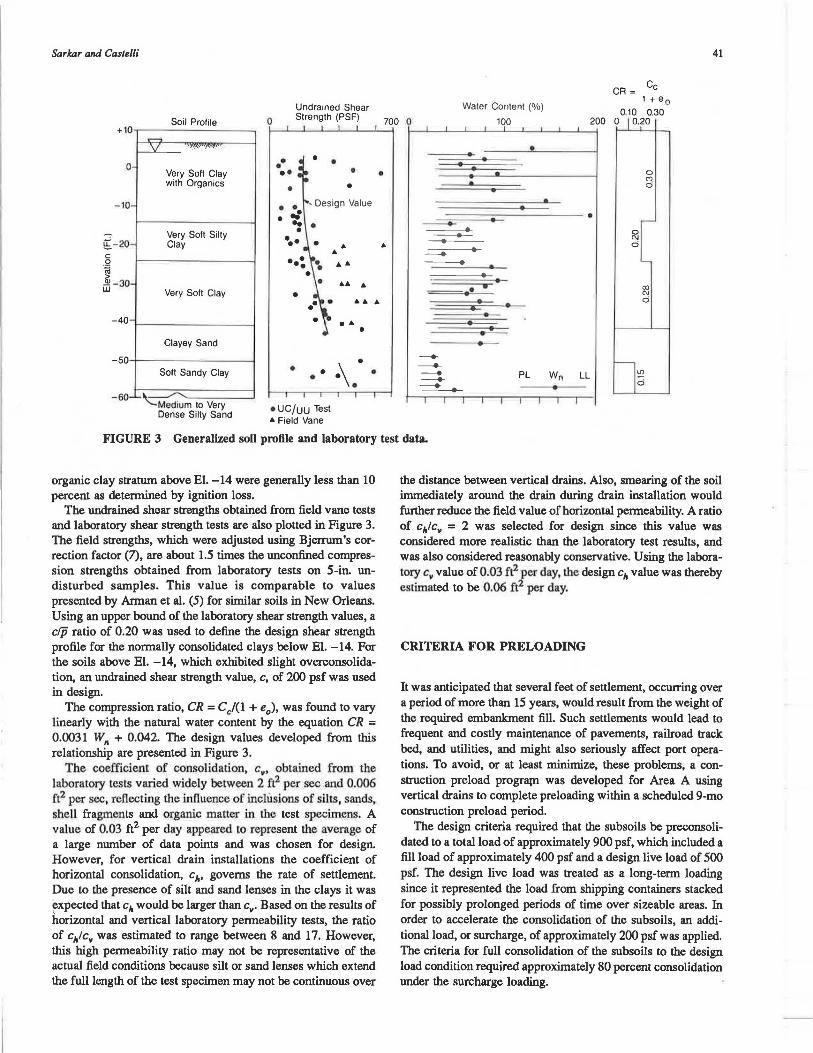
Figure 3 presents a typical soil profile for the project site. As shown in the figure, the subsoils include a surface stratum of very soft organic clays to approximately El. -14 (Mean Sea Level Datum). This is underlain by a very soft clay to silty clay containing numerous silt and sand lenses between approximately El. -14 and -41. Following are strata of loose clayey fine sand to soft sandy clay between El. -41 and -58. Below El. -58 is a stratum of medium dense to very dense silty fine sand
TRANSPORTATION RESEARCH RECORD 1159
Based on visual inspection and the results of laboratory testing, it is believed that these strata correspond to the following geologic deposits: backswamp deposits above El. -14; fluvial-marine deposits between El. -14 and -41; marine baysound deposits between El. -41 and -58, and Pleistocene deposits below El. -58.
FIELD AND LABORATORY INVESTIGATIONS
An extensive subsurface investigation program was undertaken at the Jourdan Road Terminal site in order to determine the depth of the soft clays and to obtain undisturbed samples for laboratory testing. Standard 3-in. diameter undisturbed samples and a small number of 5-in. diameter undisturbed samples were obtained In addition, field vane shear tests were performed in selected locations within the soft clay stratum between El. -20 and -41 using a Nilcon Model 70 vane borer (5).
The laboratory testing program consisted of a large number of standard classification tests, unconfined compression (UC) tests, and unconsolidated undrained (UU) triaxial tests. Also included in the laboratory testing program were one-dimensional consolidation (odometer) tests, and several laboratory permeability tests on specimens cut vertically and horizontally from 5-in. diameter samples for comparing vertical and horizontal permeabilities.
SOIL PROPERTIES
fypical Atterberg Limits and natural water contents of the clayey soils are plotted versus elevation in Figure 3. Based on Atterberg Limit determinations, soft clays at the site are classified as CH and CL accon,ling to the Unified Soil, Classification System (6), and have a pasticity index approximated by the equation Pl = 0.86 (LL = 15). Organic contents for the
Sarkar and Casie/Ii
+10
0
- 10 ,_
~-20 -c Q
~ d] - 30 ,_
-40 -
-50
- 60 --
Soil Profile
-v 'f.~'v·•."-..1.'•
Very Soft Clay with Organics
Very Soft Silty Clay
Very Soft Clay
Clayey Sand
Soft Sandy Clay
...... \::Medium to Very
Dense Silty Sand
41
CR= Cc 1 + e 0
0.10 0.30 o I 0.20
0 C')
0
~
0 N d
~
co N d
l~ d
FIGURE 3 Generalized soil profile and laboratory test data.
organic clay stratwn above El. -14 were generally less than 10 percent as determined by ignition loss.
The undrained shear strengths obtained from field vane tests and laboratory shear strength tests are also plotted in Figure 3. The field strengths, which were adjusted using Bjerrum's correction factor (7), are about 1.5 times the unconfined compression strengths obtained from laboratory tests on 5-in. undisturbed samples. This value is comparable to values presented by Annan et al. (5) for similar soils in New Orleans. Using an upper bound of the laboratory shear strength values, a c/p ratio of 0.20 was used to define the design shear strength profile for the normally consolidated clays below El. -14. For the soils above El. -14, which exhibited slight overconsolidation, an undrained shear strength value, c, of 200 psf was used in design.
The compression ratio, CR= Ccf(l + e0 ), was found to vary linearly with the natural water content by the equation CR = 0.0031 W,. + 0.042. The design values developed from this relationship are presented in Figure 3.
The coefficient of consolidation, c,,, obtained from the laboratory tests varied widely between 2 f12 per sec and 0.006 ft2 per sec, reflecting the influence of inclusions of silts, sands, shell fragments and organic maller in the test specimens. A value of 0.03 ft2 per day appeared to represent the average of a large number of data points and was chosen for desigIL However, for vertical drain installations the coefficient of horizontal consolidation, c11 , governs the rate of settlement. Due to the presence of silt and sand lenses in the clays it was expected that c11 would be larger than c,,. Based on the results of horizontal and vertical laboratory permeability tests, the ratio of c111c,, was estimated to range between 8 and 17. However, this high permeability ratio may not be representative of the actual field conditions because silt or sand lenses which extend the full length of the test specimen may not be continuous over
the distance between vertical drains. Also, smearing of the soil immediately around the drain during drain installation would further reduce the field value of horizontal permeability. A ratio of c111c,, = 2 was selected for design since this value was considered more realistic than the laboratory test results, and was also considered reasonably conservative. Using the laboratory c,, value of 0.03 ft2 per day, the design c11 value was thereby estimated to be 0.06 ft2 per day.
CRITERIA FOR PRELOADING
It was anticipated that several feet of settlement, occurring over a period of more than 15 years, would result from the weight of the required embankment fill. Such settlements would lead to frequent and costly maintenance of pavements, railroad track bed, and utilities, and might also seriously affect port operations. To avoid, or at least minimize, these problems, a construction preload prograp1. was developed for Area A using vertical drains to complete preloading within a scheduled 9-mo construction preload period.
The design criteria required that the subsoils be preconsolidated to a total load of approximately 900 psf, which included a fill load of approximately 400 psf and a design live load of 500 psf. The design live load was treated as a long-term loading since it represented the load from shipping containers stacked for possibly prolonged periods of time over sizeable areas. In order to accelerate the consolidation of the subsoils, an additional load, or surcharge, of approximately 200 psf was applied. The criteria for full consolidation of the subsoils to the design load condition required approximately 80 percent consolidation under the surcharge loading.

42
DESIGN OF VERTICAL DRAINS
In the contract documents, wick drains were added as a construction alternative to the then conventional sand drains because of
• Their ease of installation, • The environmental advantages resulting from the elimina
tion of water jetting, and • The competitiveness of their cost with sand drains.
Two types of wick drains, Alidrain™ and Geodrain™, were selected and incorporated in the design primarily because of their availability in the United States at that time. All drains were required to extend from a sand working mat at the ground surface to the dense sand stratum below El. -58 resulting in drains with a length of approximately 65 ft.
The Alidrain in use at the time of the Jourdan Road project was 3.9 in. wide by 0.28 in. thick and composed of a dual layered inner plastic core, perforated and studded to facilitate seepage through the drain and covered with a geotextile filter fabric. The Geodrain then in use was 3.9 in. wide by 0.16 in. thick, composed of a plastic core with longitudinal grooves on each side, and wrapped with filter paper. It should be noted that both the Alidrain and Geodrain have been modified by their manufacturers since the completion of the Jourdan Road project, and that these modifications may have an influence on drain performance.
The wick drain alternative was designed using procedures described by Moran et al. (8), based on numerical solutions developed by Barron (9) for consolidation by lateral flow to vertical drains. In this analysis the zone of influence of each drain is converted into a cylindrical volume having an equivalent diameter, d •. For any time, t, after load application, a time factor, T11 , can be computed by the following equation:
c,.t T -
" - (d.)2 (1)
where c11 is the coefficient of consolidation for horizontal drainage.
For an equivalent drain diameter, ~. and drain influence zone, d., the average percent consolidation, U, can then be determined by numerical solutions or by using graphical correlations between u and r,. (9).
The equivalent drain diameter for a wick drain can be determined as proposed by Hansbo (10), by the following equation:
d = 2 (drain widJh + drain thickness) w 7C
(2)
Based on this relationship, the equivalent diameter was deter-
Geodrain. Using this diameter, the design required the drains to be installed in a triangular pattern at 5-ft spacing.
PRELOADING WITHOUT DRAINS
Preloading was also designated for Area B to prepare this site for future development. However, in this area the embankment preload would be left in place for many years before develop-
TRANSPORTATION RESEARCH RECORD 1159
ment of the site, providing sufficient time to preconsolidate the subsoils without the use of vertical drains.
At Area B the average preload, including fill and surcharge, was approximately 850 psf. The rate of settlement was determined using the classical Terzaghi one-dimensional consolidation theory, assuming relief of excess pore water pressures by vertical seepage through the clayey soils. A thin humus layer at about El. -6 with the organic clay stratum, and sand strata at about El. -42 and below El. -58 were assumed to provide effective lateral drainage. For these conditions, it was estimated that approximately 16 years would be required for 90 percent consolidation of the subsoils.
CONSTRUCTION
Construction of the Jourdan Road facility commenced in June 1980 with the award of an earthwork contract which included installation of drains and placement of fill and surcharge within Areas A and B. The contractor for the earthwork contract elected to use Alidrains for Area A.
Before installation of the wick drains, however, it was necessary to place a working mat over the soft organic soils for support of equipment loads. The working mat consisted of a reinforcing sheet of Mirafi 500X geotextile fabric beneath a 2-ft-thick layer of fill. Since the working mat also served as a drainage blanket, a clean, coarse-to-medium-size sand was used for this layer.
The installation of the drains followed the placement of the working mat, and was performed from June through September 1980. Placement of the remaining fill and surcharge at Area A foliowed the installation of the drains, and was performed from September 1980 to January 1981. The fill and surcharge was composed of a uniformly graded fine sand, known locally as "river sand." The surcharge was maintained for a period of approximately 12 months before removal and subsequent construction in this area.
Placement of fill and surcharge in Area B commenced in June 1980 and was completed in January 1981. At this area the surcharge was left in place after the completion of all construction for the port facility.
INSTRUMENTATION
Instrumentation installed to monitor performance of the preload program included 4 inductance-type subsurface settlement indicators and 4 sets of pneumatic-type piezometers within Area A, and a total of more than 50 settlement platforms at both Areas A and B.
The subsurface settlement indicators were composed of a 2-in.-diameter rigid plastic pipe within a 3-in. (inside diameter) corrugated polyethylene tubing to which wire inductance rings wci"c iiiiii.clJC:d iii ii.f1p1viUi1111iely 5-fi. iuierv11lis. The isub!lurfo1,;c:; settlement indicators extended to the dense sand stratum below El. -58 where a bottom inductance ring served as a reference for determining settlements of all other rings. Settlements were monitored from within the rigid plastic pipe using a Sondex Settlement Probe, Model Number 50819, from Slope Indicator Company.
Each group of piezometers included three piezometer sensors installed at different elevations within separate boreholes.
Sarkar and Castelli
The piezometers used were Petur Instrument Company Model P-106 Canvaspack piezometers, which were furnished with a sand filter and bentonite pellet seal within a prepackaged fabric mesh.
Settlement platforms consisted of 3-ft x 3-ft by 1/a-in.-thick steel plates with a riser pipe protected by an outer steel casing. The settlement platforms were installed on the existing ground surface before placement of any fill. Subsurface settlement indicators and piezometers in Area A were installed after placement of the 2-ft-thick sand working mat.
DATA EVALUATION
Surface Settlement
Figure 4 presents plots of surface settlement versus time obtained from two typical settlement platform installations, including one settlement platform (SP-12) located in Area A, and a second (SP-34) located in Area B. The approximate locations of these settlement platforms are shown in Figure 2. Included in Figure 4 are plots of predicted settlements developed using the parameters and method of analysis described previously.
4.0·
Area A (SP-12) With Wick Drains
N
FIGURE 4 Surface settlement versus time from settlement platforms.
The height of fill and surcharge at both SP-12 and SP-34 was approximately 9.0 ft, corresponding to an applied load of about 1,080 psf and a total primary settlement estimated to be about 3.7 ft. The equal loading at both settlement platform locations allows a direct comparison of the settlement data obtained from Areas A and B.
As typified by the plots in Figure 4, total settlements measured in the wick drain area were generally less than predicted. After 9 mo ofpreloading, the data from SP-12 indicate a total settlement of 3.00 ft, and an average consolidation of the subsoils of approximately 80 percent. For this same period, the average consolidation determined from a large number of settlement platforms in the wick drain area was approximately 75 percent, somewhat less than the design criteria of 80 percent. To obtain additional consolidation, the preload period was extended from 9 to 12 mo by taking advantage of available slack in the construction schedule. At 12 mo the average consolidation at SP-12 had increased to approximately 85 percent, and for all settlement platforms was approximately 80 percent.
43
Within the same 12-mo preload period the total settlement measured at SP-34 in Area B was 1.18 ft, corresponding to an average consolidation of only 31 percent. The average consolidation from a large number of settlement platforms was 28 percent. Based on these data, an estimated 9 years would be required to achieve 80 percent consolidation in Area B. For 90 percent consolidation, approximately 14 years would be required.
Subsurface Settlement
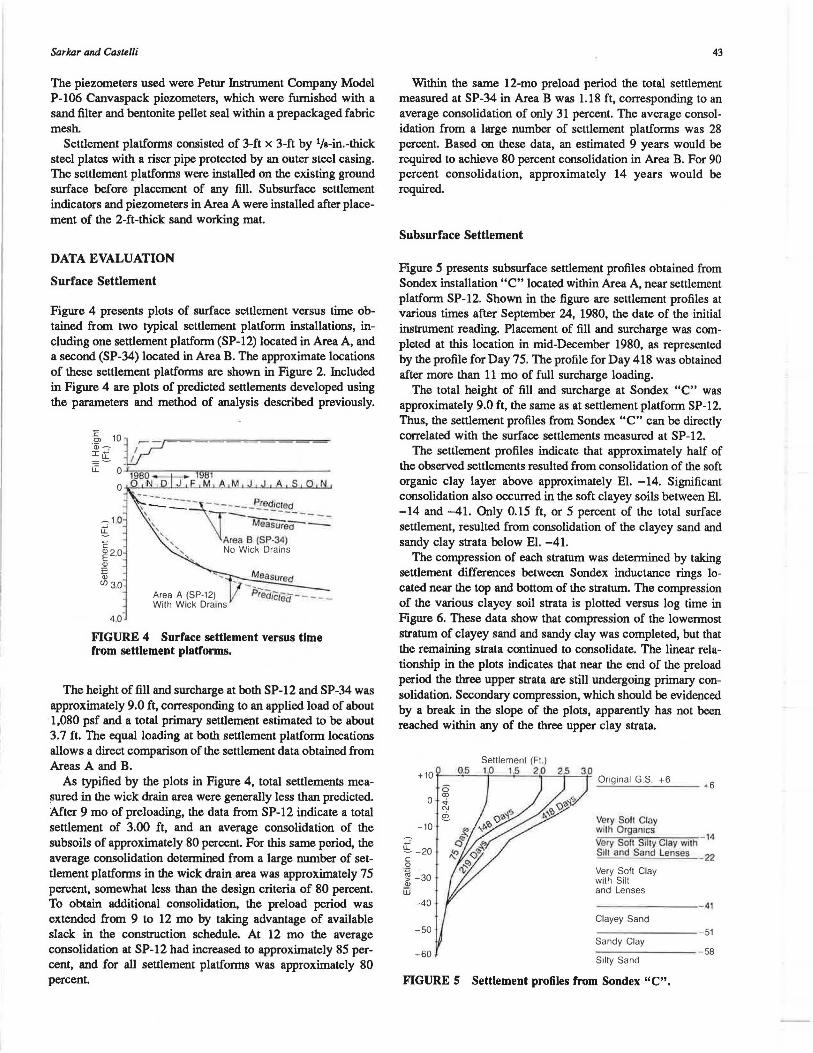
Figure 5 presents subsurface settlement profiles obtained from Sondex installation "C" located within Area A, near settlement platform SP-12. Shown in the figure are settlement profiles at various times after September 24, 1980, the date of the initial instrument reading. Placement of fill and surcharge was completed at this location in mid-December 1980, as represented by the profile for Day 75. The profile for Day 418 was obtained after more than 11 mo of full surcharge loading.
The total height of fill and surcharge at Sondex "C" was approximately 9.0 ft, the same as at settlement platform SP-12. Thus, the settlement profiles from Sondex "C" can be directly correlated with the surface settlements measured at SP-12.
The settlement profiles indicate that approximately half of the observed settlements resulted from consolidation of the soft organic clay layer above approximately El. -14. Significant consolidation also occurred in the soft clayey soils between El. -14 and -41. Only 0.15 ft, or 5 percent of the total surface settlement, resulted from consolidation of the clayey sand and sandy clay strata below El. -41.
The compression of each stratum was determined by taking settlement differences between Sondex inductance rings located near the top and bottom of the stratum. The compression of the various clayey soil strata is plotted versus log time in Figure 6. These data show that compression of the lowermost stratum of clayey sand and sandy clay was completed, but that the remaining strata continued to consolidate. The linear relationship in the plots indicates that near the end of the preload period the three upper strata are still undergoing primary consolidation. Secondary compression, which should be evidenced by a break in the slope of the plots, apparently has not been reached within any of the three upper clay strata.
-10
~ -20 c .Q
~ -30 Q)
[jj
-40 '
-50
-60 ·
Very Sort Clay with Organics Very Soll Silly Clay with -
14
Slit and Sand Lenses _22
Very Soft Clay with Silt and Lenses
----- --- 41 Clayey Sand
51 Sandy Clay
58 Silty Sand
FIGURE 5 Settlement profiles from Sondex "C".

44
0 ~
0
~ c 0 ·u; (/) Q)
c. 0.8 E 0 u Q; >-
"' _J
16·
~ 0 c Q (/) (/)
!." a.
~ 04 u Q; >-
"' _J
0
;f_ c 0 ·u; (/) Q) c. 0.4 E 0 u Q; >-
"' _J
O.B
~ 0 c
~ 0 Q)·->- (/) j ~ 0.2
a. E 0 u
Time Days g N
0 g g 8 .. "'
Very Soft Clay with Organics Ring El. +6 to -41
Very Soft Silly Clay with Silt and Sand Lenses Ring El -14 to -24
• •
Very Solt Clay with Silt and Sand Lenses Ring El. -24 lo -41
Soft Sandy Clay Ring EL -43 to -58
(Note : Day O = Sept. 24, 1980)
FIGURE 6 Layer compression versus log time from Sondex "C."
The layer compression data presented in Figure 6 were compared with calculated values of total layer settlements to estimate the percent consolidation for each of these strata. The results of this analysis are summarized in Table 1. After more than 11 mo of preloading, the clayey soils above El. -41 had reached an average of about 79 percent consolidation. Compression of the lowermost stratum was approximately equal to the calculated settlement, substantiating the conclusion drawn from Figure 6, that this stratum was fully consolidated.
TRANSPORTATION RESEARCH RECORD 1159
Plezometer Data
Piezometer group "C" was located in Area A near SP-12 and Sondex "C" and included three piezometer sensors, installed at El. -12, -23, and-35. Figure 7 presents plots of the pore water pressures measured by the piezometers during the preload period. The pore water pressure changes during and after placement of the fill and surcharge are similar for all three piezometer sensors. All show a relatively rapid initial rate of pore water pressure dissipation followed by a gradually declining rate during the preload period. At the end of almost 12 months of preloading, all showed some excess pore water pressure, indicating that the subsoils were not fully consolidated.
.c 10 "' "Ci)-:-IS ~ O t-mr:rn-~~-.19~8~1~~~~~~~~~~
F MA M JJASO N
50
10 Approximate Hydrostatic Pressure (Typ.)
FIGURE 7 Pore water pressure versus time for piezometer Group "C."
Figure 8 presents plots of excess pore water pressures plotted at the depth of piezometer sensors using the data from Figure 7. Shown are excess pore water pressures determined at 0, 3, 6, and 12 mo after surcharge placement was completed. Initially, the pore water pressure dissipation was significantly faster at the sensor located at El. -22, but after 12 mo all piezometers showed similar values. It is believed that this variability resulted from the position of the piezometer sensor with respect to the surrowiding drains. Although efforts were made to install the piezometers at the centroid of three drains, the location at depth could have shifted due to inclination of the drains or the piezometer drill hole.
After 12 mo of preloading, the three sensors in Piezometer Group "C" indicted an average consolidation of approximately 80 percent within the depths monitored.
TABLE 1 LAYER CONSOLIDATION ESTIMATED FROM SONDEX "C"
Total Measured Inductance Ring Estimated Settlement Average Elevation Settlement 11/17/81 Consolidation
Soil Stratum (ft) (ft) (ft) (%)
Organic clay +6 to -14 2.04 1.56 77 Silty clay with silt and sand lenses -14 to -24 0.59 0.45 76 aay with silt and sand lenses -24 to -43 0.95 0.81 85 aayey sand and sandy clay -43 to -58 0.14 0.15 100 Total 3.72 2.97 79

Sarkar and Castelli
Coefficient of Consolidation
After placement of the fill and surcharge, the relatively uniform rate of surface settlement of approximately 0.04 ft per month measured in SP-34 (Figure 4) closely matched the predicted rate, and provided evidence supporting the cv value and drainage boundary conditions assumed in design of the preload program for Area B.
Excess Porewater Pressure (FL of Water) 0 5 10 15
0 • T Ivery Soft
- 10
~ c .2 -2 1ii iii iii
- 30
I Clay wilh Organics
I
FIGURE 8 Excess pore water pressure versus depth for plezometer Group "C."
For Area A with wick drains, however, the measured rate of settlement after placement of fill and subcharge was less than predicted. The settlement platform, Sondex subsurface settlement indicator, and piezometer data all indicated that about 12 mo of preloading was required to obtain an average 80 percent consolidation of the subsoils, rather than 9 mo as estimated during design. These data suggest that the field c11 value is less than that assumed in the design of the wick drain installation.
The Sondex and piezometer data further showed that consolidation due to lateral flow to the drains occurred at similar rates in the various clayey soil strata above El. -41. Based on this observation it is concluded that the c11 value was approximately the same for all of these strata. This average c11 value can be estimated from the field data using Equation 1, modified as follows:
(3)
where
1.05 (5 ft) = 5.25 ft, 12 mo = 365 days, and
T11 = 0.51 for U = 80 percent and n = 24.
From this equation the field c,, value was computed to be 0.039 ft2 per day, which was somewhat less than the design value of c,, = 0.060 fl
2 per day. Using the computed c,, value, the ratio between c11 and the laboratory cv value is then
45
c,, - 0.039 -CV - 0.030 - 1.3
Also, using the field c11 value computed above, the coefficient of horizontal permeability, k11, can be computed using the following relationship:
where
a, = coefficient of compressibility obtained from laboratory consolidation tests,
yw = unit weight of water, and e = void ratio.
(4)
From Equation 4, k11 was estimated to be 4 x 1 o-8 in./s for the organic clays above El. -14, and 2 x 10--8 in./s for the clays with silt and sand lenses between El. -14 and -41.
Factors influencing lateral flow which may have contributed to the low c11 and k11 values computed for the Jourdan Road facility include
• Smear of soil around the drains, • Discontinuity of silt and sand lenses within the clay strata,
and • Conductivity of the vertical drains and surface drainage
layer.
The effects of these various factors require further study. However, the Jourdan Road results suggest that conservative c11 /cv ratios should be used in design of wick drain installations unless more reliable data for the field c11 value are available. The ratio of c11 to cv developed from laboratory permeability and consolidation tests on clayey soils from the New Orleans site were found to be unreliable for wick drain applications.
SUMMARY AND CONCLUSIONS
The construction of the Jourdan Road Terminal in New Orleans required the preloading of a 10-acre container storage area (Area A) using vertical drains to accelerate consolidation of approximately 60 ft of soft clayey soils. A total of approximately 2 million linear feet of prefabricated wick drains were installed within this area. A proposed future storage area (Area B) of approximately 32 acres was preloaded without the use of vertical drains.
Instrumentation data obtained during construction clearly illustrated the effectiveness of wick drains for accelerating consolidation of the soft subsoils. After a 12-mo preload period, Area A with wick drains had settled approximately 3.0 ft, with an average consolidation of the subsoils of about 80 percent under the surcharge load. In comparison, Area B without wick drains settled approximately 1.2 ft, and had an average consolidation of about 28 percent. In Area B approximately 9 years would be required to achieve 80 percent consolidation.
Consolidation occurred rapidly in the clayey sands and sandy clays below El. -41. However, the rate of consolidation

46
of the soft clayey soils above El. -41 was somewhat less than predicted, requiring an extension of the preload period from 9 to 12 mo.
Data from the Sondex subsurface settlement indicators and piezometers indicated that consolidation occurred at similar rates in the various clayey soil strata above El. -41. The c,. value for these strata, calculated from the field data, was estimated to be 0.039 ft2 per day, and corresponded to a c,.Jc. ratio of 1.3. This c,.lc,. ratio was lower than the value of 2.0 used in design, and considerably lower than the ratio determined from laboratory permeability and consolidation tests.
The coefficient of horizontal permeability, calculated from the field data, was esLirnated to be 4 x 10⁻⁸ in./s for the organic clays above El. - 14, and 2 x 10⁻⁸ in./s for lhe clays with silt and sand lenses between El. -14 and -41.
After 12 mo of preloading, the subsoils were consolidated sufficiently to meet design criteria and to permit removal of the surcharge and continuation of construction. The Jourdan Road Terminal facility has now been in successful operation for more than 5 years.
ACKNOWLEDGMENTS
The Jourdan Road Terminal facility is owned and operated by the Board of Commissioners of the Port of New Orleans. Parsons, Brinckerhoff, Quade & Douglas, Inc. was the design engineer for Berths 4 and 5, and conducted the instrumentation monitoring program. Atlas Construction Company, Inc. was prime contractor for the Earthwork Contract, with Vibroftotation Foundation Company as subcontractor for installation of the wick drains. Eustis Engineering Company of Metairie, Louisiana, performed the borings and laboratory soils testing.
TRANSPORTATION RESEARCH RECORD 1159
REFERENCES
1. R. J. Castelli, S. K. Sarkar, and G. A. Munfakh. Ground Treatment in the Design and Construction of a Wharf Structure. Proc., Symposium on Advances in Piling and Ground Treatmenl for Foundations, Institution of Civil Engineers, London, England, March 1983, pp. 275-281.
2. S. K. Sarkar, G. A. Munfakh, and R. J. Castelli. Building a Port Under Unusual Site Conditions. Proc., Ports 83 Specialty Conference, ASCE, New Orleans, La., March 1983, pp. 269-283.
3. C. R. Kolb and W. G. Shockley. Engineering Geology of the Mississippi Valley. Transaction, ASCE, Vol. 124, 1959, pp. 633~645.
4. R. L. Montgomery. Correlation of Engineering Properties of Cohesive Soils Bordering the Mississippi River from Donaldsonville lo Head of Passes, Louisiana. AD A035019. Anny Engineer Waterways Experiment Station, Vicksburg, Miss., June 1974.
5. A Arman, J. Poplin, and N. Ahmad. A Study of the Vane Shear. Proc., ASCE Specialty Conference on In-Situ Measurement of Soil Properties, Vol. I, June 1975, pp. 93-120.
6. A. Casagrande. Classification and Identification of Soils. Transaction, ASCE, 1948, pp. 901-992.
7. L. Bjerrwn. Embankments on Soft Ground. Proc., ASCE Specialty Conference on Performance of Earth and Earth-Supported Structures, Vol. II, June 1972, pp. 1-54.
8. Moran, Proctor, Muesser, & Rutledge. Study of Deep Soil Stabilization by Vertical Sand Drains. Department of the Navy, Bureau of Yards and Docks, June 1958.
9. R. A. Barron. Consolidation of Fine-Grained Soils by Drain Wells. Transaction, ASCE, Vol. 113, 1948, pp. 71S-754.
10. S. Hansbo. Consolidation of Clays by Band-Shaped Prefabricated Drains. Ground Engineering, Vol. 12, No. 5, 1979, pp. 16-23.
Publication of this paper sponsored by Committee on Transportation Earthworks.