permittivity and measurements 3693public.wsu.edu/~sjwang/dp-rf-mw.pdf · permittivity and...
TRANSCRIPT
PERMITTIVITY AND MEASUREMENTS
V. KOMAROV
S. WANG
J. TANG
Washington State University
1. INTRODUCTION
Propagation of electromagnetic (EM) waves in radiofrequency (RF) and microwave systems is describedmathematically by Maxwell’s equations with corres-ponding boundary conditions. Dielectric properties oflossless and lossy materials influence EM field distri-bution. For a better understanding of the physicalprocesses associated with various RF and microwavedevices, it is necessary to know the dielectric propertiesof media that interact with EM waves. For telecommuni-cation and radar devices, variations of complex dielectricpermittivity (referring to the dielectric property) over awide frequency range are important. For RF and micro-wave applicators intended for thermal treatments of dif-ferent materials at ISM (industrial, scientific, medical)frequencies, one needs to study temperature and moisturecontent dependencies of the permittivity of the treatedmaterials.
Many techniques have been developed for the measure-ment of material permittivity. Some general descriptionsof those methods are provided in the literature [1–4]. Themeasurement results for diverse dielectric media are com-piled in the literature [5–7].
The objective of this article is to provide a brief descrip-tion of basic physical theory for the measurement of per-mittivity associated with three popular experimentalmethods and to review the permittivities for different ma-terials. Most of these data are taken from the literature,but some of permittivity data were measured in BiologicalSystems Engineering Department of Washington StateUniversity. The measurements were conducted by meansof open-ended coaxial probe method with commercialinstrumentation.
2. THEORY OF PERMITTIVITY
Permittivity is a quantity used to describe dielectric prop-erties that influence reflection of electromagnetic waves atinterfaces and the attenuation of wave energy within ma-terials. In frequency domain, the complex relative permit-tivity e� of a material to that of free space can be expressedin the following form:
e� ¼ e0 � je00 ð1Þ
The real part e0 is referred to as the dielectric constantand represents stored energy when the material is ex-posed to an electric field, while the dielectric loss factor e00,which is the imaginary part, influences energy absorptionand attenuation, and j¼
ffiffiffiffiffiffiffi
�1p
. One more important para-meter used in EM theory is a tangent of loss angle:
tan de¼ e00=e0. Mechanisms that contribute to the dielectricloss in heterogeneous mixtures include polar, electronic,atomic, and Maxwell–Wagner responses [7]. At RF andmicrowave frequencies of practical importance and cur-rently used for applications in material processing (RF1–50 MHz and microwave frequencies of 915 and2450 MHz), ionic conduction and dipole rotation are domi-nant loss mechanisms [8]:
e00 ¼ e00dþ e00s¼ e00dþse0o
ð2Þ
where subscripts ‘‘d’’ and ‘‘s’’ stand for contributions due todipole rotation and ionic conduction, respectively; s is theionic conductivity in S/m of a material, o is the angularfrequency in rad/s, and e0 is the permittivity of free spaceor vacuum (8.854� 10–12 F/m). Dielectric lossy materialsconvert electric energy at RF and microwave frequenciesinto heat. The increase in temperature (DT) of a materialcan be calculated from [9]
rCpDT
Dt¼ 5:563� 10�11f E2e00 ð3Þ
where Cp is the specific heat of the material inJ kg� 1
1C�1, r is the density of the material in kg/m3,E is the electric field intensity in V/m, f is the frequency inHz, Dt is the time duration in seconds, and DT is the tem-perature rise in the material in 1C. It is clear from Eq. (3)that the rise in temperature is proportional to the mate-rial’s dielectric loss factor, in addition to electric field in-tensity squared, frequency, and treatment time.
In dielectric materials, the electric field strength de-creases with distance z from the surface and is written as
E¼E0e�az ð4Þ
The attenuation factor a depends on the dielectric prop-erties of the material [5] and is given by
a¼2pl0
1
2e0
ffiffiffiffiffiffiffiffiffiffiffiffiffiffiffiffiffiffiffiffiffiffi
1þe00
e0
� �2s
� 1
0
@
1
A
2
4
3
5
1=2
ð5Þ
where l0 is the free-space wavelength. Substituting Eq. (4)into power equation Eq. (3), one obtains
P¼P0e�2az ð6Þ
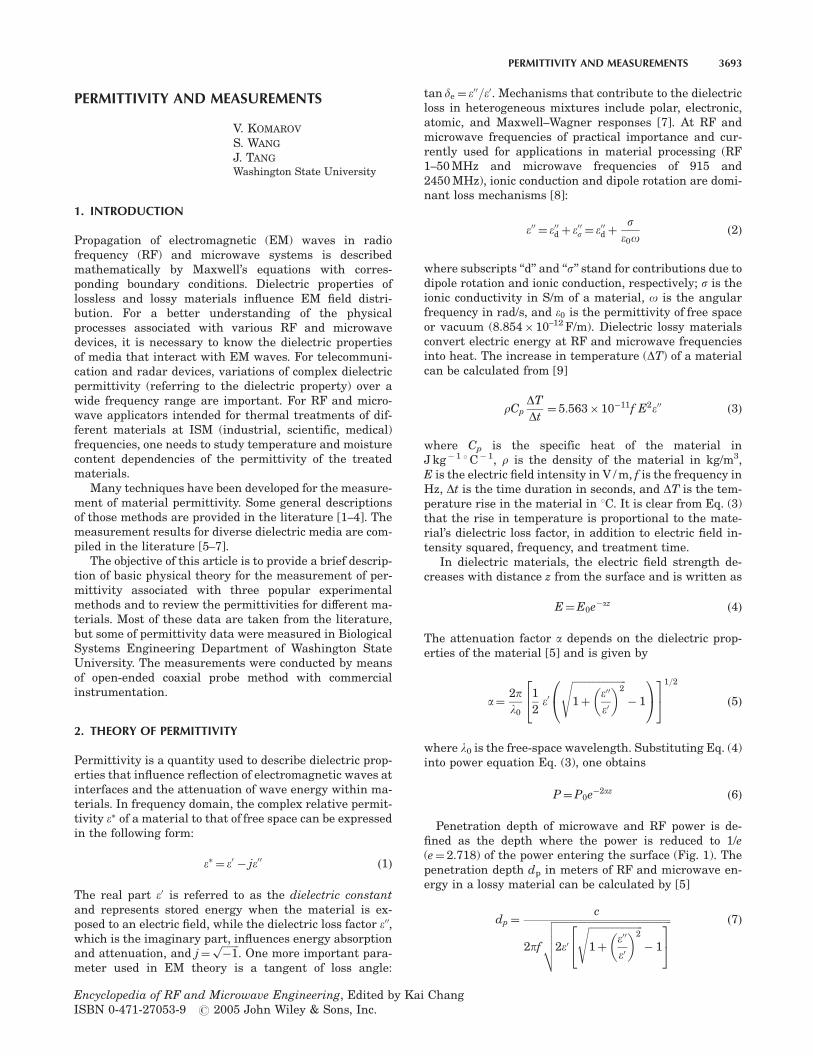
Penetration depth of microwave and RF power is de-fined as the depth where the power is reduced to 1/e(e¼ 2.718) of the power entering the surface (Fig. 1). Thepenetration depth dp in meters of RF and microwave en-ergy in a lossy material can be calculated by [5]
dp¼c
2pf
ffiffiffiffiffiffiffiffiffiffiffiffiffiffiffiffiffiffiffiffiffiffiffiffiffiffiffiffiffiffiffiffiffiffiffiffiffiffiffiffiffiffiffiffiffiffiffi
2e0
ffiffiffiffiffiffiffiffiffiffiffiffiffiffiffiffiffiffiffiffiffiffi
1þe00
e0
� �2s
� 1
2
4
3
5
v
u
u
u
t
ð7Þ
Encyclopedia of RF and Microwave Engineering, Edited by Kai ChangISBN 0-471-27053-9 r 2005 John Wiley & Sons, Inc.
PERMITTIVITY AND MEASUREMENTS 3693
where c is the speed of light in free space (3� 108 m/s).After obtaining the dielectric properties, the penetrationdepths of electromagnetic energy into selected materialscan be calculated at the required frequency. Given fixeddielectric properties, the penetration depth of a material isinversely proportional to frequency. It is, therefore, ex-pected that in general deeper penetration corresponds tolower frequencies, and that higher frequencies result ingreater surface heating. It should be noted that thedielectric properties of lossy materials vary with frequen-cy but penetration depth does not vary exactly as 1/f.Nevertheless, EM waves with short wavelength do notpenetrate deeply into most moist media [7], where the di-electric constants and loss factors are relatively high.
2.1. Frequency Effect
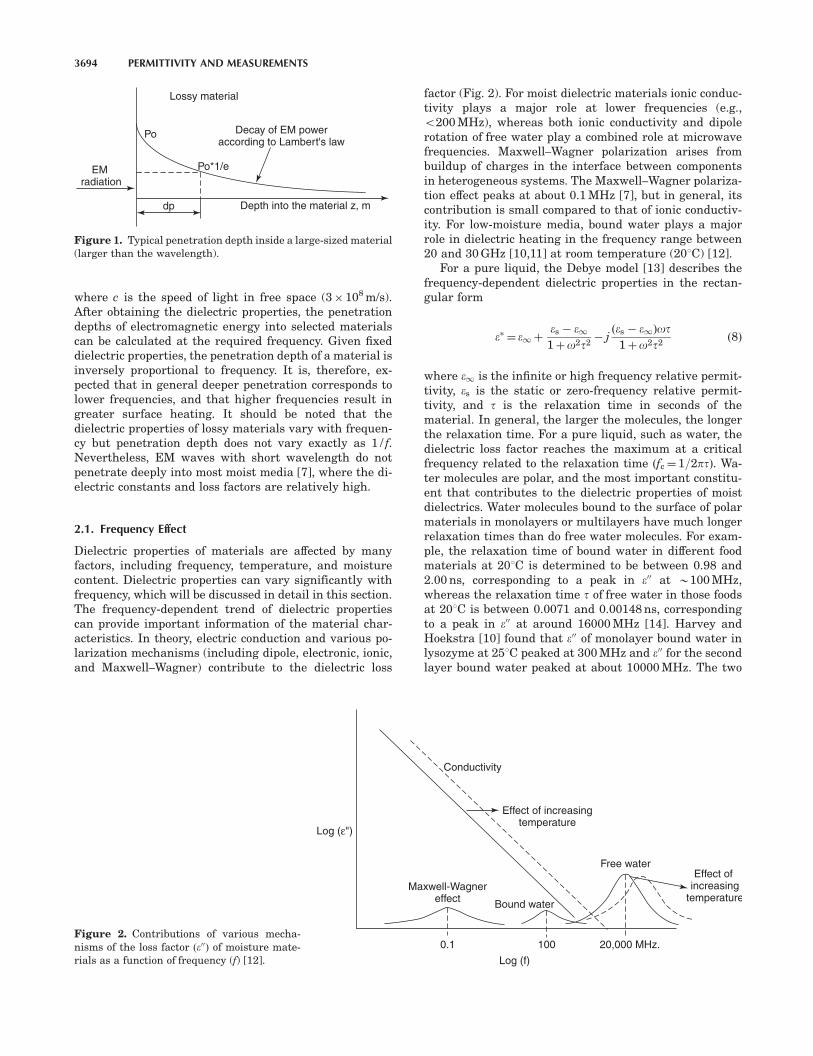
Dielectric properties of materials are affected by manyfactors, including frequency, temperature, and moisturecontent. Dielectric properties can vary significantly withfrequency, which will be discussed in detail in this section.The frequency-dependent trend of dielectric propertiescan provide important information of the material char-acteristics. In theory, electric conduction and various po-larization mechanisms (including dipole, electronic, ionic,and Maxwell–Wagner) contribute to the dielectric loss
factor (Fig. 2). For moist dielectric materials ionic conduc-tivity plays a major role at lower frequencies (e.g.,o200 MHz), whereas both ionic conductivity and dipolerotation of free water play a combined role at microwavefrequencies. Maxwell–Wagner polarization arises frombuildup of charges in the interface between componentsin heterogeneous systems. The Maxwell–Wagner polariza-tion effect peaks at about 0.1 MHz [7], but in general, itscontribution is small compared to that of ionic conductiv-ity. For low-moisture media, bound water plays a majorrole in dielectric heating in the frequency range between20 and 30 GHz [10,11] at room temperature (201C) [12].
For a pure liquid, the Debye model [13] describes thefrequency-dependent dielectric properties in the rectan-gular form
e� ¼ e1þes � e1
1þo2t2� jðes � e1Þot
1þo2t2ð8Þ
where e1 is the infinite or high frequency relative permit-tivity, es is the static or zero-frequency relative permit-tivity, and t is the relaxation time in seconds of thematerial. In general, the larger the molecules, the longerthe relaxation time. For a pure liquid, such as water, thedielectric loss factor reaches the maximum at a criticalfrequency related to the relaxation time ðfc¼ 1=2ptÞ. Wa-ter molecules are polar, and the most important constitu-ent that contributes to the dielectric properties of moistdielectrics. Water molecules bound to the surface of polarmaterials in monolayers or multilayers have much longerrelaxation times than do free water molecules. For exam-ple, the relaxation time of bound water in different foodmaterials at 201C is determined to be between 0.98 and2.00 ns, corresponding to a peak in e00 at B100 MHz,whereas the relaxation time t of free water in those foodsat 201C is between 0.0071 and 0.00148 ns, correspondingto a peak in e00 at around 16000 MHz [14]. Harvey andHoekstra [10] found that e00 of monolayer bound water inlysozyme at 251C peaked at 300 MHz and e00 for the secondlayer bound water peaked at about 10000 MHz. The two
Lossy material
Po
Po*1/e
dp
EM radiation
Decay of EM poweraccording to Lambert's law
Depth into the material z, m
Figure 1. Typical penetration depth inside a large-sized material(larger than the wavelength).
Log (ε")
Effect of increasing
temperature
20,000 MHz.100
Log (f)
0.1
Effect of increasingtemperature
Free water
Bound water
Maxwell-Wagnereffect
Conductivity
Figure 2. Contributions of various mecha-nisms of the loss factor ðe00Þ of moisture mate-rials as a function of frequency (f) [12].
3694 PERMITTIVITY AND MEASUREMENTS

dispersions observed in Fig. 3 correspond to the first andsecond layers of bound water, respectively.
Figure 4 shows a good example of Debye dielectric re-laxation for butyl alcohol at 201C with single relaxationtime measured with an open-ended coaxial probe connect-ed to an impedance analyzer [19]. At low frequencies, in astatic region, where the dipoles have time to follow thevariations of the applied field, the dielectric constant ofbutyl alcohol has a value of B17. The loss factor is smallfor both high and low frequencies and reaches a peak atthe relaxation frequency of B250 MHz.
Similar frequency-dependent permittivity can be foundin water, methanol, and ethanol and can be expressed inthe following relationships, respectively [15]:
e� ¼ 5:62þ74:59
1þ jf=17:0� 109ðwaterÞ
e� ¼ 5:76þ27:89
1þ jf=2:709�109ðmethanolÞ
e� ¼ 4:44þ20:84
1þ jf=0:826�109ðethanolÞ
ð9Þ
Frequency-dependent characteristics of complex biologicalmaterials, including moist foods, cannot be described withsimple mathematical expressions.
2.2. Temperature Effect
Temperature of a material has a significant effect on thedielectric properties. Generally, the loss factor increaseswith increasing temperature at low frequencies due toionic conductance and decreases with increasing temper-ature at high frequencies due to free-water dispersion(Fig. 2). In multidispersion materials, for example, thetransition is gradual because of the combined effects ofrelaxation and the ionic conduction and there is a U-shapefrequency response in e00 (Fig. 6). Debye related the relax-ation time for the spherical molecule to viscosity and tem-perature as the result of randomizing agitation of theBrownian movement [5]
t¼V3nkT
ð10Þ
where n is the viscosity, T is the absolute temperature, V isthe volume, and k is a constant. For nonspherical watermolecules, we may have the following relation
t1nT
ð11Þ
while the viscosity of all fluid decreases with increasingtemperature [16]
v¼ v0eEa=RgT ð12Þ
where Ea is activation energy and Rg is the universal gasconstant. Therefore, as temperature rises, relaxation timefor water decreases. The shifting of the relaxation timetoward a lower value (thus the frequency at the maximume00 shifts toward a higher value as temperature increases)reduces the value of e00 for water at a fixed microwave fre-quency (Fig. 5). For example, as the relaxation time tdecreases with increasing temperature, the dispersionpeak moves to higher frequencies and the loss factor ofpure water at 2450 MHz decreases with increasing tem-perature. The dielectric constant e0 of free water also de-creases with increasing temperature as the result ofincreased Brownian movement.
The dielectric loss factor e00s due to conduction decreaseswith increasing frequency as shown in Eq. (2). Thecontribution of e00s to the overall loss factors is smaller at2450 MHz than at 915 Hz (Fig. 6). The electric conductiv-ity s in ionic solutions increases with temperature due todecreased viscosity and hence increased ion mobility [17].Therefore, based on Eq. (2), e00s also increases with temper-ature (Fig. 6). At 915 MHz the dielectric constant of ionicsolutions generally increases with temperature.
The dielectric properties of high-moisture-content sub-stances change with temperature [19]. An example of thedielectric loss factor ðe00Þ of fifth-instar codling moths mea-sured at five temperatures is shown in Fig. 7. The lossfactor decreases with increasing frequency, reaching
�'
�"
15
10
5
0
5
0107 108 109 10103 3
Frequency (Hz)
3 3
Figure 3. Dielectric constant ðe0Þ and loss factor ðe00Þ as a functionof frequency for packed lysozyme samples containing nearly twolayers of bound water at 251C [10].
Die
lect
ric p
rope
rtie
s
�'�"
10000
20
16
12
8
4
01 10 100
Frequency (MHz)
1000
Figure 4. Dielectric constant ðe0Þ and loss factor ðe00Þ of butyl al-cohol at 201C [19].
PERMITTIVITY AND MEASUREMENTS 3695

about 12 at 1800 MHz. The loss factor of codling moth lar-vae increases with temperature, especially at low frequen-cies. This is due mainly to the increase in ionic conductionat high temperatures [12]. Increasing dielectric loss factorwith temperature often results in a well-known phenom-enon, commonly referred to as ‘‘thermal runaway’’ [7], in
which a preferentially heated subject in an EM field ac-celerates heating as its temperature rises.
Figure 8 shows the loss factor of a typical dry nut (wal-nut kernels) over the frequency range from 1 to 1800 MHzat five temperatures. The e00 values are less than 1 at fre-quencies below 50 MHz. The e00 values peak in the rangebetween 500 and 1000 MHz. The peak value of e00 for wal-nut kernels decreases with increasing temperature, whilethe frequency corresponding to the peak e00 shifts to ahigher value. This temperature-dependent trend is typicalof polar molecules [20]. At any selected frequency in thetested range, the loss factor of the walnut kernel generallydecreases with increasing temperature; that is, for a givenEM field intensity, higher temperature walnuts will ab-sorb less energy than cooler ones, resulting in improvedheating uniformity.
Ice is almost transparent to microwaves (Table 1).When a lossy material is frozen, both dielectric constantand loss factor are significantly reduced; the degree of re-duction depends, to a large extent, on the amount of water
�'
�"
90
0°C
25°
50°
75°
0°C25°
50°75°
80
70
60
50
40
30
20
10
0
50
40
30
20
10
0109 1010 1011
(a)
(b)
1012 1013
109 1010 1011 1012 1013
� (radians/s)
Figure 5. Effect of temperature on dielectric constant ðe0Þ andloss factor ðe00Þ of free water (o¼2pf, where f is frequency in Hz)[22].
�"
40
30
20
10
0108 109
Frequency (Hz)
0°C 20°40°C
0°C20°C
40°C
1010 1011
�"t
(�" )t
�"d
�"d
�"d
�"�
�"��"�= +
Figure 6. Effect of temperature on dielectric loss factor ðe00Þ of0.5 N aqueous sodium chloride at three temperatures [18].
Loss
fact
or
500
400
300
200
100
01 10 100
Frequency (MHz)
Effect of increasingtemperature
20°C30°C40°C50°C60°C
1000Figure 7. Dielectric loss factor of codlingmoth larvae (slurry) at five temperatures [19].
3696 PERMITTIVITY AND MEASUREMENTS

in the unfrozen state and the ionic conductivity of the freewater.
2.3. Moisture Effect
Moisture content is one of the major components of mostbiological materials. In general, the higher the moisturecontent, the larger the dielectric constant and loss factorof the materials [20, 22, 23]. Water in moist dielectric ma-terials can be divided, in descending mobility, into (1) wa-ter held in intercellular space or capillaries, (2) multilayerwater, and (3) monolayer water that is tightly bound to thepolar sites. The free-water molecules have dielectric prop-erties similar to those of liquid water, while the boundwater exhibits icelike dielectric properties. Dielectricproperties of biomaterials, in general, decrease rapidlywith decreasing moisture content to a critical moisturelevel. Below this moisture level, the reduction in loss fac-tor is less significant because of the bound water (Fig. 9).During microwave drying, the wetter parts of biomaterialsabsorb more microwave energy and tend to level off theuneven moisture distribution.
3. MEASUREMENT PRINCIPLES AND METHODS
3.1. Open-Ended Coaxial Probe Method
Open-ended coaxial probe (OCP) method is currently oneof the most popular techniques for measuring of complex
dielectric permittivity of many materials. Nondestructive,broadband (RF and microwave ranges), and high-temper-ature (r12001C) measurements can be preformed withthis method using commercially available instrumenta-tion. Its well-developed theory makes it possible to obtainsufficiently accurate results for both medium-loss andhigh-loss media [24–26].
Figure 10 illustrates an OCP system used at Washing-ton State University. It consists of an automatic networkanalyzer (ANA) with a calibration kit, custom-built test
Loss
fact
or (
ε")
5
4
20°C30°C40°C50°C60°C
3
2
1
01 10 100
Frequency (MHz)
1000
Effect ofincreasing
temperature
Figure 8. Dielectric loss factor of walnut ker-nels as a function of frequency at five temper-atures [19].
Table 1. Dielectric Properties of Water and Ice at2450 MHz
Relative Dielectric Loss Factor Loss TangentState of Water Constant ðe0Þ ðe00Þ ðtan dÞ
Water (251C) 78 12.5 0.16Ice 3.2 0.0029 0.0009
Source: Ref. 21.
Loss
fact
or
Mc Mean moisture content, M
Rat
e of
eva
pora
tion
Figure 9. Rate of evaporation and dielectric loss factor as affect-ed by food moisture content [7].
PERMITTIVITY AND MEASUREMENTS 3697

cell, a programmable circulator, a coaxial cable, and a per-sonal computer connected to the ANA through a specialbus. The material under study is placed in a stainless steelpressureproof test cell. The probe is kept in close contactwith the sample during the measurements via a stainlesssteel spring and piston. A thin rigid stainless steel ther-mocouple probe passes onto the center of the sample tomeasure sample temperature. The programmable circula-tor pumps a temperature-controlled liquid (90% ethyleneglycol and 10% water by volume) through the water jacketof the test cell, allowing the sample inside to be heated andcooled.
The sensing element of an OCP system is an open-end-ed cylindrical coaxial line that is excited by transverseelectromagnetic (TEM) wave. Parameters (amplitude andphase) of incident and reflected signals are detected by theANA. The complex dielectric permittivity is determinedaccording to the reflected coefficient ðG¼G0 � jG00Þ as fol-lows [27]
e0 ¼ ðAef Þ�1 �2G00
ð1þG0Þ2þG002
� �
;
e00 ¼ ðAef Þ�1 1� G02 � G002
ð1þG0Þ2þG002
� �
ð13Þ
where Ae is the empirical coefficient dependent on char-acteristic impedance of the probe and sample size. In orderto eliminate the influence of reflections caused by trans-mission-line discontinuities, a calibration procedure is uti-lized. The EM characteristics of the measurement systemare analyzed using three standard terminations (open,short, and 50O). Then any material with well-known di-electric properties such as deionized water, for example, istested. The actual reflection coefficient differs from reflec-tion coefficient measured using ANA (Gm) [25]
G¼Gm � a11
a22ðGm � a11Þþa12ð14Þ
where a11 is the directivity error, a12 is the frequency re-sponse error, a22 is the source match error. Taking intoaccount propagation constant (g) and distance from theconnector to the probe head (z) we can calculate aij in
terms of S parameters of the connector:
a11¼S11;a12¼S12 S21e�2gz;a22¼S22e�2gz ð15Þ
In the inverse coaxial probe model, it is assumed that asample has a semiinfinite size. A few additional conditionsmust be satisfied to avoid measurement error in the OCPmethod:
* Minimize thermal expansion of both conductors ofcoaxial line at high temperatures.
* Intimate contact between the probe and the sample;liquid sample may flush the probe and the surfaceroughness of solid sample should be less than 0.5 mm[28].
* Minimize disturbance caused by temperature, vibra-tion, or any other external factors after calibrationand during measurement.
The OCP method is very well suited for liquids or soft solidsamples. It is accurate, fast, and broadband (from 0.2 to upto 20 GHz). The measurement requires little sample prep-aration. A major disadvantage of this method is that it isnot suitable for measuring materials with low dielectricproperty (plastics, oils, etc.).
3.2. Transmission-Line Method
The transmission-line method (TLM) belongs to a largegroup of nonresonant methods of measuring complex di-electric permittivity of different materials in a microwaverange [7,51]. Several modifications to this method exist,including the free-space technique [29], the open-circuit network method (see previous section), and theshort-circuited network method. Usually three main typesof transmission lines are used as the measurement cell inTLM: rectangular waveguide, coaxial line, and microstripline.
Consider the distribution of the TEM wave in a short-circuited coaxial line partially filled with a lossy materialunder study (Fig. 11). Analyzed sample is placed near theshort-circuited end of the transmission line. The dielectricproperties of the sample are determined using the follow-
Coaxial cable
Thermometer
Sample
Probe
Jacket
Impedance analyzer Temperature sensor Spring Water bath
Figure 10. Schematic diagram of experimen-tal setup realizing open-ended coaxial probemethod [19].
3698 PERMITTIVITY AND MEASUREMENTS

ing expressions
e0 ¼l
2pd
� �2
ðx2 � y2Þþllqc
� �2
;
e00 ¼l
2pd
� �2
2xy
ð16Þ
where l is the free-space wavelength, lqc is the quasicutoffwavelength, d is the sample thickness (Fig. 11), x¼ReðZinÞ
and y¼ ImðZinÞ, and Zin is the input impedance of theshort-circuited line
Zin¼K2
t þ tg2ð2p=lalÞ
Kt½1þ tg2ð2p=lalÞþ jð1� K2t Þtgð2p=lalÞ�
ð17Þ
where l is the distance between the dielectric surface andthe first minimum of the standing wave, la is the wave-length in unloaded part of transmission line, and Kt is thetraveling-wave coefficient that is calculated when KtZ0.4as
Kt¼
ffiffiffiffiffiffiffiffiffiffiffi
Emin
Emax
s
ð18Þ
and when Kto0.4 as
Kt¼sinð2pDx=laÞ
ffiffiffiffiffiffiffiffiffiffiffiffiffiffiffiffiffiffiffiffiffiffiffiffiffiffiffiffiffiffiffiffiffiffiffiffiffiffiffiffiffiffiffiffiffiffiffiffiffiffiffiffiffiffiffiffiffiffiffiffi
ððE=EminÞ � 1Þ sinð2pDx=laÞp ð19Þ
where Emin and Emax are the minimum and maximumvalues of electric field amplitude (see Fig. 11) and 2Dx isthe distance between two points along transmission lineon both sides of minimum where measured data are equaland determined from E¼m2Emin (2omo10 is the empir-ical coefficient found from the calibration procedure).
Dielectric permittivity of lossy media may be also suc-cessfully measured employing a two ports coaxial cell witha sample placed in the middle of transmission line, so that
the TEM wave could propagate from the input port to theoutput port. Impedance changes and propagation charac-teristics (S parameters) of the TEM wave measured bymeans of ANA in empty and partially loaded transmissionline lead to determination of the dielectric properties oflossy material. Basic principles of this technique are givenin Ref. 30.
In general, a TLM measurement system is more ex-pensive for the same range of frequency than the open-ended coaxial probe system, and the measurements aremore difficult and time-consuming. The method describedabove gives a good accuracy for high-loss materials. But ithas rigid requirements on sample shape and sizes. In par-ticular, the sample shape needs to precisely fit the crosssection of the transmission line. In some cases, in order toincrease accuracy, it is necessary to measure several sam-ples of various thicknesses. Despite these drawbacks,TLM is still widely used in microwave measuring engi-neering because of its simplicity. Using coaxial line as abasic unit of measurement cell makes this method suffi-ciently broadband. The accuracy of this method is gener-ally between that of the OCP method and that of theresonance cavity method.
3.3. Resonant Cavity Method
Resonant cavity methods are also widely utilized in mea-suring complex dielectric permittivity of lossy materials.The most popular resonant cavity method is the pertur-bation method (PM), which is based on a comparativeanalysis of certain EM characteristics between empty anda partially loaded rectangular or cylindrical resonancecavity [31]. A schematic diagram of an experimental set-up of PM is shown in Fig. 12.
According to PM theory [32,33], dielectric permittivityand losses of a sample under study are determined as fol-lows:
e0 ¼ 1þA�1 Vc
Vs
Df
f0; e00 ¼B�1 Vc
Vs
1
Q1�
1
Q0
� �
ð20Þ
where f0 and Q0 are the resonance frequency and Q factorof the empty cavity, f1 and Q1 are the resonance frequency
Shortcircuitend
Lossy sampled
E
l ∆l �g
�g
Coaxial line
Emax
z
Emin Figure 11. Electric field pattern of TEM wavein empty (solid lines) and partially loaded(lines with circles) short coaxial waveguide.Equations (16)–(19) explain all parametersused in this figure.
PERMITTIVITY AND MEASUREMENTS 3699

and Q factor of the cavity with a sample, Vc is the cavityvolume, Vs is the sample volume; and Df¼f0� f1 A and Bare the coefficients that depend on several parameters:shape, sizes, and location of the sample in the cavity, andconfiguration and excited operating mode of the cavity.In some cases, A and B may be found analytically for alossy sheet material placed in a rectangular cavity withoperating mode TE103 [31], or they may be determinedempirically with calibration of the experimental setup.Equation (20) is valid when three main assumptions aresatisfied [32]:(1) the dielectric sample does not disturb thegeneral distribution of the EM field in the cavity, (2) me-tallic wall losses do not influence the resulting losses inthe cavity, and (3) Q0 and Q1 are measured at the samefrequency. Appropriate location of the sample is also avery important factor that affects the accuracy of the mea-surement. Preliminary numerical modeling of the micro-wave setup with lossy dielectric material inside the cavitymay be a useful approach for determining an optimumsample position in this case [31]. Sometimes, measure-ment errors are possible when there are airgaps betweenthe specimen and the conducting parts of the metallic res-onator.
There are also some restrictions in using conventionalresonance PM for measuring the dielectric loss tangent oflow-loss media. If conduction losses in cavity walls arehigher than (or comparable to) the dielectric losses of thespecimen, the resonator Q factor may change and one willnot obtain the correct values of e00. In this case, applicationof hybrid high-order modes called whispering-gallerymodes [34] or a special calibration procedure of Q factor
characterization as a function of frequency [32] can help toeliminate the drawbacks of this method.
PM is more accurate than the waveguiding methods. Itis particularly suited for medium-loss and low-loss mate-rials and substances. Precisely shaped small-sized sam-ples are usually used with this technique. But PM pro-vides dielectric properties measurements only at a fixedfrequency. Commercial systems from Hewlett-Packard aremore expensive than the open-end coaxial probe system.
4. PERMITTIVITY OF ORGANIC AND INORGANICMATERIALS
4.1. Foodstuff and Agricultural Products
Numerous data are reported in the literature on the di-electric properties of biomaterials, especially food materi-als. This section only summarizes the dielectric propertiesfor some typical materials commonly used in food process-ing. Table 2 lists electrical property data for different saltsolutions, fruits, and codling moth larvae at 27 MHz RFand 915 MHz microwave. Air and deionized water do notabsorb much electromagnetic energy at these two frequen-cies due to near-zero dielectric loss factors. Dielectric andconductivity properties increase with increasing salt con-tent. However, dielectric constant decreases both with fre-quency and salt content at 915 MHz.
Dielectric properties of dry food solids, fats, and oils arevery low and are relatively independent of frequency andtemperature. The dielectric properties of selected oils andlow-moisture-content food solids are listed in Table 3.
(a)
(b)
MG
RF connector
Sample
Support
Computer software
Q
fc
fc �r*
Q
f
1 2
3 4 5
Figure 12. (a) Microwave system for mea-suring dielectric properties of lossy materials:microwave generator (1), attenuator (2),wavemeter (3), cavity resonator (4), and sam-ple (5); (b) closeup view of a sample, cavity,and related principles for the measurement.
3700 PERMITTIVITY AND MEASUREMENTS

Figure 13 shows the effect of temperature on the di-electric loss factor of selected foods at 3000 MHz [37]. Thehigh salt content in the ham makes the dielectric proper-ties of this product quite different from those of the re-maining materials in the graph. Due to ionic polarization,the dielectric loss factors increase with temperature abovethe freezing point, which is contrary to the trend of di-electric properties of other foods in which loss mechanismsare determined mostly by the dipole polarization of freewater. One advantage of the decreased loss factor withincreasing temperature is the so-called temperature lev-eling effect. When a certain portion of a food is overheated,the loss factor of that part is reduced, which results in lessconversion of microwave energy to heat at that part of thefood and helps reduce nonuniform spatial temperaturedistribution.
When thawing frozen foods at relatively high microwavepower levels, one often experiences the thermal runawayphenomenon, in which certain areas of the food are over-heated while the other areas are still frozen. This is be-cause faster thawing of a portion of food due to unevenheating dramatically increases the loss factor of that part ofthe food due to the high loss factor of free water (Fig. 13),which in turn increases microwave absorption, causingmore uneven heating. In practice, a low microwave powerlevel is often used in microwave thawing so that heat con-duction can reduce nonuniform temperature distribution.In industrial tempering (a process that brings deep-frozenproducts from � 301 or � 101C to a few degrees below
freezing point for further processing) of large blocks of meator fish, convective surface cooling at below freezing tem-perature is often used to reduce thermal runaway.
Figure 14 shows the dielectric properties of Red Deli-cious apples as a function of frequency at three selectedmoisture contents and two measured temperatures. At ahigh moisture content (70% wet basis), e0 decreases withincreasing frequency, while e00 decreases to a minimumvalue and then increases with frequency (Figs. 14a and14d). The gradual reduction in e0 of high-moisture-contentsamples with increasing frequency is likely caused by thedispersion of water molecules. In a single dispersion sys-tem (e.g., pure water), this transition takes place in a nar-row frequency range and follows the Debye equation[Eq. (8)]. In multidispersion food systems, the transitionis gradual because of the combined effects of relaxationand ionic conduction. A minimum e00 is observed at1000 MHz (Fig. 14a) at 221C. The frequency correspond-ing to the minimum e’’ shifts to about 2000 MHz at 601C(Fig. 14d). This shift can be related to the temperatureresponse of both the free-water dispersion and the ionicconduction.
Figure 15 shows the dielectric constant e0 and loss fac-tor e00of apples at 915 and 2450 MHz as a function of mois-ture content (MC). In general, e0 and e00 decreases withdecreasing moisture content. In a drying process, as thedrying progresses, water dipole becomes less mobile, re-sulting in reduced loss factor. Reduced moisture contentduring drying also reduces ionic conductivity, as a small
Table 2. Electrical Conductivity (r) and Dielectric Properties at 27 and 915 MHz of Lossy Materials at Room-TemperatureConditions
s�100At 27 MHz RF At 915 MHz
Materials (S/m) e0 e00 e0 e00
Air B0 1.0 B0 1.0 B0Water
Distilled/deionised 0.5–1.1�10� 2 80.1 0.03 78.4 3.6Fresh (tapwater, Pullman, WA, USA) 3.25 79.6 18.9 78.8 4.5þ0.05% salt (common salt, Nail) 13.3 80.3 75.1 78.9 6.4þ0.10% 23.1 80.6 126.6 79.0 8.2þ0.15% 32.0 81.5 178.5 78.7 9.9þ0.20% 40.5 82.1 226.3 78.6 11.5þ0.25% 49.8 83.6 276.0 78.6 13.3þ0.50% 92.5 88.0 524.3 78.1 21.8þ1.0% 173 99.2 985.8 77.3 37.2þ2.0% 333 126.1 1866 75.7 67.1
Sea 400 — — — —Apples:
McIntosh/Winesap 1.05–1.33 — — — —Fuji 0.86–1.3 — — — —Red Delicious (juice) 18.5 79.5 138.9 74.7 9.9Apples (flesh) — 64.3 80.8 56.9 8.9Immature apple (juice) 43.0 87.5 248.9 77.2 13.5
Cherries:Bing, Rainier (flesh) — 87.6 185.4 69.7 14.3Sweetheart (juice) 42.0 — — — —
Vegetables pieces 6–10 — — — —Fruit pieces 5–15 — — — —Insect: codling moth (5th instars) 31.0 125.2 458.3 59.9 22.4
Source: Ref. 35.
PERMITTIVITY AND MEASUREMENTS 3701

amount of free water is available as the solvent. In addi-tion, air voids in apple samples as a result of dehydrationcontribute to the low values of both e0 and e00.
Salty products (e.g., macaroni and cheese) have, onthe other hand, much larger loss factors than do freshfruits (Table 4). In addition, the loss factor of freshfruits and macaroni and cheese increases sharply withincreasing temperature, especially at low frequency (e.g.,27 MHz).
There has been increasing interest in using RF andmicrowave energy as a new thermal treatment method for
postharvest insect control in agricultural commodities[36–40]. Knowledge of dielectric properties of insects andcommodities is necessary in guiding development, im-provement, and scaleup of RF and microwave treatmentprotocols. Table 5 summarizes the mean values of thedielectric constant and the loss factor of apples, almond,cherry, grapefruit, orange, and walnut as a functionof temperature at 27 and 915 MHz. The dielectric con-stant and the loss factor of fresh fruits at 27 MHz are sig-nificantly higher than those at 915 MHz. The loss factor offresh fruits increases with increasing temperature at27 MHz and remains nearly constant at 915 MHz, similarto the pattern shown in Fig. 7. However, the temperatureeffect on dielectric properties of almond and walnut isdifferent from that on fresh fruits as shown in Fig. 8. Thepeak value of the loss factor decreases and correspon-ding frequency shifts to larger values with increasingtemperature.
Mean values of the dielectric constant and the loss fac-tor of selected insect larvae as a function of temperaturesat 27, 40, 915, and 1800 MHz are listed in Table 6. Boththe dielectric constant and the loss factor for insects in-creased with increasing temperature at 27 MHz, but re-mained almost constant at 915 MHz. This is due mainly tothe increase in ionic conduction at high temperatures [12].The loss factor of insects at 27 MHz decreased in order atall temperatures: Mexican fruitfly, navel orangeworm,codling moth, and Indian meal moth.
Compared to codling moth larvae, the loss factor valuesof walnuts are much smaller because of high oil contentand less moisture in walnut kernels. It is clear from Figs. 7and 8 that the difference in the value of the e00 betweencodling moth larvae and walnut kernels is much larger atlower frequencies than at microwave frequencies, suggest-ing a better potential for preferential heating of insectsin walnuts when using lower-frequency treatments. Atheoretical model and experimental evidence have beenprovided [18] to support the hypothesis that insect larvaecan be preferentially heated in dry nuts by 27 MHz RFheating for pest control. This differential heating makespossible in the development of practical RF pest controltreatments that the walnut industry can use to replacechemical fumigation.
4.2. Biological Tissues
High-frequency EM energy is widely used in medicaltreatments, including physiotherapeutic, diagnostics, rap-id rewarming of cryopreserved tissues, pharmacology, re-flex therapeutic, blood sterilization, and hyperthermaltreatment of cancer [42–45].
The main mechanism for the interaction between EMwaves and biological tissues is the same as in foodstuffs:oscillation of polar water molecules (H2O) and ions. Partof water in biological tissues is linked with albumen(0.3–0.4 g of water on 1 g of albumen), and at relaxationfrequencies specific electrical conductivity (s) of ‘‘linked’’water sometimes is higher than s of pure water.
Biological tissues (biotissues) are divided into two maingroups: materials with high and low water contents; mus-cles (73–78%), liver (75–77%), kidneys (76–78%), brain
35
30
25
20
15
10
5
−20 0 20
Temperature (°C)
Cooked ham
Cooked ham
Mashedpotato
Cookedcarrot
Raw beef
Cooked beef
Distilledwater
40 60
�"
×
+
+
+
+ +
×
×
×
×
××
Figure 13. Dielectric loss factor ðe00Þ of selected foods at3000 MHz as affected by temperature [37].
Table 3. Dielectric Constant ðe0Þ and Loss Factor ðe00Þ of Oiland Selected Food Solids
Frequency (Hz)
Products T (1C) 106 107 108 109
25 e0 2.85 2.62e00 0.159 0.168
Soybean salad oil 49 e0 2.88 2.71e00 0.138 0.174
82 e0 2.86 2.72e00 0.092 0.140
25 e0 2.83 2.64Cotton oil e00 0.174 0.175
49 e0 2.87 2.70e00 0.134 0.174
0 e0 2.8 2.8Flour e00 0.184 0.184(Mc¼3.2%) 40 e0 3.5 2.7
e00 0.196 0.23570 e0 4.0 3.2
e00 0.160 0.2750 e0 2.1 1.9
e00 0.038 0.040Skimmed milk 40 e0 2.1 1.8powder e00 0.044 0.054
70 e0 2.4 2.0e00 0.067 0.072
Source: Ref. 36.
3702 PERMITTIVITY AND MEASUREMENTS

(68–73%), skin (60–76%), lung (80–83%), eye (r89%) com-pile the first group. Fat (5–10%) and bone (8–16%) tissuesmay be included in the second group. Moisture content inblood is higher than in other tissues (r83%).
Complex dielectric permittivity of some biological ma-terials at room temperature and 2450 MHz taken fromRefs. 46 and 47 is represented in Table 7. Bloodflow sel-dom influences their dielectric properties, excluding tis-
0
10
20
30
40
50
60
0
2
4
6
8
10
12
14
2450 MHz 2450 MHz
Moisture content %
0 10 20 30 40 50 60 70 80 90
Die
lect
ric c
onst
ant �
'
0
10
20
30
40
50
60
915 MHz
Moisture content %
0 10 20 30 40 50 60 70 80 90
Loss
fact
or �
"
0
2
4
6
8
10
12
14
60°C22°C
915 MHz
(a) (b)
(c) (d)
�'
�'
� "
�"
Figure 15. Dielectric properties of Red Delicious apples at 915 and 2450 MHz as influenced bymoisture content on a wet basis [20].
Perm
ittivity
0
5
10
15
20
25
MC = 22%
� '
� "
0
10
20
30
40� '
� "
MC = 69%
Frequency (Hz)
10x106 100x106 1x10⁹
0123456
� "
� '
60°C
60°C
60°C
MC = 4%
Per
mitt
ivity
0
5
10
15
20
25
MC = 24%
� '
� "
0
10
20
30
40� '
� "
MC = 70%
Frequency (Hz)
10x106 100x106 1x10⁹
0123456
� "
� '
MC = 4%
(a)
(b)
(c)
(d)
(e)
(f)
22°C
22°C
22°C
Figure 14. Dielectric properties of Red Delicious apples at three moisture contents and two tem-peratures [20].
PERMITTIVITY AND MEASUREMENTS 3703

sues with high blood volume (kidneys) or low moisturecontent (fat). Experimental results [48] have shown thatmeasured data of e0 and e00 of biotissues in vivo (directly inorganism) and in vitro (in the test tube) almost coincide atfrequencies higher 100 MHz.
A new technology of microwave diagnostics based onmeasurement of e0 � je00 of normal and invalid tissues hasbeen proposed [49]. Permittivity of infected gall (e0 ¼ 63–65; e00 ¼ 17–19) is higher than that of normal gall (e0 ¼ 60;e00 ¼ 15).
4.3. Wood and Fibrous Materials
Most fibrous materials are organic cellulose–based sub-stances; such as wood, paper, cartoon, fabric, and fibers.Wood is highly hygroscopic and anisotropic. The dielectricproperties of wood depend on type of wood, density, mois-ture content, and temperature [50,51]. Normal moisturecontent of wood is between 8 and 12%.
According to generalized electrophysical model of woodsamples proposed [51], one can consider a second-ordertensor for evaluation of its complex dielectric permittivity
jje0 � je00jj
¼
e0LL � je00LL e0LR � je00LR e0LU � je00LU
e0RL � je00RL e0RR � je00RR e0RU � je00RU
e0UL � je00UL e0UR � je00UR e0UU � je00UU
�
�
�
�
�
�
�
�
�
�
�
�
�
�
�
�
�
�
�
�
�
�
ð21Þ
where L, R, and U are the longitudinal, radial and tan-gential axes of anisotropy, respectively. Rotation of electricfield vector ð �EEÞ on a 1801 angle does not change the di-
electric properties of wood materials; that is L, R, and Uare the principal axes of anisotropy, and the tensor in Eq.(21) may be simplified as follows:
jje0 � je00jj ¼
e0L � je00L 0 0
0 e0R � je00R 0
0 0 e0U � je00U
�
�
�
�
�
�
�
�
�
�
�
�
�
�
�
�
ð22Þ
When �EE is arbitrarily oriented in space and forms an angleW1 with L, angle W2 with R and angle W3 with U closed-formexpressions for calculation of e0 and tan de are derived asfollows [51]:
e0 ¼ e0L cos2 W1þ e0R cos2 W2þ e0U cos2 W3 ð23Þ
tan de¼ tgdeL cos2 W1þ tgdeRN cos2 W2
þ tgdeU cos2 W3
ð24Þ
The measured dielectric constant of Douglas fir at2450 MHz as a function of moisture content [MC (%)]and temperature (1C) is shown in Fig. 16 [50]. Here �EE isoriented parallel to wood fibers. Dependencies e0 (MC) ande00 (MC) at 9210 MHz for the same type of wood and soft-wood hembal when T¼ 231C and 0rMC%r28 are pre-sented in Ref. 52.
Density of wood [r (g/cm3)] may also influence e0 � je00.Experimentally obtained functions e0 (r, MC, T) and e00 (r,MC, T) for 0.3rrr0.8, 0rMCr60, 20rTr90 for variousRF and microwave frequencies are given in Ref. 51. Thesefunctions are valid for the cases when �EE is perpendicularto wood fibers.
Table 4. Dielectric Properties of Macaroni and Cheese
T (1C) 27 MHz 40 MHz 915 MHz 1800 MHz
20 e0 70.9078.96 65.2778.29 40.2373.71 38.7775.41e00 400.03755.18 273.47737.76 21.3373.81 17.4073.39
30 e0 72.4079.09 66.5378.52 40.8773.18 39.0775.35e00 486.57766.47 331.40745.06 23.4774.26 17.9073.46
40 e0 72.8778.22 66.6377.65 40.9072.88 39.3075.10e00 593.50763.65 403.13743.11 27.3075.51 19.0373.21
50 e0 72.6778.87 66.2778.20 40.5373.07 38.9075.16e00 688.70767.08 466.53745.38 29.7775.55 19.7073.03
60 e0 73.0778.55 66.1377.91 40.0373.00 38.5375.08e00 800.30757.46 541.43738.88 32.8775.21 20.9372.71
70 e0 74.0378.03 66.6777.51 40.0772.70 38.1774.89e00 921.37762.49 622.73742.61 36.2374.76 22.2372.49
80 e00 73.8378.13 65.6777.43 39.5372.39 37.5774.92e0 1060.27755.75 716.17737.55 39.7074.75 23.6772.44
90 e0 76.6778.37 67.1777.34 40.6774.88 37.1774.60e00 1208.60767.57 815.70745.29 43.2373.30 25.2371.40
100 e0 80.9375.59 69.9074.75 40.6774.38 37.1374.52e00 1382.237117.32 932.73778.84 48.1772.55 27.5770.84
110 e0 83.2374.91 71.1373.60 40.3774.48 36.7774.67e00 1536.137164.25 1035.877110.15 52.3773.04 29.5771.36
121.1 e0 84.3375.26 71.0774.17 38.9374.82 35.5774.84e00 1712.807172.76 1154.577115.96 57.4073.64 31.8771.75
Source: Ref. 11.
3704 PERMITTIVITY AND MEASUREMENTS

4.4. Resins and Plastics
According to the classification proposed in Ref. 53, resinsand plastics are divided into three main groups: (1) nopolar high-frequency (HF) dielectrics, including polyeth-ylene, polypropylene, and polyester (2) weak polar andpolar HF and low-frequency (LF) dielectrics, includingpolyformaldegid, rubbers, and polybutadiene; and (3) po-lar LF dielectrics such as polyamide, epoxide, and polyvi-nylchloride.
Rubber-based resins are multimolecular substances de-scribed by the formula (C5H8)m, where m is the number ofmolecular chains. Vulcanization (heating of rubber aftermixing with sulfur containing matters) of crude rubberallows improving its heatproof properties. The dielectricconstant of rubbers in a microwave range has been studiedin several works [5,53,54]. For example, temperature de-pendencies of e0ðTÞ and e00ðTÞ of stearine butadiene rubber(SBR) at 2800 MHz are represented in Ref. 7. These de-
pendencies may be approximated with polynomial expres-sions:
e0 ¼ 0:1172� 10�9T5 � 0:6167� 10�7T4þ 0:121� 10�4�T3
� 0:001088T2þ 0:03727Tþ 8:821
e00 ¼ � 0:27561� 10�11T6þ0:163672� 10�8T5
� 0:38772� 10�6T4þ 0:46581� 10�4T3�
� 0:0029782�T2þ 0:096531�T � 0:971 ð25Þ
Similar functions for cured and vulcanized nitrile but-adiene rubber (NBR) at 2450 MHz have been measured[54] (see Fig. 17). Experimental data of the complex di-electric permittivity of some rubbers at various frequen-cies have also been given [5].
Table 5. Dielectric Properties (Mean7STD) of Fruits and Nuts at Five Temperatures and Four Frequencies
Dielectric Constant Loss Factor
TemperatureFrequency (MHz) Frequency (MHz)
Material (1C) 27 40 915 1800 27 40 915 1800
Apple 20 72.570.6 72.670.7 74.370.8 67.470.9 120.472.1 80.571.5 8.570.8 9.970.1(GDa) 30 71.370.8 71.370.8 72.370.7 66.070.9 143.972.0 96.471.4 8.571.1 8.770.0
40 69.770.8 69.670.8 70.070.8 64.170.9 171.872.6 115.371.7 8.270.9 7.670.050 68.170.8 67.970.8 67.871.0 62.171.0 202.273.3 135.872.2 8.370.6 6.970.160 66.570.8 66.470.9 65.671.0 60.171.0 234.174.3 157.472.7 8.770.3 6.770.1
Apple 20 74.670.6 74.770.5 77.070.0 70.470.5 92.070.9 61.170.8 10.071.4 10.870.2(RDa) 30 72.770.8 72.870.7 74.570.2 68.370.4 109.170.6 72.870.6 9.471.8 9.470.7
40 70.670.8 70.870.8 71.570.1 66.170.5 130.771.1 87.570.8 10.072.5 8.3þ0.750 68.770.9 68.770.8 68.970.2 64.070.5 153.871.6 103.171.3 9.872.8 7.470.860 66.871.0 66.870.8 67.170.5 62.070.8 178.672.3 119.971.6 8.971.9 6.770.7
Almond 20 5.970.1 5.970.1 1.770.9 5.870.2 1.27 0.2 1.570.2 5.770.5 2.970.830 5.771.7 5.971.8 3.272.3 3.472.3 0.670.2 1.170.6 6.471.8 3.470.940 5.871.6 6.17 1.9 3.372.0 3.672.1 0.670.1 1.070.5 6.071.3 3.570.750 5.871.6 6.271.8 3.470.5 4.271.6 0.670.3 1.170.6 5.770.1 3.470.260 6.071.5 6.371.8 3.171.4 3.972.3 0.770.1 1.170.4 6.471.3 3.071.2
Cherry 20 91.270.1 85.070.4 73.770.1 70.970.1 293.074.3 198.572.9 16.470.0 16.070.230 91.470.9 84.070.8 72.070.3 69.770.3 363.1711.2 245.777.6 17.270.5 15.170.640 91.072.0 82.471.6 69.670.7 67.870.6 44.01726.6 297.5718.0 18.371.0 14.670.950 89.673.6 79.972.7 66.771.6 65.271.5 501.9737.2 338.9725.1 19.371.4 14.271.160 89.875.5 78.573.8 64.171.8 62.871.6 565.4754.0 381.8736.6 20.471.9 14.171.4
Grape 20 89.075.1 82.771.8 72.772.5 72.171.2 202.479.3 137.877.0 12.170.0 12.670.1Fruit 30 90.376.8 81.972.7 70.872.3 70.271.1 242.678.9 165.276.9 12.570.2 11.570.2
40 91.979.2 81.474.0 68.572.1 68.271.1 291.479.0 198.477.3 13.370.4 10.970.250 93.8711.3 80.975.2 66.172.1 66.070.9 345.377.8 235.276.9 14.270.3 10.770.260 96.5714.0 80.876.6 63.772.0 63.770.8 401.175.8 273.375.8 15.570.3 10.770.2
Orange 20 84.070.1 81.070.1 72.971.9 72.570.1 223.370.6 151.670.3 16.572.8 14.870.530 82.270.3 78.570.3 70.671.8 70.770.3 267.971.8 181.671.1 17.872.7 13.970.540 80.270.7 75.770.6 68.072.1 68.670.4 318.075.3 215.373.4 18.773.0 13.170.550 78.070.5 72.770.4 66.1þ0.6 65.670.2 367.775.0 248.673.4 17.571.2 12.370.260 75.870.9 69.970.6 63.270.7 62.770.3 418.476.5 282.874.3 18.471.2 12.270.2
Walnut 20 4.970.0 4.870.0 2.271.6 2.170.7 0.670.0 0.770.1 2.970.1 1.870.230 5.070.1 4.970.1 2.170.3 2.770.2 0.570.1 0.670.1 2.670.1 1.670.240 5.170.1 5.170.1 3.070.1 3.270.0 0.470.0 0.670.1 2.370.1 1.370.250 5.270.1 5.170.0 3.470.0 3.570.0 0.370.1 0.570.1 2.070.0 1.170.160 5.370.0 5.270.0 3.870.0 3.770.0 0.470.1 0.570.0 1.870.0 1.070.1
aGD, Golden Delicious; RD, Red Delicious
Source: Ref. 41.
PERMITTIVITY AND MEASUREMENTS 3705

Resins such as polyamide and polyimide have widepractical applications in modern microelctronics electri-cal, and airspace engineering. The dielectric properties ofsome of these materials at microwave frequencies havebeen studied closely. In particular, e0ðTÞ and e00ðTÞ of Nylon-6 at 2450 MHz have been obtained [55]. These results arerepresented in Fig. 18.
Plastic dielectrics have weak interaction with EM fieldsbecause of their nonpolar molecular structure. Plastics areoften used as package material for foods treated by mi-crowaves. Most of plastics have a very weak linear depen-dence on temperature at RF and microwave frequencies.For example, the dielectric permittivity and loss factor ofplastic materials have been analyzed in by Von Hippel [5]at 10,000 MHz: 2:5 � e0 � 6; tan de � 0:05. Table 8 lists thedielectric permittivities of selected plastic materials at2450 MHz.
4.5. Ceramics
Ceramics are widely applied in many areas of science andengineering because of their unique features such as hightemperature stability of physical properties, low wearabil-ity, thermal conductivity, and weight. Dielectric propertiesof selected ceramics as a function of temperature and fre-
quency have also been studied [5]. The dielectric constantof ceramic may be sufficiently low (Mullite, e0o10), average(titanic ceramics N1400-110, N750T, 30� e0 � 150) or high(TiO2, CaTiO3 and LaAlO3, e04200) .
The complex dielectric permittivity of ceramics Hilox-882, which consists of Al2O3, SiO2, MgO, CrO2, and CaO attwo microwave frequencies and three temperatures, isshown in Table 9 [56]. An analytical model that describesthe behavior of e0 and e00 of composite ceramics in tempera-ture range 0ooCo2500 at 2450 MHz has been derived [57]
e¼ einþ 10�4ðT � 25Þ � j . 10�3ðT � 25Þ ð26Þ
Where ein¼ 3:9� j0:46 is the initial value at T¼ 251C.Several types of ceramics—aluminosilicate and zircona
fibre board, alumina, Ni–Zn–ferrite, and PZT ceramics—were analyzed at 2422 MHz by Hamlin et al. [58], whotreated these materials by microwave in a cylindrical ap-plicator with operating mode TM010.
Measured values of e0ðTÞ � je00ðTÞ at 3000 MHz for sodalime glass (Corning 0080), borosilicate glass, MulliteMV20, cupric oxide, aluminum nitride, zeolite Fig. 19,alumina cement AC56, zirconia cement, and felt can befound in Ref. 59. Some of these dependencies (zeolite) may
Table 6. Dielectric Properties (Mean7STD) of Four Insect Larvae at Five Temperatures and Four Frequencies
Dielectric Constant Loss Factor
TemperatureFrequency (MHz) Frequency (MHz)
Material (1C) 27 40 915 1800 27 40 915 1800
Codling 20 71.570.9 64.970.9 47.970.2 44.570.1 238.17 0.1 163.37 0.4 11.770.1 12.070.2moth 30 71.570.1 63.970.2 45.970.9 42.970.9 277.87 8.5 190.27 5.4 12.570.4 11.770.3
40 73.870.1 64.570.1 44.670.6 41.670.4 332.4716.3 227.5710.5 13.970.5 11.970.350 79.371.1 68.571.6 45.671.5 42.771.5 422.57 5.9 288.67 4.4 16.570.3 13.270.360 84.572.5 71.572.9 45.072.4 41.972.2 511.3726.6 349.1718.3 19.171.0 14.270.7
Indian- 20 81.371.9 69.170.9 39.970.4 37.570.5 210.97 4.8 149.07 3.7 13.471.4 10.670.6meal 30 85.872.7 72.071.4 39.270.0 36.970.1 244.17 3.7 172.47 3.0 14.371.4 10.670.8moth 40 94.471.5 77.370.9 37.670.8 35.570.9 268.7725.1 190.9716.9 15.272.1 10.671.2
50 103.770.8 83.770.5 37.271.3 35.371.4 314.0742.8 223.1728.1 16.972.4 11.471.560 113.073.3 90.472.2 37.871.6 35.671.7 397.4757.8 280.7737.9 19.972.8 12.871.7
Mexican 20 90.3713.6 71.270.3 48.573.4 47.070.7 343.9715.1 230.97 5.9 17.572.0 13.371.7fruitfly 30 105.1721.5 87.2712.1 47.373.5 45.570.4 384.7715.2 272.2718.2 21.373.9 13.971.9
40 117.4728.2 95.4716.6 46.472.9 44.770.8 446.1719.0 316.5722.4 24.275.1 14.572.250 128.7733.6 102.9720.0 45.772.3 44.171.4 521.8732.1 370.7733.0 26.875.7 15.472.560 141.2737.5 111.5722.8 44.572.0 43.071.6 582.2728.1 414.5731.7 29.475.9 16.572.7
Navel 20 80.270.3 68.670.4 44.571.3 42.271.4 307.87 4.9 212.67 3.1 16.170.1 12.770.0orange 30 83.671.5 70.471.0 43.670.4 41.570.7 359.7710.5 248.07 7.5 17.570.6 12.970.4worm 40 87.772.1 72.771.6 42.870.1 40.770.1 419.4717.3 288.8712.0 19.270.9 13.470.6
50 92.871.6 75.971.2 42.370.4 40.270.1 480.3724.5 330.8716.5 21.271.0 14.170.660 99.470.0 80.170.0 42.270.1 40.070.0 562.77 3.3 386.77 2.2 24.070.1 15.570.0
Source: Ref. 41.
Table 7. Dielectric Permittivity (e0) and Loss Factor (e0) of Biotissues at 2450 MHz and Room Temperature
Tissue Eye Brain Fat Muscle Kidneys Skin Blood
e0 � je00 30� j8 32� j15.5 5� j0.99 46� j13.5 44.5� j14.9 43� j14 65� j19.5
Sources: Refs. 46 and 47.
3706 PERMITTIVITY AND MEASUREMENTS

020
�'�"
�' �"
30 40 50 60Temperature °C
70 80 90
1
2
3
4
5
6
7
8
0
0.2
0.4
0.6
0.8
1
1.2
1.4
10 % MC = 0%
20 %
30 %
Figure 16. Dielectric permittivity ðe0Þ and lossfactor ðe00Þ of Douglas fir at different moisturecontent [50].
2.540 50 60 70 80 90 100 110
Temperature °C120 130 140 150 160
2.7
2.9
3.1
3.3
3.5
�'
�' �"
�"
�'�"
0
0.3
0.6
0.9
1.2
1.5
Figure 17. Dielectric permittivity ðe0Þ andloss factor ðe00Þ of nitrile butadiene rubber:crude rubber (lines with triangles), vulcanizedrubber (lines with circles) [54].
3
3.2
3.4
3.6
3.8
0.25
0.2
0.15
0.1
0.05
4
50 60 70 80 90 100
Temperature °C
�'
�' �"
�"
110 120 130 140 1500
Figure 18. Dielectric permittivity ðe0Þ andloss factor ðe00Þ of Nylon-6 [55].
Table 8. Dielectric Permittivity (e0) and Loss Factor (e0) of Plastics [5,7] at 2450 MHz
Material China Ultem Polyetilene Polystirol Teflon Glass
e0 � je00 5.7� j0.05 3.5� j0.0013 2.2� j0.004 2.5� j0.00 l 2.05� j0.002 7.6�0.156
PERMITTIVITY AND MEASUREMENTS 3707

be approximated by expressions:
e0 ¼ 0:250933T0:499713;
e00 ¼ 0:383887e0:0047014 �T R2¼ 0:962ð27Þ
Where R2 is the coefficient of determination. Bothequations are valid when 300o�Co500. The dielectricconstant of Mullite MV20 e0ðTÞ¼ 5:3 � 7:8; e00ðTÞ¼0:05 � 1:3; 400 � �C¼ 1300 at 915 MHz has been investi-gated [60].
4.6. Soils and Minerals
Moisture dependent dielectric constants of many soils(sandy, high-clay, loami and etc.) over RF and microwavefrequency ranges have been published by several authors[61–64]. Most of these studied have been carried out in thetemperature range (5��C � 25) for fixed values of soilsdensity. As an example in Table 10, complex dielectricpermittivity of two types of soils is listed for differentmoisture content at two microwave frequencies [64].
At 2450 MHz all dry sandy soils may be classified onthree groups according to the value of loss factor: sandswith low losses ðe00 ¼ 0:0075Þ, sands with average losses
Table 9. Dielectric Permittivity (e0) and Loss Factor (e0) of Ceramic Materials
T¼5001C T¼10001C T¼12001C
f (MHz) e0 e00 e0 e00 e0 e00
915 9.13 0.022 10.47 0.66 13.32 3.832450 9.13 0.087 10.86 0.53 12.66 2.01
Source: Ref. 56.
Table 10. Dielectric Permittivity (e0) and Loss Factor (e0) of Some Soils
MC¼4% MC¼12% MC¼20%
Soil 1 GHZ 3 GHZ 1 GHZ 3 GHZ 1 GHZ 3 GHZ
Sand ðe0 � je00Þ 3.33� j0.13 3.05� j0.26 11.6� j0.78 10.8� j1.04 20.3� j1.17 19.4� j1.96Clay ðe0 � je00Þ 3.05� j0.78 2.88� j0.73 12.5� j4.30 11.4� j2.35 22.2� j8.87 19.2� j4.43
Source: Ref. 64.
0
1
2
3
4
5
6
7
300 325
�'
�', �"
�"
350 375 400Temperature °C
425 450 475 500
Figure 19. Dielectric permittivity ðe0Þ andloss factor ðe00Þ of zeolite ceramics: experiment(solid lines) and approximation (black circles)[59].
Table 11. Dielectric Permittivity (e0) and Loss Factor (e0) of Selected Minerals [66] at 2450 MHz
T¼251C T¼1001C T¼2001C T¼3001C
Mineral e0 e00 e0 e00 e0 e00 e0 e00
Chalcocite 16.72 1.64 17.14 1.76 15.46 1.52 11.82 1.12Chalcopyrite 11.01 8.02 11.41 10.20 11.20 12.5 9.01 1.41
3708 PERMITTIVITY AND MEASUREMENTS
(0:011 � e00 � 0:031), and sands with high losses ð0:05 �e00 � 0:1Þ [65]. Dry clay soils are characterized by 3:91 �e0 � 4:21 and 0:14 � e00 � 0:32. Dielectric properties of loamisoils with moisture content: 2 �MC � 50% and 3:49 � e0 �32:53 and 0:22 � e00 � 1:3.
EM fields are used today in mining industry, geology,road building technologies, and so on. Determination ofdielectric properties of minerals allows more accuratemathematical modeling of physical processes of EM wavesinteraction with lossy media. The open-end-coaxial linemethod has been utilized [63] for measuring e0ðf ;TÞ �je00ðf ;TÞ of over 60 minerals in the temperature range25–3251C and frequency range 300 � f ;MHz � 3000.Some of these experimental data at 2450 GHz are givenin Table 11. Most minerals exhibit increasing values of e0
and e00 versus temperature, except for minerals presentedin Table 11 which have complicated dependencies e0ðTÞ ande00ðTÞ [66].
5. CONCLUSION
Wide applications of dielectric materials require theknowledge of their dielectric properties. We have repre-sented data about dielectric permittivity for some of thesematerials in RF and microwave ranges. Many of the ex-perimental results given in Section 4 have been imple-mented in mathematical models of RF and microwavetechnological applicators developed at Washington StateUniversity.
Three main factors—frequency, temperature and mois-ture content—which significantly influence the valueof e0 � je00 are analyzed in details. In many cases, the non-linear characteristic of temperature dependences ofdielectric permittivity dictates that the physical process-es in RF and microwave systems are highly coupledEM and heat conduction problem. A major challenge inRF and microwave heating research and developmentis to design RF applicators and microwave cavities thatprovide uniform E-field patterns in treated materials.With precise measurements of dielectric and thermalproperties for different materials, great success of new de-signs in industrial implementations will be expected in thefuture.
BIBLIOGRAPHY
1. M. N. Afsar, J. R. Birch, and R. N. Clarke, The measurementof the properties of materials, Proc. IEEE 74:183–199 (1986).
2. J. Krupka and R. G. Geyer, Loss-angle measurement, Wiley
Encyclopedia of Electrical and Electronics Engineering On-line, Wiley, New York, 1999.
3. S. Aditya and A. Arokiaswami, Microwave measurement in-strumentation, Wiley Encyclopedia of Electrical and Elec-
tronics Engineering Online, Wiley, New York, 1999.
4. R. Bartnikas, Dielectric measurement, Wiley Encyclopedia of
Electrical and Electronics Engineering Online, Wiley, NewYork, 1999.
5. A. Von Hippel, Dielectrics and Waves, Wiley, New York, 1954.
6. P. S. Neelakanta, Handbook of Electromagnetic Materials:
Monolithic and Composite Versions of Their Application,CRC Press LLC, Boca Raton, FL, 1995.
7. A. C. Metaxas and R. J. Meredith, Industrial Microwave
Heating, Peter Peregrinus, London, 1983.
8. S. Ryynanen, The electromagnetic properties of food mate-rials: A review of the basic principles, J. Food Eng. 29:409–429 (1995).
9. S. O. Nelson, Review and assessment of radio-frequency andmicrowave energy for stored-grain insect control, Trans.
ASAE 39:1475–1484 (1996).
10. S. C. Harvey and P. Hoekstra, Dielectric relaxation spectraof water adsorbed on lysozyme, J. Phys. Chem. 76:2987–2994(1972).
11. Y. Wang, T. Wig, J. Tang, and L. M. Hallberg, Dielectricproperties of food relevant to RF and microwave pasteuriza-tion and sterilization, J. Food Eng. 57:257–268 (2003).
12. J. Tang, H. Feng, and M. Lau, Microwave heating in foodprocessing, in X. Young and J. Tang, eds., Advances in Bio-
processing Engineering, World Scientific, 2002.
13. P. Debye, Polar Molecules, The Chemical Catalog Co., NewYork, 1929.
14. S. Mashimo, S. Kuwabara, S. Yagihara, and K. Higasi,Dielectric relaxation time and structure of bound waterin biological materials, J. Phys. Chem. 91:6337–6338 (1987).
15. P. Gregory, R. N. Clarke, T. E. Hodgetts, and G. T. Symm, RF
and Microwave Dielectric Measurements upon Layered Ma-
terials Using Reflectrometric Coaxial Sensor, Natl. Phys.Lab. Report DES 125, 1993.
16. C. W. Macosko, Rheology, Principles, Measurements, and
Applications, VCH Publishers, Cambridge, UK, 1994.
17. J. G. Trump, Dielectric materials and their applications, inA. R. von Hippel, ed., Dielectric Properties and Waves, Wiley,New York, 1954.
18. B. D. Roebuck and S. A. Goldblith, Dielectric properties ofcarbohydrayte-water mixtures at microwave frequencies, J.
Food Sci. 37:199–204 (1972).
19. S. Wang, J. Tang, R. P. Cavalieri, and D. Davis, Differentialheating of insects in dried nuts and fruits associated withradio frequency and microwave treatments, Trans. ASAE
46:1175–1182 (2003).
20. H. Feng, J. Tang, and R. P. Cavalieri, Dielectric properties ofdehydrated apples as affected by moisture and temperature,Trans. ASAE 45:129–135, 2002.
21. R. F. Schiffmann, Food product development for microwaveprocessing, Food Technol. 40:94–98 (1986).
22. R. E. Mudgett, Dielectric properties of foods, in R. V. DeCar-eau, ed., Microwaves in the Food Processing Industry, Aca-demic Press, New York, 1985.
23. S. O. Nelson, J. Forbus, and K. Lawrence, Permittivity offresh fruits and vegetables at 0.2 to 20 GHz, J. Microwave
Power Electromagn. Energy 29:81–93 (1994).
24. M. A. Stuchly and S. S. Stuchly, Coaxial line reflection meth-ods for measuring dielectric properties of biological sub-stances at radio and microwave frequencies—a review,IEEE Trans. Instrum. Meas. 29:176–183 (1980).
25. D. V. Blackham and R. D. Pollard, An improved technique forpermittivity measurement using a coaxial probe, IEEE
Trans. Instrum. Meas. 46:1093–1099 (1997).
26. G. P. Otto and W. C. Chew, Improved calibration of a largeopen-ended coaxial probe for dielectric measurements, IEEE
Trans. Instrum. Meas. 40:742–746 (1991).
PERMITTIVITY AND MEASUREMENTS 3709

27. J. de los Santos, D. Garsia, and J. A. Eiras, Dielectric char-acterization of materials at microwave frequency range,Mater. Res. 6:97–101 (2003).
28. M. Arai, J. G. P. Binner, and T. E. Cross, Estimating errorsdue to sample surface roughness in microwave complex per-mittivity measurements obtained using a coaxial probe,Electron. Lett. 31:115–117 (1995).
29. D. K. Ghodgaonkar, V. V. Varadan, and V. K. Varadan, A freespace method for measurement of dielectric constants andloss tangents at microwave frequencies, IEEE Trans. In-strum. Meas. 37:789–793 (1989).
30. C. C. Courtney, Time-domain measurement of the electro-magnetic properties of materials, IEEE Trans. Microwave
Theory Tech. 46:517–522 (1998).
31. V. V. Komarov. and V. V. Yakovlev, Modeling control overdetermination of dielectric properties by perturbationtechnique, Microwave Opt. Technol. Lett. 39N(6):443–446(2003).
32. L. Chen, C. K. Ong, and B. T. Tan, Amendment of cavityperturbation method for permittivity measurement of ex-tremely low-loss dielectrics, IEEE Trans. Instrum. Meas.48:1031–1037 (1999).
33. A. W. Kraszewski and S. O. Nelson, Observation on resonantcavity perturbation by dielectric objects, IEEE Trans. Mi-
crowave Theory Tech. 40:151–155 (1992).
34. J. Krupka, D Cros, M. Auburg, and P. Guillon, Study ofwhispering gallery modes in anisotropic single-crystal di-electric resonators, IEEE Trans. Microwave Theory Tech.42:56–61 (1994).
35. J. N. Ikediala, J. Hansen, J. Tang, S. R. Drake, and S. Wang,Development of saline-water-immersion technique with RFenergy as a postharvest treatment against codling moth incherries, Postharvest Bio. Technol. 24:25–37 (2002).
36. M. Kent, Electrical and Dielectric Properties of Food Mate-
rials, COST 90bis Production, Science and Technology Pub-lishers, Hornchurch, Essex, UK, 1987.
37. N. E. Bengtsson and P. O. Risman, Dielectric properties offoods at 3 GHz as determined by a cavity perturbation tech-nique, J. Microwave Power EM Energy 6:107–123 (1971).
38. J. Tang, J. N. Ikediala, S. Wang, J. Hansen, and R. Cavalieri,High-temperature-short-time thermal quarantine methods,Postharvest Bio. Technol. 21:129–145 (2000).
39. S. Wang, J. N. Ikediala, J. Tang, J. Hansen, E. Mitcham, R.Mao, and B. Swanson, Radio frequency treatments to controlcodling moth in in-shell walnuts, Postharvest Bio. Technol.22:29–38 (2001).
40. S. Wang, J. Tang, J. A. Johnson, E. Mitcham, J. D. Hansen, R.Cavalieri, J. Bower, and B. Biasi, Process protocols based onradio frequency energy to control field and storage pests inin-shell walnuts, Postharvest Bio. Technol. 26:265–273(2002).
41. S. Wang, J. Tang, J. A. Johnson, E. Mitcham, J. D. Hansen,G. Hallman, S. R. Drake, and Y. Wang, Dielectric propertiesof fruits and insect pests as related to radio frequency andmicrowave treatments, Biosyst. Eng. 85:201–212 (2003).
42. C. C. Lu, H. Z. Li, and D. Gao, Combined electromagneticand heat conduction analysis of rapid rewarming of cryo-preserved tissues, IEEE Trans. Microwave Theory Tech.MTT-48:2185–2190 (2000).
43. F. A. Gibbs, Clinical evaluation of a microwave/radiofrequen-cy system (BSD Corporation) for induction of local and re-gional hyperthermia, Int. J. Microwave Power EM Energy16:185–192, (1981).
44. J. C. Lin, S. Hirai, C. L. Chiang, W. L. Hsu, J. L. Su, and Y. J.Wang, Computer simulation and experimental studies ofSAR distributions of interstitial arrays of sleeved-slot mi-crowave antennas for hyperthermia treatment of brain tu-mors, IEEE Trans. Microwave Theory Tech. MTT-48:2191–2198 (2000).
45. M. F. Iskander and C. H. Durney, Microwave methods ofmeasuring changes in lund water, Int. J. Microwave Power
EM Energy 18:265–275 (1983).
46. M. A. Stuchly and S. S. Stuchly, Dielectric properties of bi-ological substances—tabulated international, Int. J. Micro-
wave Power EM Energy 15:19–26 (1980).
47. R. Pethig, Dielectric properties of biological materials: Bio-physical and medical applications, IEEE Trans. Electric. In-sul. EI-19:453–474 (1984).
48. A. Kraszewski, M. A. Stuchly, S. S. Stuchly, and A. M. Smith,In vivo and in vitro dielectric properties of animal tissues atradio frequencies, Electromagnetics 3:421–432 (1982).
49. S. B. Kumar, K. T. Mathew, U. Raveendranath, and P. Au-gustine, Dielectric properties of certain biological materialsat microwave frequencies, Int. J. Microwave Power EM En-
ergy 36:67–75 (2001).
50. W. Tinga, Multiphase Dielectric Theory Applied to CelluloseMixtures, Ph.D. thesis, Univ. Alberta, Canada, 1969.
51. G. I. Torgovnikov, Dielectric Properties of Wood and Wood
Based Materials, Springer-Verlag, Berlin, 1993.
52. W. A. Voss, Factors affecting the operation of high-power mi-crowave heating systems for lumber processing, IEEETrans. Indust. Gener. Appl. GE-20:234–243 (1966).
53. D. M. Kazarnovskiy and S. A. Yamanov, Radio Engineering
Materials, Vishaya Shkola Issue, Moscow, 1972 (in Russian).
54. J. M. Catala-Civera, S. Giner-Maravilla, D. Sanchez-Her-nandez, and E. de las Reyes, Pressure-aided microwave rub-ber vulcanization in a ridged three-zone cylindrical cavity,Int. J. Microwave Power EM Energy 35:92–104 (2000).
55. F. Liu, I. Turner, E. Siores, and P. Groombridge, A numericaland experimental investigation of the microwave heating ofpolymer materials inside a ridge waveguide, Int. J. Micro-
wave Power EM Energy 31:71–82 (1996).
56. M. Arai et al., Elevated temperature dielectric propertymeasurements: Results of a parallel measurement program,Proc. Symp. Microwave Theory Appl. Mater. Process. II36:539–546, 1993.
57. J. Braunstein, K. Connor, S. Salon, and L. Libelo, Investi-gation of microwave heating with time varying materialproperties, IEEE Trans. Magn. MAG-35:1813–1816 (1999).
58. M. G. Hamlin, A. L. Bowden, and N. G. Evans, Measurementand use of high temperature dielectric properties in ceramicprocessing, Proc. Int. Conf. Microwave and High-Frequency
Heating’95, Cambridge, UK, 1995, pp. 11–14.
59. W. Xi and W. Tinga, Error analysis and permittivity mea-surements with re-entrant high-temperature dielectro-meter, Int. J. Microwave Power EM Energy 28:104–112(1993).
60. W. Xi and W. Tinga, A high temperature microwave die-lectrometer, Proc. Symp. Microwave Theory Appl. Mater.
Process. 34:215–224 (1991).
61. P. Hoekstra and A. Delaney, Dielectric properties of soils atUHF and microwave frequencies, J. Geophys. Res. 79:1699–1708 (1974).
62. J. E. Hipp, Soil electromagnetic parameters as a function offrequency, soil density and soil moisture, Proc. IEEE 62:98–103 (1974).
3710 PERMITTIVITY AND MEASUREMENTS

63. J. R. Wang and T. J. Schmugge, An empirical model for thecomplex dielectric permittivity of soils as a function of watercontent, IEEE Trans. Geosci. Remote Sens. GE-18:288–295(1980).
64. A. M. Shutko, Microwave Radio Sensing of Water Surfaces
and Soils, Nauka, Moscow, 1986 (in Russian).
65. L. V. Gonchariva, V. I. Barinova, U. M. Egorov and V. M.Fedorov, Dielectric properties of disperse soils in microwave
range, Proc. Int. Conf. Application of Microwave Energy in
Technology and Science, Saratov, Russia, 1991, pp. 104–105(in Russian).
66. J. B. Salsman, Measurement of dielectric properties in thefrequency range of 300 MHz to 3 GHz as a function of tem-perature and density, Proc. Symp. Microwave Theory Appl.Mater. Process. 34:203–214 (1991).
PERMITTIVITY AND MEASUREMENTS 3711