pharma-data 2009 - bpi · pharma-data 2009 0 3 ... explained with the existence of many marketing...
TRANSCRIPT

Pharma-Data 2009
rz_pharma_2009_en.qxd 02.03.2010 10:34 Uhr Seite 1

rz_pharma_2009_en.qxd 02.03.2010 10:34 Uhr Seite 2

Pharma-Data 2009
rz_pharma_2009_en.qxd 02.03.2010 10:34 Uhr Seite 3

rz_pharma_2009_en.qxd 02.03.2010 10:34 Uhr Seite 4

0 4 P r e f a c e
The pharmaceutical i n d u s t ry in Germany
08 Sector structure
Pharmaceuticals, an economic factor
10 P r o d u c t i o n11 E m p l o y e e s12 External trade14 Research and development
(R&D)15 P a t e n t s
The significance of pharmaceutical drug i n n o v a t i o n s
18 Research and developmentof pharmaceutical drugs
24 Bio-engineering and genetic engineering
Safety of pharmaceuticaldrugs / pharmacovigilance
3 0 Continuous monitoring of the safety of pharmaceuticaldrugs / pharmacovigilance
31 Identification of side effects in clinical trials
33 Reports of side effects34 EU-wide exchange of
safety data 35 Red hand letter for
informing the experts
The pharmaceutical i n d u s t ry in its international context
36 The global pharmaceutical market
38 The European pharmaceutical market
42 International comparison of pharmaceutical drug prices
The pharmaceutical industry as part of the German health care system
44 The health care system in Germany
52 Cost structure of S t a t u t o ry Health Insurance( S H I )
56 Rebate / discount contracting in SHI
The German pharmaceutical market
60 The German pharmacy m a r k e t
The pharmaceutical market64 The German
pharmaceutical market66 The OTC market70 The SHI pharmaceutical
m a r k e t73 The SHI structural
c o m p o n e n t78 The number of
pharmaceutical drugs in Germany
80 I n t e rventions in the pharmaceutical market- Outlook
84 I n d e x86 A c r o n y m s
Table of Contents
Pharma-Data 2009
0 3
rz_pharma_2009_en.qxd 02.03.2010 10:34 Uhr Seite 5
Pharmaceutical drugs play a
central role in the health care
system, as well as the n a t i o n a l
economy of the Federal R e p u b l i c
of Germany. From the patient’s
point of view, quick access to
pharmaceutical drug c o n s t i -
tutes an important aspect in the
treatment, prevention and diag-
nosis of diseases. The innovativeness and competitive capacity
of the pharmaceutical industry contributes significantly to the
creation of value in the German economy. This industry primarily
employs a high proportion of highly-qualified staff. Generally, the
pharmaceutical industry is subject to pressures from health,
social, economic and industrial policies.
Despite the significance of pharmaceutical drugs for our health,
the public image of the pharmaceutical industry is mostly negative.
Manufacturers of pharmaceuticals must meet manifold expec-
tations: On one hand, they are to meet health- and sociopoliti-
cal goals and comply with high ethical standards in the fields of
research, production and sales. On the other hand, they must
also secure their own viability as businesses. The last point in
particular tends to lead to public discrediting, even in the con-
text of political debates.
P re f a c e
Pharma-Data 2009
0 4
rz_pharma_2009_en.qxd 02.03.2010 10:34 Uhr Seite 6

The impact of the 2007 reform
package was not felt until the
subsequent years. In the field of
pharmaceutical rebate contracts,
for instance, there were grave
consequences, especially for
companies without contracts,
caused by the preferential
treatment of rebate contracts
associated with the sales of
pharmaceutical drugs. The
courts of law, also, had a diffi-
cult task, in dealing with the
continuing problems with calls
for tender. The focus of the
procedures and the specialist public discussions was on
questions concerning applicability of the anti-trust law – with
the associated requirement for European-wide calls for tender
– as well as the applicable legal route when it came to
checking rebate / discount contracts (Social Courts or ordinary
jurisdiction). The above-mentioned discussions were precipitated
by the calls for tender by the AOKs (Allgemeine Ortskranken-
kassen; German public health insurance companies).
Furthermore, the instrument of second opinion was further
specified. The debate about the methods of benefit and/or
cost-benefit analysis was sometimes highly controversial in
order to prevent Germany from implementing a purely national
solution.
Pharma-Data 2009
0 5
rz_pharma_2009_en.qxd 02.03.2010 10:34 Uhr Seite 7

In order to maintain the position
of the pharmaceutical industry
in Germany, which significantly
fosters growth and employment,
it needs to be accepted that
the pharmaceutical industry ’s
contribution cannot be restricted
mere cost reduction. Rather, the
focus should shift to the value of
pharmaceutical drugs from a
general economic perspective.
Pharma c o t h e r a p y, for instance,
can reduce sick leave, shorten
hospital stays and prevent
aggravation of illnesses, while
preventive therapy can also
reduce suffering. Hence, aside
from increasing quality of life, pharmaceutical drugs also make a
positive public economic contribution. In general, one should
not forget that the consequences of any kind of government
i n t e rvention will, in the long run, have an impact on the citizens’
supply of pharmaceutical drugs. In this context, it should be noted
that, in Germany, research with already known substances
must once again be lucrative. The advantages for patient care
must not be sacrificed to rigid, or increasingly missing, r e i m b u r s e-
ment options.
Pharma-Data 2009
0 6
rz_pharma_2009_en.qxd 02.03.2010 10:34 Uhr Seite 8

What has, by now, become a
v e ry high degree of regulation
in the field of pharmaceutical
drugs, with a number of control
instruments that simultaneously
exist or actually void each
o t h e r, must be subjected to
systematic evaluation and then,
with the consent of those
involved, be reduced to some
few instruments.
The general conditions of the
health care policy ought to secure, for those involved in the
health care system and for the public, for all types of therapies,
a high degree of freedom when it comes to selecting q u a l i t y -
assured, individual therapeutic as well as preventative options.
The present issue, of the “Pharma-Data”, issue no. 39, once
more supplies facts and background information about the
pharmaceutical market, with the objective of bringing to a
factual level the discussion surrounding this field, which is
partially being conducted in a controversial manner.
Pharma-Data 2009
0 7
rz_pharma_2009_en.qxd 02.03.2010 10:34 Uhr Seite 9

According to the company regi-
ster, in Germany, there are 878
pharmaceutical companies* regis-
tered at the Federal Office for
Statistics. Over the course of the
last few years, ascertaining the
number of companies has be-
come more difficult through
changing reporting groups at the
Federal Office for Statistics on
one hand, and, on the other
hand, through methodical differ-
ences. Additionally, there may be corporations that consist of
several different companies, which, in turn, can be composed of
individual firms and specialist business units
Owing to this, it would make sense to determine the number of
specialist business units – as a core element of pharmaceutical
production – as well as of contract manufacturers. This data, how-
ever, is only partially recorded by the Federal Office for Statistics.
Companies according to size in 2007 in %
* In the “cost structure statistics”, the Federal Office for Statistics shows 265
companies (reporting category 20+). There are an additional 380 companies with a
staff of less than 20. The large number of companies registered can further be
explained with the existence of many marketing authorization holders that are
considered pharmaceutical companies.
S e c t o rs t r u c t u re
The pharmaceutical industry in Germany
0 8
less than 100 staff
100 to 499 staff
500 and more staff
74 %
19 %7 %
S o u rce: Calculation of the BPI, based on data of the Federal
O ffice for Statistics 2009.
rz_pharma_2009_en.qxd 02.03.2010 10:34 Uhr Seite 10

The pharmaceutical companies
include medium-sized compa-
nies, as well as companies
under owner-management, and
also German branches of multi-
national corporations. Further-
more, companies with biotech-
nological processes are to be
considered. These companies
primarily develop and/or pro-
duce pharmaceutical drugs
and diagnostic products, and
are partially included in the 878
companies named. It is still true
that around 93 % of companies
m a n u -facturing pharmaceutical
drugs in Germany employ a
staff of less than 500.
The German Pharmaceutical Industry Association [Bundesver-
band der Pharmazeutischen Industrie e. V. (BPI)] is the only
association in Germany that represents the entire spectrum of
the pharmaceutical industry – on a national, as well as on an
international level. Small and medium-sized companies, as well
as internationally active corporations are represented in the BPI.
Its members include researching pharmaceutical companies,
generic companies, companies from the fields of biotechnology,
phytopharmaceuticals, homeopathic / anthroposophical medi-
cine, as well as pharmaceutical service providers. With more
than 50 years of experience in the field of pharmaceutical drug
research, development, approval, manufacture and marketing,
the BPI offers integrative solutions for the entire pharmaceutical
m a r k e t .
The pharmaceutical industry in Germany
0 9
rz_pharma_2009_en.qxd 02.03.2010 10:34 Uhr Seite 11

Almost two-thirds of the BPI member companies are owner-
managed. Some 90 % of the companies are active on a national,
as well as on an international level. Although the proportion of
export activities is constantly on the rise, many companies generate
the greater proportion of their turnover on the German market. The
health care policy framework conditions in Germany are particularly
important for the future of these nationally oriented companies.
In 2008, the pharmaceutical
i n d u s t ry in Germany produced
pharmaceuticals valued at 27.1
billion Euros.
The production of this sector is therefore 3.4 % higher than in
2007. Domestic production significantly depends on prices,
pharmaceutical drugs imports as well as export demand.
Pharmaceutical Production* from 1996 - 2008
( P roduction value in billion Euros, changes compared to the previous year in %)
* Industrial sector 24.4, production of pharmaceutical drugs
S o u rce: Calculation of the BPI, based on data of the Federal Office for Statistics 2009.
1 0
Pharmaceuticals, an economic factor
´96 ´97 ´98 ´99 ´00 ´01 ´02 ´03 ´04 ´05 ´06 ´07
27.1
+3.4%
17.4
+4.8%
17.3
- 0 . 4 %
17.8
+ 2 . 5 %
18.0
+ 1 . 0 %
18.5
+2.9%
20.2
+9.1%
20.7
+2.3%
20.7
0%
25
20
15
10
5
0
20.8
+0.5%+
22.7
+8.8%
´08
23.7
+4.6%
–
26.2
+ 1 0 . 6 %
P ro d u c t i o n
rz_pharma_2009_en.qxd 02.03.2010 10:34 Uhr Seite 12

In 2008, 127,248 persons were
employed in companies pro-
ducing pharmaceuticals.
Development of staff numbers* in companies pertaining to the phar-
maceutical industry 2002-2008 (changes compared to the pre v i o u s
year in %)
Pharmaceuticals, an economic factor
1 1
E m p l o y e e s
2005 2006 20082002 2003 2004
* The data refers to companies (reporting category 20+). Up to 2007, there was a change from
specialist operating sectors to the level of “companies” in respect to the previous data of the
Pharma-Data, since the report circle 20+ for specialist operating sectors was discontinued by
the Federal Office for Statistics as part of the bureaucracy reduction law.
Source: Calculation of the BPI, based on data of the Federal Office for Statistics 2009.
130,000
120,000
110,000
100,000
121,445
+0.6%
124,235
+2.3%
2007
127,036
+2.3%
127,248
+0.2%
109,873
115,396
+5.0%
120,678
+4.6%
rz_pharma_2009_en.qxd 02.03.2010 10:34 Uhr Seite 13

In 2008, pharmaceuticals val-
ued at 47.5 billion Euros were
exported from the Federal
Republic of Germany. This cor-
responds to an increase of
13.5 % compared to the pre-
vious year of 2007. At the same time, pharmaceuticals valued
at 34.1 billion Euros were imported into the Federal Republic of
Germany in 2008. This constitutes an increase of 4.1 % com-
pared to 2007. The main supplier of pharmaceuticals to
Germany is Ireland, followed by the USA, Switzerland and
France. Great Britain comes in 5th place, followed by Italy and
Belgium.
Import and export of pharmaceutical drugs*
(in million Euros, and change compared to the previous year in %)
* Industrial sector 24.4, production of pharmaceutical drugs
** Due to statistical peculiarities and diff e rent methods of data collection, the production statistics and external trade statistics cannot be compared to each other.
E x t e rnal trade
1 2
Ye a r
2 0 0 0
2 0 0 1
2 0 0 2
2 0 0 3
2 0 0 4
2 0 0 5
2 0 0 6
2 0 0 7
2 0 0 8
million Euros
1 0 , 3 5 3 . 4 7
1 2 , 0 5 1 . 1 7
1 9 , 2 8 4 . 8 3
1 9 , 3 2 7 . 8 3
2 2 , 2 2 1 . 4 2
2 5 , 5 8 5 . 1 7
2 8 , 3 6 6 . 7 2
3 2 , 7 0 6 . 8 3
3 4 , 0 6 3 . 1 6
I m p o r t
+/- %
+ 2 5 . 9
+ 1 6 . 4
+ 6 0 . 0
+ 0 . 2
+ 1 5 . 0
+ 1 5 . 1
+ 1 0 . 9
+ 1 5 . 3
+ 4 . 1
million Euros
1 5 , 1 7 7 . 4 7
2 0 , 4 7 8 . 3 6
1 8 , 8 3 5 . 1 8
2 2 , 2 3 0 . 1 1
2 8 , 6 8 1 . 6 3
3 1 , 7 5 8 . 8 5
3 6 , 4 7 4 . 5 2
4 1 , 9 0 8 . 3 4
4 7 , 5 4 9 . 3 2
E x p o r t * *
+/- %
+ 5 . 9
+ 3 4 . 9
- 8 . 0
+ 1 8 . 0
+ 2 9 . 0
+ 1 0 . 7
+ 1 4 . 8
+ 1 4 . 9
+ 1 3 . 5
Pharmaceuticals, an economic factor
S o u rce: Illustration of the BPI, based on data of the Federal Office for Statistics 2009.
rz_pharma_2009_en.qxd 02.03.2010 10:34 Uhr Seite 14
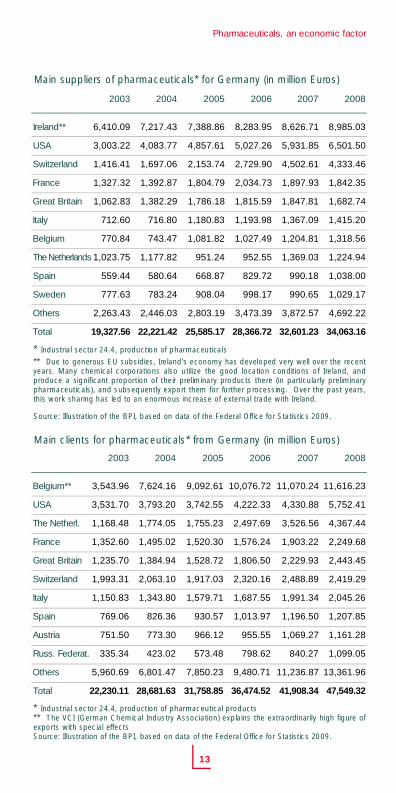
Main suppliers of pharmaceuticals* for Germany (in million Euro s )
Main clients for pharmaceuticals* from Germany (in million Euro s )
1 3
I r e l a n d * *
U S A
S w i t z e r l a n d
F r a n c e
Great Britain
I t a l y
B e l g i u m
The Netherlands
S p a i n
S w e d e n
O t h e r s
T o t a l
2 0 0 3
6 , 4 1 0 . 0 9
3 , 0 0 3 . 2 2
1 , 4 1 6 . 4 1
1 , 3 2 7 . 3 2
1 , 0 6 2 . 8 3
7 1 2 . 6 0
7 7 0 . 8 4
1 , 0 2 3 . 7 5
5 5 9 . 4 4
7 7 7 . 6 3
2 , 2 6 3 . 4 3
1 9 , 3 2 7 . 5 6
2 0 0 4
7 , 2 1 7 . 4 3
4 , 0 8 3 . 7 7
1 , 6 9 7 . 0 6
1 , 3 9 2 . 8 7
1 , 3 8 2 . 2 9
7 1 6 . 8 0
7 4 3 . 4 7
1 , 1 7 7 . 8 2
5 8 0 . 6 4
7 8 3 . 2 4
2 , 4 4 6 . 0 3
2 2 , 2 2 1 . 4 2
2 0 0 5
7 , 3 8 8 . 8 6
4 , 8 5 7 . 6 1
2 , 1 5 3 . 7 4
1 , 8 0 4 . 7 9
1 , 7 8 6 . 1 8
1 , 1 8 0 . 8 3
1 , 0 8 1 . 8 2
9 5 1 . 2 4
6 6 8 . 8 7
9 0 8 . 0 4
2 , 8 0 3 . 1 9
2 5 , 5 8 5 . 1 7
2 0 0 6
8 , 2 8 3 . 9 5
5 , 0 2 7 . 2 6
2 , 7 2 9 . 9 0
2 , 0 3 4 . 7 3
1 , 8 1 5 . 5 9
1 , 1 9 3 . 9 8
1 , 0 2 7 . 4 9
9 5 2 . 5 5
8 2 9 . 7 2
9 9 8 . 1 7
3 , 4 7 3 . 3 9
2 8 , 3 6 6 . 7 2
2 0 0 7
8 , 6 2 6 . 7 1
5 , 9 3 1 . 8 5
4 , 5 0 2 . 6 1
1 , 8 9 7 . 9 3
1 , 8 4 7 . 8 1
1 , 3 6 7 . 0 9
1 , 2 0 4 . 8 1
1 , 3 6 9 . 0 3
9 9 0 . 1 8
9 9 0 . 6 5
3 , 8 7 2 . 5 7
3 2 , 6 0 1 . 2 3
2 0 0 8
8 , 9 8 5 . 0 3
6 , 5 0 1 . 5 0
4 , 3 3 3 . 4 6
1 , 8 4 2 . 3 5
1 , 6 8 2 . 7 4
1 , 4 1 5 . 2 0
1 , 3 1 8 . 5 6
1 , 2 2 4 . 9 4
1 , 0 3 8 . 0 0
1 , 0 2 9 . 1 7
4 , 6 9 2 . 2 2
3 4 , 0 6 3 . 1 6
B e l g i u m * *
U S A
The Netherl.
F r a n c e
Great Britain
S w i t z e r l a n d
I t a l y
Spain
A u s t r i a
Russ. Federat.
O t h e r s
T o t a l
2 0 0 3
3 , 5 4 3 . 9 6
3 , 5 3 1 . 7 0
1 , 1 6 8 . 4 8
1 , 3 5 2 . 6 0
1 , 2 3 5 . 7 0
1 , 9 9 3 . 3 1
1 , 1 5 0 . 8 3
7 6 9 . 0 6
7 5 1 . 5 0
3 3 5 . 3 4
5 , 9 6 0 . 6 9
2 2 , 2 3 0 . 1 1
2 0 0 4
7 , 6 2 4 . 1 6
3 , 7 9 3 . 2 0
1 , 7 7 4 . 0 5
1 , 4 9 5 . 0 2
1 , 3 8 4 . 9 4
2 , 0 6 3 . 1 0
1 , 3 4 3 . 8 0
8 2 6 . 3 6
7 7 3 . 3 0
4 2 3 . 0 2
6 , 8 0 1 . 4 7
2 8 , 6 8 1 . 6 3
2 0 0 5
9 , 0 9 2 . 6 1
3 , 7 4 2 . 5 5
1 , 7 5 5 . 2 3
1 , 5 2 0 . 3 0
1 , 5 2 8 . 7 2
1 , 9 1 7 . 0 3
1 , 5 7 9 . 7 1
9 3 0 . 5 7
9 6 6 . 1 2
5 7 3 . 4 8
7 , 8 5 0 . 2 3
3 1 , 7 5 8 . 8 5
2 0 0 6
1 0 , 0 7 6 . 7 2
4 , 2 2 2 . 3 3
2 , 4 9 7 . 6 9
1 , 5 7 6 . 2 4
1 , 8 0 6 . 5 0
2 , 3 2 0 . 1 6
1 , 6 8 7 . 5 5
1 , 0 1 3 . 9 7
9 5 5 . 5 5
7 9 8 . 6 2
9 , 4 8 0 . 7 1
3 6 , 4 7 4 . 5 2
2 0 0 7
1 1 , 0 7 0 . 2 4
4 , 3 3 0 . 8 8
3 , 5 2 6 . 5 6
1 , 9 0 3 . 2 2
2 , 2 2 9 . 9 3
2 , 4 8 8 . 8 9
1 , 9 9 1 . 3 4
1 , 1 9 6 . 5 0
1 , 0 6 9 . 2 7
8 4 0 . 2 7
1 1 , 2 3 6 . 8 7
4 1 , 9 0 8 . 3 4
2 0 0 8
1 1 , 6 1 6 . 2 3
5 , 7 5 2 . 4 1
4 , 3 6 7 . 4 4
2 , 2 4 9 . 6 8
2 , 4 4 3 . 4 5
2 , 4 1 9 . 2 9
2 , 0 4 5 . 2 6
1 , 2 0 7 . 8 5
1 , 1 6 1 . 2 8
1 , 0 9 9 . 0 5
1 3 , 3 6 1 . 9 6
4 7 , 5 4 9 . 3 2
Pharmaceuticals, an economic factor
* Industrial sector 24.4, production of pharmaceuticals
** Due to generous EU subsidies, Ire l a n d ’s economy has developed very well over the re c e n tyears. Many chemical corporations also utilize the good location conditions of Ireland, and p roduce a significant proportion of their preliminary products there (in particularly pre l i m i n a r ypharmaceuticals), and subsequently export them for further processing. Over the past years,this work sharing has led to an enormous increase of external trade with Ire l a n d .
S o u rce: Illustration of the BPI, based on data of the Federal Office for Statistics 2009.
* Industrial sector 24.4, production of pharmaceutical pro d u c t s** The VCI (German Chemical Industry Association) explains the extraordinarily high figure ofexports with special eff e c t sS o u rce: Illustration of the BPI, based on data of the Federal Office for Statistics 2009.
rz_pharma_2009_en.qxd 02.03.2010 10:34 Uhr Seite 15

In 2008, the pharmaceutical
i n d u s t ry, invested about 5.2
billion Euros total into research
and development (R&D) in
G e r m a n y. With this, invest-
ments significantly rose above
the level of the previous year
of 2007(4.6 billion Euros).
Investment for re s e a rch and development by the pharmaceutical
industry 2002 - 2009 (in million Euro s )
Hence, the R&D costs of the pharmaceutical industry, constitute
some 9.2 % (previous year: 8.7 %) of the total R&D costs of the
German economy (56,780 million Euros) and, as far as overall figures
are concerned, are in third place behind the automotive industry and
the electronics industry. In contrast to the increases of 2006, the infor-
mation based on the projected data for the years 2007 (5,672 million
Euros) and 2008 (5,773 million Euros) had to be markedly adjusted
downward. This development shows that the pharmaceutical industry
was forced to adapt its planning to the changed market conditions,
and that the cost reduction trends in the health care sector resulted in
reduced spending for R&D in comparison to what was planned.
R e s e a rch and d e v e l o p m e n t
Pharmaceuticals, an economic factor
1 4
6,000
5,000
4,000
3,000
2,000
5 , 5 8 8
3 , 4 6 0
4 , 1 0 5
4 , 5 8 0
2009*2002 2003 2004 2005 2006
4 , 1 8 7
* Projected data from the R&D survey 2007 ** Data pre l i m i n a r y
S o u rce: Illustration of the BPI based on data of the Stifterverband Wi s s e n s c h a f t s s t a t i s t i k
2008 and 2009.
5 , 3 9 3
2007**
4 , 6 6 2
2008*
5 , 2 4 0
rz_pharma_2009_en.qxd 02.03.2010 10:34 Uhr Seite 16

The data provided is based on the data available at the time of
editorial deadline of the German Stifterverband Wissenschaftssta-
tistik which, for the past year, is always based on projected data. In
this context, it is noteworthy that the previous year saw the figures
of 2006 being clearly adjusted upward on the basis of the actual
f i g u r e s . Therefore, the downward correction required for this year
concerning the years 2007 and 2008, is all the more significant.
Relatively speaking, the pharmaceutical industry is one of the most
research-intense sectors, with a share of the R&D costs versus
turnover amounting to about 18%, and thus securing future jobs in
Germany. In this, the ratio of R&D expenditures versus turnover
continually declined between 1999 and 2005. The development of
the total R&D costs between 2004 and 2006 is reflected in the
development of the numbers of people employed. The number of
people employed in R&D in 2006 rose to 18,795 compared to
17,998 in 2005. This means that the time period of 2003 to 2006 in
this sector saw an 11% increase in numbers of people employed,
while it saw a 10 % decrease in the numbers of people employed in
the other chemical sectors. At a cost of 194,100 Euros per R&D
employee, the pharmaceutical industry is at the top also in regards
to this parameter.
In Germany, for 2008, 11,425
patent registrations were pub-
lished for pharmaceutical drugs.
In comparison to the previous
year of 2007, this corresponds to
a slight decline of 0.6 %. The pro-
portion of German registrations in regards to the total figure is 12 %
for 2008 (compared to 17 % in the previous year of 2007). It is a
concern that, between 2007 and 2008, patent registrations of
German registrants declined nearly 30 % and, hence, following the
continuous increase over the last years, have now dropped back to
below the level of 2001. In international comparison, the leader in
patent applications is the USA, leading by a broad margin, with
Germany rating as second highest.
P a t e n t s
Pharmaceuticals, an economic factor
1 5
rz_pharma_2009_en.qxd 02.03.2010 10:34 Uhr Seite 17

Published patent applications and patents granted concerning
pharmaceutical drugs with effect in Germany.
For patent applications for pharmaceutical drugs with biotechno-
logical reference, the number of German patent applications
amounted to 109 for the year 2008 (2007: 102, 2006: 146,
2005: 157) and, following the decreases of the previous years,
seems to stagnate at a low level. In international comparison, the
total number of applications with biotechnological reference has
risen to 1,232 for 2008 (previous year: 1,113).
Pharmaceuticals, an economic factor
1 6
2001 2002 2003 2004 2005 2006
11,000
10,000
9,000
8,000
7,000
6,000
5,000
4,000
3,000
2,000
1,000
0
9,168
10,533
11,499
8,619
9,034
Data is based on the online searchable database PAT D PA with the patent applications and/or patent
grants published in the respective year. Patent applications and/or patent grants were counted at
the German and European Patent Office. Duplicates are not counted.
Source: Illustration of the BPI based on data of the German Patent and Trademark Office 2009.
3,227
3,934 4,074
3,484 3,560
1,6641,520
1,9561,446 1,606
903 1,008 1,008744 792
10,452
3,998
1,610
970
11,425
4,078
1,380
1,029
2007 2008
Total
USA
Germany
Japan
10,919
4,069
1,662
1,050
rz_pharma_2009_en.qxd 02.03.2010 10:34 Uhr Seite 18
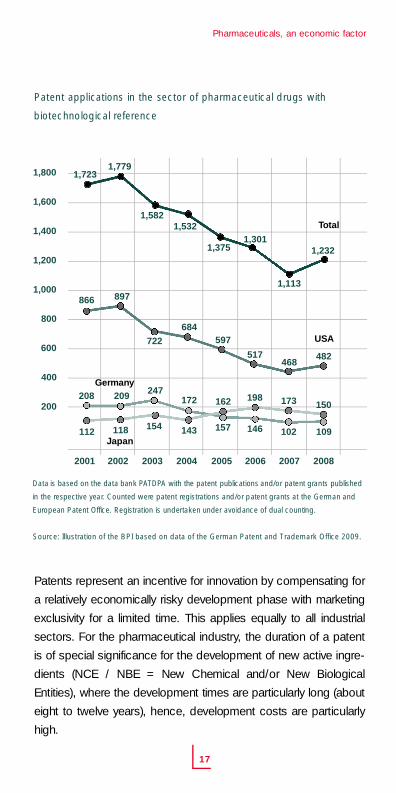
Patent applications in the sector of pharmaceutical drugs with
biotechnological re f e re n c e
Patents represent an incentive for innovation by compensating for
a relatively economically risky development phase with marketing
exclusivity for a limited time. This applies equally to all industrial
sectors. For the pharmaceutical industry, the duration of a patent
is of special significance for the development of new active ingre-
dients (NCE / NBE = New Chemical and/or New Biological
Entities), where the development times are particularly long (about
eight to twelve years), hence, development costs are particularly
high.
Pharmaceuticals, an economic factor
1 7
1,532
1,113
1,7231,779
Data is based on the data bank PAT D PA with the patent publications and/or patent grants published
in the respective year. Counted were patent registrations and/or patent grants at the German and
E u ropean Patent Office. Registration is undertaken under avoidance of dual counting.
Source: Illustration of the BPI based on data of the German Patent and Trademark Office 2009.
USA684
468
866 897
172 173208 209
143 102112 118 154
247
722
1,582
20082001 2002 2003 2004 2005 2006 2007
1,800
1,600
1,400
1,200
1,000
800
600
400
200
1,232
482
150
109
597
157
162
1,301
517
146
198
Total
Germany
Japan
1,375
rz_pharma_2009_en.qxd 02.03.2010 10:34 Uhr Seite 19
1 8
In 2003, costs for the develop-
ment of a new active ingredient
were estimated to amount to
nearly 900 million US-Dollars
(USD) and, in 2006, to almost
1.3 billion USD. These assess-
ments are based on the data
regarding the development costs for novel chemical or biological
compounds, in relation to actual newly-approved pharmaceutical
drugs. Therefore, this average value also includes costs for the very
high number of unsuccessful developments and so-called oppor-
tunity costs, i.e. the profits that one would have been able to achieve
with the capital invested during the development time. Estimates
assume that, out of 5,000 to 10,000 new substances that are
tested during the development of new pharmaceutical drugs, only
one or two will eventually hit the market as an approved product –
and even then, not every product will actually attain economic
success on the market. It is obvious that the figures listed above
are being controversially discussed in public. If you look at the pure
expenses (“out of pocket expenses”), there are still costs of a
magnitude of 540 million USD, and even critics arrive at estimates
that, for the development of new active ingredients, are somewhere
in the range of several 100 million Euros. Hence, aside from the
discussion surrounding the method of calculation, nothing changes
concerning the following core statement: the development of inno-
vative pharmaceutical drugs is a very elaborate process [Sources:
DiMasi (2003); DiMasi & Grabowski (2006)].
Often, these high costs are interpreted in such a manner as to say
that smaller companies would not stand a chance in the innovation
process since turnovers, that do not approach the billions, would
not cover the required costs. One must not overlook, however, that
significant innovations are possible at much lower cost, especially
when it is possible to fall back on known data. This concerns, for
instance, the improvement of pharmaceutical drugs through the
development of new administration forms or opening up new indi-
cations for already known active ingredients.
R e s e a rch and development of pharma-ceutical drugs
The significance of pharmaceutical drug innovations
rz_pharma_2009_en.qxd 02.03.2010 10:34 Uhr Seite 20

1 9
Z u l a s s u n g
0 5 10 15 20 25
1 - 1,5 Jahre
10 years of R&D
S o u rce: European Pharmaceutical Industries Associations (EFPIA) 2008.
2 to 3 years ofadministrativeprocedures
after 20 years Patent expiry
after 25 yearsSPC
(supplementaryprotection certificate)
max.+ 5 years
years
Ph a rm ac eu t i ca l dr ug s
Pharmaceutical companies often have less than ten years to intro-
duce a new product to the market and to recover its run-up costs,
as well as to generate the profits required for investments in R&D
and/or to compensate for any losses associated with the develop-
ments. This is often only possible if the product is introduced onto
as many international markets as possible, in the shortest time
possible.
Phases of the pharmaceutical drug re s e a rch and development pro c e s s
in the EU
This association of high development costs and brief market exclu-
sivity, compared to the proportionate costs, forces global market
launches and, hence, favors multi-national major corporations with
the respective capital power. The formation of such corporations
has been observed through countless fusions over the past years,
and the trend continues.
The significance of pharmaceutical drug innovations
rz_pharma_2009_en.qxd 02.03.2010 10:34 Uhr Seite 21

Despite all of these trends and rising development costs of phar-
maceutical companies in Europe, the number of newly introduced
innovative pharmaceutical drugs has significantly declined. The
EFPIA outlines an increase of 2.3 billion Euros to 27 billion Euros
between 1980 and 2008 (prognosis).
Innovative medical substances (New Chemical or Biological Entities -
NCE/NBE) 1989-2008, sorted by invention countries worldwide
The German pharmaceutical industry can look back on a very long
and successful tradition in developing new pharmaceutical drugs –
Germany was known for a long time as the “Pharmacy of the
World”. This international position has been lost. According to a
study by the EU, in 2005, only 6 of 140 newly-approved pharma-
ceutical drugs were developed in Germany. Therefore, it is no won-
der that the German Federal Ministry of Education and Research
[Bundesministerium für Bildung und Forschung (BMBF)], with its
“Pharmainitiative” and the “BioPharma-Competition”, has started
some initiatives that are meant to re-strengthen Germany as a phar-
maceutical location.
Today innovations are still a driving force for the successful devel-
opment of pharmaceutical companies. Hence, new active ingre-
dients, pharmaceutical forms and manufacturing processes secure
employment in Germany.
The significance of pharmaceutical drug innovations
2 0
100
0
50
1989 - 1993 1994 - 1998 1999 - 2003 2004 - 2008
93
44
62
4
89
74
53
6
62
73
28
8
E u ro p eU S A
J a p a no t h e r s
S o u rce: Illustration of the BPI based on data of the EFPIA 2008.
47
16 14
67
rz_pharma_2009_en.qxd 02.03.2010 10:34 Uhr Seite 22
Research and development in the pharmaceutical sector have the
objective of expanding options for diagnosis, for curative and/or
symptomatic treatment, for the prevention of diseases, to improve
treatment, and to close existing gaps in treatment. In the pharma-
ceutical industry, innovations are generated in a number of areas:
- > New active ingredients
Chemically-defined active ingredients,
defined natural substances,
phytopharmaceuticals, biopharmaceuticals and
analog active ingredients (molecule variants of
known active ingredients with similar chemical structure)
- > New pharmaceutical forms and new combinations of
pharmaceutical drugs
- > Expansion of indications of existing active
ingredients
-> Specific improvements of known active ingredients,
new forms of application
- > Other, novel forms of therapy
- > Improved or novel manufacturing processes of
active ingredients
Costs for R&D, testing and approval for all types of innovations are
high. Frequently, through minimal changes to the molecular struc-
ture of a substance, undesired effects can be reduced, the effica-
cy of a reduced dosage can be increased or its bioavailability
improved. Improvements in administration can increase its benefits,
facilitate application and improve dosage. As in other industries,
such as the automotive and computer industries, incremental
improvements constitute an essential component of pharmaceuti-
cal progress.
The significance of pharmaceutical drug innovations
2 1
rz_pharma_2009_en.qxd 02.03.2010 10:34 Uhr Seite 23
Novel manufacturing processes frequently contribute to products
becoming available at greater quantities, improved quality or de-
creased costs. These measures can serve to improve availability
for the patients and hence decrease costs for the health care
systems, especially when it comes to therapies that are very costly
due to elaborate production processes.
In order to optimally use all possibilities for therapeutic advance-
ment, working across multiple disciplines, cooperating, and net-
working with competent partners is imperative. Cooperation bet-
ween companies of all orders of magnitude and science are there-
fore an integral part of the development of pharmaceutical innova-
tions.
For the development to be calculable for the companies, the regu-
lations and in particular the political framework reimbursement
conditions, must be reliable. While the former in Europe is largely
regulated centrally, the refund policies are a matter of the respective
nation. Planning reliability is one of the essential bases for invest-
ment decisions in R&D. Unfortunately, the situation regarding this
aspect has not improved within the last few years in Germany, as
19 unsuccessful reform laws in the health sector since 1989 can
prove. In continuation of this development, it is hardly foreseeable
nowadays how the refund situation and the market environment for
a development that started today, would turn out once this reaches
the market in ten to twelve years. With this, however, companies
that achieve their sales volume mainly in Germany are lacking the
economic necessity for innovations.
The significance of pharmaceutical drug innovations
2 2
rz_pharma_2009_en.qxd 02.03.2010 10:34 Uhr Seite 24

Therapeutic progress is the only
thing offering advantages to
patients in comparison to already
existing therapies, (e.g. active
ingredients against diseases not treatable thus far, improved efficacy,
fewer side effects or improved application). At the time of approval,
where the relevant criteria are pharmaceutical quality, efficacy and
safety, a statement on whether a new product is better than one
already available can often not be made with validity since data
from the clinical tests alone are not sufficient for these judgments.
In medical practice, only if advantages are achieved in diagnostics
or therapy (and therefore attaining a higher degree of provable
patient benefit), does an innovation actually offer therapeutic
progress. The benefit for the patient, as well as all further clinical,
economical, and humanitarian results of health measures for the
individual, and for populations as a whole, are examined by
Outcomes Research (OR).
The significance of pharmaceutical drug innovations
2 3
rz_pharma_2009_en.qxd 02.03.2010 10:34 Uhr Seite 25

2 4
In 2008, the number of bio-engi-
neering companies remained sta-
ble when compared to the pre-
vious year of 2007. Based on figu-
res of the German bio-engineering
report 2009 by Ernst & Young, it
was 402 enterprises compared to 403 in the previous year of 2007.
The selection used by Ernst & Young is focused on pure bio-engi-
neering companies. Large corporations and companies that do not
exclusively deal with bio-engineering are explicitly not recorded.
This means that, for some years now, the number of companies has
stagnated at around 400 companies. When looking at this figure,
one needs to keep in mind that different sources use different defini-
tions when it comes to recording bio-engineering companies. Hence,
the data collection on behalf of the BMBF by biotechnologie.de,
based on a definition that encompasses the fields of industrial and
green (i.e. environmental bio-technology), represents 501 companies.
All information gathering processes, however, agree on the fact that
the number of newly founded companies had only insignificantly
recovered in 2008 with 15 or 21 (depending on the source) in
comparison to the numbers of the previous years, with only 13 in
2007 – the lowest number in years. On the other hand, in 2008 the
newly founded companies were opposed by 22 shutdowns. For
the shutdowns, the number of 14 insolvencies or wind up´s clearly
outweighed that of the eight acquisitions and/or fusions.
Number of bio-engineering companies (newly founded companiesindicated in brackets)
* Figures partly adjusted re t ro a c t i v e l y
S o u rce: Calculation of the BPI based on data of Ernst & Young AG 2007-2009.
B i o -engineering and genetic e n g i n e e r i n g
The significance of pharmaceutical drug innovations
2000 2001 2002 2003 2004 2005*200
300
400
293(59)
388(25)
386(44)
390(23)
399(39)
2006* 2007 200819991998
407(33)
408(28)
403(13)
233
402(21)
351(59)
rz_pharma_2009_en.qxd 02.03.2010 10:34 Uhr Seite 26

The process of innovation in the
pharmaceutical industry is es-
sentially driven by the progress
in life sciences. New methods
and knowledge, with regards to
the complex metabolism pro-
cesses in living cells, cell com-
pounds, organs, and living
beings, increasingly make it possible to understand the develop-
ment of illnesses in detail at the level of the molecules involved,
and to develop targeted therapies and medicines. The active
ingredients can be a matter of small, synthetically-produced
molecules (small molecules) or, equally, of biological molecules.
The latter stands out in that they are similar, or even chemically
identical, with endogenous substances. Hence, for instance,
illnesses that arise from deficiency of endogenous
substances can be treated with them. Examples would be the
administration of insulin for diabetes, Erythropoetin (EPO) for
kidney diseases or cancer. In the past, these substances had
often been elaborately isolated from body components of animals
or people, if sufficient amounts could be obtained at all.
Furthermore, at their extraction, the transmission of disease could
not always be excluded.
These restrictions were overcome by modern biotechnology and
genetic engineering. In Germany today, there are already over
130 medicines approved on a biotechnological basis, with
around 100 recombinant active ingredients that, in 2008, consti-
tuted almost 15% of turnover in the pharmacy market.
Biotechnology has therefore ceased to be a futuristic vision a long
time ago but, day-by-day, provides concrete benefit for the
patient. Insulins constitute the main share of the global market,
followed by immunomodulators, and EPO, as well as vaccines
and other hormones.
The significance of pharmaceutical drug innovations
2 5
rz_pharma_2009_en.qxd 02.03.2010 10:34 Uhr Seite 27
Other molecules are monoclonal antibodies – whose significance
keeps growing in cancer therapy, receptor molecules, enzymes and
receptor antagonists. Meanwhile, there are also first products on
DNA or RNA basis. In that case, there are a number of new therapy
approaches that can be identified, which are going to lead to a num-
ber of completely new products in the near future or in the long run.
Further fields with dynamic development are genetic therapy, tissue
engineering and the regenerative medicine that, which in connection
with the public discussion about stem cell, have particularly
generated public attention lately.
In the field of biotechnological pharmaceuticals and therapies, de-
velopment is still in its early stages. With the decoding of the human
genome, increasing understanding of the function of proteins and
peptides, and their extremely complex interactions due to systems
b i o l o g y, knowledge keeps increasing ever faster. With the aid of bio-
informatics, new techniques are developed in order to extract
essential and required information from the enormous data volumes
available. Integrating the different fields of knowledge will result in
new active ingredients, completely new mechanisms of action and
therapy approaches.
Individualized therapies are also already identifiable today, like testing
of individual pharmaceutical drug efficacy rates or side effects
through using pharmacogenomic or metabolomic examinations.
In the long run, through understanding the pathomechanisms, and
therapy methods developed on that basis, many patients with dise-
ases that are considered as uncurable at this time, will have access
to affordable therapy. Aside from this primary goal there is also the
hope of lowering therapy costs in the long run through revolutionary
new approaches that, for instance, can prevent the outbreak or
development of an illness, or that replaces the approach of pro-
viding chronic therapy of symptoms with causative healing.
The significance of pharmaceutical drug innovations
2 6
rz_pharma_2009_en.qxd 02.03.2010 10:34 Uhr Seite 28
2 7
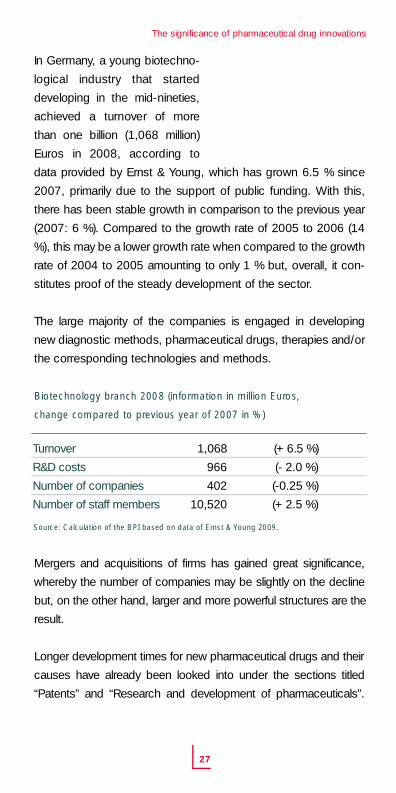
In Germany, a young biotechno-
logical industry that started
developing in the mid-nineties,
achieved a turnover of more
than one billion (1,068 million)
Euros in 2008, according to
data provided by Ernst & Young, which has grown 6.5 % since
2007, primarily due to the support of public funding. With this,
there has been stable growth in comparison to the previous year
(2007: 6 %). Compared to the growth rate of 2005 to 2006 (14
%), this may be a lower growth rate when compared to the growth
rate of 2004 to 2005 amounting to only 1 % but, overall, it con-
stitutes proof of the steady development of the sector.
The large majority of the companies is engaged in developing
new diagnostic methods, pharmaceutical drugs, therapies and/or
the corresponding technologies and methods.
Biotechnology branch 2008 (information in million Euros,
change compared to previous year of 2007 in %)
Mergers and acquisitions of firms has gained great significance,
whereby the number of companies may be slightly on the decline
but, on the other hand, larger and more powerful structures are the
result.
Longer development times for new pharmaceutical drugs and their
causes have already been looked into under the sections titled
“Patents” and “Research and development of pharmaceuticals”.
The significance of pharmaceutical drug innovations
Turnover
R&D costs
Number of companies
Number of staff members
1,068 (+ 6.5 %)
966 (- 2.0 %)
402 (-0.25 %)
10,520 (+ 2.5 %)
S o u rce: Calculation of the BPI based on data of Ernst & Young 2009.
rz_pharma_2009_en.qxd 02.03.2010 10:34 Uhr Seite 29

Therefore, it is not surprising that the German biotechnology com-
panies, in terms of development of their own approved, ready-to-
market products , are lagging behind the USA – where biotechno-
logy has developed much sooner. In the USA, companies that
undertake research and development by using biotechnological
methods have had more approvals since 2003 on an annual basis
than the classical large pharmaceutical companies (source: Ernst &
Young Global Biotech-Report 2009).
In 2008, the biotechnology sector in Germany achieved an essen-
tial breakthrough with the approval of three pharmaceutical drugs
that hit the market: With Firazyr (Icatibant, Jerini/Shire), Oracea
(Medigene) and the biosimilar Filgrastim (G-CSF, Merckle Biotec).
Another five were in the registration stage. In 2007, one biosimilar
was approved (EPO), six further candidates were in the approval
stages (2006: two candidates).
Of the five candidates still in the approval stage by 2008, one pro-
duct received approval in April 2009: Removab (Catumaxomab,
Fresenius Biotech) for the treatment of malignant ascites. This is the
first worldwide tri-functional antibody, an innovation developed in
Germany in cooperation with TRION-Pharma. Two further applica-
tions for approval are being processed, two were withdrawn.
In 2008, 308 active ingredients were in the development pipeline, a
value that has remained nearly constant in comparison to the pre-
vious year. The development progress is reflected in the repeated
increase in the number of active ingredients that are in the clinical
trial stage (phase I – III): In phase I, from 124 in 2006 to 129 in 2007
to 139 in 2008. In phases II and III, an increase was also noted,
although to a lesser extent than the previous year (2007). The
growth rates still did not match those of 2004 and 2005.
The significance of pharmaceutical drug innovations
2 8
rz_pharma_2009_en.qxd 02.03.2010 10:34 Uhr Seite 30

2 9
Owing to this successful development, biotechnology companies
become more interesting for purchase, as proven by the takeover
of the Jerini AG by Shire Ltd. (GB) or of the U3-Pharma AG by
Daiichi Sankyo Co., Ltd.
Until now, this has been reserved for companies that focused on
products that were faster to market, such as diagnostics, tissue-
engineering and the provision of services, whereby Germany alre-
ady has a leadership role in those fields that are of future impor-
tance. Interestingly enough, companies with that focus, for instan-
ce Quiagen or Miltenyi Biotec, are strategically and increasingly
focused on the development of their own products for the diagno-
stics or pharmaceutical markets.
Aside from this, new perspectives are opening up in the field of
“biosimilars”. This term denotes biological active ingredients that hit
the market as an imitation preparation, once the patent protection
of the original preparation has elapsed. Note the use of the word
biosimilars, as biological molecules present minor variants, hence,
are not fully identical. For this reason, the cost for testing and
approval of biosimilars is significantly higher than for other generics,
and the price decline to be expected is less than for classical phar-
maceuticals. In 2006, the European Medicines Agency (EMEA)
granted the first approvals for biosimilars for the European market.
In the middle of 2007 a real milestone was set in this product
segment with the approval of EPO, which was developed and
produced in Germany, since this was the first biotechnologically
produced biosimilar product with an expected real potentially great
marketing volume.
Altogether, based on the products already launched on the market
or products already far advanced in their development, and also
products constantly moving up from base research, excellent future
perspectives for medical bioengineering are opening up. A require-
ment for this is a predictable and stable health care system. This
especially applies to reimbursement policies.
The significance of pharmaceutical drug innovations
rz_pharma_2009_en.qxd 02.03.2010 10:34 Uhr Seite 31

3 0
Pharmacovigilance is a compre-
hensive term that encompasses
all measures in order to recogni-
ze side effects of a given phar-
maceutical therapy and to avoid
incorrect use of pharmaceutical
d r u g s .
In general, each effective phar-
maceutical drug can also pre-
sent with undesired effects. These, however, usually only occur
in a few percent of patients, often only in one of 100,000 patients
or less.
The risk assessment of a given pharmaceutical drug in the popu-
lation at large is the subject of pharmacoepidemiology. It is
generally considered to be the base science for the safety of
pharmaceutical drugs. The objective here is to identify the
causative connections between exposure and efficacy, if possi-
ble to prophylactically exclude undesired pharmaceutical effects
and to increase the therapeutic benefit.
The Paul-Ehrlich-Institute (PEI) is the responsible national compe-
tent authority for vaccines, blood preparations and sera. For all
other medicines, it is the Federal Institute for Drugs and Medical
Devices (BfArM).The EMEA is responsible for process implemen-
tation on the European level, and issues recommendations,
which are then implemented through decisions of the European
Commission in a legally-binding manner in all member states.
Continuous monitoring of the safety of p h a r m a c e u t i -cal drugs / p h a r m a c o v i -g i l a n c e
P h a r m a c o v i g i l a n c e
rz_pharma_2009_en.qxd 02.03.2010 10:34 Uhr Seite 32

Data about side effects reported in
the context of clinical trials, mean-
ing under ideal conditions, is not
v e ry representative of daily prac-
tice. On one hand, the required
inclusion and exclusion criteria
result in limited interpretation
capacity; on the other hand, the
frequency of undesired effects of
pharmaceutical drugs is rather low
in controlled clinical trials with
patient groups when compared to
the later prescription figures.
Hence, side effects that, e.g., only occur with certain concomitant
diseases, or with concurrent administration of certain other medi-
cines, cannot be identified in clinical trials.
Monitoring of pharmaceutical drugs under conditions of daily life,
meaning after approval, is of highest significance for the safety of
pharmaceuticals, and thus for the quality assurance of therapy.
The pharmaceutical corporations are legally obligated to actively col-
lect information concerning side effects and interactions with other
pharmaceutical drugs, contraindications and quality defects about
their respective pharmaceutical drugs, to assess the same, and to
notify the respective authorities of the same. Severe side effects
must even be immediately reported to the regulatory authorities of the
member states and the EMEA, respectively, which is located in
London. The obligation to notify encompasses all side effects that are
reported, both nationally and in other EU member states, but also in
countries outside of Europe. The BPI, however, is also involved in the
constant information exchange between the pharmaceutical compa-
nies and the regulatory authorities.
P h a r m a c o v i g i l a n c e
3 1
Identification of side eff e c t sin clinical t r i a l s
rz_pharma_2009_en.qxd 02.03.2010 10:34 Uhr Seite 33

3 2
In order to comply with this
r e g u l a t o ry requirement the
pharmaceutical companies are
required to designate a person
in charge of pharmacovigilance
– and / or as per German law,
to employ a so-called “Stufen-
planbeauftragter”. Their task is
to gather any known reports
about the risks involving phar-
maceutical drugs, to assess
them and to coordinate the
required measures. This per-
son is individually liable for his
work. At a national level, the
so-called “Stufenplan” [as per § 63 German Medicines Act
(AMG)] serves for observation, gathering and interpretation of
risks involving pharmaceutical drugs.
If it turns out that additional measures are required to ensure
the safety of patients, and that these measures are sensible or
n e c e s s a ry, then these will be immediately implemented. This is
most often done independently by the pharmaceutical company,
p a r t i a l l y, however, also through requirements of the national
competent authorities or the European authorities. The
“Stufenplanverfahren” outlined in the AMG regulates what type
of measures the manufacturer of pharmaceutical drugs needs
to initiate in order to increase the patients’ safety. This may
range from changing the patient information leaflet all the way
to a recall of the pharmaceutical drug. In recent times, many
pharmaceutical drug safety procedures, so-called referrals,
have not been implemented nationally anymore, but at the EU-
level coordinated by the EMEA.
P h a r m a c o v i g i l a n c e
rz_pharma_2009_en.qxd 02.03.2010 10:34 Uhr Seite 34

According to reports of the
BfArM, in 2008, the authority
received about 46,400 case
reports from Germany, most of
them from pharmaceutical
companies, and almost two-
thirds of the rest from drug
commissions of the health
care professions. Only about
4 % of reports are still in hard
c o p y. The increase in the
number of literature reports is
based on the well-established
literature search systems of the pharmaceutical companies. The
predominant number of reports, owing to the currently valid duties
to notify as per § 63b of the AMG, concerns suspected cases
from abroad and here, especially suspected cases from outside
the EU.
About two-thirds of the reports of the PEI that, altogether, just as
in all the other years, recorded clearly less cases for 2008 than
the BfArM, are based on reports concerning vaccination compli-
cations. These are undertaken according to the infection protec-
tion law (Gesetz zur Verhütung und Bekämpfung von Infektions-
krankheiten beim Menschen – IfSG; law for the prevention and
fighting of infectious disease in humans). Some 30 % of cases
concern monoclonal antibodies and about 10 % cellular blood
p r o d u c t s .
The general increase can be attributed to improved reporting
tools for the reporting of UAW data (e. g via Internet).
P h a r m a c o v i g i l a n c e
3 3
Reports of side eff e c t s
rz_pharma_2009_en.qxd 02.03.2010 10:34 Uhr Seite 35

3 4
In the field of pharmaceutical
drug safety (pharmacovigilan-
ce), the swift exchange of infor-
mation between the individual
competent authorities of the EU
member states is of important
significance. For that reason,
the EU has created graduated
information systems where,
depending on urgency, the
respective required procedures
are applied. A so-called Rapid
Alert System concerning phar-
macovigilance is always initia-
ted whenever one of the mem-
ber states identifies a suspec-
ted change of the benefit-risk
ratio of a given pharmaceutical
drug to an extent that might
require greater changes to the
approval status.
Both German national compe-
tent authorities closely cooperate with the local state authori-
ties, and with those of other European nations. There are also
close relations with authorities of states outside Europe, the
World Health Organization (WHO), the pharmaceutical drug
commissions of the health care professions, as well as with
individual centers that collect reports of special side effects.
P h a r m a c o v i g i l a n c e
EU-wide exchange of safety data
rz_pharma_2009_en.qxd 02.03.2010 10:34 Uhr Seite 36

The “Rote Hand Brief” is an
instrument of information that is
used in medical expert groups
for important information con-
cerning newly identified, signifi-
cant risks concerning the use
and administration of pharma-
ceutical drugs and measures
for their minimisation.
The Pharma codic of the manufacturer associations BPI and VFA
(AKG – Arzneimittel und Kooperation im Gesundheitswesen [phar-
maceuticals and cooperation in the health care sector] and FSA –
Freiwillige Selbstkontrolle Arzneimittelindustrie [voluntary auto-moni-
toring of the pharmaceutical industry]) obligate their members to
send out important, and spread such information, concerning phar-
maceutical drug safety in coordination with the national competent
a u t h o r i t i e s and such warnings to expert circles, i.e. to physicians,
and to the drug commissions of the German Medical association
and the German Pharmacists, respectively.
The members of the associations are obliged to use, on envelopes
as well as on letters, the symbol of a red hand with the wording
“Important information concerning a pharmaceutical drug” for
reports about newly identified, severe side effects, recalls of faulty
batches or other information
that needs to reach the physi-
cian and/or pharmacist in the
fastest possible way in order to
secure patient safety.
This is to warrant that important
information cannot be over-
looked amidst the daily mail
load.
P h a r m a c o v i g i l a n c e
3 5
“Rote Hand Brief” for i n f o r m i n gthe expert
rz_pharma_2009_en.qxd 02.03.2010 10:34 Uhr Seite 37

In 2008, the worldwide turnover of
pharmaceutical drugs reached a
total of 773.2 billion USD. Compa-
red to the previous year, that trans-
lates to an increase of 8.2 %.
Development of the global pharmaceutical market
80 % of the total turnover on the global pharmaceutical market is
covered by North America, Europe and Japan. The turnover in
North America has risen by 1.7 % to make 309.7 billion USD.
With this, it constitutes 40 % of the global pharmaceutical market
turnover for 2008. The pharmaceutical market in Europe grew by
10.5 % to 235.5 billion USD. In 2008, Latin America increased its
turnover by 15.3 % to make 49.1 billion USD, something that,
once more constitutes a notable improvement since turnover in
2002 was still at 21.1 billion USD.
Top 10 pharmaceutical markets worldwide and growth to LCD* (in %)
The global p h a r m a c e u t i -cal market
The pharmaceutical industry in its international context
3 6
2 0 0 4
5 5 9 . 9
2 0 0 5
6 0 3 . 7
+ 7.8
2 0 0 6
6 4 6 . 6
+ 7.1
2 0 0 7
7 1 4 . 7
+ 10.5
2 0 0 8
7 7 3 . 2
+ 8.2
Total market (billion USD)
Change compared to previous year (in %)
S o u rce: Illustration of the BPI based on data of IMS World Review 2009.
Turnover 2008(million US-Dollars)
2 9 0 , 9 8 07 7 , 0 4 14 2 , 2 0 04 1 , 2 9 12 6 , 6 4 42 4 , 5 4 32 2 , 3 2 32 0 , 9 6 61 9 , 1 8 11 8 , 7 2 3
Growth to LCD 2008 (%)
13254
2 738
1 26
L a n d
U S AJ a p a nF r a n c eG e r m a n yI t a l yC h i n aGreat BritainS p a i nB r a z i lC a n a d a
* LCD: Local currency dollar – currency fluctuations in the country are not considered, so the
g rowth rate in the various countries is thus comparable.
S o u rce: Illustration of the BPI based on data of IMS World Review 2009.
rz_pharma_2009_en.qxd 02.03.2010 10:34 Uhr Seite 38

3 7
World pharmaceutical market according to regions, 2008
A l t o g e t h e r, the health care market is a growth market with
considerable employment potential. To date, many diseases are
unresponsive to therapy; life expectancy of people is on the rise
and the changed consumer interest, as well as the search for
more quality of life, increases demand for health-related serv i c e s
and products. Furthermore, advances in the fields of medicine
and pharmacy, particularly in molecular and cellular biology,
principally generate novel innovation incentives. Further, an indivi-
dualization tendency in the fields of diagnostics and therapy of
disease can be identified.
The pharmaceutical industry in its international context
100
150
200
250
0
50
Tu rnover 2008in billion USD
G rowth compared to p revious year in %
S o u rce: Illustration of the BPI based on data of IMS World Review 2009.
309.7
+1.7
235.5
77.0
49.1
NorthAmerica
EU Japan Asia,Africa,
Australia
LatinAmerica
101.9
+10.5+17.2 +16.7 +15.3
rz_pharma_2009_en.qxd 02.03.2010 10:34 Uhr Seite 39

C u r r e n t l y, the EU includes 27
member states.
A detailed depiction of these
pharmaceutical markets, on
one hand, represents a
heterogeneous image of the
market size and, on the other
hand, steady growth of the
individual markets. In the
various EU member states,
pricing and reimbursement of
pharmaceuticals are regulated in a different manner. One
common factor, however, is increasing competition in the
generic area.
An analysis of turnovers in 2008 for the EU-15 in absolute
terms shows, that France, Germany, Italy, followed by Great
Britain, represent the largest pharmaceuticals markets. When
comparing growth rates of the previous year of 2007, however,
Greece is first, followed by Ireland, Denmark and Spain.
The Euro p e a np h a r m a c e u t i -cal market
The pharmaceutical industry in its international context
3 8
rz_pharma_2009_en.qxd 02.03.2010 10:34 Uhr Seite 40

Pharmaceutical markets of the EU-15
Due to the special economical relations, the following selected
Central and Eastern European nations are to be looked at in
detail.
E U - m e m b e r s
F r a n c e
G e r m a n y
I t a l y
Great Britain
S p a i n
G r e e c e
B e l g i u m
The Netherlands
P o r t u g a l
S w e d e n
A u s t r i a
F i n l a n d
D e n m a r k
I r e l a n d
L u x e m b o u r g
To t a l
Turnover* for 2008
(million USD)
4 2 , 2 0 0
4 1 , 2 9 1
2 6 , 6 4 4
2 2 , 3 2 3
2 0 , 9 6 6
7 , 5 2 0
6 , 3 5 3
5 , 9 1 7
5 , 3 4 4
4 , 3 2 7
4 , 2 9 4
2 , 7 5 5
2 , 7 2 3
2 , 5 6 1
2 4 5
1 9 5 , 4 6 3
Growth** to
LCD 2008 (%)
2 . 0
5 . 0
4 . 0
3 . 0
8 . 0
1 0 . 0
6 . 0
- 4 . 0
4 . 0
5 . 0
7 . 0
7 . 0
8 . 0
9 . 0
7 . 0
6 . 0
* Tu rnovers from the markets observed, plus estimation of partial markets not observed, re s u l t
in the total turnover of a nation at ex-factory price.
** LCD: Local currency dollar - currency fluctuations in the country are not considered, so the
g rowth rate in the various nations is thus comparable.
S o u rce: Illustration of the BPI based on data of IMS Health 2009.
The pharmaceutical industry in its international context
3 9
rz_pharma_2009_en.qxd 02.03.2010 10:34 Uhr Seite 41
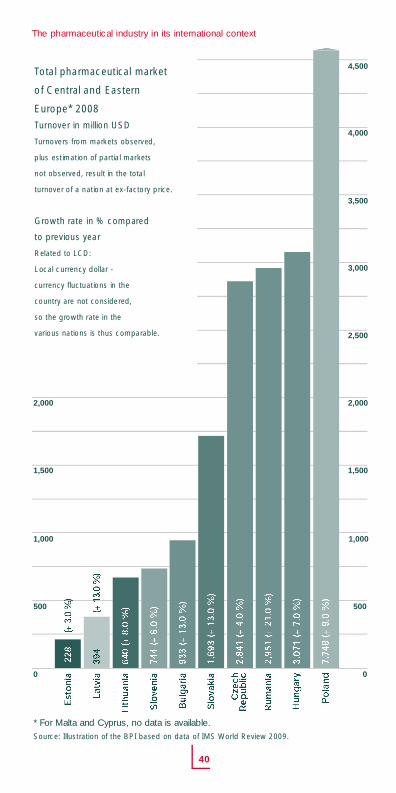
4 0
The pharmaceutical industry in its international context
1,000
1,500
2,000
Total pharmaceutical market
of Central and Eastern
E u rope* 2008
Tu rnover in million USD
Tu rnovers from markets observed,
plus estimation of partial markets
not observed, result in the total
t u rnover of a nation at ex-factory price.
G rowth rate in % compared
to previous year
Related to LCD:
Local currency dollar -
c u r rency fluctuations in the
country are not considered,
so the growth rate in the
various nations is thus comparable.
* For Malta and Cyprus, no data is available.
S o u rce: Illustration of the BPI based on data of IMS World Review 2009.
0
1,000
500 500
1,500
2,000
2,500
3,000
3,500
4,000
4,500
0
rz_pharma_2009_en.qxd 02.03.2010 10:34 Uhr Seite 42

IMS Health expects, for a five-
year period, an average annual
growth of the European member
states of 3.9 %. In comparison,
growth prognosis for the non-
European member states is
9.1 %. The most significant f i v e
EU pharmaceutical markets a r e
to grow by 3.1 %.
Market prognosis while using constant exchange rates, growth in %,
ex-factory price
E u r o p e
EU-members
N o n - E U - n a t i o n s
EU top five nations
Global market
2008 - 2013
3.9 %
9.1 %
3.1 %
4.4 %
Source: Illustration of the BPI based on data of IMS Market Prognosis Global 2009.
The pharmaceutical industry in its international context
4 1
rz_pharma_2009_en.qxd 02.03.2010 10:34 Uhr Seite 43

A given pharmaceutical drug is
differently priced in the various
nations for the simple reason of
different Value Added Tax (VAT)
rates. Further influences on the
prices of pharmaceutical drugs,
are partially governmental inter-
ventions, as well as different by
law margins for the various trade levels (pharmacist and wholesaler).
This accounts for the price differences within Europe. When it
comes to international pharmaceutical price comparisons, one
needs to consider that these can only be undertaken at the level of
the trade types. When selecting, for instance, the leading trade
types in Germany, one needs to verify whether these are also
leading in other nations and/or have a sufficient market share there.
Further, not all nations have data available on the basis of manu-
facturer´s prices, meaning that the prices may need to be con-
verted. Albeit, the political framework (reimbursement and pricing
system), as well as therapy practice, have an impact on the prices
of pharmaceutical drugs. When undertaking overall market compari-
sons, quantity adjustments are necessary.
Pharmaceutical price structure in Europe (2007)
- Based on pharmacy retail price
I n t e rnational comparison of pharma-ceutical drug p r i c e s
The pharmaceutical industry in its international context
4 2
M a n u f a c t u re r
W h o l e s a l e r
P h a r m a c y
Ta x e s
6.50 %
20.90 %
64.20 %
8.40 %
These values constitute a non-weighed mean value for Europe.
S o u rce: Illustration of the BPI based on EFPIA 2009.
rz_pharma_2009_en.qxd 02.03.2010 10:34 Uhr Seite 44
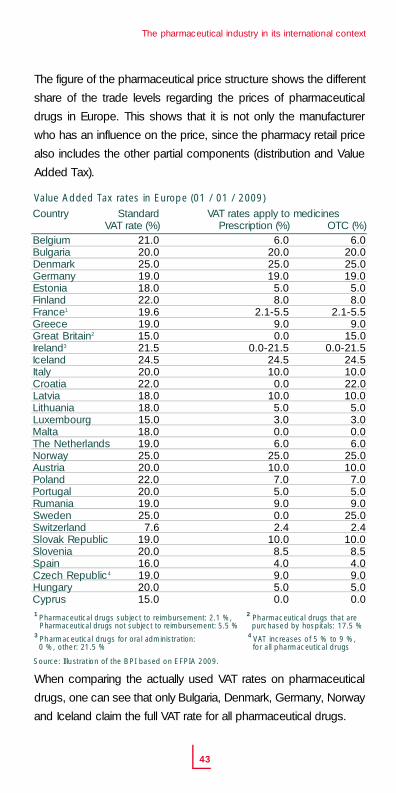
The figure of the pharmaceutical price structure shows the different
share of the trade levels regarding the prices of pharmaceutical
drugs in Europe. This shows that it is not only the manufacturer
who has an influence on the price, since the pharmacy retail price
also includes the other partial components (distribution and Value
Added Tax).
Value Added Tax rates in Europe (01 / 01 / 2009)
1 Pharmaceutical drugs subject to reimbursement: 2.1 %, 2 Pharmaceutical drugs that are Pharmaceutical drugs not subject to reimbursement: 5.5 % p u rchased by hospitals: 17.5 %
3 Pharmaceutical drugs for oral administration: 4 VAT increases of 5 % to 9 %, 0 %, other: 21.5 % for all pharmaceutical drugs
When comparing the actually used VAT rates on pharmaceutical
drugs, one can see that only Bulgaria, Denmark, Germany, Norway
and Iceland claim the full VAT rate for all pharmaceutical drugs.
The pharmaceutical industry in its international context
4 3
S t a n d a r dVAT rate (%)
2 1 . 02 0 . 02 5 . 01 9 . 01 8 . 02 2 . 01 9 . 61 9 . 01 5 . 02 1 . 52 4 . 52 0 . 02 2 . 01 8 . 01 8 . 01 5 . 01 8 . 01 9 . 02 5 . 02 0 . 02 2 . 02 0 . 01 9 . 02 5 . 0
7 . 61 9 . 02 0 . 01 6 . 01 9 . 02 0 . 01 5 . 0
VAT rates apply to medicinesOTC (%)
6 . 02 0 . 02 5 . 01 9 . 0
5 . 08 . 0
2 . 1 - 5 . 59 . 0
1 5 . 00 . 0 - 2 1 . 5
2 4 . 51 0 . 02 2 . 01 0 . 0
5 . 03 . 00 . 06 . 0
2 5 . 01 0 . 0
7 . 05 . 09 . 0
2 5 . 02 . 4
1 0 . 08 . 54 . 09 . 05 . 00 . 0
S o u rce: Illustration of the BPI based on EFPIA 2009.
C o u n t ry
B e l g i u mB u l g a r i aD e n m a r kG e r m a n yE s t o n i aF i n l a n dF r a n c e1
G r e e c eGreat Britain2
I r e l a n d3
I c e l a n dI t a l yC r o a t i aL a t v i aL i t h u a n i aL u x e m b o u r gM a l t aThe NetherlandsN o r w a yA u s t r i aP o l a n dP o r t u g a lR u m a n i aS w e d e nS w i t z e r l a n dSlovak RepublicS l o v e n i aS p a i nCzech Republic4
H u n g a ryC y p r u s
Prescription (%)6 . 0
2 0 . 02 5 . 01 9 . 0
5 . 08 . 0
2 . 1 - 5 . 59 . 00 . 0
0 . 0 - 2 1 . 52 4 . 51 0 . 0
0 . 01 0 . 05 . 03 . 00 . 06 . 0
2 5 . 01 0 . 07 . 05 . 09 . 00 . 02 . 4
1 0 . 08 . 54 . 09 . 05 . 00 . 0
rz_pharma_2009_en.qxd 02.03.2010 10:34 Uhr Seite 45

When analyzing expenditure
quotas, it should be taken into
considerat ion that the sole
comparison does not allow for
a conclusive statement, parti-
cularly in an international
health care system compari-
son. A more in-depth look is
required, for instance, into
organizational structures, societal circumstances and/or the
overall framework. In the end, the share of the gross dome-
stic product (GDP) reflects the position that society grants to
the health sector. Hence, a large GDP share must not be
considered as wastefulness.
Development of health care expenditures -
s h a re of the GDP in %
The health c a re systemin Germany
The pharmaceutical industry as part of the German health care system
4 4
19991998 2000 2001 2002 2003 2004 2005 20061997
S o u rce: Illustration of the BPI based on data of the Federal Statistical Office 2009.
10.510.210.2 10.3 10.4 10.6 10.8
2007
10.410.3 10.6 10.7%
11
10
9
8
7
6
5
4
3
2
1
0
rz_pharma_2009_en.qxd 02.03.2010 10:34 Uhr Seite 46

The share of health care expenditures of the GDP has remained
stable in Germany over the course of the years. In 1997, it was
at 10.2 % and in 2007, at 10.4 %.
Development of nominal health care expenditures (in billion Euro s )
Nominal health care expenditures in Germany have been conti-
nually on the rise since 1997 and, by 2007, were at 252.8 billion
Euros. This means an increase of 3.2 % compared to 2006. In
the same period, health costs per inhabitant rose by 3.4 %, from
2,970 Euros in 2006 to 3,070 Euros in 2007.
The pharmaceutical industry as part of the German health care system
4 5
19991998 2000 2001 2002 2003 2004 2005 2006 20071997
S o u rce: Illustration of the BPI based on data of the Federal Statistical Office 2009.
245.0
201.1
212.3
220.5
227.9233.6
252.8
207.1
234.0239.4
250
240
230
220
210
200
190
180
170
160
196.0
rz_pharma_2009_en.qxd 02.03.2010 10:34 Uhr Seite 47

Development of health care expenditures per inhabitant (in Euro s )
According to current information provided by the Federal
Statistical Office, a total of 4.4 million people, which transla-
tes to about 1 out of 10 job holders, were employed in the
health care sector by the end of 2007. In 2007, the number
of jobs within the health care sector rose 1.5 % when com-
pared to the previous year of 2006. The primary cause of this
is an increase in the health service professions (e. g. nursing
profession) and social professions (e.g. geriatric care taker).
In 2007, the largest number of staff (84 %), was employed in
outpatient, inpatient and day-patient care health care facili-
ties.
The pharmaceutical industry as part of the German health care system
4 6
19991998 2000 2001 2002 2003 2004 2005 2006 20071997
S o u rce: Illustration of the BPI based on data of the Federal Statistical Office 2009.
3,000
2,900
2,800
2,700
2,600
2,500
2,400
2,300
2,200
2,100
2,000
2,970
2,450
2,390
2,580
2,6802,760
2,830
3,070
2,520
2,8402,900
rz_pharma_2009_en.qxd 02.03.2010 10:34 Uhr Seite 48

In an ageing society like
G e r m a n y, with a structural shift
toward older, multi-morbid
people, and increasing chronic
diseases owing to lifestyle and
nutritional habits, the health
care service sector is forced
to find sustainable solutions. In
this, the potentials of a strong,
innovative job-intensive health
care sector are supposed to
be strengthened, not weakened.
Health care policy interventions over the last years display a
tendency toward encouraging competition between partici-
pants, and toward integrative health care solutions. A financially
sustainable health service care system in Germany, however,
still seems to be a distant prospect.
Due to continually rising contributions to the Statutory Health
Insurance (SHI), the development of SHI expenses is of great
interest each year. For many years, SHI expenditures, as a
share of the GDP, have been at approximately 6 % (2008: 6.5 %),
and those of pharmaceutical expenditures reached a share of
the GDP at 1.4 % (2008: 1.2 %), thus the situation can be
described as rather constant. Therefore the expenditures
associated with pharmaceuticals at the expense of the SHI
have not increased any faster than the macroeconomic per-
formance. In view of this development, there is no indication
for a “cost explosion” in the health care sector.
The pharmaceutical industry as part of the German health care system
4 7
rz_pharma_2009_en.qxd 02.03.2010 10:34 Uhr Seite 49

The financial situation of the SHI is influenced by structural pro-
blems, i.e. developments on both, the revenues, as well as
expenditures.
When it comes to revenues, the following factors may have a
negative impact:
- > Increase of the so-called mini-jobs (marginal employment)
- > Abolition of income liable to social insurance deductions
- > Loss of earned income subject to social security
- > Stagnating earned income
- > Pure salary receipt with simultaneous increase of other sources of income
- > Shift toward private health insurance
- > Decrease of health care insurance contributions for the recipients of unemployment benefits
On the expenditure side, there is a need to act owing to:
-> Costs due to the introduction of an electronic health care chip card
- > Expansion of the SHI benefits, e. g. palliative care
- > Implementation of the European guidelines on working hours
- > Increase in the number of chronic diseases
- > Medical-technological progress in connection with the shifting of the ageing population structure
- > Value Added Tax increase to 19% from January 1s t, 2007
- > Hospital tariff contracts
- > Remuneration reform for physicians in outpatient care
The pharmaceutical industry as part of the German health care system
4 8
rz_pharma_2009_en.qxd 02.03.2010 10:34 Uhr Seite 50

In Germany we have wage-
based contributions to SHI, the-
refore the development of the
number of employees is of parti-
cular interest.
While the German Economic Optimization of Pharmaceutical
Care Act (Arzneimittelversorgungs-Wi r t s c h a f t l i c h k e i t s g e s e t z ) ,
introduced in 2006, mainly focused on cost reduction for phar-
maceutical expenditures, the German Act to Reinforce
Competition between the German Statutory Health Insurances
( G K V- We t t b e w e r b s s t ä r k u n g sgesetz) in 2007 aimed to foster
competition in the health sector.
The German Act to Reinforce Competition between the German
S t a t u t o ry Health Insurances also initiated structural changes.
The benefits offered by instances allowed more differentiation of
the insurances through introducing optional rates. In terms of
content, most optional rates are oriented either on reimburse-
ment of costs or on deductibles. Only one optional rate allows
for reimbursement of pharmaceutical drugs for special therapy
approaches, but in combination with a higher premium. While
this may be a first step in the right direction, more options are
desirable such as reimbursement of so-called OTCs. That
would be the start of real competition between the health insu-
rance providers. The insured person could be reinforced in his
or her capacity as a client, and have the opportunity to com-
plement his or her standard service package with an individua-
lized service package by several service choice components.
The pharmaceutical industry as part of the German health care system
4 9
rz_pharma_2009_en.qxd 02.03.2010 10:34 Uhr Seite 51

The mentioned act offers the Statutory Health Insurance pro-
viders further options for shifting the collective-contractual
agreements in favor of selective contracting. With the intro-
duction of optional rates and rebate contracts, the Statutory
Health Insurance providers increasingly change from “payer”
to “player”. As a result, this leads to a differentiation between
the offers. Inevitably, this leads to questions regarding cartel
and competition, and the entrepreneurial activities of the SHI
come into focus. In order to ensure fair market competition the
law must, consequently, lead to uniform competition condi-
tions for all stakeholders. Partial opening and application of §§
19-21 of the German Act against restraints of Competition
(Gesetz gegen Wettbewerbsbeschränkungen) is not enough.
In January 2009, a health care fund was introduced as a com-
promise of the political concepts of “citizen insurance”, and
“citizen capitation fee”. From the BPI’s point of view, that does
not constitute a solution to the problem of financing a sustai-
nable health care system. The amount of the standard pre-
mium, in association with the risk structure compensation
scheme, which is newly oriented towards morbidity, will lead
to the following: due to mergers, more and more of the almost
190 currently existing SHIs will cease to exist. This dynamics
can be accelerated if additional premiums are asked for.
In the opinion of the pharmaceutical industry, the insured person
should, with the combination of income-dependent premiums
and flat-rate premiums in the funds, be able to control the
premium in such a manner as to finance an individual insurance
package as per his or her own desires.
The pharmaceutical industry as part of the German health care system
5 0
rz_pharma_2009_en.qxd 02.03.2010 10:34 Uhr Seite 52

From the view of the industry, a
first step toward a fundamental
and f inancially sustainable
reform of the SHI system would
be freezing the employer’s
contribution and turning it into salary. In this manner, on one
hand, health care costs and salary costs are separated. On
the other hand, the individual is able to fully decide on the
amount of premiums paid, and use the money in order to create
an individual insurance package. In this manner, the insured
person accepts more responsibili ty, without becoming
financially overwhelmed.
In the course of further reforms, the increased tendency
toward standardizing of therapies needs to be stopped. At
a time when the pharmaceutical industry is ever more
strongly capable of developing pharmaceutical therapy
options in a patient-individualized manner and to apply
them in medical practice, the manifold therapy options
must not be restricted to sheer cost reduction measures,
e.g. through therapy advice or exclusions, by the self-
government of health insurance funds.
Future health care reforms must contribute to deregulation
and streamlining of administration in favor of increased
responsibility of the individual, and freedom of choice for
the stakeholders concerned. It must be the goal that the
patients wi ll, once again, benefit from the greatest possible
s e rvice provided by service providers in the health care
s e c t o r.
The pharmaceutical industry as part of the German health care system
5 1
rz_pharma_2009_en.qxd 02.03.2010 10:34 Uhr Seite 53

According to the view of the
expert panel, the goal of cost
l i m itation is always a “tightrope
walk between withdrawal effects
that cause increasing premiums, primarily outside the health sector
for consumers and investors, and the positive effects that are
generated by health costs and the services financed by them”
(expert opinion furnished in 2003).
Cost structure of the Statutory Health Insurance (SHI)
2008 (in billion Euros and in % of all SHI-costs)
Cost structureof Statutory Health Insurance ( S H I )
The pharmaceutical industry as part of the German health care system
5 2
S o u rce: Illustration of the BPI based on KJ1 2009.
Treatment by physician
24.28 billion = 15.10 %
Dental t reatment without tooth re p l a c e m e n t8.07 billion = 5.02%
Hospital care52.57 billion = 32.70 %
Sick pay6.56 billion = 4.08 %
Pharmaceutical d r u g s
29.23 billion 18.20 %
verteilt auf:
P re g n a n c y /m a t e rn i t y
1.49 billion =0.93 %
N e ta d m i n i s t r a t i o n
e x p e n s e s8.29 billion =
5.15 %
Tooth replacement 2.92 billion = 1.82 %
Medical aids and appliances4.91 billion = 3.05 %
Other expenses22.44 billion = 13.95 %
3.7 % W h o l e s a l e r14.6 % Ta x13.9 % P h a r m a c i e s1
9.2 % L e g a ld e d u c t i o n s
58.6 % P h a r m a c e u t i c a lm a n u f a c t u re r s2
1 Without legal deductions2 The manufacturers account for 58.6 % of
pharmaceutical expenditures amounting to 29.23 billion E u ros. This means 17.2 billion Euros, which is 10.7 % of total the SHI costs.
To t a l160.76 billion
rz_pharma_2009_en.qxd 02.03.2010 10:34 Uhr Seite 54

Inpatient care, at 52.57 billion Euros, is the most cost-intense
sector of the SHI system. The expenditures for pharmaceutical
drugs (29.23 billion Euros) and for medical treatment (24.28 billion
Euros), combined, amount to 53.51 billion Euros. To g e t h e r, that
nearly accounts for the overall expenditures of the inpatient care
s e c t o r. The share of pharmaceuticals expenditures alone was at
18.2 % of the total SHI costs.
During the analysis of the SHI pharmaceuticals expenditures, the
share of the trade levels is often neglected, i.e. the proportion of
the wholesalers’ and pharmacies’ margins, and the Value Added
Tax. If a given pharmaceutical drug at manufacturer price costs
one Euro, on average, one needs to add on a 6 % wholesaler
margin, 3 % plus 8.10 Euros of the pharmacy margin, as well as
19 % Value Added Tax. The retail price would total just about
11 Euros.
Irrespective of this, rising pharmaceutical expenditures, as well as
falling point values of medical treatment, are predominantly caused
by the increase of outpatient therapy options, as well as a patient
shift from the inpatient to the outpatient care sector. The
Diagnosis Related Groups (DRGs) and the related shorter stay
times in hospitals are going to reinforce this tendency even more
in the years to come. For now, however, as in the past, the shift
of services is not followed by the required financial volume.
In public, too little attention is paid to the fact that manufacturers
as well as the pharmacists need to provide an obligatory discount
for the stabilization of the SHI expenditures, as shown below.
The pharmaceutical industry as part of the German health care system
5 3
rz_pharma_2009_en.qxd 02.03.2010 10:34 Uhr Seite 55

16 %manufacturer discount for off-patent pre s c r i p t i o n
drugs with the same activei n g redient without
re f e rence price
Statutory Health Insurance
SHI obligatory discounts***
The cutback of the obligatory discount for the pharmaceutical indu-
s t ry, from 16 % to 6 % at the beginning of 2005, was welcomed by
the industry because the obligatory discount had resulted in nega-
tive effects for the pharmaceutical location of Germany, and for
employment in this sector. Retrospectively, the 16 % obligatory dis-
count was partially reintroduced through the back door via the
German Economic Optimization of Pharmaceutical Care Act (AV W G )
2006. In general, for pharmaceutical drugs not subject to the refe-
rence price system, there is an obligatory discount on the manufac-
turer price of 6 %. Based on the AVWG regulation, an additional
10 % obligatory rebate for pharmaceutical drugs that are off-patent
and have the same active ingredients was introduced. Outside the
reference price system, there is sometimes a new cumulative dis-
count totaling 16 %. Avoidance of the 10 % rebate – through price
reduction of at least 30 % below the reference price – can only be
considered by companies whose products are part of the reference
price system.
The pharmaceutical industry as part of the German health care system
5 4
10 % d i s c o u n t for pharmaceu-tical drugs, which are off - p a t e n twith the same active ingre d i e n t(provided that two brands are
on the market)**Base: Manufacturer price*
M a n u f a c t u re r1 P h a r m a c i e s2
* April 1s t, 2006 to March 31st, 2008, shows the discount by manufacturer price increase, c o m p a red to the price status of November 1s t, 2005 (price increase moratorium)
** If at least 30% less than the respective, valid, re f e rence price, then a) the 10% discount automatically lapses b) additionally, the SHI can waive the co-pay for patients as long as there are savings for the SHI
*** General prohibition of "discounts in kind"**** Increase to 2.30 Euros since April 1s t, 2007
1§ 130a sect. 1 German Social Code Book No. V (SGB V); § 130a sect. 3a, 3b German Social Code Book No. V.
2 § 130 sect. 1 German Social Code Book No. V
S o u rce: Illustration of the BPI 2009.
SHI market
6 % m a n u f a c t u rer discount for al lthe SHI prescription drugs without re f e rence price and for OTC drugs
without re f e rence price* Base: Manufacturer price*
2.30 Euros ****Pharmacy discount for
p rescript ion drug pro d u c t s
5 % of pharmacy’s re t a i lprice incl. VAT
Pharmacy discount for other
pharmaceutical drugs
rz_pharma_2009_en.qxd 02.03.2010 10:34 Uhr Seite 56

Expenses of the pharmaceutical industry, due to obligatory discounts
2003–2008 (in million Euros), manufacturer price
The obligatory discounts are to be paid since the solidarity tax in
2002 (200 million Euros), and they have been adapted several
times.
In 2008, this resulted in just about 1 billion Euros. Medium-sized
pharmaceutical companies, in particular, are hard hit by these
payments because they cannot absorb the losses through cross-
subsidies with other product segments. These political interven-
tions undermine the proclaimed overall support for medium-sized
companies. On the contrary, governmental intervention accelerates
market consolidation in favor of larger corporations.
The pharmaceutical industry as part of the German health care system
5 5
500
0
1,000
1,500
S o u rce: IMS Health PharmaScope® 2 0 0 9 .
2003 2004 2005 2006 2007
6 % manufact.discount
640
6 % manufact.discount
600
16 % manufacturer discount
1,800
6 % / 10 % / 16 % manufacturer discount
980
250*
730
1.078
205*
873
2008
963**
187*
776
* So-called “discount for generics”
** Discount decline due to the price moratorium running out in April 2008
rz_pharma_2009_en.qxd 02.03.2010 10:34 Uhr Seite 57

Since 2003, there has been a
legal option for the health insur-
ance providers (§ 130a sect. 8
German Social Code Book No. V)
to enter into individual rebate /
discount contracts with the phar-
maceutical companies. In the first
few years, this regulation had
barely any practical significance. With the German Act on reinforcing
SHI competition (GKV-WSG) in 2007, this instrument has rapidly
gained momentum as a result of the accompanying measures,
such as consideration regarding the bonus-malus system for doc-
tors, reduced co-pays for patients and through the statutory principle
of preferred-delivery of rebate pharmaceuticals in the pharmacies.
From then onward, the debate was characterized by legal disputes
about the application of distribution, competition and cartel law.
Now as then, it is necessary to fight for an equal playing field for all
stakeholders involved in competition, which means that, in the case
of selective contracting between Statutory Health Insurance provi-
ders and pharmaceutical companies, the entire German cartel and
competition law (GWB and UWG) must be applied. Due to the
increasing number of mergers in the Statutory Health Insurance sec-
t o r, the market power on the side of the health insurance providers
is increasing.
Until 2008, questions had been left open concerning the applicabil-
ity of the Cartel Procurement Law –connected with the obligation to
conduct European-wide calls for tender – as well as the valid legal
route when checking rebate contracts. Finally, in October 2007, the
EU Commission initiated contract violation proceedings against the
Federal Republic of Germany, for violation of the EU Procurement
Law when entering rebate contracts. Actions only started taking
place with the implementation of the German Law to enhance of
organizational structures of SHI (GKV-OrgWG). The new rules, which
Discount / rebate contracting in SHI
The pharmaceutical industry as part of the German health care system
5 6
rz_pharma_2009_en.qxd 02.03.2010 10:34 Uhr Seite 58

went into force on January 1s t,
2009, provide that when e n t e r i n g
contracts as per § 130a sect. 8
German Social Code Book No.
V, procurement law is applicable,
“provided the pre-requisites
mentioned therein are fulfilled”.
There is now a divided legal
route for verification of discount
contracts: the first stage is
handled by the procurement
chambers, and the second by the respective social jurisdiction.
F u r t h e r, a special procedure has been installed for procure-
ment-related disputes with regard to social jurisdiction and
became part of the German Social Court Law (SGG), which
meets the special requirements of procurement-related disputes.
Since April 24t h, 2009, a new act came into force concerning
the modernization of the Procurement Law. It is now obligatory
in the tender business, to divide these into partial and specialist
lots, something that can be helpful for medium-sized compa-
nies in the procurement process. But also when it comes to
legal protection, the modernization of the Procurement Law
contains important regulations, especially in respect to the
invalidity of illegal de facto procurement (§ 101b sect. 1 GWB).
This invalidity only applies, however, if it is submitted to the pro-
curement chamber within 30 days of obtaining the knowledge,
and/or no longer than six months after signing the contract (§
101 b sect. 2 GWB).
As far as rebate contracts concerning generic drugs, the appli-
cability of the procurement law can be considered as clear.
With reference to discount contracts concerning patented
drugs, a final legal decision is still pending.
The pharmaceutical industry as part of the German health care system
5 7
rz_pharma_2009_en.qxd 02.03.2010 10:34 Uhr Seite 59

An essential aspect here is whether Statutory Health Insurance
providers, when signing a rebate contract concerning patented
drugs, are actually making a selection decision for the persons
insured. The selection would mean an essential part for a
public service remit in the sense of the procurement law, since
patented drugs cannot be substituted at the pharmacies.
Meanwhile, there is a significant increase of discount contract
drugs at all the SHI. In terms of quantity, the AOKs reached a
share of 69 % in May 2009, which is the highest share in the
generic segment. These tenders were based on active ingre-
dients, whereby the large Statutory Health Insurance funds, had
partly entered contracts pertaining to the overall portfolio of a
c o m p a n y. The latter had not been subject to public tenders. In
July 2009, however, the TK (Techniker Krankenkasse) initiated a
European-wide call for active ingredient related tender.
S h a re of discount drugs in diff e rent Statutory Health Insurances
(market share in %)
In May 2009, almost half of all pharmaceutical drugs supplied
through the SHI market were subject to rebate regulations, accor-
ding to information by IMS Health. At the end of 2008, 204
S t a t u t o ry Health Insurance providers had entered some 4,739
contracts, containing 25,937 different trade forms, with 116 phar-
maceutical companies.
The pharmaceutical industry as part of the German health care system
5 8
50
100
DAK BEK TK* BKK AOK
* Merged with IKK Dire k t
S o u rce: Illustration of the BPI based on IMS Contract Monitor 2009.
With rebate contract May 2008 May 2009
66 68 60 64 60
56 50
68 58
69
rz_pharma_2009_en.qxd 02.03.2010 10:34 Uhr Seite 60

SHI-market and pharmaceutical drugs subject to rebate contracts
In May 2009, IMS Health reported the number of 203 Statutory Health
Insurance providers with 127 manufacturers. The number of contracts
was 5,972 and there were over 27,000 trade forms involved.
The portfolio contracts are highly precarious, especially for
medium-sized companies, since even when uniting as a bidding
consortium, they barely receive any contracts. Not being taken into
consideration in a rebate contract has the same effects as a partial
exclusion from the market since the contractually set time period
(usually two years) regulates the preferred distribution of discoun-
ted pharmaceuticals. An AOK with a market share of 40 %, hence,
means very negative effects for the bidder who does not receive
the award. And if the corresponding company has achieved the
highest turnover with the majority of its products, by cooperation
with the AOK, this can actually endanger its existence.
In general, selective contracting between manufacturers and
Statutory Health Insurance providers is undertaken within a highly
regulated overall system that is characterized by massive market
interventions, as well as the monopoly position of the Statutory
Health Insurance providers. The side-by-side “regulation jungle” –
among others reference price system, obligatory manufacturer
rebates and co-payment waivers – needs to be cleared.
The pharmaceutical industry as part of the German health care system
5 9
2008 1st halfof
2008
2n d h a l fo f
2008
May2009
2008 1st halfof
2008
2n d h a l fo f
2008
May2009
664 332 332 52 18,047 8,810 9,238 1,504
40 % 34 % 46 % 49 % 14 % 11 % 16 % 17 %
Quantity(million packages)
Turnover(million Euros)
S o u rce: Illustration of the BPI with rebate contract based on IMS Contract Monitor 2009.
rz_pharma_2009_en.qxd 02.03.2010 10:34 Uhr Seite 61

The development in the German
pharmacy market presents a very
heterogenous picture. Compared
to the previous year, the total turn-
over in the pharmacy market,
assessed at manufacturer prices
rose in 2008 by 4.3 % to a total of 23.8 billion Euros. For prescrip-
tion drugs, there was an increase in turnover of 5.0 %. The area of
OTCs, on the other hand, was on the decline with 4.7 %.
Looking at the volume trends in the overall market shows that in
2008, there was a slight tendency increase. The largest decline of
5.9 % is presented by non-pharmaceutical drugs when compared
to the previous year.
Development of turnover in the pharmacy market 2005–2008
(in million Euros)
Development of the sales trend in the pharmacy market 2005–2008
(packages in millions)
1For this assessment, initially, the wholesaler turnovers, as well as the direct busi-
ness of manufacturers with pharmacies is recorded and, afterwards evaluated withthe manufacturer price. Not included are turnovers of manufacturers with hospitals.
The German pharmacy m a r k e t
The German pharmaceutical market
6 0
To t a l
Prescription only
Only for sale at pharmacies
Non-pharmaceutical drugs
N a r c o t i c s
For sale outside of pharmacies
Drugs + chemicals
2 0 0 8
2 3 , 7 7 2 . 5
1 8 , 6 3 5 . 7
2 , 9 7 5 . 0
1 , 2 5 4 . 6
7 1 8 . 1
1 8 3 . 8
5 . 3
2 0 0 5
2 1 , 9 0 4 . 8
1 7 , 0 5 5 . 5
2 , 8 5 6 . 1
1 , 1 7 6 . 2
6 0 9 . 6
2 0 2 . 3
5 . 1
2 0 0 6
2 1 , 8 2 3 . 1
1 6 , 9 0 2 . 8
2 , 8 4 6 . 1
1 , 2 2 4 . 1
6 5 2 . 2
1 9 3 . 0
4 . 9
2 0 0 7
2 2 , 7 8 5 . 7
1 7 , 7 4 1 . 1
2 , 9 0 1 . 3
1 , 2 6 3 . 0
6 8 2 . 4
1 9 2 . 9
5 . 0
Change to previous year in %
4 . 3
5 . 0
2 . 5
- 0.7
5 . 2
- 4.7
5 . 5
S o u rce: Illustration of the BPI based on data of Insight Health 2009.
Total
Prescription only
Only for sale at pharmacies
Non-pharmaceutical drugs
Narcotics
For sale outside pharmacies
Drugs + chemicals
2 0 0 8
1 , 6 0 9 . 7
7 2 9 . 9
6 9 2 . 3
1 3 1 . 5
4 6 . 2
9 . 2
0 . 6
2 0 0 5
1 , 6 1 9 . 6
7 0 7 . 1
7 0 5 . 0
1 4 5 . 1
5 4 . 4
7 . 3
0 . 7
2 0 0 6
1 , 5 9 9 . 3
6 7 4 . 7
6 8 4 . 2
1 4 1 . 7
5 0 . 3
7 . 8
0 . 6
2 0 0 7
1 , 5 8 6 . 0
6 9 7 . 8
6 9 1 . 2
1 3 9 . 7
4 8 . 2
8 . 5
0 . 6
Change to previous year in %
1 . 5
4 . 6
0 . 2
- 5.9
- 4.3
7 . 8
1 . 7
S o u rce: Illustration of the BPI based on data of Insight Health 2009.
rz_pharma_2009_en.qxd 02.03.2010 10:34 Uhr Seite 62
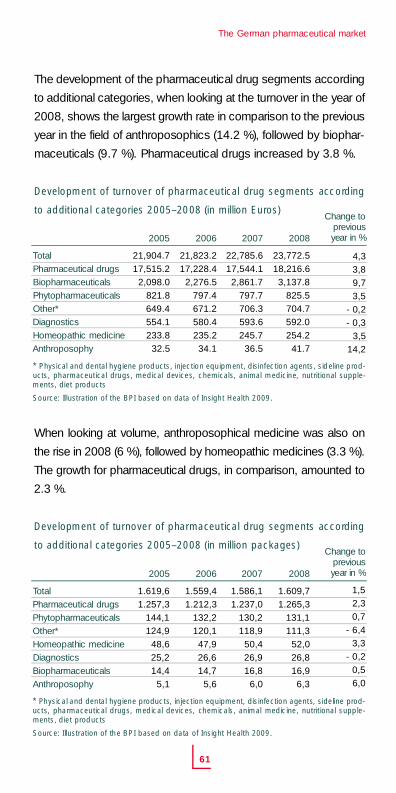
The development of the pharmaceutical drug segments according
to additional categories, when looking at the turnover in the year of
2008, shows the largest growth rate in comparison to the previous
year in the field of anthroposophics (14.2 %), followed by biophar-
maceuticals (9.7 %). Pharmaceutical drugs increased by 3.8 %.
Development of turnover of pharmaceutical drug segments accord i n g
to additional categories 2005–2008 (in million Euro s )
When looking at volume, anthroposophical medicine was also on
the rise in 2008 (6 %), followed by homeopathic medicines (3.3 %).
The growth for pharmaceutical drugs, in comparison, amounted to
2.3 %.
Development of turnover of pharmaceutical drug segments accord i n g
to additional categories 2005–2008 (in million packages)
The German pharmaceutical market
6 1
To t a l
Pharmaceutical drugs
B i o p h a r m a c e u t i c a l s
P h y t o p h a r m a c e u t i c a l s
O t h e r *
D i a g n o s t i c s
Homeopathic medicine
A n t h r o p o s o p h y
2 0 0 5
2 1 , 9 0 4 . 7
1 7 , 5 1 5 . 2
2 , 0 9 8 . 0
8 2 1 . 8
6 4 9 . 4
5 5 4 . 1
2 3 3 . 8
3 2 . 5
2 0 0 6
2 1 , 8 2 3 . 2
1 7 , 2 2 8 . 4
2 , 2 7 6 . 5
7 9 7 . 4
6 7 1 . 2
5 8 0 . 4
2 3 5 . 2
3 4 . 1
2 0 0 7
2 2 , 7 8 5 . 6
1 7 , 5 4 4 . 1
2 , 8 6 1 . 7
7 9 7 . 7
7 0 6 . 3
5 9 3 . 6
2 4 5 . 7
3 6 . 5
2 0 0 8
2 3 , 7 7 2 . 5
1 8 , 2 1 6 . 6
3 , 1 3 7 . 8
8 2 5 . 5
7 0 4 . 7
5 9 2 . 0
2 5 4 . 2
4 1 . 7
Change to previous year in %
4 , 3
3 , 8
9 , 7
3 , 5
- 0,2
- 0,3
3 , 5
1 4 , 2
* Physical and dental hygiene products, injection equipment, disinfection agents, sideline pro d -ucts, pharmaceutical drugs, medical devices, chemicals, animal medicine, nutritional supple-ments, diet pro d u c t s
S o u rce: Illustration of the BPI based on data of Insight Health 2009.
To t a l
Pharmaceutical drugs
P h y t o p h a r m a c e u t i c a l s
O t h e r *
Homeopathic medicine
D i a g n o s t i c s
B i o p h a r m a c e u t i c a l s
A n t h r o p o s o p h y
2 0 0 5
1 . 6 1 9 , 6
1 . 2 5 7 , 3
1 4 4 , 1
1 2 4 , 9
4 8 , 6
2 5 , 2
1 4 , 4
5 , 1
2 0 0 6
1 . 5 5 9 , 4
1 . 2 1 2 , 3
1 3 2 , 2
1 2 0 , 1
4 7 , 9
2 6 , 6
1 4 , 7
5 , 6
2 0 0 7
1 . 5 8 6 , 1
1 . 2 3 7 , 0
1 3 0 , 2
1 1 8 , 9
5 0 , 4
2 6 , 9
1 6 , 8
6 , 0
2 0 0 8
1 . 6 0 9 , 7
1 . 2 6 5 , 3
1 3 1 , 1
1 1 1 , 3
5 2 , 0
2 6 , 8
1 6 , 9
6 , 3
Change to previous year in %
1 , 5
2 , 3
0 , 7
- 6,4
3 , 3
- 0,2
0 , 5
6 , 0
* Physical and dental hygiene products, injection equipment, disinfection agents, sideline pro d -ucts, pharmaceutical drugs, medical devices, chemicals, animal medicine, nutritional supple-ments, diet products
S o u rce: Illustration of the BPI based on data of Insight Health 2009.
rz_pharma_2009_en.qxd 02.03.2010 10:34 Uhr Seite 63

With the introduction of optional rates for special therapy options,
the government has provided patients with choices in the areas
of homeopathic medicine, anthroposophy and phytotherapy,
whereas there is currently a lack of attractive implementation con-
cepts. Large parts of the population are increasingly using natu-
ral medicines, for instance phytopharmaceuticals. These are
medicines with the active ingredients which are exclusively
plants, parts of plants and/or combinations.
In Germany, over 100 pharmaceutical companies with highly-
qualified staff are engaged in producing anthroposophical and
homeopathic medicines. Germany is the market leader in the field
of phytopharmaceuticals, as well as anthroposophical and homeo-
pathic medicine. The medicines are used all across the EU. In
Germany alone, there are some 60,000 physicians who regularly
prescribe homeopathic and anthroposophical medicines. O u t s i d e
of Europe, the homeopathic field enjoys global popularity,
especially in the USA, Central and South America, Asia, India,
and South Africa. Anthroposophical medicine, outside Europe, is
especially popular in North and South America, as well as in
Australia and New Zealand.
An analysis of the Top 10 indication areas according to Anatomical
Therapeutic Chemical Classification (ATC-3) shows an overall
minimal rising trend when looking at volumes. Compared to the
previous year, the largest growth rate, with 16.3%, is in the field of
ulcer therapeutic agents, followed by beta blockers (6.0 %) and
non -steroidal anti-inflammatory drugs (5.9 %).
The German pharmaceutical market
6 2
rz_pharma_2009_en.qxd 02.03.2010 10:34 Uhr Seite 64

Top 10 leading indication areas (ATC-3)
at the pharmacy market 2008 by distribution
The turnover development of the Top 10 indication areas per AT C – 3
shows that immune suppressants, other antineoplastic agents and
interferons show the highest rate of increase compared to the pre-
vious year. In 2008, the share of these three groups at the overall
turnover volume of the pharmacy market was at 8.6 %.
Top 10 leading indication areas (ATC-3)
at the pharmacy market 2008 by turnover
The German pharmaceutical market
6 3
Indication areas (AT C - 3 )
To t a l
N02B other analgetics
R01A nasal preparations, topical
R05C expectorants without anti-infectants
V03X other therapeutic preparations
M01A anti-phlogistic/anti-rheuma., non-steroid.
A02B ulcer therapeutic agents
C07A beta-blockers
M02A anti-rheumatory, and analgetics, topical
N05B hypnotics and sedatives
A06A laxatives
Packages
in thousands
1 , 6 0 9 , 7 3 3 . 8
1 5 3 , 2 3 4 . 3
7 3 , 0 6 6 . 7
6 3 , 7 5 3 . 9
5 2 , 0 2 0 . 8
4 4 , 6 0 3 . 7
4 3 , 3 8 1 . 8
3 6 , 2 2 4 . 8
3 3 , 0 1 5 . 3
2 7 , 0 4 0 . 1
2 6 , 6 8 8 . 0
% to
p r e v i o u s
y e a r
1 . 4 9
3 . 0 2
- 3.42
1 . 2 8
1 . 9 8
5 . 9 0
1 6 . 3 3
6 . 0 2
- 0.21
- 1.55
- 1.83
Share of
total turn-
over in %
1 0 0 . 0 0
2 . 1 8
0 . 6 7
0 . 9 3
0 . 9 8
0 . 8 0
3 . 3 1
1 . 0 0
0 . 5 9
0 . 4 7
0 . 6 0
Share of
total sales
in %
1 0 0 . 0 0
9 . 5 2
4 . 5 4
3 . 9 6
3 . 2 3
2 . 7 7
2 . 6 9
2 . 2 5
2 . 0 5
1 . 6 8
1 . 6 6
S o u rce: Illustration of the BPI based on data of Insight Health 2009.
Indication areas (AT C - 3 )
To t a l
J07A vaccines, simple
L04A immune suppressants
A10C human-insulin and analogs
A02B ulcer-therapeutic agents
N05A anti-psychotics
L03B Interferons
N02A analgetics, narcotics
N06A antidepressants / mood stabilizers
L01X other antineoplastic agents
T02D diabetes tests
In thousands
E u r o s
2 3 , 7 7 2 , 5 1 5 . 9
9 2 0 , 4 3 7 . 3
8 7 1 , 6 2 8 . 7
8 4 6 , 6 3 7 . 9
7 8 6 , 8 9 9 . 8
6 5 7 , 5 7 7 . 4
6 2 3 , 2 7 5 . 5
6 2 0 , 7 8 3 . 7
5 5 2 , 2 9 1 . 2
5 4 9 , 1 1 8 . 9
5 3 9 , 4 9 3 . 5
% to
p r e v i o u s
y e a r
4 . 3 3
- 5.32
3 2 . 9 8
4 . 4 8
2 . 4 8
- 11.67
1 2 . 5 8
7 . 9 4
1 1 . 6 4
2 6 . 4 9
- 0.39
Share of
total turn-
over in %
1 0 0 . 0 0
3 . 8 7
3 . 6 7
3 . 5 6
3 . 3 1
2 . 7 7
2 . 6 2
2 . 6 1
2 . 3 2
2 . 3 1
2 . 2 7
Share of
total sales
in %
1 0 0 . 0 0
0 . 4 9
0 . 1 3
0 . 8 0
2 . 6 9
0 . 8 2
0 . 0 3
0 . 3 9
1 . 5 3
0 . 0 6
1 . 4 6
S o u rce: Illustration of the BPI based on data of Insight Health 2009.
rz_pharma_2009_en.qxd 02.03.2010 10:34 Uhr Seite 65

The illustrations outlined below
clarify different segments of
the pharmaceutical market in
pharmacies. For prescription
drugs assessed with the phar-
m a c y ’s retail price, IMS Health for 2008 determined a total
turnover of 31.7 billion Euros. The turnover of over- t h e - c o u n-
ter medicines showed a total of 5.4 bill ion Euros for 666 mil-
lion packages.
Tu rnover of pharmaceuticals in pharmacies 2008 at the pharmacy’s
retail price (in billion Euro s )
In 2008, 133 million package units of over-the-counter drugs
were reimbursed by the SHI, while 533 million units were purchased
for self-medication.
The pharmaceutical market
6 4
S o u rce: Illustration of the BPI based on data of IMS Health 2009.
P rescription drugs
P rescribed over-the-counter drugs
Self-medication with o v e r-the-counter drugs
1.3
4.1
31.7
The German pharmaceuticalm a r k e t
rz_pharma_2009_en.qxd 02.03.2010 10:34 Uhr Seite 66
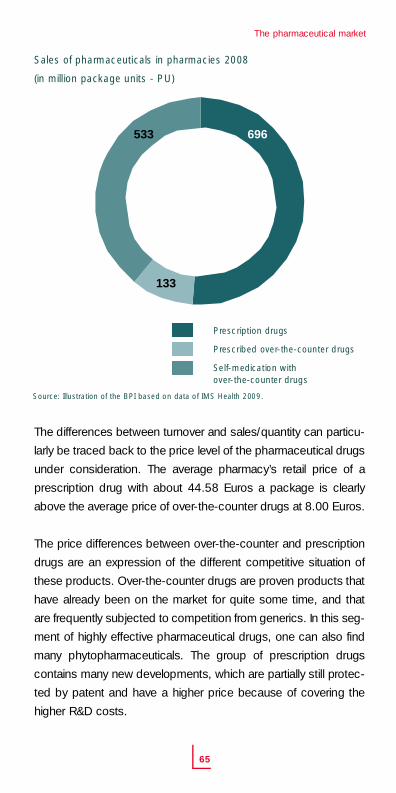
Sales of pharmaceuticals in pharmacies 2008
(in million package units - PU)
The differences between turnover and sales/quantity can particu-
larly be traced back to the price level of the pharmaceutical drugs
under consideration. The average pharmacy’s retail price of a
prescription drug with about 44.58 Euros a package is clearly
above the average price of over-the-counter drugs at 8.00 Euros.
The price differences between over-the-counter and prescription
drugs are an expression of the different competitive situation of
these products. Over-the-counter drugs are proven products that
have already been on the market for quite some time, and that
are frequently subjected to competition from generics. In this seg-
ment of highly effective pharmaceutical drugs, one can also find
many phytopharmaceuticals. The group of prescription drugs
contains many new developments, which are partially still protec-
ted by patent and have a higher price because of covering the
higher R&D costs.
The pharmaceutical market
6 5
S o u rce: Illustration of the BPI based on data of IMS Health 2009.
P rescription drugs
P rescribed over-the-counter drugs
Self-medication with o v e r-the-counter drugs
133
533 696
rz_pharma_2009_en.qxd 02.03.2010 10:34 Uhr Seite 67

The turnover development in the
German pharmacy market in 2008,
with pharmaceutical drugs available
without prescription only at phar-
macies, as well as health products (GMS, Gesundheitsmittel)*, will,
in the future, be dominated by pharmacy-only drugs at 81 % (sales:
79 %). What was initially a swift increase of the share of health
products has declined over recent years; the tendency toward
growth in this product range does, however, continue. While turnover
share of health products in 2003 was still at 8.8 %, by the year 2008
it was already 13.7 % (volume 2003: 14.2 %; 2008: 15.5 %). As
looking at the volume shows, however, the amount of health
products has only risen insignificantly while there has been a strong
price increase in the health product category in recent years.
The total OTC market, compared to the previous year, showed some
losses (sales: 3.3 %; turnover: 2.6 %) and, for both sales and turnover,
is below the 2004 figures. 2004 was the year when the health care
modernization law, aside from a few exceptions, vacated reimburse-
ment of OTC drugs.
Development of turnover in the German OTC pharmacy market
*GMS: Defined as products competing with pharmaceutical drugs.
The pharmaceutical market
6 6
The OTC m a r k e t
Tu rnover in thousand Euros to pharmacy’s retail price
Pharmaceutical drugs- Pharmacy-only- O T C s
GMS pharmacy
To t a l
Market share in %
Pharmaceutical drugs- Pharmacy-only- O T C s
GMS pharmacy
To t a l
2 0 0 4
5 , 4 9 7 , 7 2 8
3 6 8 , 9 9 9
7 5 2 , 3 4 2
6 , 6 1 9 , 0 6 9
2 0 0 4
83.0 5.6
11.4
1 0 0
2 0 0 3
6 , 3 4 7 , 9 2 0
3 7 9 , 3 0 5
6 4 5 , 9 9 9
7 , 3 7 3 , 2 2 4
2 0 0 3
86.1 5 . 1
8 . 8
1 0 0
2005
5 , 5 2 9 , 3 3 1
3 5 0 , 0 7 5
8 2 0 , 6 5 0
6 , 7 0 0 , 0 5 6
2 0 0 5
82.6 5 . 2
1 2 . 2
1 0 0
2006
5 , 2 9 4 , 7 1 1
3 3 4 , 8 1 5
8 4 5 , 9 5 4
6 , 4 7 5 , 4 8 0
2 0 0 6
8 1 . 85 . 2
1 3 . 0
1 0 0
2007
5 , 2 8 5 , 7 9 4
3 2 8 , 6 3 5
8 3 3 , 3 3 7
6 , 4 4 7 , 7 6 6
2 0 0 7
8 2 . 05 . 1
1 2 . 9
1 0 0
2008
5 , 1 0 3 , 7 7 4
3 1 2 , 7 8 3
8 6 4 , 9 0 8
6 , 2 8 1 , 4 6 5
2 0 0 8
8 1 . 35 . 0
1 3 . 7
1 0 0
S o u rce: Illustration of the BPI based on data of IMS Health 2009.
rz_pharma_2009_en.qxd 02.03.2010 10:34 Uhr Seite 68

Development of sales in the German OTC pharmacy market
The sales and turnover figures of the mail-order pharmacies were
only insufficiently recorded in 2008, and there are significant
parameter errors for 2008. For the future, an improved data
status can be envisioned through new contracts between market
research institutes and pharmacies. Comparisons of BPI member
companies between the market research data and the actual
volume showed deviations of up to 20 % for individual products.
Large packages (N3) and high-priced products are particularly
affected by this, suffering in part from very aggressive pricing
policies of some individual mail-order pharmacies. Mail-order
pharmacies actively use these products in order to gain new
clients through price leadership, or to merely maintain market
shares. Altogether, the market share of the mail-order pharmacies
of the OTC total market is estimated at 5 %.
For fifth OTC pharmaceutical drug sold at pharmacies, there is no
pharmacy-only obligation (share of sales: 21 %; share of
turnover: 19 %). As can be seen from the illustrations to follow,
this tendency has been ongoing since 2003.
The pharmaceutical market
6 7
Volume in thousands of package units
P a c k a g e s
Pharmaceutical drugs- Pharmacy-only- O T C s
GMS pharmacy
To t a l
Market share in %
Pharmaceutical drugs- Pharmacy-only- O T C s
GMS pharmacy
To t a l
2 0 0 4
6 7 9 , 0 0 65 3 , 4 9 7
1 3 4 , 2 5 3
8 6 6 , 7 5 6
2 0 0 4
78.3 6.2
15.5
1 0 0
2 0 0 3
7 6 3 , 6 2 15 7 , 1 4 5
1 3 6 , 1 8 0
9 5 6 , 9 4 6
2 0 0 3
79.8 6.0
14.2
1 0 0
2005
6 8 6 , 5 8 55 1 , 2 0 2
1 3 7 , 8 6 6
8 7 5 , 6 5 3
2005
78.4 5.9
15.7
1 0 0
2006
6 5 3 , 0 9 04 8 , 9 5 8
1 2 7 , 2 0 7
8 2 9 , 2 5 5
2006
78.8 5 . 9
1 5 . 3
1 0 0
2007
6 4 1 , 6 3 64 6 , 9 6 5
1 2 3 , 2 7 1
8 1 1 , 8 7 2
2007
79.0 5 . 8
1 5 . 2
1 0 0
2008
6 1 8 , 8 5 54 4 , 6 0 4
1 2 1 , 4 4 0
7 8 4 , 8 9 9
2008
78.8 5 . 7
1 5 . 5
1 0 0
S o u rce: Illustration of the BPI based on data of IMS Health 2009.
rz_pharma_2009_en.qxd 02.03.2010 10:34 Uhr Seite 69
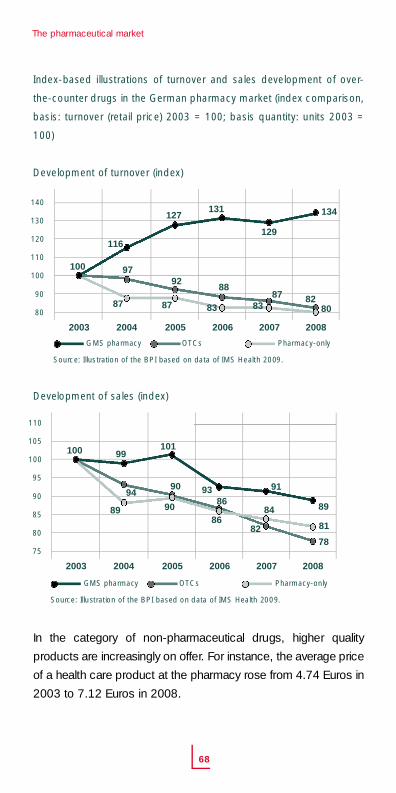
Index-based illustrations of turnover and sales development of over-
the-counter drugs in the German pharmacy market (index comparison,
basis: turnover (retail price) 2003 = 100; basis quantity: units 2003 =
100)
Development of turnover (index)
Development of sales (index)
In the category of non-pharmaceutical drugs, higher quality
products are increasingly on offer. For instance, the average price
of a health care product at the pharmacy rose from 4.74 Euros in
2003 to 7.12 Euros in 2008.
The pharmaceutical market
6 8
100
2003 2004 2005 2006
S o u rce: Illustration of the BPI based on data of IMS Health 2009.
1 1 0
1 0 5
1 0 0
9 5
9 0
8 5
8 0
7 5
99101
93 91
89
90
9086
8684
82
100
2003 2004 2005 2006
2007 2008
2007
1 4 0
1 3 0
1 2 0
1 1 0
1 0 0
9 0
8 087
127131
129
134
9792
87
88
8387
83
2008
8280
94
116
89
81
78
GMS pharmacy O T C s P h a r m a c y - o n l y
S o u rce: Illustration of the BPI based on data of IMS Health 2009.
GMS pharmacy O T C s P h a r m a c y - o n l y
rz_pharma_2009_en.qxd 02.03.2010 10:34 Uhr Seite 70

The average pharmacy retail price of a product at the German
pharmacy market, for 2008, was 8.00 Euros. Prices in the stron-
gest quantity category for pharmacy-only pharmaceutical drugs
are at a value of 8.25 Euros in 2008, which matches the level of
2007, and which is slightly below the average pharmacy’s retail
price of 2003. Over the next years, further development on the
German pharmacy market (e.g. growth of mail-order pharmaceu-
tical business), expansion of franchise concepts and cooperation
amongst pharmacies, is going to exert a strong influence on price
development.
Average pharmacy retail price for OTCs in the pharmacy market
The pharmaceutical market
6 9
Prices in Euro
Pharmaceutical drugs- Pharmacy-only- OTCs
GMS pharmacy
Mean value (weighed according to volume)
2 0 0 3
8 , 3 1
6 , 6 4
4 , 7 4
7 , 7 0
2 0 0 4
8 , 1 0
6 , 9 0
5 , 6 0
7 , 6 4
2005
8 , 0 5
6 , 8 4
5 , 9 5
7 , 6 5
2006
8 , 1 1
6 , 8 4
6 , 6 5
7 , 8 1
2007
8 , 2 4
7 , 0 0
6 , 7 6
7 , 9 4
2008
8 , 2 5
7 , 0 1
7 , 1 2
8 , 0 0
S o u rce: Illustration of the BPI based on data of IMS Health 2009.
rz_pharma_2009_en.qxd 02.03.2010 10:34 Uhr Seite 71
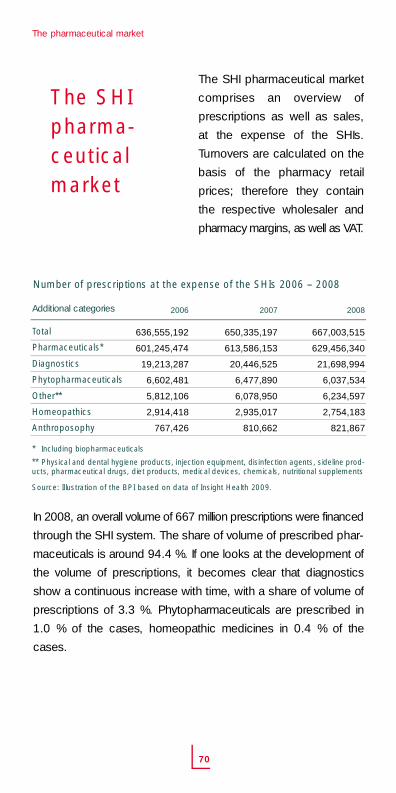
The SHI pharmaceutical market
comprises an overview of
prescriptions as well as sales,
at the expense of the SHIs.
Turnovers are calculated on the
basis of the pharmacy retail
prices; therefore they contain
the respective wholesaler and
pharmacy margins, as well as VAT.
Number of prescriptions at the expense of the SHIs 2006 – 2008
In 2008, an overall volume of 667 million prescriptions were financed
through the SHI system. The share of volume of prescribed phar-
maceuticals is around 94.4 %. If one looks at the development of
the volume of prescriptions, it becomes clear that diagnostics
show a continuous increase with time, with a share of volume of
prescriptions of 3.3 %. Phytopharmaceuticals are prescribed in
1.0 % of the cases, homeopathic medicines in 0.4 % of the
c a s e s .
The pharmaceutical market
7 0
The SHI p h a r m a -ceutical market
Additional categories
To t a l
Pharmaceuticals*
D i a g n o s t i c s
P h y t o p h a r m a c e u t i c a l s
O t h e r * *
H o m e o p a t h i c s
A n t h ro p o s o p h y
2 0 0 6
6 3 6 , 5 5 5 , 1 9 2
6 0 1 , 2 4 5 , 4 7 4
1 9 , 2 1 3 , 2 8 7
6 , 6 0 2 , 4 8 1
5 , 8 1 2 , 1 0 6
2 , 9 1 4 , 4 1 8
7 6 7 , 4 2 6
2 0 0 7
6 5 0 , 3 3 5 , 1 9 7
6 1 3 , 5 8 6 , 1 5 3
2 0 , 4 4 6 , 5 2 5
6 , 4 7 7 , 8 9 0
6 , 0 7 8 , 9 5 0
2 , 9 3 5 , 0 1 7
8 1 0 , 6 6 2
2 0 0 8
6 6 7 , 0 0 3 , 5 1 5
6 2 9 , 4 5 6 , 3 4 0
2 1 , 6 9 8 , 9 9 4
6 , 0 3 7 , 5 3 4
6 , 2 3 4 , 5 9 7
2 , 7 5 4 , 1 8 3
8 2 1 , 8 6 7
* Including biopharmaceuticals
** Physical and dental hygiene products, injection equipment, disinfection agents, sideline pro d -ucts, pharmaceutical drugs, diet products, medical devices, chemicals, nutritional supplements
S o u rce: Illustration of the BPI based on data of Insight Health 2009.
rz_pharma_2009_en.qxd 02.03.2010 10:34 Uhr Seite 72

Tu rnover at the expense of the SHIs 2006-2008, pharmacy retail price in Euro s
Development of the market share at the expense of SHIs 2006-2008 in %
Looking at turnover, it becomes clear that the turnover of pharma-
ceuticals in 2008 accounted for 28.4 billion Euros, corresponding
with a 5.2 % growth rate compared to the previous year of 2007.
The market share of pharmaceuticals was 96 %. The comparatively
lower share in turnover of phytopharmaceuticals, at 0.3 % of SHI
expenditures, can be explained with the lower-than average price
level of these products. Similar considerations apply for homeopa-
thic medicines, which resulted in SHI expenditures of 25.6 million
Euros. This corresponds to only 0.1 % of the SHI pharmaceutical
expenditures.
The pharmaceutical market
7 1
2 0 0 6
1 0 0 . 0 0
9 4 . 4 5
3 . 0 2
0 . 9 1
1 . 0 4
0 . 4 6
0 . 1 2
2 0 0 7
1 0 0 . 0 0
9 4 . 3 5
3 . 1 4
0 . 9 3
1 . 0 0
0 . 4 5
0 . 1 2
Prescription volume
2 0 0 8
1 0 0 . 0 0
9 4 . 3 7
3 . 2 5
0 . 9 3
0 . 9 1
0 . 4 1
0 . 1 2
To t a l
P h a r m a c e u t i c a l s *
D i a g n o s t i c s
O t h e r * *
P h y t o p h a r m a c e u t i c a l s
H o m e o p a t h y
A n t h ro p o s o p h y
2 0 0 6
2 6 , 3 4 6 , 4 1 3 , 3 6 9
2 5 , 3 3 5 , 3 5 7 , 4 3 4
7 3 4 , 9 0 8 , 9 7 7
1 4 4 , 9 7 2 , 3 7 5
8 6 , 4 3 2 , 3 2 2
2 5 , 5 9 8 , 8 1 9
1 9 , 1 4 3 , 4 4 1
2 0 0 7
2 8 , 0 5 2 , 7 9 7 , 1 9 2
2 6 , 9 6 1 , 9 5 9 , 5 0 8
7 9 5 , 0 0 0 , 6 0 9
1 6 3 , 3 3 3 , 7 9 7
8 5 , 0 3 6 , 8 3 7
2 6 , 9 9 8 , 7 9 5
2 0 , 4 6 7 , 6 4 6
2 0 0 8
2 9 , 5 2 8 , 4 9 8 , 9 3 2
2 8 , 3 9 2 , 7 4 7 , 5 9 5
8 3 7 , 5 6 8 , 4 1 9
1 6 9 , 5 4 8 , 0 3 9
8 1 , 1 6 6 , 7 8 1
2 5 , 5 9 3 , 2 1 6
2 1 , 8 7 4 , 8 8 2
To t a l
Pharmaceuticals
D i a g n o s t i c s
O t h e r *
P h y t o p h a r m a c e u t i c a l s
H o m e o p a t h y
A n t h ro p o s o p h y
2 0 0 6
1 0 0 . 0 0
9 6 . 1 7
2 . 7 9
0 . 5 5
0 . 3 3
0 . 1 0
0 . 0 7
Tu r n o v e r
2 0 0 7
1 0 0 . 0 0
9 6 . 1 2
2 . 8 3
0 . 5 8
0 . 3 0
0 . 1 0
0 . 0 7
2 0 0 8
1 0 0 . 0 0
9 6 . 1 5
2 . 8 4
0 . 5 7
0 . 2 7
0 . 0 9
0 . 0 7
* Physical and dental hygiene products, injection equipment, disinfection agents, sideline pro d -ucts, pharmaceutical drugs, diet products, medical devices, chemicals, nutritional supplements
S o u rce: Illustration of the BPI based on data of Insight Health 2009.
* Including biopharmaceuticals
** Physical and dental hygiene products, injection equipment, disinfection agents, sideline pro d -ucts, pharmaceutical drugs, diet products, medical devices, chemicals, nutritional supplements
S o u rce: Illustration of the BPI based on Insight Health 2009.
rz_pharma_2009_en.qxd 02.03.2010 10:34 Uhr Seite 73

Top 10 leading indication areas (ATC-3) at the SHI pharmaceutical
market 2008 according to sales volume
When looking at sales volume in 2008, the ulcer therapeutic
agents presented the highest growth rate, followed by diabetes
tests and anti-depressants. This group corresponds to 9.2 % of
the total turnover.
Top 10 leading indication areas (ATC-3) at the SHI pharmaceutical
market 2008 according to turn o v e r
Looking at turnover, in 2008, it was the immune suppressants
that, before other antineoplastic agents, presented the highest
growth rate compared to the previous year of 2007. Concerning
the highest declines, antipsychotics registered with 9.8 %.
The pharmaceutical market
7 2
Indication areas (AT C - 3 )
To t a l
M01A antiphlog. / antirheum., non-steroid
N02B other analgetics
C07A beta-blockers, pure
A02B ulcer therapeutic agents
C09A ACE-inhibitors, pure
T02D diabetes tests
C03A diuretics
H03A thyroid preparations
C08A calcium antagonists, pure
N06A antidepressants / mood stabilizers
P r e s c r i p t i o n s
6 6 7 , 0 0 3 , 5 1 5
3 5 , 4 1 7 , 7 9 5
3 5 , 0 0 6 , 7 2 4
3 2 , 0 3 0 , 5 0 8
2 5 , 5 8 9 , 0 8 8
2 3 , 0 4 6 , 7 3 8
2 1 , 1 5 8 , 7 1 8
2 1 , 1 2 7 , 9 1 3
1 8 , 5 6 9 , 1 3 8
1 7 , 5 5 2 , 9 0 2
1 7 , 4 3 8 , 8 4 9
% to
p r e v i o u s
y e a r
2 . 5 6
2 . 0 8
4 . 6 6
4 . 3 9
1 0 . 8 2
6 . 6 6
6 . 8 3
2 . 9 8
6 . 3 8
3 . 2 9
6 . 6 8
%-share
of total
v o l u m e
1 0 0 . 0 0
5 . 3 1
5 . 2 5
4 . 8 0
3 . 8 4
3 . 4 6
3 . 1 7
3 . 1 7
2 . 7 8
2 . 6 3
2 . 6 1
%-share of
t o t a l
t u r n o v e r
1 0 0 . 0 0
1 . 9 1
2 . 0 0
1 . 9 5
3 . 8 8
1 . 2 2
2 . 6 9
1 . 3 8
1 . 0 1
1 . 1 2
2 . 6 1
S o u rce: Illustration of the BPI based on data of Insight Health 2009.
Indication areas (AT C - 3 )
To t a l
A10C human insulin and analogs
A02B ulcer therapeutic agents
L04A immune suppressants
J07A vaccines, simple
N05A antipsychotics
N02A analgesics, narcotics
T02D diabetes tests
L03B interferons
N06A antidepressants / mood stabilizers
L01X other antineoplastic agents
In million
E u r o s
2 9 , 5 2 8 , 5
1 , 1 6 1 , 5
1 , 1 4 4 , 4
1 , 1 2 9 , 5
1 , 1 0 8 , 8
9 2 6 , 1
7 9 7 , 3
7 9 3 , 4
7 8 9 , 1
7 7 0 , 0
6 5 5 , 5
% to
p r e v i o u s
y e a r
5 . 2 6
4 . 8 9
5 . 4 6
3 3 . 0 6
7 . 6 2
- 9.80
7 . 9 6
5 . 1 3
1 2 . 1 8
9 . 8 3
2 0 . 6 7
%-share
of total
v o l u m e
1 0 0 . 0 0
1 . 8 0
3 . 8 4
0 . 2 6
0 . 6 9
1 . 7 3
0 . 8 3
3 . 1 7
0 . 0 7
2 . 6 1
0 . 1 0
%-share of
t o t a l
t u r n o v e r
1 0 0 . 0 0
3 . 9 3
3 . 8 8
3 . 8 3
3 . 7 6
3 . 1 4
2 . 7 0
2 . 6 9
2 . 6 7
2 . 6 1
2 . 2 2
S o u rce: Illustration of the BPI based on data of Insight Health 2009.
rz_pharma_2009_en.qxd 02.03.2010 10:34 Uhr Seite 74

The structural component allows
for detailed consideration of the
development of factors affecting
the SHI pharmaceutical expendi-
tures. It is possible to identify to
what extent has there been a
tendency toward the prescrip-
tion of innovative and patented
pharmaceutical drugs. The struc-
tural effect comprises different
effects (package size, dosage/
strength and pharmaceutical
form) and effects within and/or
among pharmaceutical seg-
ments as well as indication
groups among each other).
The SHI structure component study of IMS, as a quantitative
instrument of market research and health care policy, shows the
individual components (price, volume and structure) of changes
in turnover.
SHI - structural component, growth rates, 2008
(changes to previous year in %)
The pharmaceutical market
7 3
The SHI structural c o m p o n e n t
Tu rn o v e r g rowth rates
S o u rce: Illustration of the BPI based on data of the IMS® SHI-Structural component study
2 0 0 9 .
0
10
- 1.6
Volume (packages)Price
Structure
+ 4.4 + 2.6
+ 5.4
rz_pharma_2009_en.qxd 02.03.2010 10:34 Uhr Seite 75

Components 2008, as a cause of the turnover development in the
SHI market, divided into sub-groups (in %), pharmacy retail price
Through addition, one can form the individual components (e.g.
the structural component “package size”) for the individual forms
of administration, the preparation in general, as well as at the
hierarchy levels above. The SHI market is described based on the
p h a r m a c y ’s retail prices, including VAT. The structural component
study shows changes for four different segments.
The pharmaceutical market
7 4
Quelle: IMS® SHI-Structural component study 2009.
Tu rn o v e r + 5.4
Vo l u m e + 2.6
P r i c e - 1.6
Structural component + 4.4
I n t e r- e ffect + 2.2
I n t r a - e ffect + 2.2
D o s a g e / s t rength + 0.3
h e re f rom Pharmaceutical form + 0.2
Package size + 1.7{
rz_pharma_2009_en.qxd 02.03.2010 10:34 Uhr Seite 76
The “Pharmaceutical Atlas”
published by the Institut für
Gesundheits- und Sozialfor-
schung (IGES), uses the AT C
classification, just like the IMS
Health Structure Component
S t u d y. The IMS structure com-
ponent analysis examines all
ATC groups (ATC 1 to ATC 4)
and thus allows for indication-
oriented consideration of the
individual growth factors for all
levels.
The “Pharmaceutical Atlas” of
IGES takes a different approach.
The essential difference to IMS
is in the different definition of the components. When it comes
to structure of the turnover components, IGES, among others,
looks at consumption, therapy approach, generics, efficacy
strength/package size, manufacturer and price component.
For the 22 indications with the highest prescription share, there
are detailed analyses. The quant ity unit used in the
“Pharmaceutical Atlas” relates to daily dosage (DDD, defined
daily dose). The IMS structural component analysis uses
quantity units (package unit - PU) and/or measuring units as a
b a s e .
In 2008, the IMS structural component was reported at 44 %.
As a rule, this component moves somewhere between 5 % and
8 %. The price level in the SHI pharmaceutical market was on
the decline overall with 1.6 %, while the quantity increased by
2.6 %.
The pharmaceutical market
7 5
rz_pharma_2009_en.qxd 02.03.2010 10:34 Uhr Seite 77

For cost development, it showed
that changes in price, quantity
and quality played a part.
Innovative pharmaceutical drugs
that, by necessity, have a higher
price level due to their higher
R&D costs, frequently contribute toward the treatment of diseases
that, until then, could not be treated, or were only adequately
treated, thus offering considerable benefit to the patients
concerned. At the same time, when it comes to less severe
diseases, oftentimes generic drugs with a strongly decreasing
price level since 2006 mostly due to the rebate contracts,
cannot be properly illustrated.
The SHI-Pharmaceuticals Index, based on a slightly different
calculation method compared to the figures of the IMS structural
analysis, also confirms this declining price development in the
SHI system for 2008, when compared with the development of
consumer prices.
Price development for pharmaceuticals -
Price indices in comparison
( 2 0 0 0 = 1 0 0 )
The pharmaceutical market
7 6
20042002 2006
105
110
115
90
95
100
Consumer prices
SHI pharmaceuticals
2000 20052003 2007 20082001
100
S o u rces: Illustration of the BPI based on data of the Wissenschaftliches Institut der AOK
( WidO), Federal Statistical Office 2009.
rz_pharma_2009_en.qxd 02.03.2010 10:34 Uhr Seite 78

As part of the German Act on
SHI Modernization (GMG), a
new pharmaceutical drug price
ordinance has been in place
since January 1st, 2004, which
– for the prescription-only segment – has led to decreasing
distribution costs for high-price pharmaceuticals, while those for
low-cost, on the other hand, have risen. Further, since 2006,
strong effects due to the German Act on Economic Optimization
of Pharmaceutical Care (AVWG) have become evident. Prices,
especially for pharmaceutical drugs under reference price, are
continuously decreasing.
Price development according to market segments between
January 2007-April 2009 (January 2007=100)
The pharmaceutical market
7 7
S o u rce: Illustration of the BPI based on data of the Wissenschaftliches Instituts der
AOK (WidO) 2009.
N o n - re f e rence price market
Total market
R e f e rence price market
2007 2008 2009
102
106
98
94
92
rz_pharma_2009_en.qxd 02.03.2010 10:34 Uhr Seite 79

The focus of criticism is often
about the high number of
pharmaceutical drugs on the
German market when i t
comes to international com-
parison. Here, a dif ferential
approach is required, as the
manner of count ing dif fers
i n t e r n a t i o n a l l y.
As of June, 9th 2009, according to the statistics of the Federal
Institute for Drugs and Medical Devices (BfArM), there are appro-
vals or registrations for 60,089 pharmaceuticals of all therapy
areas. The “Rote Liste®", the widespread register for pharma-
ceutical drugs in Germany, however, in its current issue only lists
the figure of 8,778 products and, in this, provides a total of
35,577 prices (products are almost always handled in different
package forms at different prices).
The difference between the number of more than 60,000 appro-
vals and/or registrations on one hand, and the comparatively low
number of less than 10,000 products listed in the “Rote Liste®"
on the other hand, can be primarily explained by the different
manner of counting, and by only partial consideration of self-
medication products in the “Rote Liste®".
First of all, in Germany, every single strength/dosage and form of
administration of pharmaceutical drugs requires a separate
approval by the BfArM or the EMEA. This means that, for each
cream, ointment or unction with the same active ingredients,
there is an individual, independent approval. This is a German
phenomenon. In other countries, products with the same dosage,
but different formulation, are evaluated as the same approval and
counted respectively.
The number of pharmaceutical drugs in Germany
The pharmaceutical market
7 8
rz_pharma_2009_en.qxd 02.03.2010 10:34 Uhr Seite 80

Number of pharmaceutical drugs listed in the “Rote Liste®"
F u r t h e r, the BfArM figure merely described the maximum amount
of products capable of being marketed in Germany. This does not
necessarily mean that these products are also constantly available
on the market. The approval of a pharmaceutical drug is not
connected to the obligation of the marketing authorization holder
to actually also offer the respective product on the market. As a
rule, at all times, nobody offering pharmaceutical drugs completely
exploits the authorisations available to them. However, unused
authorisation expires after three years (Sunset-Clause).
The “Rote Liste®" is available to all suppliers of “pharmaceutical
drugs”. At the same time, this compendium is so popular with the
majority of physicians that any supplier of pharmaceutical drugs
who wishes to have their pharmaceuticals prescribed by a doc-
tor is also interested in being listed in the “Rote Liste®".
Pharmaceutical drugs serving exclusively for patient self-medica-
tion, on the other hand, are only represented in the “Rote Liste®"
in low numbers.
The pharmaceutical market
7 9
7,000
8,000
9,000
10,000
5,000
0
6,000
S o u rce: Illustration of the BPI based on data of the “Rote Liste®" 2009.
2003 2004 2005 2006 2007
8,829
2008
8,834
2009
8,764 8,778
9,4498,992 8,933
rz_pharma_2009_en.qxd 02.03.2010 10:34 Uhr Seite 81

Hence, the number of pharmaceutical drugs available on
the German market cannot be determined with certainty.
G e n e r a l l y, the number of pharmaceutical drugs available for
a given market is more a measure of supply amplitude and
supply depth, and offers little indication concerning a possible
o v e r-supply of pharmaceutical drugs, since this figure does
not include any information about their use.
Over the course of the years, the
governmental interventions into
the pharmaceutical market have
increased. Since 1989, at almost
annual rhythm, changes are
made which pharmaceutical
companies have to overcome.
The fundamental problem of
achieving a sustainable SHI
system in Germany has thus far
not been reached; on the con-
t r a ry, health care policy has
negatively influenced both the
industrial and the serv i c e - p r o v i-
ding health care sector.
Transparency and safety in plan-
ning, through this, are being increasingly threatened, and the
concentration process of the pharmaceutical industry, which is
not forced by the market but by governmental intervention, is
intensified. Interventions, particularly for small and medium-sized
The pharmaceutical market
8 0
I n t e r v e n t i o n sin the p h a r m a -ceutical market - o u t l o o k
rz_pharma_2009_en.qxd 02.03.2010 10:34 Uhr Seite 82

companies, mean big threats. The laborious attempt of other
industrial sectors of dissolving the process of oligopoly formation
is actually counteracted in the health care sector where oligopolies’
structures are even fostered by law.
Furthermore, the complexity of the overall system has reached
such an extent that it is barely identifiable anymore what effects,
in detail, resulted from which governmental intervention.
A cost containment policy fails to highlight the contribution of the
pharmaceutical industry towards the treatment of diseases and
the perception of Germany as an industrial location with high
competitiveness.
Future growth potential is predicted for novel therapies of bio-
medicine, genetic medicine and tissue engineering. Even though
these approaches are only at the start of their development, legal
stipulations for their approval at EU-level have already been set.
The Act on reinforcing SHI Competition (GKV-WSG) among the
SHI system clearly shows that the government, through new
instruments, continues to strive to control and regulate market
excess of innovative, thus higher-priced pharmaceutical drugs.
As of August 2008, the new instrument of a second opinion was
introduced by the Federal Joint Committee (G-BA), comprising
those pharmaceutical drugs that can be included in this process:
primarily Orphan Drugs, highly effective new pharmaceutical drug
therapies and procedures with higher costs or, which from the
standpoint of the G-BA, involve higher risks, that are, e.g. used
for the treatment of tumor and auto-immune diseases. This
means that, aside from better control of possible side effects, it
is the price of pharmaceutical drugs that becomes a criterion of
additional social legislative control.
The pharmaceutical market
8 1
rz_pharma_2009_en.qxd 02.03.2010 10:35 Uhr Seite 83

This new instrument constitutes
a further example for how the
government, by applying contin-
ously new measures, keeps
interfering with reimbursement
situations of innovative products,
and hence, once more damages
a very essential requirement for
R&D, namely planning. The instru-
ment of maximum reimburse-
ment amounts for innovative phar-
maceutical drugs constitutes an
additional intervention. In the
segment of Orphan Drugs, the
BPI (due to a missing therapeutic
alternative) was able to achieve
that there would be no set
amount of maximum reimburse-
ment.
With the 15th Amendment of the German Medicines Law (15. AMG-
Novelle), the government has also undertaken further changes in
the area of Compassionate Use, i.e. the provision of pharma-
ceuticals in the cases of life-threatening illnesses prior to their
approval. In the future, these pharmaceutical drugs must be
made available to patients in need free–of-charge by the phar-
maceutical entrepreneur, so long as there is no therapeutic alter-
native. This leads to a considerate financial burden, especially in
the cases of medium-sized companies. The provisioning entitle-
ment of patients, for whom other types of therapies with an
approved pharmaceutical are usually not available, is politically
negated.
8 2
The pharmaceutical market
rz_pharma_2009_en.qxd 02.03.2010 10:35 Uhr Seite 84

A glance at the European legislative calendar shows that the
EU ordinance for pharmaceuticals for novel therapy forms was
published in the official gazette of the EU in late 2007, following
intense discussions, and was applied in late 2008. With this, a
uniform legal framework has been created inside the EU for the
examination and approval of genetic therapeutic agents, cellular
therapeutic agents and biotechnologically processed tissue
products (tissue engineered products). In general, these products
were subjected to the European drug product law. The BPI, in
discussions at a national and a European level, has intensively
become involved and has been able to bring about important
changes, like an extended transition period for products already
on the market, or extended financial aid for small and medium-
sized companies. On the other hand, requirements for the
companies, owing to the now obligatory, central approval via the
EMEA, have greatly increased. Owing to an initiative of the BPI,
h o w e v e r, an option was provided in the EC law, according to
which companies do not routinely produce these pharmaceutical
drugs, that the companies may obtain a national approval at the
PEI and/or the respective competent authority in other member
states. For small, innovative firms this option can significantly ease
market entry with patient safety requirements remaining equal.
Further provisions and the approval procedure, were codified in
the German drug law with the 15th Amendment, with intense
involvement of the BPI.
The pharmaceutical market
8 3
rz_pharma_2009_en.qxd 02.03.2010 10:35 Uhr Seite 85
Addition categories
B i o e n g i n e e r i n g
B i o p h a r m a c e u t i c a l s
Clinical trails
E m p l o y e e s
European Union
E x p o r t s
External trade
G e n e r i c s
Global pharmaceutical market
Health care system
I m p o r t s
I n n o v a t i o n
Number of pharmaceutical drugs
Orphan drugs
O T C
Package size
P a t e n t s
Pharmaceutical drug prices
I n d e x
Pharma-Data 2009
8 4
_ _ _ _ _ _ _ _ _ _ _ _ _ _ _ _ _ _ _ 61, 70
_ _ _ _ _ _ _ _ _ _ _ _ _ _ _ _ _ _ _ _ _ _ _ _ 29
_ _ _ _ _ _ _ _ _ _ _ _ _ _ _ _ _ _ _ 70-71
_ _ _ _ _ _ _ _ _ _ _ _ _ _ _ _ _ _ _ _ _ _ _ 28, 31
_ _ _ _ _ _ _ _ _ _ _ _ _ _ _ _ _ _ _ _ _ _ _ _ 15, 49
_ _ _ _ _ _ _ _ _ _ _ 19-20, 31-34, 37, 41, 62
_ _ _ _ _ _ _ _ _ _ _ _ _ _ _ _ _ _ _ _ _ _ _ _ 10, 12-13
_ _ _ _ _ _ _ _ _ _ _ _ _ _ _ _ _ _ _ _ _ _ _ _ _13
_ _ _ _ _ _ _ _ _ _ _ _ _ _ _ _ _ _ _ _ _ 29, 55, 65, 75
_ _ _ _ _ _ _ _ _ _ _ _ _ _ _ _ 36
_ _ _ _ _ _ _ _ _ _ _ _ _ _ 7, 22, 29, 44-59
_ _ _ _ _ _ _ _ _ _ _ _ _ _ _ _ _ _ _ _ _ _ _ _ _ _ 10, 12
_ _ _ _ _ _ _ _ _ _ _ _ _ _ _ _ _ _ _ _ _ _ 17-29, 37
_ _ _ _ _ _ _ _ _ _ _ _ _ 78-80
_ _ _ _ _ _ _ _ _ _ _ _ _ _ _ _ _ _ _ _ _ _ 81-82
_ _ _ _ _ _ _ _ _ _ _ _ _ _ _ _ _ _ _ 43, 49, 54, 60, 66-69
_ _ _ _ _ _ _ _ _ _ _ _ _ _ _ _ _ _ _ _ _ _ _ 73-75
_ _ _ _ _ _ _ _ _ _ _ _ _ _ _ _ _ _ _ _ _ _ _ 16, 17, 27
_ _ _ _ _ _ _ _ _ _ _ _ _ _ _ _ _ 42
rz_pharma_2009_en.qxd 02.03.2010 10:35 Uhr Seite 86
Pharmaceutical market
Pharmaceutical production
P h a r m a c o v i g i l a n c e
Pharmacy market
Portfolio contracts
Rebate / discount contracts
Red hand letter (“Rote Hand Brief”)
Reference price
Research and development
Rote Liste
Safety data
Self medication
SHI obligatory discounts
SHI pharmaceutical market
SHI structural component
Side effects
S t a f f
S t a t u t o ry Health Insurance (SHI)
Value added tax (VAT )
_ _ _ _ _ _ 7, 29, 36-41, 60-65, 80-83
_ _ _ _ _ _ _ _ _ _ _ _ _ _ _ _ 8, 10
_ _ _ _ _ _ _ _ _ _ _ _ _ _ _ _ _ _ _ _ 30-34
_ _ _ _ _ _ _ _ _ _ _ _ _ _ 25, 60, 63, 66-69
_ _ _ _ _ _ _ _ _ _ _ _ _ _ _ _ _ _ _ _ _ _ 59
_ _ _ _ _ _ _ _ 5, 50, 54, 56-59, 76
_ _ _ _ _ _ _ _ _ _ _ _ _ _ 35
_ _ _ _ _ _ _ _ _ _ _ _ _ _ _ _ _ _ _ 54, 59, 77
_ 14-15, 18-23, 27-28, 65, 76, 82
_ _ _ _ _ _ _ _ _ _ _ _ _ _ _ _ _ _ _ _ _ _ _ _ 78-79
_ _ _ _ _ _ _ _ _ _ _ _ _ _ _ _ _ _ _ _ _ _ _ _ _ _ 34
_ _ _ _ _ _ _ _ _ _ _ _ _ _ _ _ _ _ _ 64-65, 79
_ _ _ _ _ _ _ _ _ _ _ _ _ _ _ _ _ _ _ 54
_ _ _ _ _ _ _ _ _ _ _ _ _ 53, 70-76
_ _ _ _ _ _ _ _ _ _ _ _ _ _ _ _ 73-77
_ _ _ _ _ _ _ _ _ _ _ _ _ _ _ _ _ _ _ _ _ _ 30-35, 81
_ _ _ _ _ _ _ _ _ _ _ _ _ _ _ _ _ _ _ 4, 8, 9, 11, 27, 46, 62
_ _ _ _ _ _ _ 47, 49-50, 52-59
_ _ _ _ _ _ _ _ _ _ _ _ _ _ 42-43, 48, 53
Pharma-Data 2009
8 5
rz_pharma_2009_en.qxd 02.03.2010 10:35 Uhr Seite 87

A K G Arzneimittel und Kooperation im Gesundheitswesen (Pharmaceuticals and Cooperation in the Health Care Sector)
A M G Azneimittelgesetz (German Medicines Act)
A O K Allgemeine Ortskrankenkasse (a German public health insurance company)
ATC Code Anatomic Therapeutic Chemical Classification
AV P Apothekenverkaufspreis (pharmacy retail price)
AV W G A r z n e i m i t t e l v e r s o r g u n g s -Wirtschaftlichkeitsgesetz (Economic Optimization of Pharmaceutical Care Act)
B f A r M Bundesinstitut für Arzneimittel und M e d i z i n p r o d u k t e
B i l l . B i l l i o n
B I P G D P
B M B F Bundesministerium für Bildung und Forschung(Federal Ministry of Research and Education)
B M G Bundesministerium für Gesundheit (Federal Ministry of Health)
B P I Bundesverband der PharmazeutischenIndustrie e. V. (German Association for Pharmaceutical Industry)
D D D Defined Daily Dose
D R G s Diagnosis Related Groups
E F P I A European Federation of Pharmaceutical I n d u s t ry and Associations
E M E A European Medicines Agency
E U European Union
F & E R & D
F S A Freiwillige Selbstkontrolle Arzneimittelindustrie( Vo l u n t a ry Self-regulation for thePharmaceutical Industry )
A c ro n y m s
Pharma-Data 2009
8 6
rz_pharma_2009_en.qxd 02.03.2010 10:35 Uhr Seite 88

G - B A Gemeinsamer Bundesausschuss (Federal Joint Committee)
G K V Gesetzliche Krankenversicherung( S t a t u t o ry Health Insurance)
G K V- O r g W G Gesetz zur Weiterentwicklung der Organisationsstrukturen in der Gesetzlichen Krankenversicherung(Act to enhance the organizational Structures of Statutory Health Insurance)
G K V- W S G G K V- We t t b e w e r b s s t ä r k u n g s g e s e t z(SHI Competition Reinforcement law)
G M G G K V- M o d e r n i s i e r u n g s g e s e t z(SHI System Modernization Act)
G M S G e s u n d h e i t s m i t t e l s t u d i e(health product study)
G W B Gesetz gegen We t t b e w e r b s b e s c h r ä n k u n g e n(Act against Restraints of Competition)
H A P Herstellerabgabepreis (manufacturer price)
I G E S Institut für Gesundheits- und Sozialforschung(a R&D institute for health and healthcare)
I M S IMS HEALTH GmbH & Co. OHG
Insight Health INSIGHT Health Management GmbH
L C D Local currency Dollar
M i o . M i l l i o n s
M w S t . VAT
NCE / NBE New Chemical or New Biological Entities
O T C O v e r- t h e - c o u n t e r / s e l f - m e d i c a t i o n
O R Outcomes Research
P E Packungseinheit (package unit; PU)
P E I P a u l - E h r l i c h - I n s t i t u t e
P h y t o Phytopharmaceuticals
Pharma-Data 2009
8 7
rz_pharma_2009_en.qxd 02.03.2010 10:35 Uhr Seite 89

P K V Private Krankenversicherung(Private health insurance)
SGB V Sozialgesetzbuch (Code of Social Law) V
S G G Sozialgerichtsgesetz (Social Court Code)
U AW Unerwünschte Arzneimittelwirkung(undesired effect of a pharmaceutical drug)
W H O World Health Organisation
W i d O Wissenschaftliches Institut derO r t s k r a n k e n k a s s e n(Scientific institute of the AOKs)
A c ro n y m s
Pharma-Data 2009
8 8
rz_pharma_2009_en.qxd 02.03.2010 10:35 Uhr Seite 90

Pharma-Data 2009
8 9
rz_pharma_2009_en.qxd 02.03.2010 10:35 Uhr Seite 91
P u b l i s h e r :
Bundesverband derPharmazeutischen Industrie e.V. (BPI)
Friedrichstraße 148
10117 Berlin
G e r m a n y
Phone: +49 30 2 79 09 - 0
Fax: +49 30 2 79 09 - 3 61
E - M a i l : i n f o @ b p i . d e
Internet: www. b p i . d e
Design: Netrixx Communications GmbH, Hamburg
3 9t h revised edition, September 2009
rz_pharma_2009_en.qxd 02.03.2010 10:35 Uhr Seite 92