physical exposure of the santa barbara county coastline · what makes cosmos unique? • explicit,...
TRANSCRIPT
U.S. Department of the Interior U.S. Geological Survey
Patrick Barnard, Li Erikson,
Juliette Finzi Hart, Amy Foxgrover, Liv Herdman, Patrick Limber, Andy
O’Neill, Sean Vitousek, and Jonathan Warrick
Pacific Coastal and Marine Science
Center, Santa Cruz, CA
Physical Exposure of the Santa Barbara County Coastline
Collaborators and funders:

Isla Vista, CA, March 8, 2016 (Dave Hubbard)
What is CoSMoS? • Physics-based numerical modeling system for assessing coastal hazards
due to climate change
• Ongoing development for the last decade
• Utilizes models that have been developed over the past several decades
• Predicts coastal hazards for the full range of sea level rise (0-2, 5 m) and storm possibilities (up to 100 yr storm) using sophisticated global climate and ocean modeling tools
• Emphasis on directly supporting federal and state-supported climate change guidance (e.g., Coastal Commission) and vulnerability assessments (e.g., LCP updates, OPC/Coastal Conservancy grants)
• Designed for community-scale planning
2
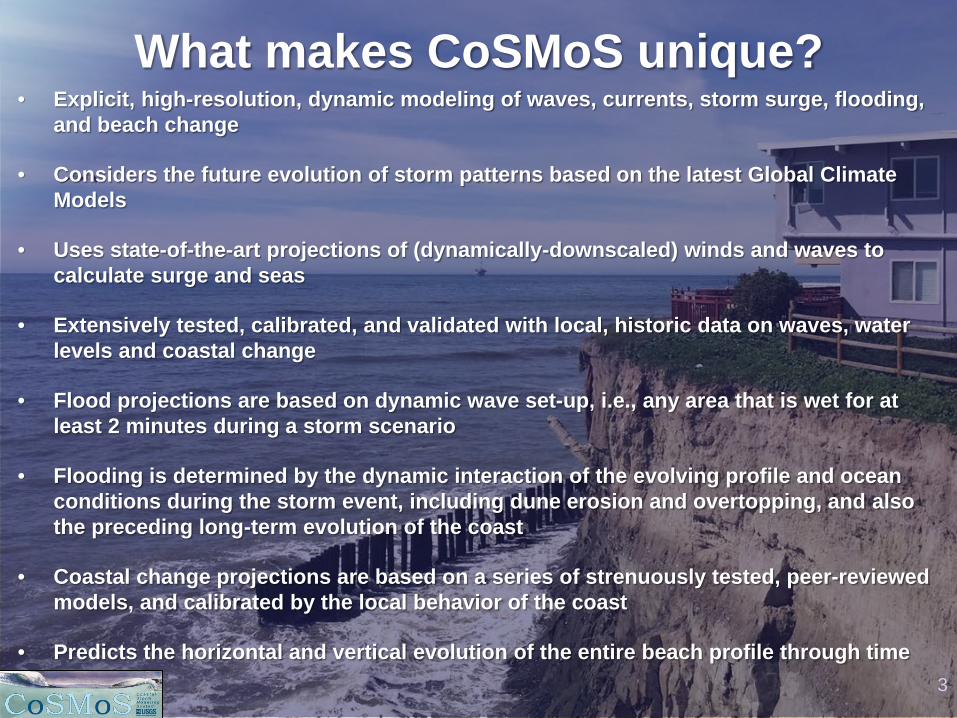
What makes CoSMoS unique? • Explicit, high-resolution, dynamic modeling of waves, currents, storm surge, flooding,
and beach change
• Considers the future evolution of storm patterns based on the latest Global Climate Models
• Uses state-of-the-art projections of (dynamically-downscaled) winds and waves to calculate surge and seas
• Extensively tested, calibrated, and validated with local, historic data on waves, water levels and coastal change
• Flood projections are based on dynamic wave set-up, i.e., any area that is wet for at least 2 minutes during a storm scenario
• Flooding is determined by the dynamic interaction of the evolving profile and ocean conditions during the storm event, including dune erosion and overtopping, and also the preceding long-term evolution of the coast
• Coastal change projections are based on a series of strenuously tested, peer-reviewed models, and calibrated by the local behavior of the coast
• Predicts the horizontal and vertical evolution of the entire beach profile through time
3

Where has CoSMoS been applied?
4
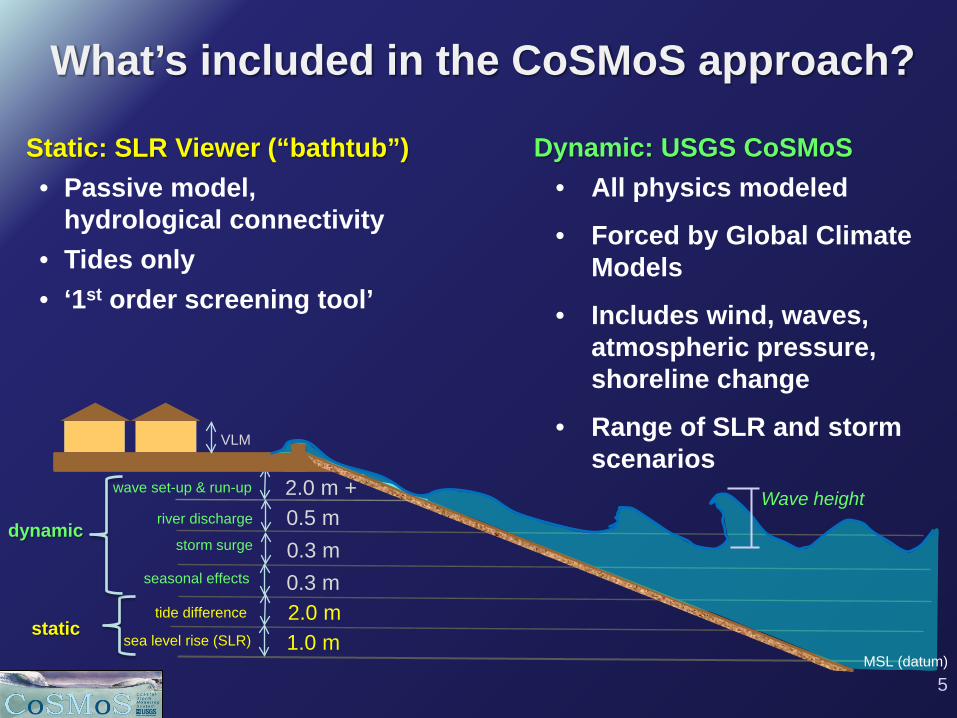
What’s included in the CoSMoS approach?
Static: SLR Viewer (“bathtub”) • Passive model,
hydrological connectivity • Tides only • ‘1st order screening tool’
sea level rise (SLR)
tide difference
seasonal effects
storm surge
river discharge
wave set-up & run-up Wave height
1.0 m 2.0 m 0.3 m 0.3 m 0.5 m 2.0 m +
MSL (datum)
static
dynamic
VLM
Dynamic: USGS CoSMoS • All physics modeled
• Forced by Global Climate Models
• Includes wind, waves, atmospheric pressure, shoreline change
• Range of SLR and storm scenarios
5

Global climate models (GCMs) Tides, water levels,
and regional forcing
results projected onto hi-res DEM
XBEACH
Ope
n co
ast
Long-term cliff recession and
shoreline change
SWAN wave model
WW3 wave model
Delft3D FLOW model
GCM winds FLOW-WAVE
Global Local Regional
High resolution hydrodynamics, waves, &
fluvial discharge
SIO downscaled winds and SLPs
CoSMoS 3.0 Southern California
6

CoSMoS Validation • Extensive historical data
including storms Nov/Dec 1982 Dec 2005 Jan 2010
• Water levels – tide gauges
• Waves – buoys
• Wave runup
• Storm-driven morphodynamic change – XBeach
• Long-term shoreline change – CoSMoS Coast • Santa Barbara Littoral Cell
Coastal Processes Study (2005-present) 7

8
DEM and Computational Grids
DEM: 2 m horizontal resolution
Hydrodynamic grids: fine to 16 m

• A (hybrid) numerical model to simulate long-term shoreline evolution • Modeled processes include:
- Longshore sediment transport - Cross-shore sediment transport - Effects of sea-level rise - Sediment supply by natural & anthropogenic sources
CoSMoS-COAST: Coastal One-line Assimilated Simulation Tool
10
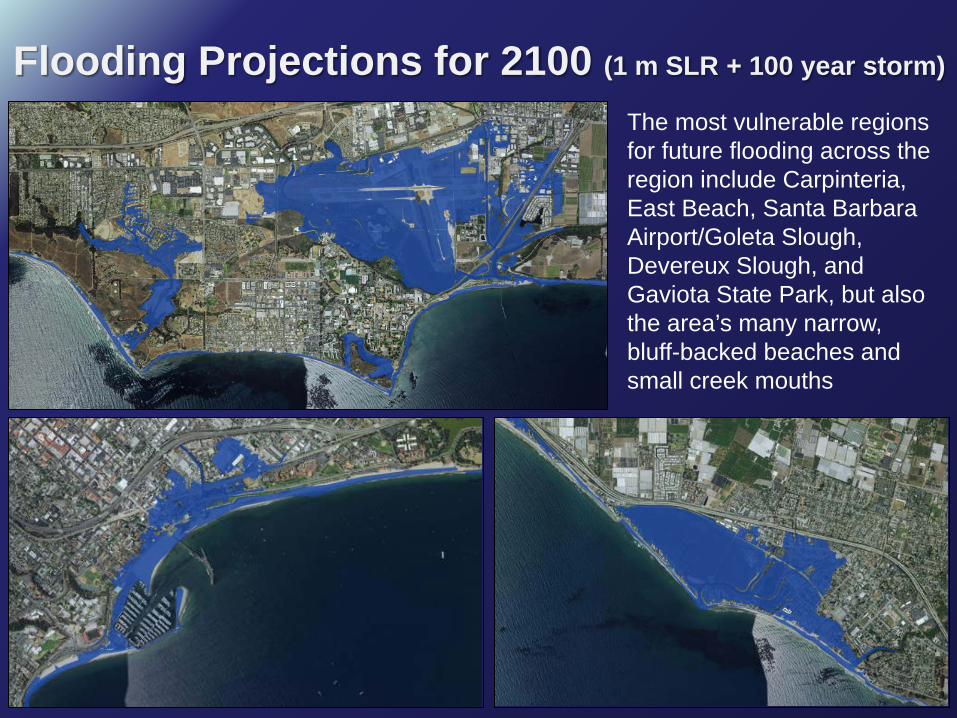
Flooding Projections for 2100 (1 m SLR + 100 year storm)
The most vulnerable regions for future flooding across the region include Carpinteria, East Beach, Santa Barbara Airport/Goleta Slough, Devereux Slough, and Gaviota State Park, but also the area’s many narrow, bluff-backed beaches and small creek mouths
11
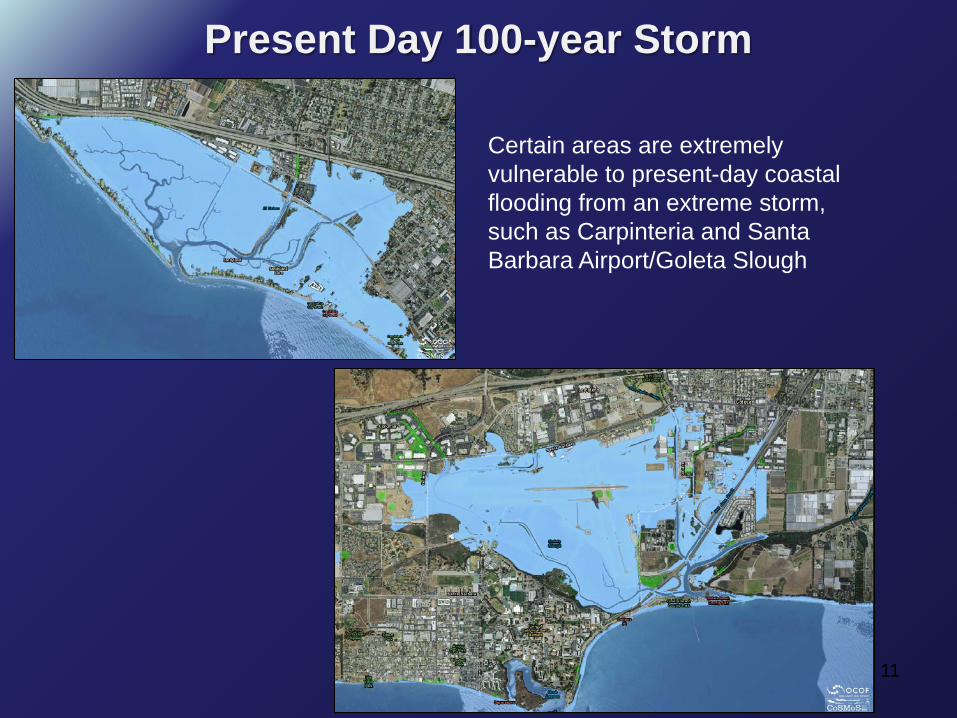
Present Day 100-year Storm
Certain areas are extremely vulnerable to present-day coastal flooding from an extreme storm, such as Carpinteria and Santa Barbara Airport/Goleta Slough
12
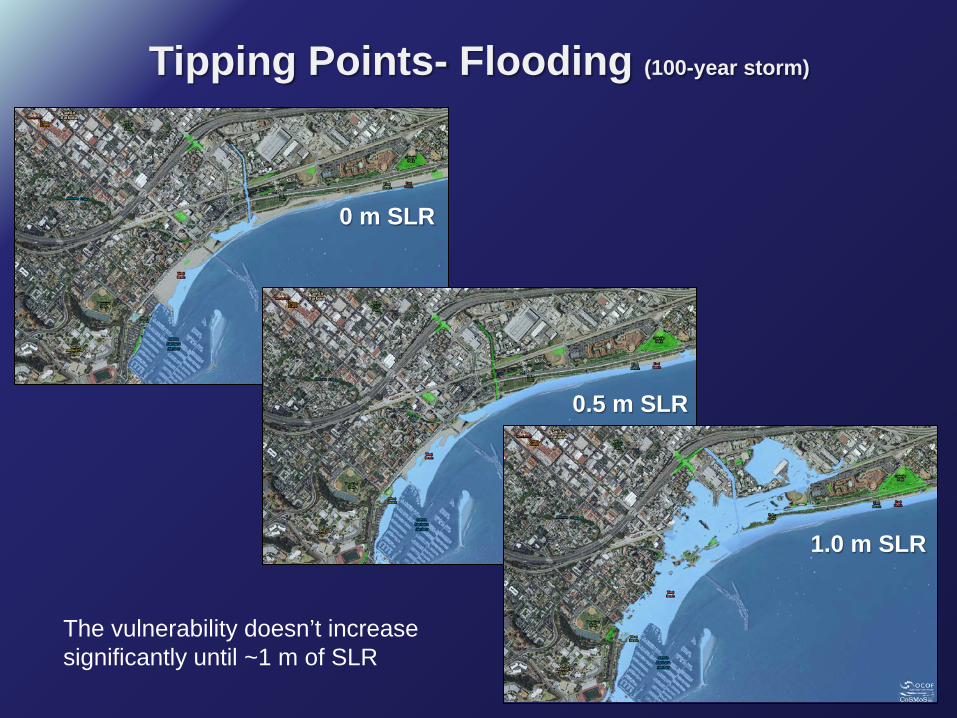
Tipping Points- Flooding (100-year storm)
The vulnerability doesn’t increase significantly until ~1 m of SLR
0 m SLR
0.5 m SLR
1.0 m SLR
13
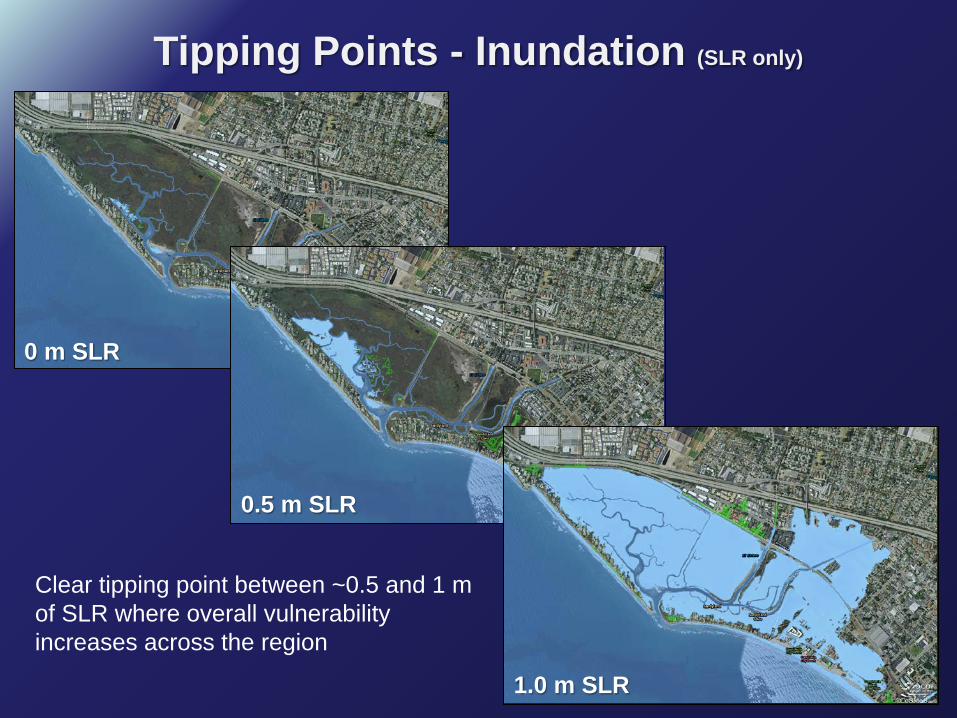
Tipping Points - Inundation (SLR only)
0 m SLR
0.5 m SLR
1.0 m SLR
Clear tipping point between ~0.5 and 1 m of SLR where overall vulnerability increases across the region
14
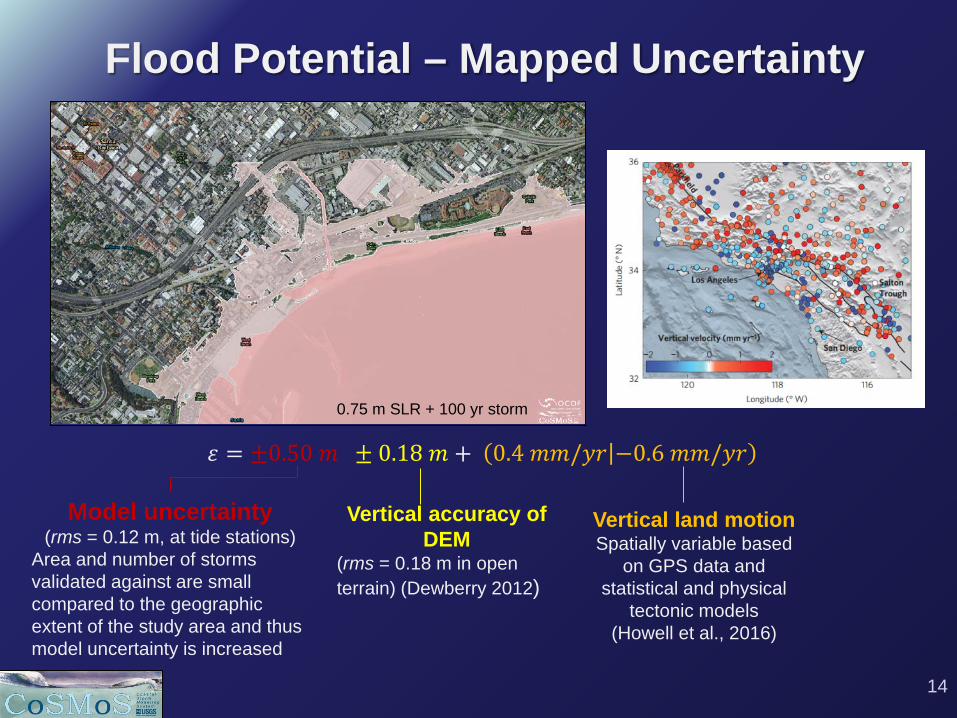
Flood Potential – Mapped Uncertainty
𝜀 = ±0.50 𝑚 ± 0.18 𝑚 + 0.4 𝑚𝑚/𝑦𝑦 −0.6 𝑚𝑚/𝑦𝑦
Model uncertainty (rms = 0.12 m, at tide stations)
Area and number of storms validated against are small compared to the geographic extent of the study area and thus model uncertainty is increased
Vertical accuracy of DEM
(rms = 0.18 m in open terrain) (Dewberry 2012)
Vertical land motion Spatially variable based
on GPS data and statistical and physical
tectonic models (Howell et al., 2016)
0.75 m SLR + 100 yr storm
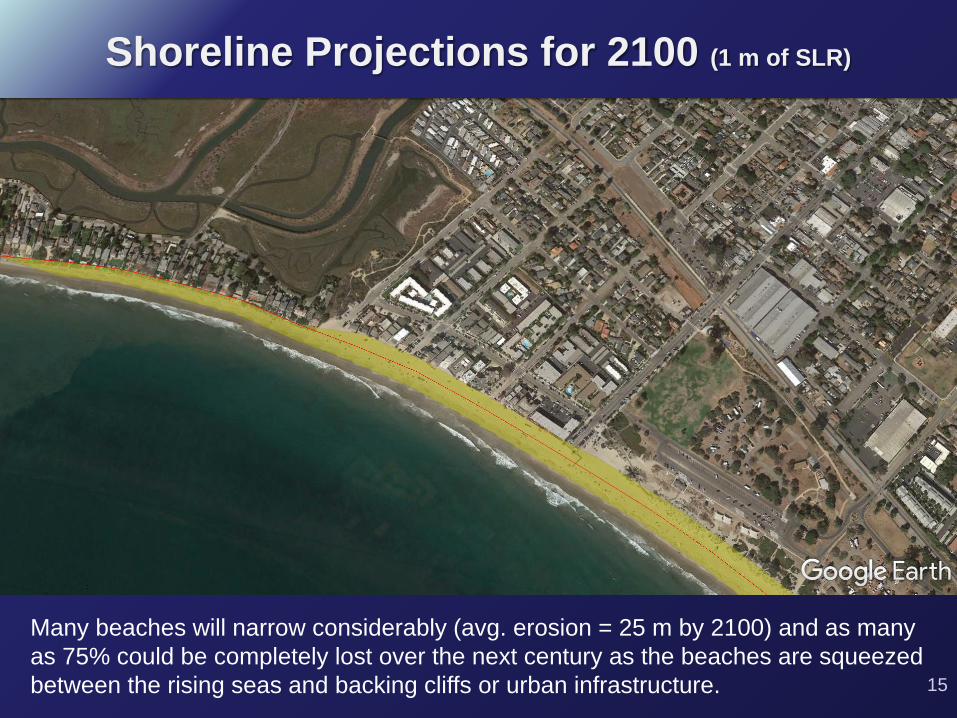
Shoreline Projections for 2100 (1 m of SLR)
15
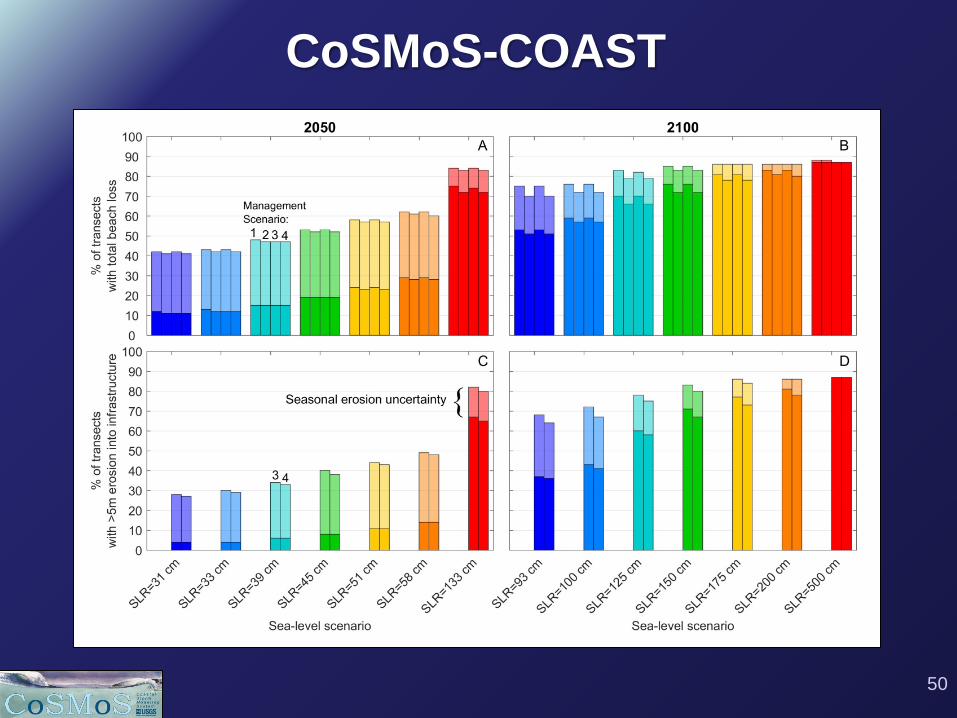
Many beaches will narrow considerably (avg. erosion = 25 m by 2100) and as many as 75% could be completely lost over the next century as the beaches are squeezed between the rising seas and backing cliffs or urban infrastructure.
16
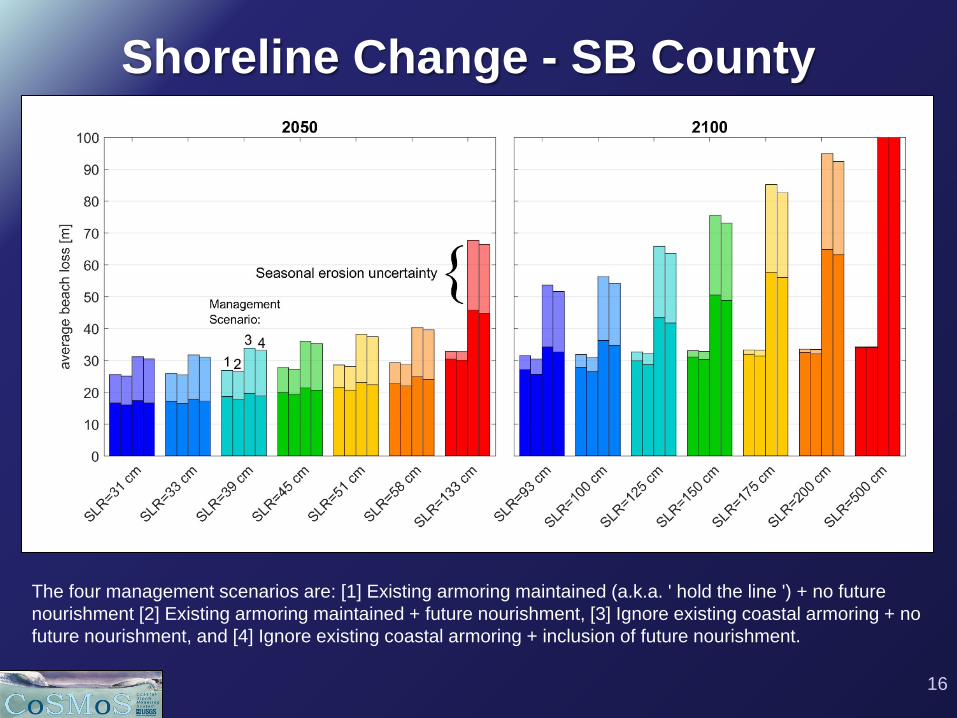
Shoreline Change - SB County
The four management scenarios are: [1] Existing armoring maintained (a.k.a. ' hold the line ') + no future nourishment [2] Existing armoring maintained + future nourishment, [3] Ignore existing coastal armoring + no future nourishment, and [4] Ignore existing coastal armoring + inclusion of future nourishment.

Cliff Retreat Projections
17
Cliff retreat will increasingly pose a significant hazard across the region, as 1 m of SLR could increase retreat rates by ~55% over historical rates to ~0.3 m/yr.
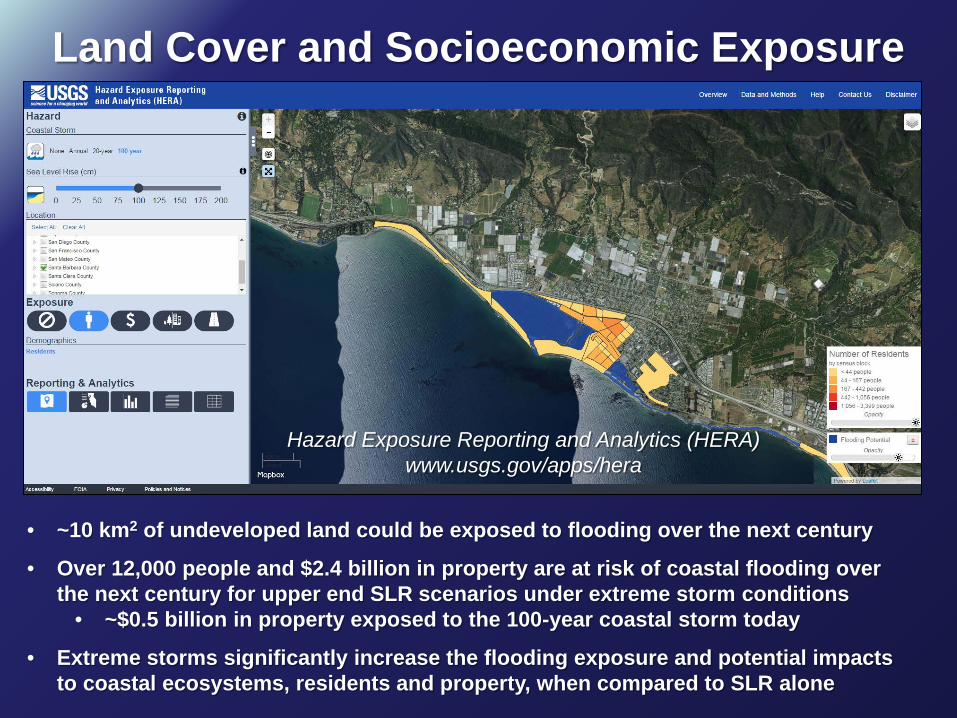
Land Cover and Socioeconomic Exposure
Hazard Exposure Reporting and Analytics (HERA) www.usgs.gov/apps/hera
• ~10 km2 of undeveloped land could be exposed to flooding over the next century
• Over 12,000 people and $2.4 billion in property are at risk of coastal flooding over the next century for upper end SLR scenarios under extreme storm conditions
• ~$0.5 billion in property exposed to the 100-year coastal storm today
• Extreme storms significantly increase the flooding exposure and potential impacts to coastal ecosystems, residents and property, when compared to SLR alone
19
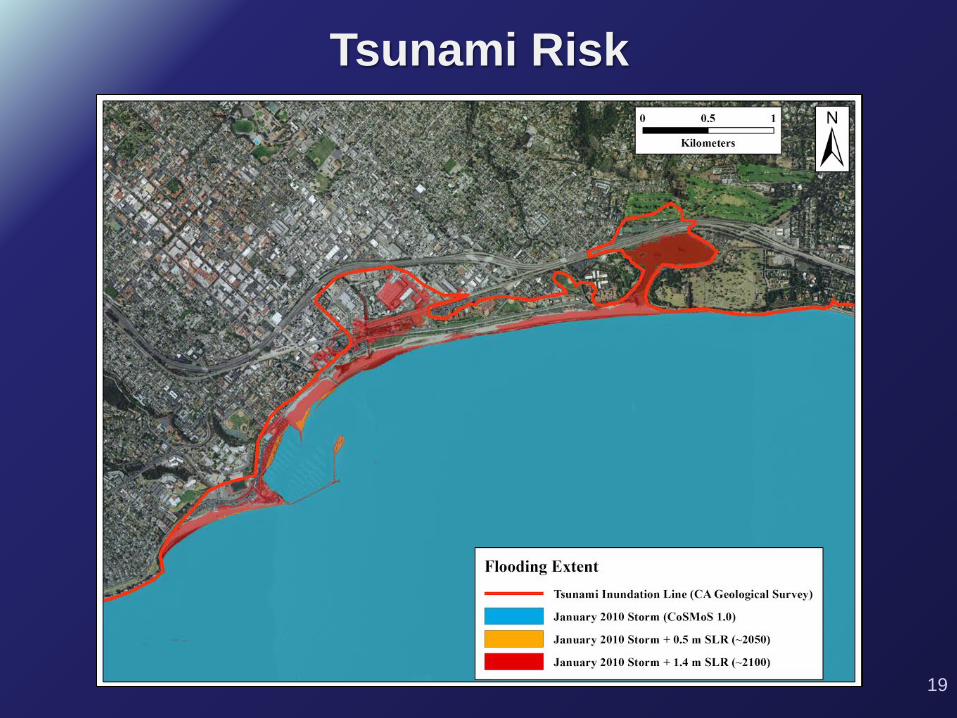
Tsunami Risk

20
Future Conditions SLR for Los Angeles (National Research Council) -28 cm of sea level rise by 2050 (range 13-61 cm) -93 cm of sea level rise by 2100 (range 44-167 cm) -includes global and regional effects Pending State SLR Guidance for 2100 -21 cm to 61 cm of sea level rise by 2050 -55 cm to 305 cm of sea level rise by 2100 Waves -No significant changes in wave height, possible decrease -More south swell influence Atmospheric Patterns -Potential for more extreme El Niño events -Storm tracks moving north Sediment Inputs -Episodic (normal) -Longer droughts but higher intensity rainfall events
D. Hubbard IV sand levels
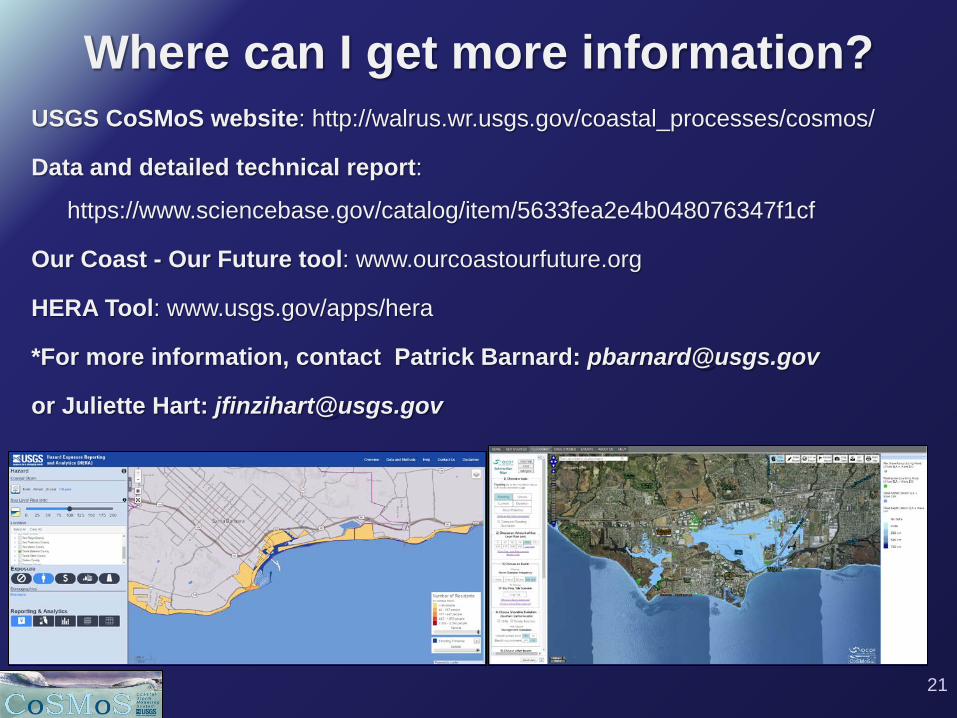
Where can I get more information? USGS CoSMoS website: http://walrus.wr.usgs.gov/coastal_processes/cosmos/
Data and detailed technical report:
https://www.sciencebase.gov/catalog/item/5633fea2e4b048076347f1cf
Our Coast - Our Future tool: www.ourcoastourfuture.org
HERA Tool: www.usgs.gov/apps/hera
*For more information, contact Patrick Barnard: [email protected]
or Juliette Hart: [email protected]
21

22
Questions?
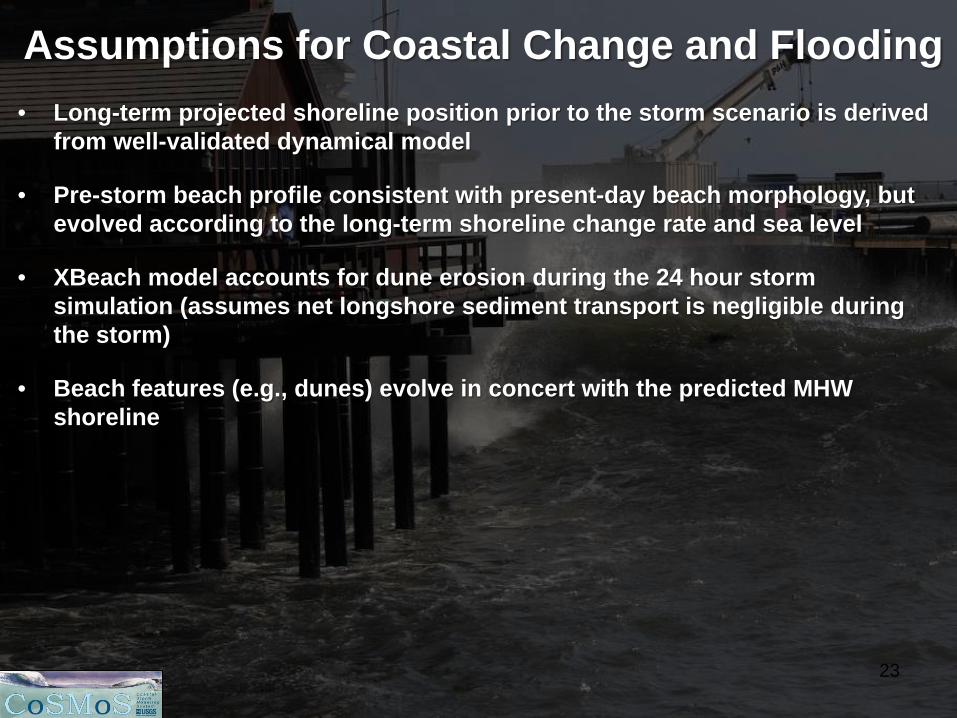
Assumptions for Coastal Change and Flooding • Long-term projected shoreline position prior to the storm scenario is derived
from well-validated dynamical model
• Pre-storm beach profile consistent with present-day beach morphology, but evolved according to the long-term shoreline change rate and sea level
• XBeach model accounts for dune erosion during the 24 hour storm simulation (assumes net longshore sediment transport is negligible during the storm)
• Beach features (e.g., dunes) evolve in concert with the predicted MHW shoreline
23

Long-term Morphodynamic Change: Profile Evolution
Sandy beaches
Cliffs Erikson, et al., submitted. Coastal Dynamics.
24
25
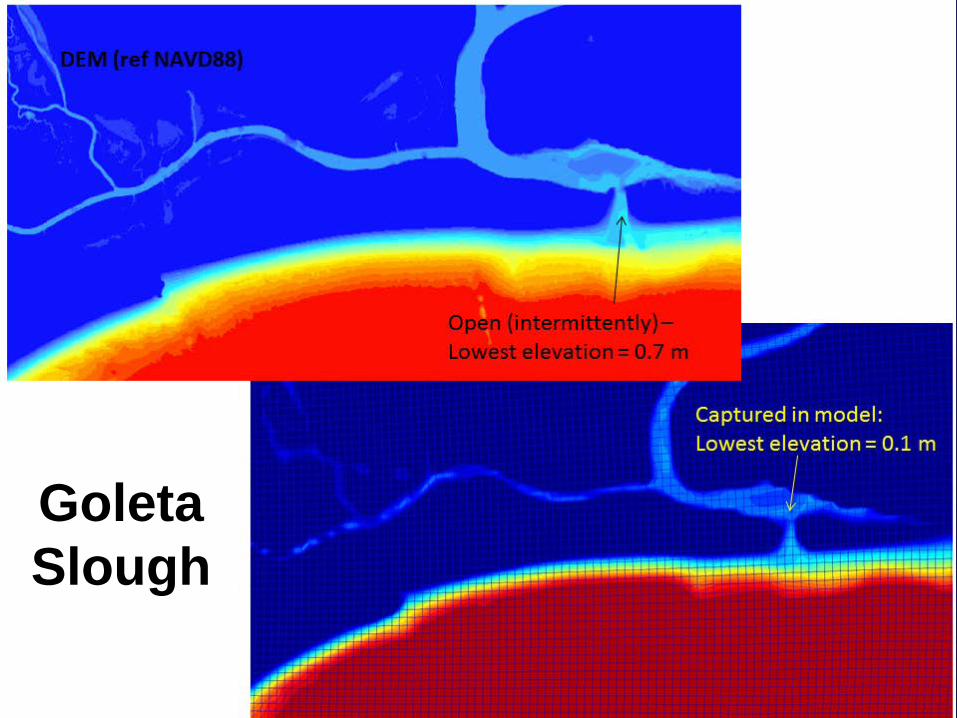
Goleta Slough
Supporting References (peer-reviewed)
Barnard, P.L., van Ormondt, M., Erikson, L.H., Eshleman, J., Hapke, C., Ruggiero, P., Adams, P.N. and Foxgrover, A.C., 2014. Development of the Coastal Storm Modeling System (CoSMoS) for predicting the impact of storms on high-energy, active-margin coasts. Natural Hazards, Volume 74 (2), p. 1095-1125, http://dx.doi.org/10.1007/s11069-014-1236-y Erikson, L.H., Hegermiller, C.A., Barnard, P.L., Ruggiero, P. and van Ormondt, M., 2015. Projected wave conditions in the Eastern North Pacific under the influence of two CMIP5 climate scenarios. Ocean Modeling, Volume 96, p. 171-185, http://dx.doi.org/10.1016/j.ocemod.2015.07.004 Limber, P., Barnard, P.L. and Hapke, C., 2015. Towards projecting the retreat of California’s coastal cliffs during the 21st Century. In: P. Wang, J.D. Rosati and J. Cheng (Eds.), Coastal Sediments 2015 Conference Proceedings, World Scientific, 14 pp., http://dx.doi.org/10.1142/9789814689977_0245 Vitousek, S. and Barnard, P.L., 2015. A non-linear, implicit one-line model to predict long-term shoreline change. In: P. Wang, J.D. Rosati and J. Cheng (Eds.), Coastal Sediments 2015 Conference Proceedings, World Scientific, 14 pp., http://dx.doi.org/10.1142/9789814689977_0215 Hegermiller, C.A., Antolinez, J.A.A., Rueda, A.C., Camus. P., Perez, J., Erikson, L.H., Barnard, P.L. and Mendez, F.J., 2016. A multimodal wave spectrum-based approach for statistical downscaling of local wave climate. Journal of Physical Oceanography, http://dx.doi.org/10.1175/JPO-D-16-0191.1 Hoover, D.J., Odigie, K.O., Swarzenski, P.W. and Barnard, P.L., 2016. Sea level rise and coastal groundwater inundation and shoaling at select sites in California. Journal of Hydrology: Regional Studies, 16 pp., http://dx.doi.org/10.1016/j.ejrh.2015.12.055 Danielson, J.J., Poppenga, S.K., Brock, J.C., Evans, G.A., Tyler, D.J., Gesch, D.B., Thatcher, C.A., and Barras, J.A., 2016, Topobathymetric elevation model development using a new methodology—Coastal National Elevation Database: Journal of Coastal Research, SI no. 76, p. 75–89, at http://dx.doi.org/10.2112/SI76-008 Palaseanu-Lovejoy, M., Danielson, J., Thatcher, C., Foxgrover, A., Barnard, P.L., Brock, J. and Young, A., 2016. Automatic delineation of seacliff limits using Lidar-derived high-resolution DEMs in Southern California. Journal of Coastal Research, Special Issue Volume 76, p. 162-173, http://dx.doi.org/10.2112/SI76-014 Thatcher, C.A., Brock, J.C., Danielson, J.J., Poppenga, S.K., Gesch, D.B., Palaseanu-Lovejoy, M.E., Barras, J.A., Evans, G.A., and Gibbs, A.E., 2016, Creating a Coastal National Elevation Database (CoNED) for science and conservation applications: Journal of Coastal Research, SI no. 76, p. 64–74, at http://dx.doi.org/10.2112/SI76-007 Vitousek, S., Barnard, P.L., Limber, P., Erikson, L.H. and Cole, B., in press. A model integrating longshore and cross-shore processes for predicting long-term shoreline response to climate change. Journal of Geophysical Research-Earth Surface, http://dx.doi.org/10.1002/2016JF004065
26
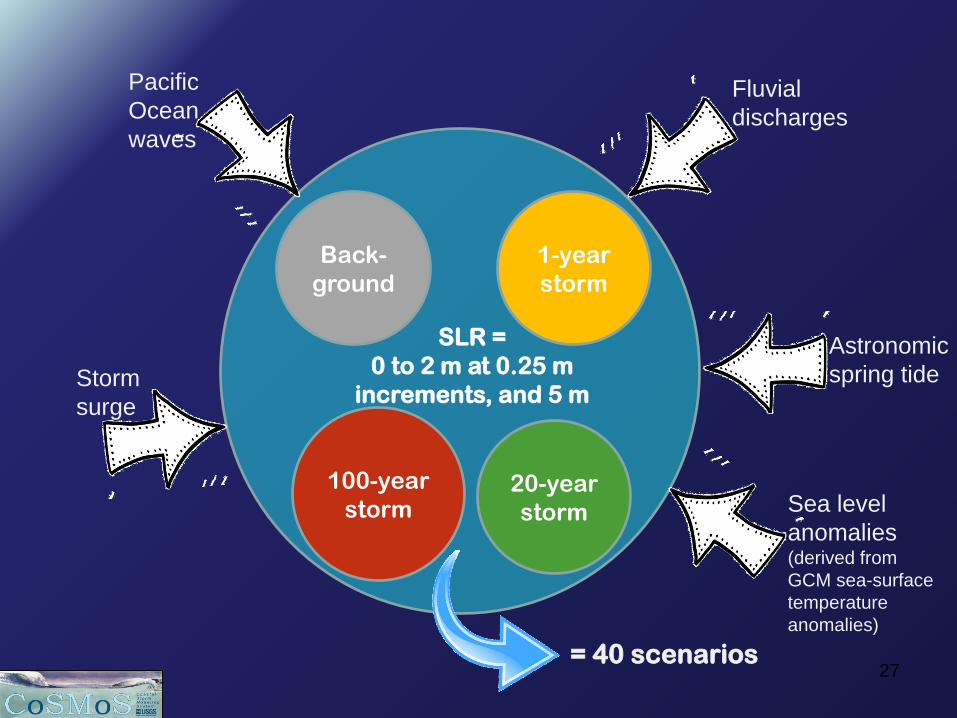
Pacific Ocean waves
Storm surge
Sea level anomalies (derived from GCM sea-surface temperature anomalies)
Astronomic spring tide
Fluvial discharges
SLR = 0 to 2 m at 0.25 m
increments, and 5 m
Back-ground
1-year storm
100-year storm
20-year storm
= 40 scenarios 27
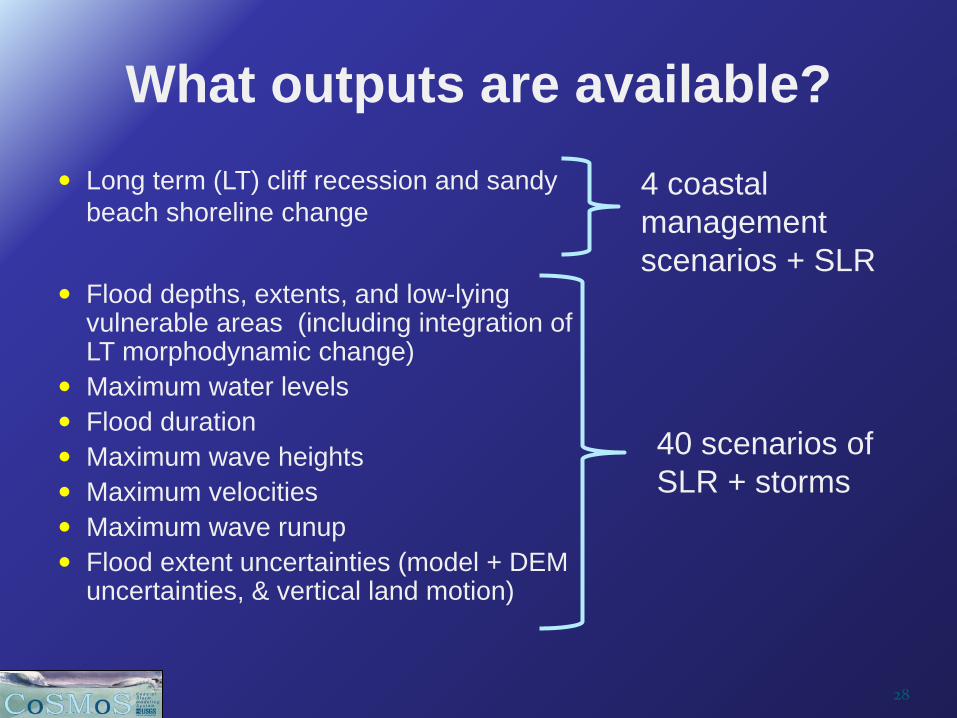
What outputs are available? Long term (LT) cliff recession and sandy
beach shoreline change
Flood depths, extents, and low-lying vulnerable areas (including integration of LT morphodynamic change)
Maximum water levels Flood duration Maximum wave heights Maximum velocities Maximum wave runup Flood extent uncertainties (model + DEM
uncertainties, & vertical land motion)
4 coastal management scenarios + SLR
40 scenarios of SLR + storms
28
29
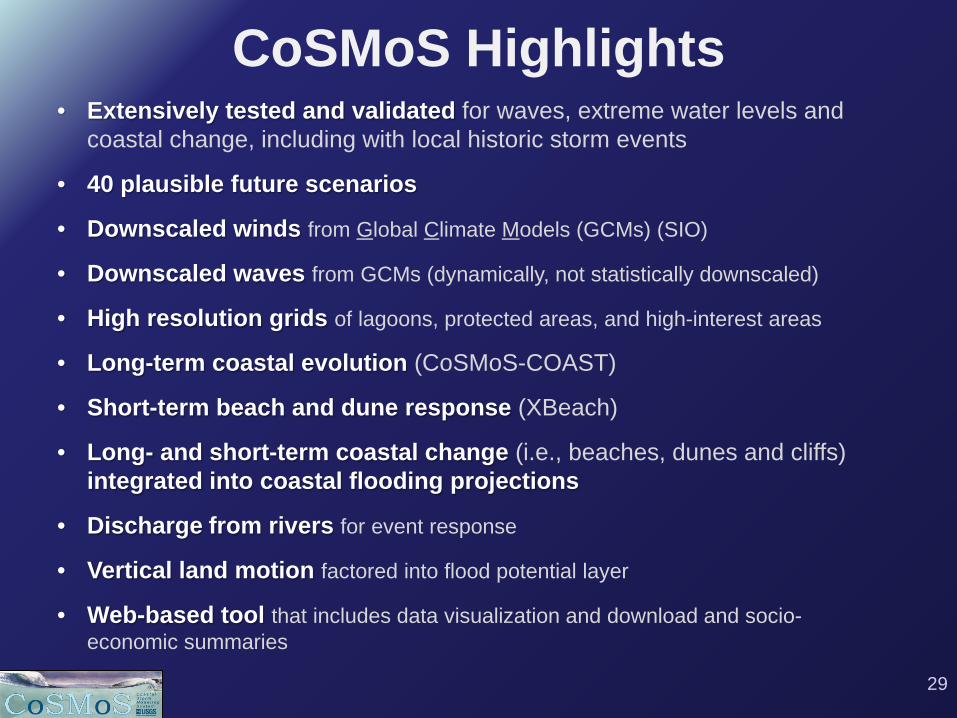
• Extensively tested and validated for waves, extreme water levels and coastal change, including with local historic storm events
• 40 plausible future scenarios
• Downscaled winds from Global Climate Models (GCMs) (SIO)
• Downscaled waves from GCMs (dynamically, not statistically downscaled)
• High resolution grids of lagoons, protected areas, and high-interest areas
• Long-term coastal evolution (CoSMoS-COAST)
• Short-term beach and dune response (XBeach)
• Long- and short-term coastal change (i.e., beaches, dunes and cliffs) integrated into coastal flooding projections
• Discharge from rivers for event response
• Vertical land motion factored into flood potential layer
• Web-based tool that includes data visualization and download and socio-economic summaries
CoSMoS Highlights

Who uses CoSMoS? County • Sonoma County • Marin County • Santa Mateo County • Santa Clara County • Santa Barbara County • Los Angeles County
• Office of Emergency Management
• Department of Beaches and Harbors
• San Diego County
State • California Coastal Commission • California Coastal Conservancy • California Department of
Emergency Services (CalOES) • California Department of Fish &
Wildlife • California Department of
Transportation (CalTrans) • California Energy Commission • California Natural Resources
Agency • California Ocean Protection
Council
Federal • National Park Service • NOAA Gulf of Farallones National Marine
Sanctuary • NOAA Office for Coastal Management • National Estuarine Research Reserve (NOAA) 30
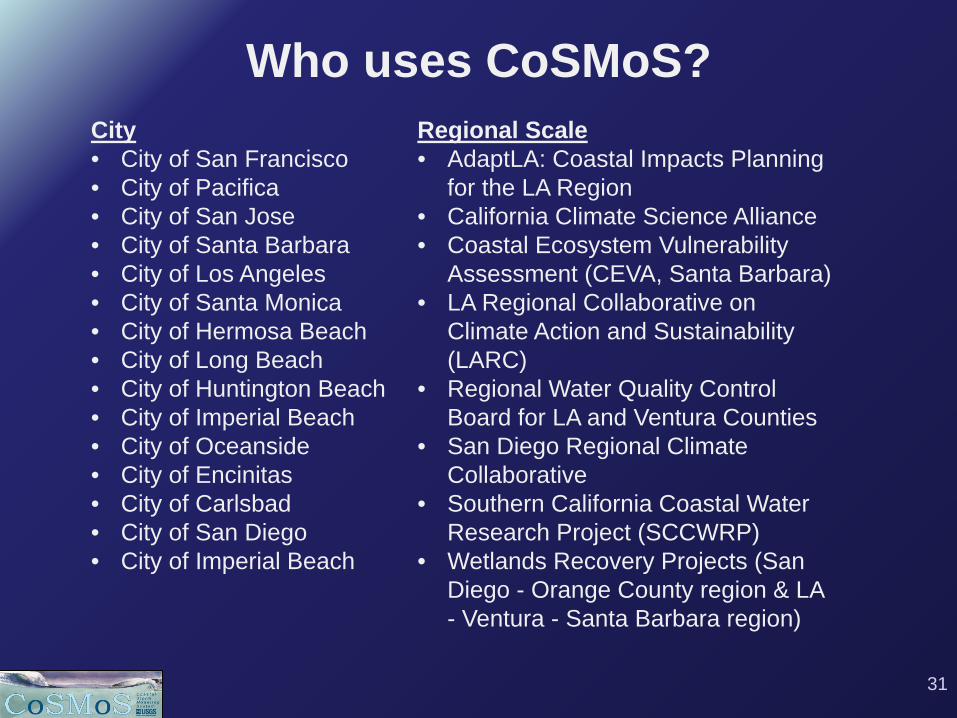
City • City of San Francisco • City of Pacifica • City of San Jose • City of Santa Barbara • City of Los Angeles • City of Santa Monica • City of Hermosa Beach • City of Long Beach • City of Huntington Beach • City of Imperial Beach • City of Oceanside • City of Encinitas • City of Carlsbad • City of San Diego • City of Imperial Beach
Regional Scale • AdaptLA: Coastal Impacts Planning
for the LA Region • California Climate Science Alliance • Coastal Ecosystem Vulnerability
Assessment (CEVA, Santa Barbara) • LA Regional Collaborative on
Climate Action and Sustainability (LARC)
• Regional Water Quality Control Board for LA and Ventura Counties
• San Diego Regional Climate Collaborative
• Southern California Coastal Water Research Project (SCCWRP)
• Wetlands Recovery Projects (San Diego - Orange County region & LA - Ventura - Santa Barbara region)
Who uses CoSMoS?
31
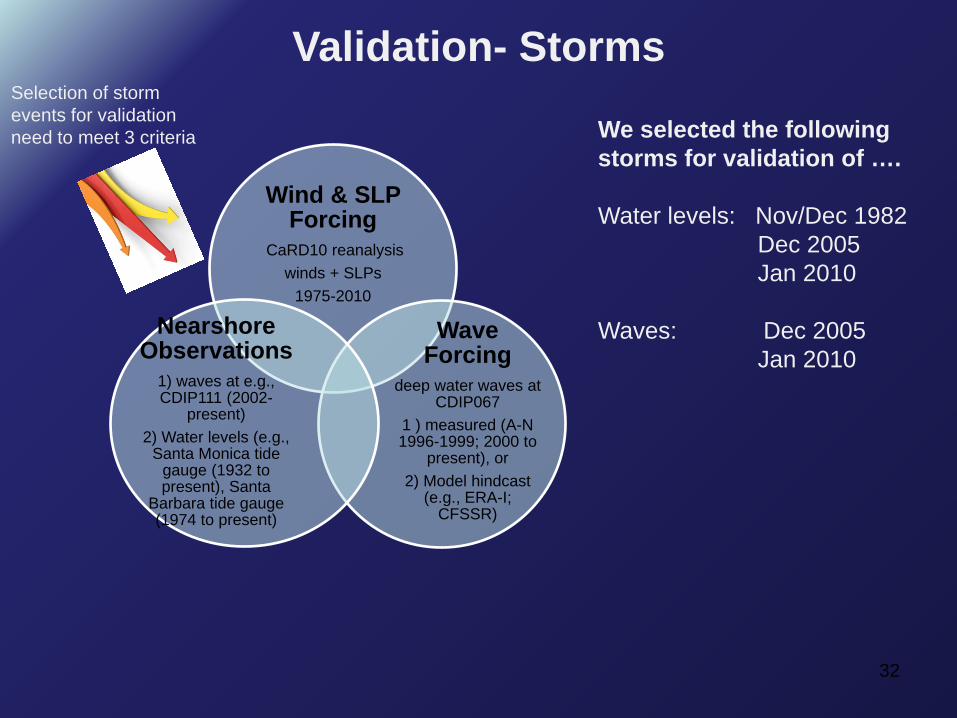
Validation- Storms
Wind & SLP Forcing
CaRD10 reanalysis winds + SLPs
1975-2010
Wave Forcing
deep water waves at CDIP067
1 ) measured (A-N 1996-1999; 2000 to
present), or 2) Model hindcast
(e.g., ERA-I; CFSSR)
Nearshore Observations
1) waves at e.g., CDIP111 (2002-
present) 2) Water levels (e.g.,
Santa Monica tide gauge (1932 to present), Santa
Barbara tide gauge (1974 to present)
We selected the following storms for validation of …. Water levels: Nov/Dec 1982 Dec 2005 Jan 2010 Waves: Dec 2005 Jan 2010
Selection of storm events for validation need to meet 3 criteria
32
CoSMoS model components and performance validated :
• Extensive historical data including storms Nov/Dec 1982 Dec 2005 Jan 2010
• Water levels – across the Bight
• Waves – buoys
• Wave runup
• Storm-driven morphodynamic change – XBeach
• Long-term shoreline change – CoSMoS Coast
33
storm surge
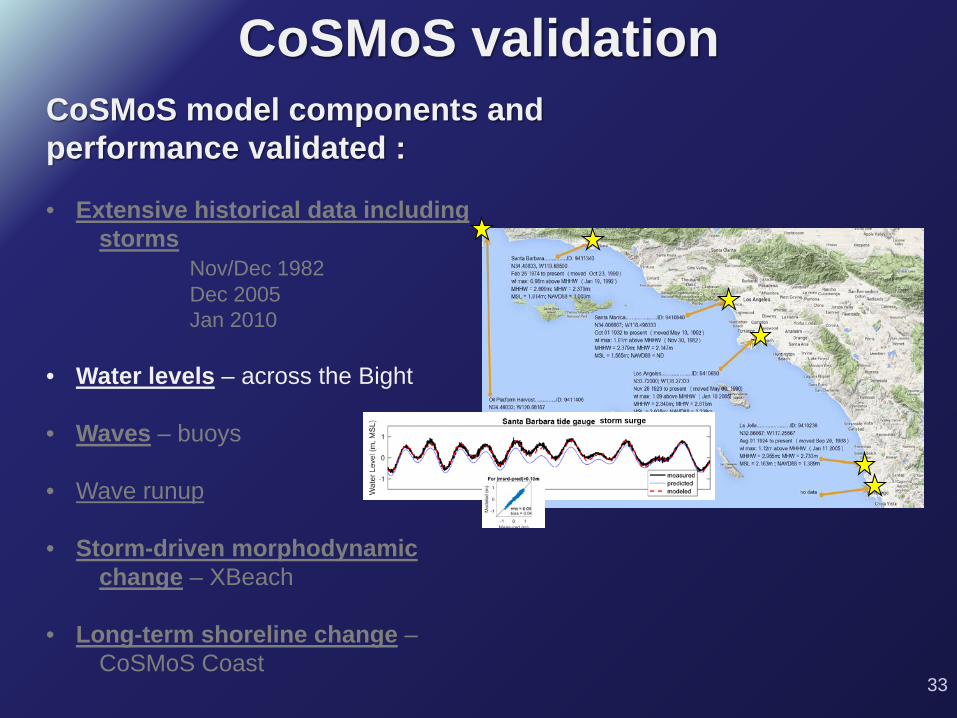
CoSMoS validation
CoSMoS model components and performance validated :
• Extensive historical data including storms Nov/Dec 1982 Dec 2005 Jan 2010
• Water levels – across the Bight
• Waves – buoys
• Wave runup
• Storm-driven morphodynamic change – XBeach
• Long-term shoreline change – CoSMoS Coast
34
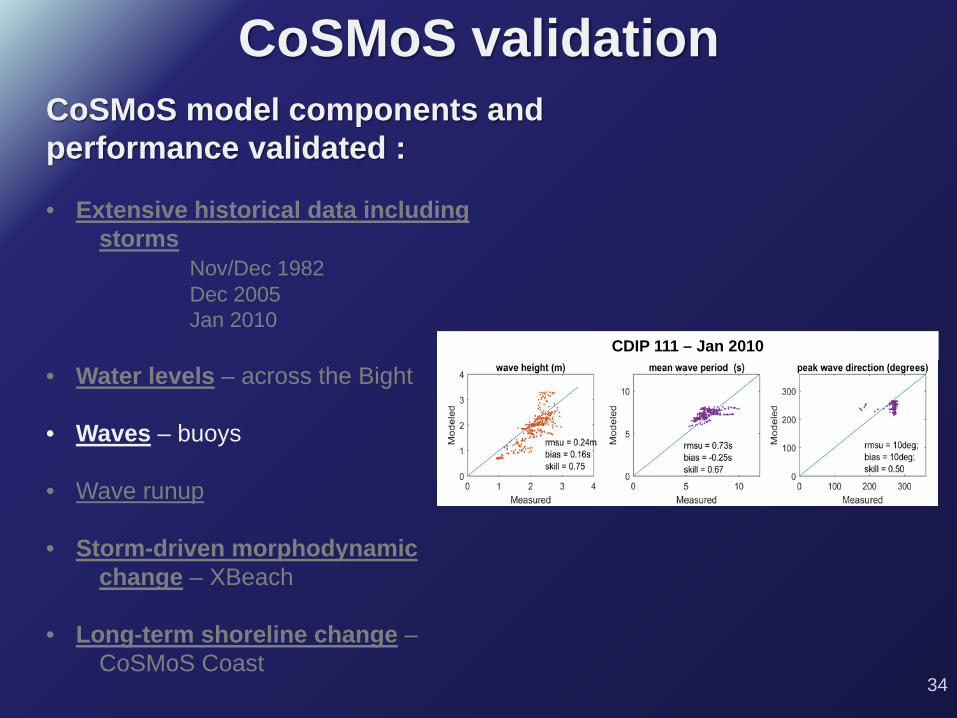
CDIP 111 – Jan 2010
CoSMoS validation

CoSMoS model components and performance validated :
• Extensive historical data including storms Nov/Dec 1982 Dec 2005 Jan 2010
• Water levels – across the Bight
• Waves – buoys
• Wave runup
• Storm-driven morphodynamic change – XBeach
• Long-term shoreline change – CoSMoS Coast
35
Ocean Beach Runup Comparisons (May 2006)
rms values XBeach rms: 0.12 m Emp Runup: 0.22 m
CoSMoS validation
CoSMoS model components and performance validated :
• Extensive historical data including storms Nov/Dec 1982 Dec 2005 Jan 2010
• Water levels – across the Bight
• Waves – buoys
• Wave runup
• Storm-driven morphodynamic change – XBeach
• Long-term shoreline change – CoSMoS Coast
36
00.10.20.30.40.50.60.70.80.9
1
Xbea
ch S
kill
Brie
r Ski
ll S
core
s great
good
fair
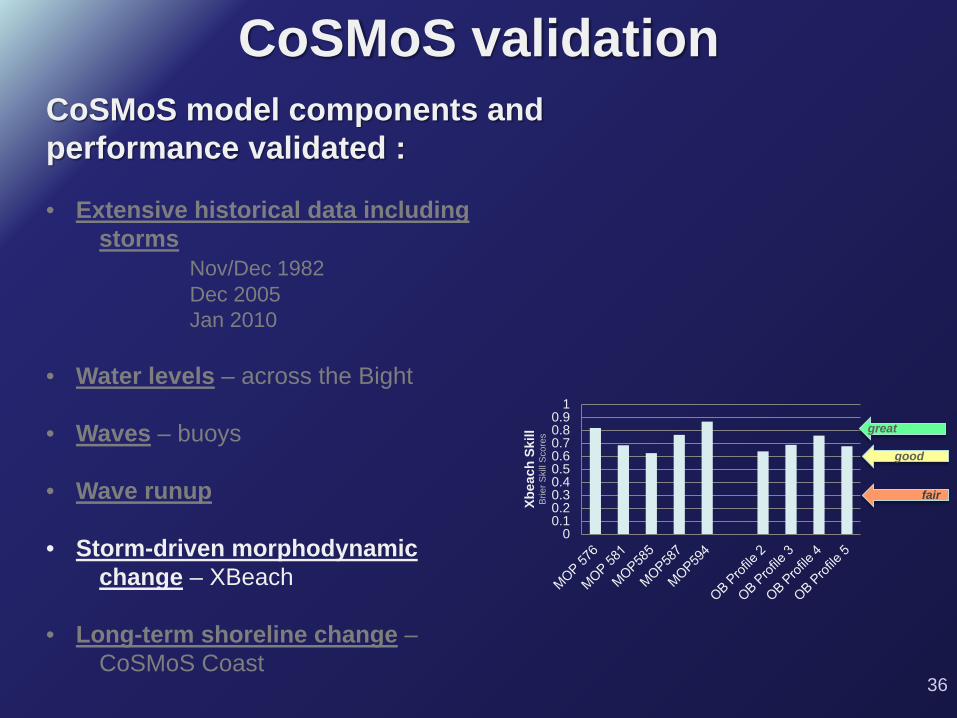
CoSMoS validation

CoSMoS model components and performance validated :
• Extensive historical data including storms Nov/Dec 1982 Dec 2005 Jan 2010
• Water levels – across the Bight
• Waves – buoys
• Wave runup
• Storm-driven morphodynamic change – XBeach
• Long-term shoreline change – CoSMoS-COAST
37
← hindcast ….. forecast →
CoSMoS validation

0 km 50 km 100 km
Los Angeles
San
Die
go
Santa Barbara Point Conception
39% 30% 22% 9%
95% 3% 2% 0%
Selection of Storm Events
Erikson, et al., in review
• 21st century time series generated for all non-tidal water level components
• Output every 100 m at 10 m contour to determine local return periods
38

LOCATIONS FOR WATER LEVEL VALIDATIONS
39

ASTRONOMIC TIDE VALIDATION
40
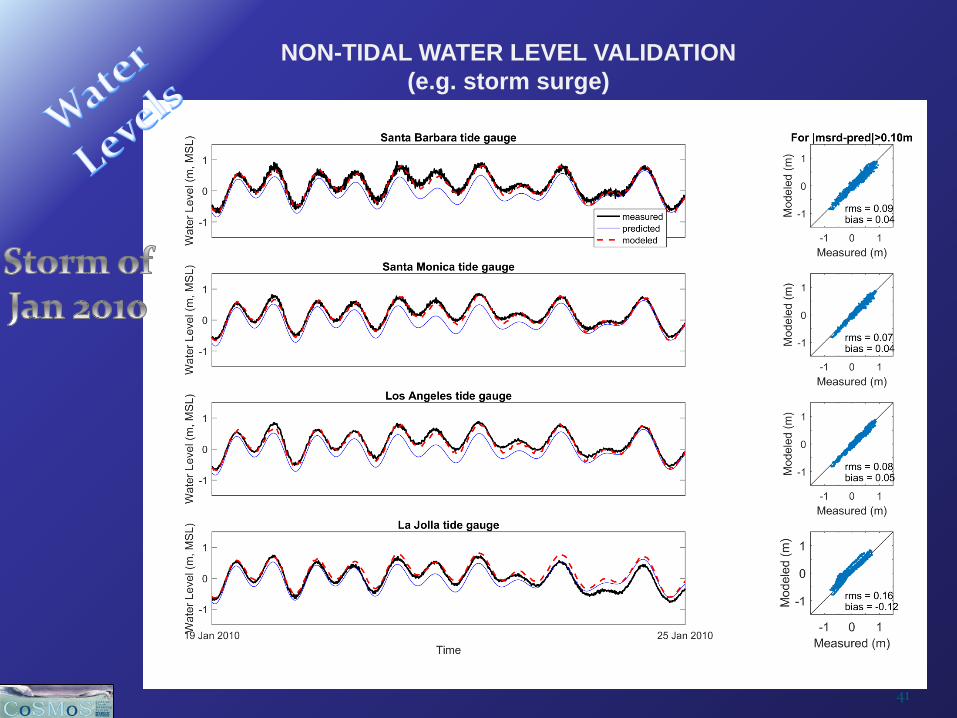
NON-TIDAL WATER LEVEL VALIDATION (e.g. storm surge)
41

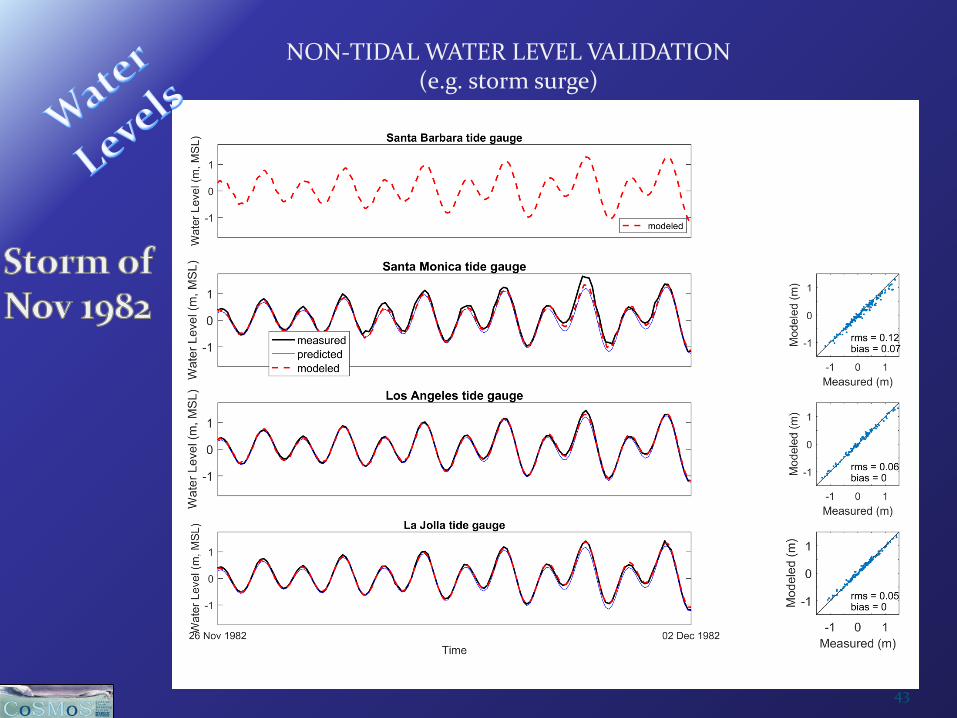
NON-TIDAL WATER LEVEL VALIDATION (e.g. storm surge)
42
NON-TIDAL WATER LEVEL VALIDATION (e.g. storm surge)
43
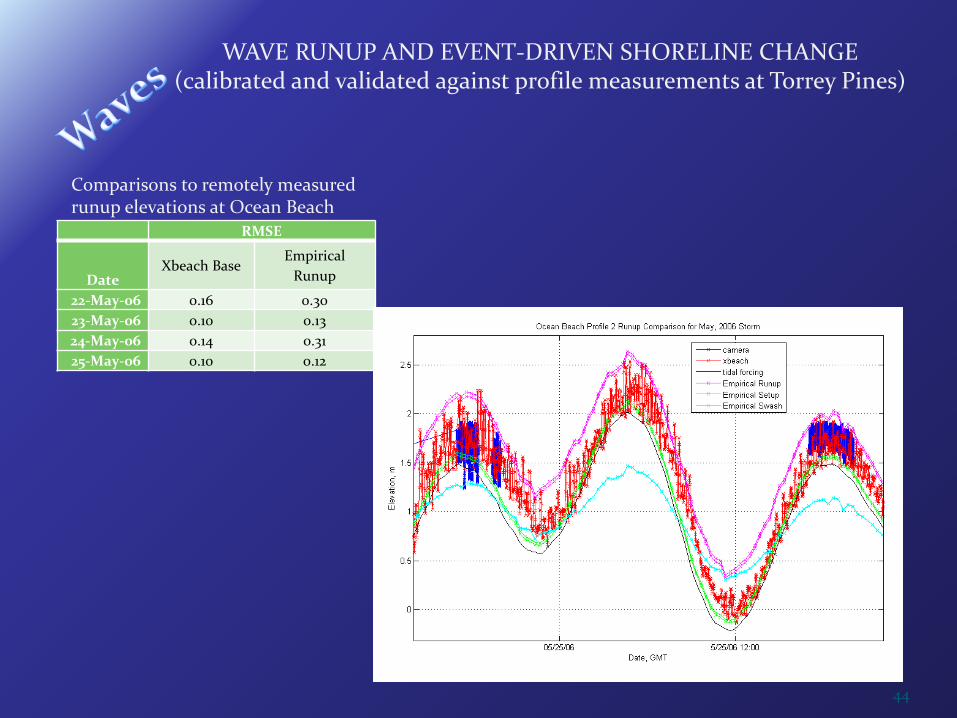
WAVE RUNUP AND EVENT-DRIVEN SHORELINE CHANGE (calibrated and validated against profile measurements at Torrey Pines)
RMSE
Date Xbeach Base
Empirical Runup
22-May-06 0.16 0.30 23-May-06 0.10 0.13 24-May-06 0.14 0.31 25-May-06 0.10 0.12
Comparisons to remotely measured runup elevations at Ocean Beach
44
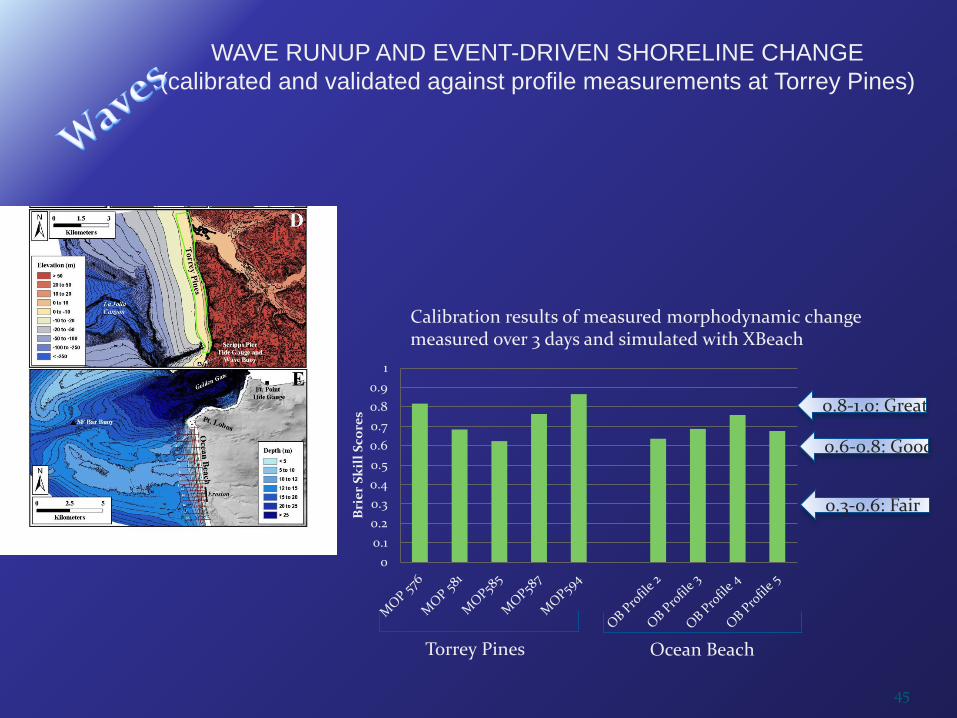
WAVE RUNUP AND EVENT-DRIVEN SHORELINE CHANGE (calibrated and validated against profile measurements at Torrey Pines)
00.10.20.30.40.50.60.70.80.9
1B
rier
Ski
ll S
core
s
0.3-0.6: Fair
0.8-1.0: Great
0.6-0.8: Good
Torrey Pines Ocean Beach
Calibration results of measured morphodynamic change measured over 3 days and simulated with XBeach
45
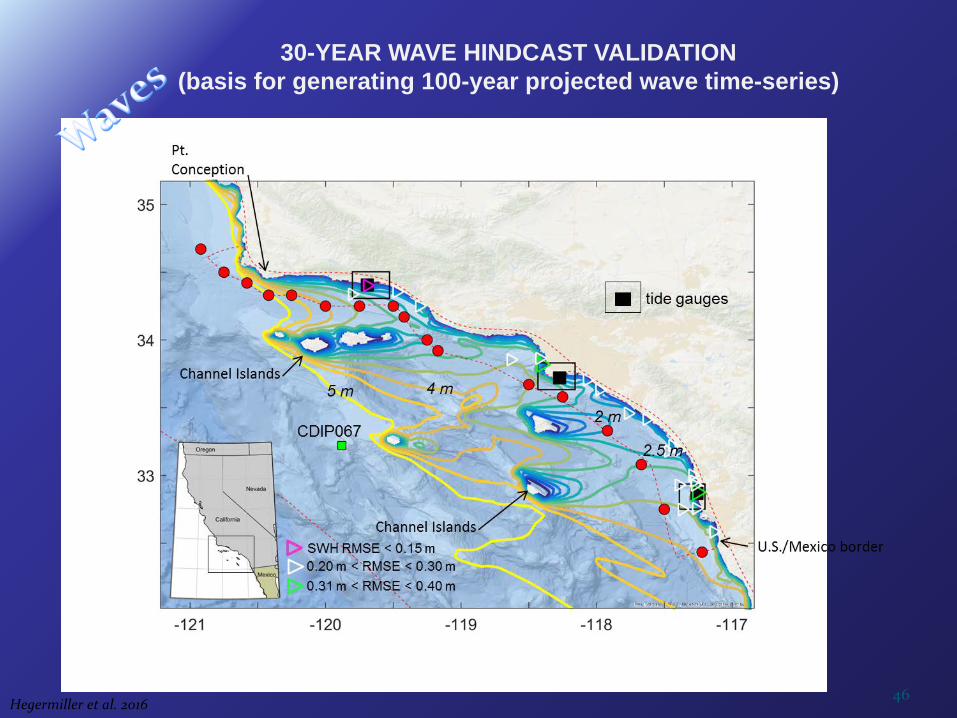
30-YEAR WAVE HINDCAST VALIDATION (basis for generating 100-year projected wave time-series)
Hegermiller et al. 2016 46

CoSMoS uses this one (best fit in the extremes)
30-YEAR HISTORICAL DEEP WATER WAVE CLIMATE VALIDATION (basis for generating 100-year projected wave time-series)
Erikson et al. 2015 47
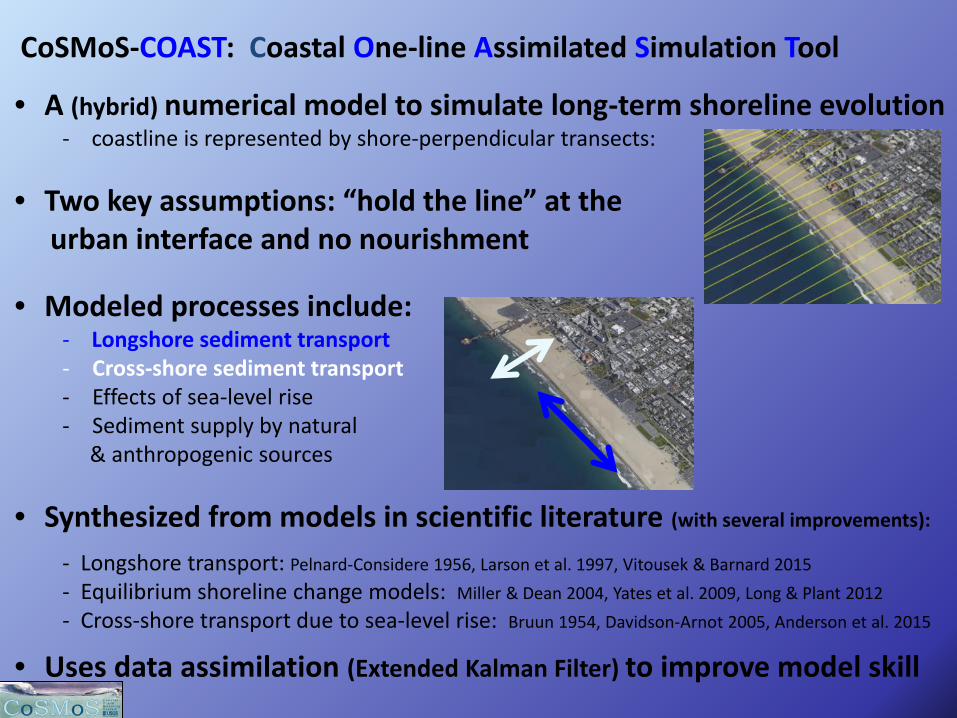
CoSMoS-COAST: Coastal One-line Assimilated Simulation Tool
• A (hybrid) numerical model to simulate long-term shoreline evolution - coastline is represented by shore-perpendicular transects:
• Two key assumptions: “hold the line” at the urban interface and no nourishment
• Modeled processes include:
- Longshore sediment transport - Cross-shore sediment transport - Effects of sea-level rise - Sediment supply by natural & anthropogenic sources
• Synthesized from models in scientific literature (with several improvements):
- Longshore transport: Pelnard-Considere 1956, Larson et al. 1997, Vitousek & Barnard 2015 - Equilibrium shoreline change models: Miller & Dean 2004, Yates et al. 2009, Long & Plant 2012 - Cross-shore transport due to sea-level rise: Bruun 1954, Davidson-Arnot 2005, Anderson et al. 2015
• Uses data assimilation (Extended Kalman Filter) to improve model skill

49
Simulation output for a single transect at Del Mar Beach:
CoSMoS-COAST We use the extended Kalman filter method of Long & Plant 2012 - Auto-tunes model parameters for each transect to best fit the historical shoreline data - We improved the method to handle sparse shoreline data and ensure that parameters are positive or negative.
50
CoSMoS-COAST
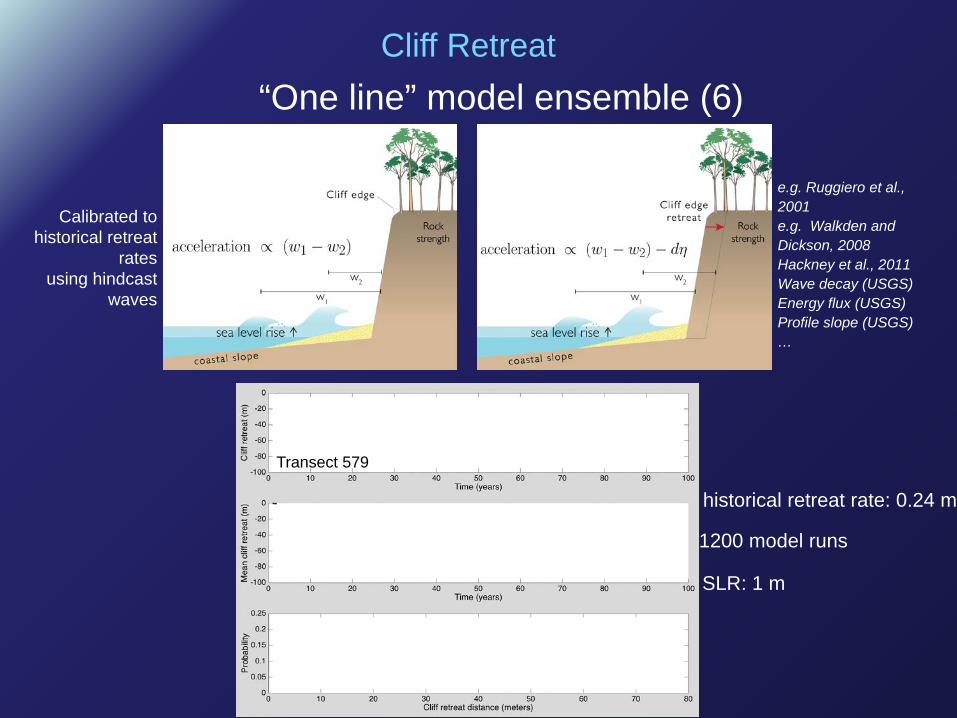
“One line” model ensemble (6)
e.g. Ruggiero et al., 2001 e.g. Walkden and Dickson, 2008 Hackney et al., 2011 Wave decay (USGS) Energy flux (USGS) Profile slope (USGS) …
historical retreat rate: 0.24 m/
SLR: 1 m
1200 model runs
Transect 579
Cliff Retreat
Calibrated to historical retreat
rates using hindcast
waves
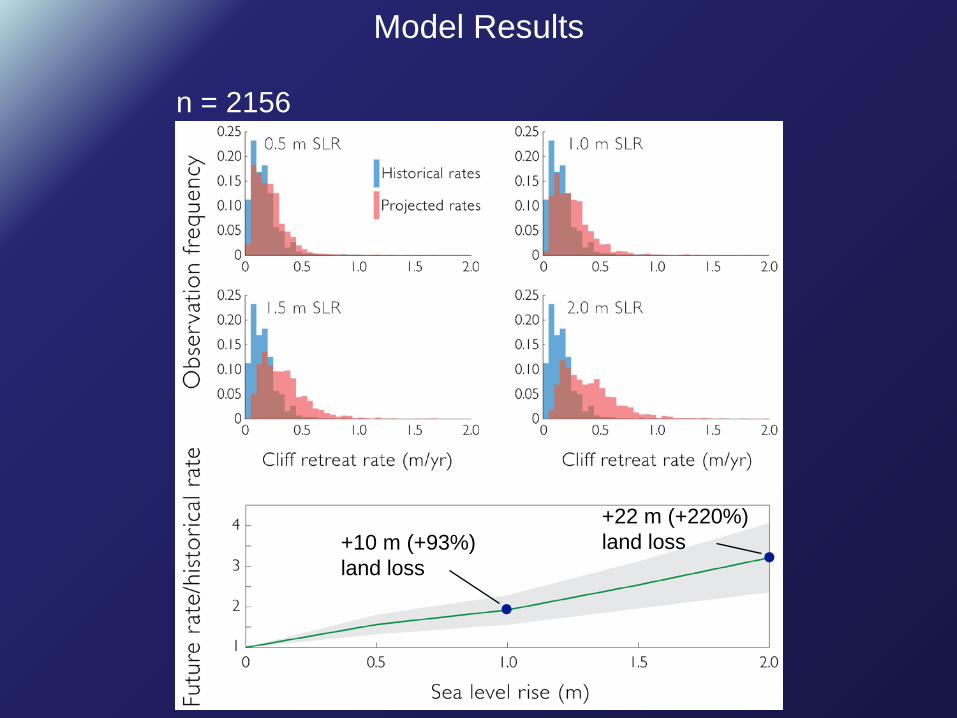
Model Results
n = 2156
+10 m (+93%) land loss
+22 m (+220%) land loss