physician alignment economics and lessons learned
TRANSCRIPT

Arby Nahapetian, M.D., MPH, FACCSVP and Chief Medical OfficerAdventist Health Southern California
Physician Alignment Economics and Lessons LearnedApril 12, 2018
Steven T. ValentineVice PresidentPremier, Inc.Strategic Advisory Services

2PROPRIETARY & CONFIDENTIAL - © 2018 PREMIER, INC.
Deliver patients to the physicians (preferably profitable)• Get them busy
Provide managed care infrastructure (ACO, CIN, MSSP, HMO patients, etc.) to the physiciansProvide incentives to the physicians to assist the hospital to reduce resource consumption
• Care model and support (people, IT solutions, clinicians, etc.)• Less costly provider setting• Shared risk pools• Performance criteria with incentives
Physician Alignment Needs/Goals

3PROPRIETARY & CONFIDENTIAL - © 2018 PREMIER, INC.
Bundle paymentCo-management arrangementMSSP/Next GenShared risk poolsTwo-sided risk arrangementsClinically Integrated Network (CIN)Direct to employer contracting
Physician Alignment Models

4PROPRIETARY & CONFIDENTIAL - © 2018 PREMIER, INC.
Success Stories –Avera Health (St. Luke’s Hospital) & Southwest General
• Episode Type: Total Joint Replacement
• Solution: Physician engagement, accurate documentation, and transparency of data/information was key to success. Worked with physician champion and established multi-disciplinary team and oversight structure. Employed full-time nurse navigator.
• Results: Ø 40% reductions in PAC spend within 1 year.
Ø Physicians feel they have a better handle on the health of their patients.
Ø Focus has shifted from operational, within the four walls of the hospital, to a comprehensive strategy.
• Episode Type: Congestive Heart Failure
• Solution: Knew that aligning people, processes and technology would be the key to success. Setup process for PCs and Specialists received notifications when a bundle patient arrived and received support from the population health team. Transparent with SNF utilization and PAC spend data.
• Results: Ø 15% in 30-day readmissions
Ø 17% reduction in 90-day readmissions
Ø 9% reduction in unnecessary consults/associated costs
Ø Positive NPRA allows for reinvestment into improving patient care.
(St. Luke’s Hospital)
“Having the line of sight on all care for the patient is so important to us. Premier’s Bundled Payment Solution, has
been pivotal in helping Avera achieve our success.” – Stacey Lenker, Vice President, Payor Strategies, Avera Health
“Our decision making related to our bundle is impacting our readmission rate, which has been decreasing. This increases our confidence in our
work and the information we get from Premier’s analytics tool.”
– Jill Barber, Executive Director of Population Health, Southwest General

5PROPRIETARY & CONFIDENTIAL - © 2018 PREMIER, INC.
• Example: GE, Boeing, Lowe’s, Pepsi, Verizon, Target, Walt Disney and Walmart
• Employer Goals− Improved patient outcomes− Reduced costs
• Payment model:− Bundled payments cover 100 percent of the charges of an
episode of care (pre-surgery screening/work-up, travel to and from facility and recovery/rehabilitation)
− Employers will sometimes use a third party to negotiate the contract or episode of care
Bundled Payment: Direct to Employer

6PROPRIETARY & CONFIDENTIAL - © 2018 PREMIER, INC.
1. Third parties have a rigorous selection process• Metrics• Request performance data• Subject to third party audit/verification
2. Rates are competitive• Negotiated before patient need between third party and provider• Volume guarantee for reduced price
3. Pre-surgery screening process to deny/confirm the need for the surgery
4. Results: better patient satisfaction and outcomes5. Employers emphasize standardized care protocols and
incentivize providers to use them
Five Things to Know
7PROPRIETARY & CONFIDENTIAL - © 2018 PREMIER, INC.
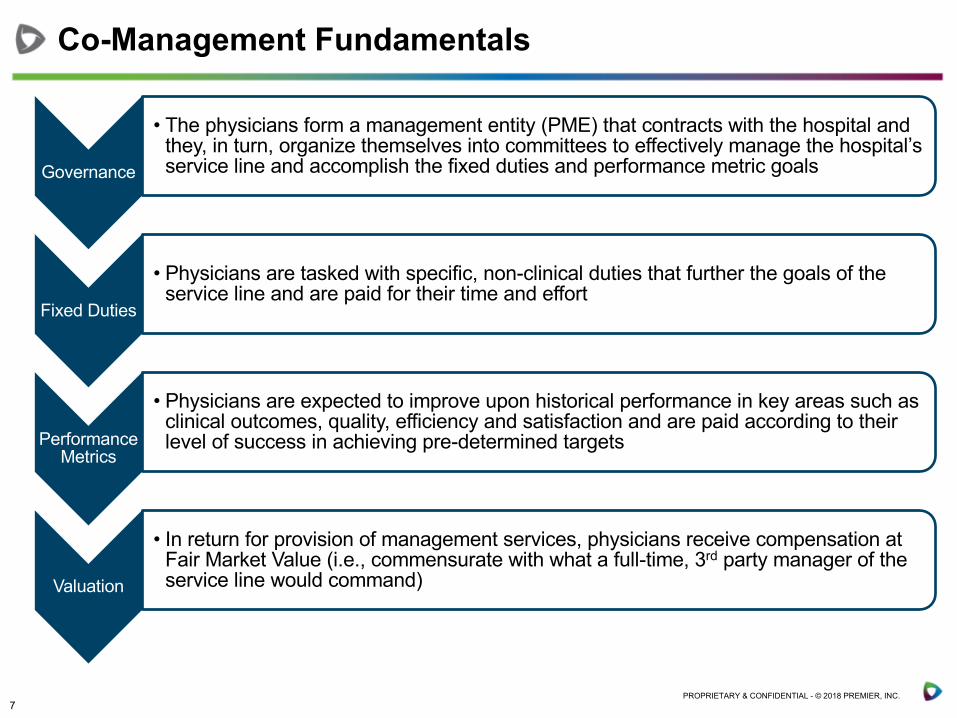
Governance
• The physicians form a management entity (PME) that contracts with the hospital and they, in turn, organize themselves into committees to effectively manage the hospital’s service line and accomplish the fixed duties and performance metric goals
Fixed Duties
• Physicians are tasked with specific, non-clinical duties that further the goals of the service line and are paid for their time and effort
Performance Metrics
• Physicians are expected to improve upon historical performance in key areas such as clinical outcomes, quality, efficiency and satisfaction and are paid according to their level of success in achieving pre-determined targets
Valuation
• In return for provision of management services, physicians receive compensation at Fair Market Value (i.e., commensurate with what a full-time, 3rd party manager of the service line would command)
Co-Management Fundamentals

8PROPRIETARY & CONFIDENTIAL - © 2018 PREMIER, INC.
A Model of Clinical Co-Management
• Committee Involvement• Day-to-Day Management• Strategic Plan Development• Clinical Care Management• Quality Improvement• Staff Oversight• Materials Management• Budget Development
• Clinical Outcomes• Patient Safety• Satisfaction• Operational Processes• Financial Performance• Surgical Care Improvement
Physician Management Entity (PME)
Hospital
FMV Compensation
Management ServicesContract
Management Fee Distributions
Investment
Performance MetricsFixed Duties
Physicians/ Physician Groups
8
Governing Committee(Hospital & Physicians)

9PROPRIETARY & CONFIDENTIAL - © 2018 PREMIER, INC.
Governance
PME formed (either JV with hospital and physicians or physician-owned)
Physicians to capitalize PME start-up (costs typically minimal)
PMEH$
MD$
PF
G
PME contracts with the hospital to manage service line for FMV compensation
Two components of management services commonly called fixed duties and performance metrics
Term of contract must be at last 1 year, can extend up to 5 years (contingent upon hospital’s bond covenants)

10PROPRIETARY & CONFIDENTIAL - © 2018 PREMIER, INC.
Fixed Duties
Fixed duties involve the more typical day-to-day components of managing a service line
Physician involvement often includes participation and leadership in joint hospital-physician committees and/or subcommittees
PMEH$
MD$
PF
G
Small contingent of physician leaders typically assume majority of responsibilities
Physicians submit regular documentation of physician efforts
PME may hire administrator to support its management efforts (LLC overhead)
11PROPRIETARY & CONFIDENTIAL - © 2018 PREMIER, INC.
Invasive Labs(1- Chair
2 - Members)
Fixed Duties - Example
Physician Management Entity
(PME) Hospital(s)
Heart & Vascular Executive Committee (HVEC)
(4 Physician Managers & Hospital Staff)
Finance & Capital (1- Chair
2 - Members)
Quality & Clinical(1- Chair
4 - Members)
Medical Directors (5)
CHF Disease
Chest Pain
Non-Invasive
Cardiac RehabCommittee Structure• The Heart & Vascular Committee will report to the VP (?)• The PME Managers will be the 4 physicians on the HVEC• Hospital representatives will sit on the Finance & Capital and
Invasive Labs Committees to assist the physicians in business management
Hospital Representation
Physician Only
CASE EXAMPLEIT Implementation

12PROPRIETARY & CONFIDENTIAL - © 2018 PREMIER, INC.
Performance Metrics
Performance metrics link financial incentives to improvement from current performance in predefined clinical outcomes
Physicians responsible for outcome of entire service line, not just PME member performance
PMEH$
MD$
PF
G
Metrics and targets can be changed or revised annually
Metrics should:• Focus on service line needs
• Drive improvement from baseline performance
• Align with CMS core measures, national guidelines or international standards
• Be within the scope of physician control
Financial performance metrics cannot incentivize:• Rationing of care
• Referrals, volume or revenue

13PROPRIETARY & CONFIDENTIAL - © 2018 PREMIER, INC.
Performance Metrics – Sample (Cardiology)
Performance Metrics - Q4 FY12BASELINE
(2011)Current
Performance
Level% Weight
Performance
Total
Total Performance Compensation Available $ 798,000
A Clinical Outcomes Metrics 35%
1 CHF patients receiving discharge instructions. 97.0% 100.00% 3 7.0% $ 55,860 2 Creatinine assessed pre and post PCI procedure 88.4% 94.6% 2 7.0% $ 37,240 3 Beta Blocker at discharge for all AMI 89.5% 100.0% 3 7.0% $ 55,860
B Complications and Patient Safety Metrics 35%
1 30-day readmission rate for recurrent CHF (All adult, includes planned readmits). 8.5% 7.7% 1 7.0% $ 18,620
2 30-day CHF readmission rate for any reason (CMS Payor, includes planned readmits) 22.0% 17.0% 2 7.0% $ 37,240
3 Overall AMI -unadjusted risk mortality (STEMI and non-STEMI) 6.2% 3.62% 3 7.0% $ 55,860
C Process and Efficiency Metrics 22.5%
1Inpatient echo reports read and documented in Camtronics within 24 hours of procedure performance
94.3% 98.0% 2 5.0% $ 26,600
2 Early diagnostic catheterization for AMI patients (within 24 hours) 65.4% 70% 3 6.5% $ 51,870
D Satisfaction Metrics 7.5%
1 Invasive Lab Satisfaction 66.1% 70.8% 1 2.5% $ 9,975
Total Compensation Earned $ 349,125
Level 1 Compensation Level 2 Compensation Level 3 Compensation
*Metrics not achieved are not included in this example, weighting has not been altered

14PROPRIETARY & CONFIDENTIAL - © 2018 PREMIER, INC.
Performance Metrics - Scorecard
Level 1 Compensation Level 2 Compensation Level 3 Compensation
15PROPRIETARY & CONFIDENTIAL - © 2018 PREMIER, INC.
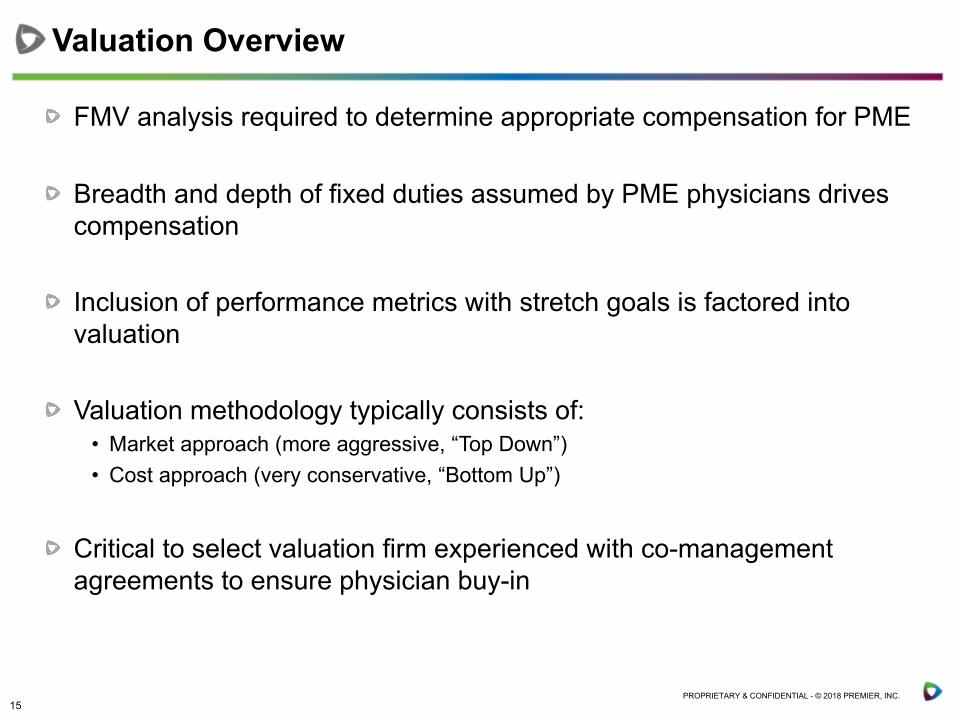
Valuation Overview
FMV analysis required to determine appropriate compensation for PME
Breadth and depth of fixed duties assumed by PME physicians drives compensation
Inclusion of performance metrics with stretch goals is factored into valuation
Valuation methodology typically consists of:• Market approach (more aggressive, “Top Down”)• Cost approach (very conservative, “Bottom Up”)
Critical to select valuation firm experienced with co-management agreements to ensure physician buy-in

16PROPRIETARY & CONFIDENTIAL - © 2018 PREMIER, INC.
• Wellness programs (Rand defines two components):− Lifestyle management (health risk: smoking, obesity, etc.)
− Disease management (chronic conditions)
− Trendy: self monitoring of activity, sleep, calorie consumption, etc.
• Centers of Excellence− Criteria: Ranked providers who provide treatment for a particular
disease, procedure or condition• Organ transplants
• Cancer
• Cardiac surgery
• Bariatric surgery
• Joint replacement
• Spinal surgery
− Incentivize the employee by waiving co-pay, deductible and co-insurance and pay for travel and accommodations for the patient and their designee/caregiver
Direct Between Employer and Provider

17PROPRIETARY & CONFIDENTIAL - © 2018 PREMIER, INC.
Primary Care Specialists Hospital Risk PoolCAP CAP Case Rate/Per
Diem ü
CAP FFS Case Rate/Per Diem
ü
FFS CAP Case Rate/Per Diem
ü
FFS FFS Case Rate/Per Diem
ü
Payment Options and Behavior

18PROPRIETARY & CONFIDENTIAL - © 2018 PREMIER, INC.
Health Plan
Pharmacy?
Infrastructure
AncillariesFacilitiesPhysicians
Where Does the Premium Go?
$
Risk Pool
D DP
D – DistributionsP – Payments

19PROPRIETARY & CONFIDENTIAL - © 2018 PREMIER, INC.
P2P: Shared Risk Pool
D D
$
$ Funding
Health Plan (P2P)
Hospital (SNF, Outpatient)
Health Plan
Risk Pool-Facility
Medical Group / IPA
Out of Network / Out of Area
Outpatient
Inpatient
D = Distribution Payments

20PROPRIETARY & CONFIDENTIAL - © 2018 PREMIER, INC.
High-risk Care Management
HealthCare Partners
Level 4
Level 2
Level 1
House Calls Program
Complex Care Management and Disease Management
Self-Management, PCP
Level 3High-Risk Clinics
High-Risk
Patient
Low-Risk
Patient
Hospice/Palliative Care
BaselinePreventive Care/Wellness programsPopulation Monitoring
New Care Models
Required

21PROPRIETARY & CONFIDENTIAL - © 2018 PREMIER, INC.
IDS Collaboration Opportunities
Target markets:• Medicare Advantage• MSSP/ ACO• Commercial ACO• Medicaid managed care• Dual eligible managed care• Direct to employer
Models/Options (IDS)• Health plan (own or partner)• ACO• CIN/RCIN• Shared risk pool• Bundle payment/co-management agreement

22PROPRIETARY & CONFIDENTIAL - © 2018 PREMIER, INC.
Collaboration Opportunities
Payment methodologies• Shared risk pools (facility payments)• Health plan ownership-distribute net earnings• Standardize a Division of Financial Responsibility (DoFR)• Guidelines:
» Change payment model before care model» Use aligned economic incentives to reward:
§ Quality outcomes (predetermined metrics)§ Spend targets (predetermined metrics)§ Economic incentives that target specific areas (problems)§ Per diems, case rates
• Those that benefit from infrastructure and resource consumption should pay for those resources

23PROPRIETARY & CONFIDENTIAL - © 2018 PREMIER, INC.
How are Shared Savings being Distributed?Data from PHMC Members who generated shared savings
PY2013 PY2014 PY2015
Average 38.4% 45.6% 40.3%
Range 12-73% 14-83% 9-73%
Infrastructure/ReinvestmentPY2013 PY2014 PY2015
Average 64.8% 58.5% 66%
Range 33-88% 33-89% 33-90%
ACO Participants
On average, PHMC ACOs are distributing the majority of their actual shared savings to PCPs, specialists,hospitals, and other providers while the remainder is distributed towards infrastructure and re-designed
care processes/resources.
24PROPRIETARY & CONFIDENTIAL - © 2018 PREMIER, INC.
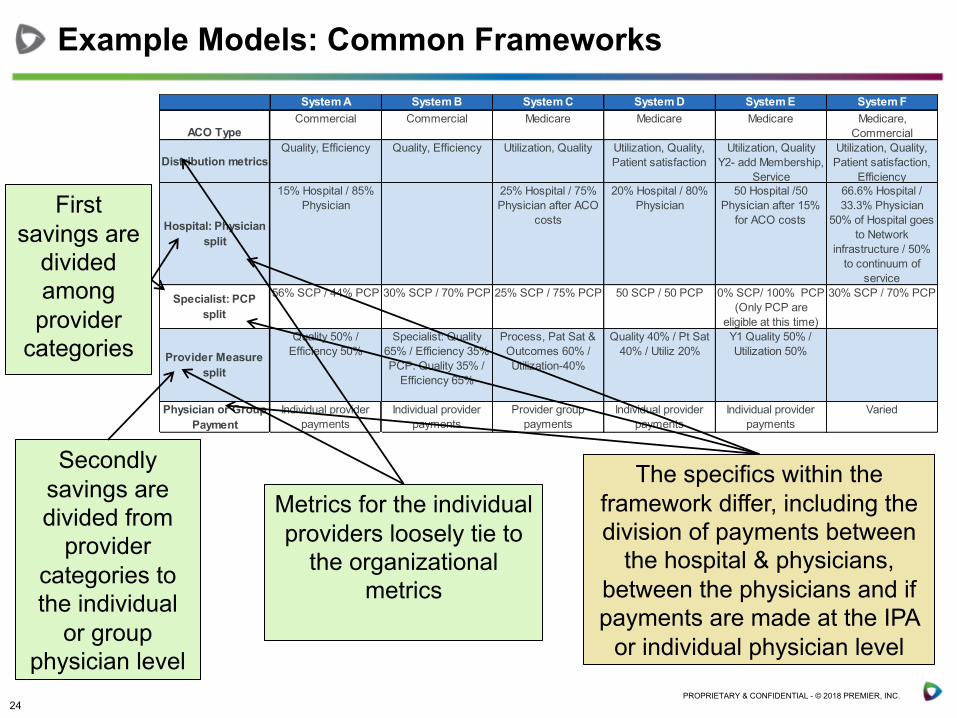
System A System B System C System D System E System F
ACO TypeCommercial Commercial Medicare Medicare Medicare Medicare,
Commercial
Distribution metricsQuality, Efficiency Quality, Efficiency Utilization, Quality Utilization, Quality,
Patient satisfactionUtilization, Quality
Y2- add Membership, Service
Utilization, Quality, Patient satisfaction,
Efficiency
Hospital: Physician split
15% Hospital / 85% Physician
25% Hospital / 75% Physician after ACO
costs
20% Hospital / 80% Physician
50 Hospital /50 Physician after 15%
for ACO costs
66.6% Hospital / 33.3% Physician
50% of Hospital goes to Network
infrastructure / 50% to continuum of
service
Specialist: PCP split
56% SCP / 44% PCP 30% SCP / 70% PCP 25% SCP / 75% PCP 50 SCP / 50 PCP 0% SCP/ 100% PCP (Only PCP are
eligible at this time)
30% SCP / 70% PCP
Provider Measure split
Quality 50% / Efficiency 50%
Specialist: Quality 65% / Efficiency 35%PCP: Quality 35% /
Efficiency 65%
Process, Pat Sat & Outcomes 60% / Utilization-40%
Quality 40% / Pt Sat 40% / Utiliz 20%
Y1 Quality 50% / Utilization 50%
Physician or Group Payment
Individual provider payments
Individual provider payments
Provider group payments
Individual provider payments
Individual provider payments
Varied
First savings are
divided among provider
categories
Secondly savings are divided from
provider categories to the individual
or group physician level
Metrics for the individual providers loosely tie to
the organizational metrics
The specifics within the framework differ, including the division of payments between
the hospital & physicians, between the physicians and if payments are made at the IPA
or individual physician level
Example Models: Common Frameworks

25PROPRIETARY & CONFIDENTIAL - © 2018 PREMIER, INC.
Overview:• Metrics should promote the triple aim, and are expected to evolve with increasing data
sophistication
• Consider what metrics are already being monitored that can be leveraged (physician groups, managed care, state reporting, etc.)
• Provider shared savings will be scaled based upon an overall performance score
Example Measures, Weighting, Scoring
Metrics Level of reporting Data source Scoring Definition of meeting measure WeightingPhysician Engagement 25%
Attendance at meetings Physician Sign-in sheets 0,1Attendance at 50% of town hall meetings 50%
Completion of education modules
PhysicianLearning management system; log-in
0,1 Completion of 50% of education modules
25%
Completion of practice surveys Practice Data collection; survey monkey
0,1 Completion of 50% of practice surveys
25%
Quality 25%Annual A1C testing for patients with diabetes Population Claims 0,1
75% of patients with Diabetes complete A1C testing in 2015 50%
Annual influenza vaccination Population Claims 0,1 55% of patients have influenza vaccination completed in 2015
50%
Utilization 25%ED visits per 1000 beneficiaries Population 4Q15 E&U report 0,1 5% reduction from benchmark report 50%
Admissions per 1000 beneficiaries Population 4Q15 E&U report 0,1 5% reduction from benchmark report 50%
Patient experience 25%
Access PracticeSecret shopper; survey 0,1
Same day access for urgent visit/consult as measures in 4th quarter 2015
100%
Define Shared Savings Measures

26PROPRIETARY & CONFIDENTIAL - © 2018 PREMIER, INC.
Shared Savings Available to CIN multiplied by Overall
Quality Score
Shared Savings Produced
30% to infrastructure
CMS Retains Percentage
Provider Engagement Patient Experience Quality
Examples:• Annual A1C testing• Annual influenza vaccination• Ambulatory sensitive
readmissions
Examples:• Educational meeting
attendance• Website utilization• Care management
adherence
70% Distribution to providers: 50% PCP, 20% SCP, 30% Hospitals; individual distributions based on # of
lives/visits & performance metrics
Examples:• Access – telephonic
and appointment• Post-discharge visits
Sample Performance Metrics
Utilization
Examples:• ED visits per 1000
beneficiaries• Admissions per 1000
beneficiaries
Example of Distribution and Performance Metrics
27PROPRIETARY & CONFIDENTIAL - © 2018 PREMIER, INC.
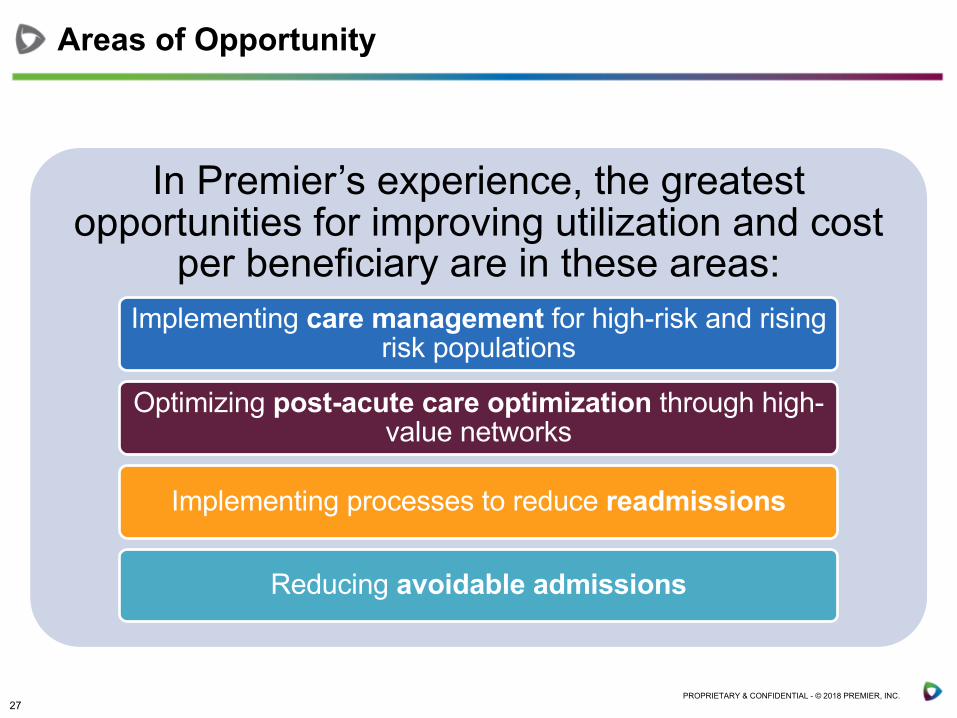
Areas of Opportunity
In Premier’s experience, the greatest opportunities for improving utilization and cost
per beneficiary are in these areas:Implementing care management for high-risk and rising
risk populations
Optimizing post-acute care optimization through high-value networks
Implementing processes to reduce readmissions
Reducing avoidable admissions

28PROPRIETARY & CONFIDENTIAL - © 2018 PREMIER, INC.
Summary of Lessons Learned
There is no one right model
Incentive distribution should not be confused with physician compensation
Take strategic goals and savings opportunities into consideration in developing the plan; focus is very important
PCPs, in most instances, have more impact on generating savings, and, the dollars available to specialists in most models are not significant enough to generate behavioral change
Clearly communicate the distribution model early to incentivize participants
Ensure distribution of “hard dollars”; avoid the temptation to immediately cover the ACO network’s costs at the expense of distributing funds to physicians
Balance developing internal measures and systems that crosswalk the CMS attribution by TIN to correctly assign it to the NPI with not letting the perfect get in the way of the good
Less is more – keep the model simple and modify over time, if necessary

29PROPRIETARY & CONFIDENTIAL - © 2018 PREMIER, INC.
Strategy: Guiding Principles
Move to population health (continuum of care)Move to deliver value (payment systems pushing you there)Broad Access points (expand population served)
• PCP, UCC, Retail, APPs, Health Plan, TeleHealthMove to risk payment/global payment (control spend)Improve quality (track Core Measure Quality Collaborative)Competitive cost structurePrepare physicians for MACRA Aligned payment systems:
• Narrow networks• Alternative Payment Methodologies (ACO, PCMH, BP)• Shared risk pools to link with physician organizations

30PROPRIETARY & CONFIDENTIAL - © 2018 PREMIER, INC.
Care models designed in response to payment models and incentivesThose that hold the risk, should be responsible for the cost and delivery model Medicare Advantage, the better your performance (infrastructure, care model, metric results, less variation, etc.) you want a sicker patient (get paid more: coding)Medicaid, Commercial, Medicare and Dual eligibles are distinct populations and have different needs/access issuesQuality outcomes and spend matterClearly identify what you are at risk for (DoFR)Providers will optimize their economics
Guiding Principles for Value Based Payment

31PROPRIETARY & CONFIDENTIAL - © 2018 PREMIER, INC.
Quality indicators:• HEDIS• MSSP Measures• MACRA metrics• CMS Star Ratings (target 4-5 Stars)• Anything specific to the contract• Patient satisfaction surveys
Utilization indicators:• AD/1,000 and PD/1,000• LOS• ED visits/1,000• SNF days/1,000• Out of Network use (who and for what?)• Pre-authorization rate (target 95%, designate doctors)• Other areas where you have a spend problem
Primary care referrals to specialists (rate)
What Should I Pay Attention To?

32PROPRIETARY & CONFIDENTIAL - © 2018 PREMIER, INC.

33PROPRIETARY & CONFIDENTIAL - © 2018 PREMIER, INC.
Who is the Region?
The Southern California Region is:
• 50% of the employee workforce
• 50% of the system volunteers
• 49% of the physician workforce
• 47% of patients admitted• 56% of babies delivered• 38% of emergency room
visits• 40% of the net revenue• 40% of EBIDA

34PROPRIETARY & CONFIDENTIAL - © 2018 PREMIER, INC.
What Do We Bring to the Care in Southern California?
Wellness Center Health & Prevention• Two Wellness &
Therapy Centers
Ambulatory Network• 10 Primary Care Sites: 56 providers• 2 Multispecialty Sites: 26 Providers• 14 Specialty Care Sites: 31 Providers• 4 Urgent Care Sites: 35 Providers• 4 Clinics/YMCA Partnerships• 1 Federally-Qualified Health Center• 1 LA Market IPA: 209 Physicians &
25,000 lives• 1 Simi Valley CIN: 90+ Physicians• 1 Kern County CIN: 100+ Physicians
Outpatient Centers• 4 Outpatient Surgery Centers• 6 Imaging Centers• 3 Cancer Centers
Acute Care• 5 Acute Care Hospitals
Post-Acute• Home Health &
Hospice Care

35PROPRIETARY & CONFIDENTIAL - © 2018 PREMIER, INC.
More Predictable
Price&
Increased Transparency
“Value”Networks
Wellness&
DiseaseManagement
CloserRelationships with Providers
Have Input on Network Participants
Large Employers Still Want To Provide Health Benefits, But What Are They Looking For?

36PROPRIETARY & CONFIDENTIAL - © 2018 PREMIER, INC.
Employer Option Trend Important NewsTraditional Model“Status Quo”
• Large employers costs continue to rise at an unsustainable pace• Some employers looking to either reduce their role in the process
or gain more control of it
Private Exchange“We Give Up”(Walgreens, Hallmark)
• Mercer grew from 975,000 members to 1.4 million • Aon Hewitt grew from 750,000 members to 1.0 million • Accenture estimates exchanges grew 35 percent to approximately
8.0 million in 2016
Direct Contracting“We Want More Control”(Boeing, Intel, SHCA)
• Aon Hewitt survey reports that nearly 30 percent of employers are interested in some form of direct relationship with providers within the next three to five years.
• Boeing direct-to-employer in Orange County
Sources:https://www.accenture.com/us-en/insight-new-private-enrollmenthttp://www.forbes.com/sites/brucejapsen/2015/10/19/employers-shift-more-workers-to-private-exchanges/#6fd758d41db0http://www.forbes.com/sites/brucejapsen/2014/10/08/more-employers-shifting-health-to-private-exchanges/#3d59d7c47abdhttp://www.bdcadvisors.com/next-generation-health-care/https://www.towerswatson.com/en-US/Insights/IC-Types/Survey-Research-Results/2015/04/2015-emerging-trends-in-health-care-survey
What Are Their Options?

37PROPRIETARY & CONFIDENTIAL - © 2018 PREMIER, INC.
• Population of 5,000, targeting 14,500
• Member must choose a PCP
• $0 monthly contribution from employee
• $0 cost sharing in-network
• 45% cost sharing for out-of-network
• Access to care coordination
• Greater discount on WF groceries
• Potentially extend program to other organizations (41,000 lives)-GPO
Highlights of Club Zero
Our Current Relationship

38PROPRIETARY & CONFIDENTIAL - © 2018 PREMIER, INC.
AH Hospital & Ancillary Network (PPA)
Employed Whole Foods PCPs
AH Specialty Network (PPA)
AH PCP Network (PPA)
Wrap-Around
Open Enrollment
Club Zero
Traditional Plan
Member Selects/Assigned
PCPPPA provides the AH network,
medical management, and billing and collections
(High-cost to employee)
Club Zero Network Design
(High-out-of-pocket costs to employee)

39PROPRIETARY & CONFIDENTIAL - © 2018 PREMIER, INC.
• Club Zero is attracting higher-risk members (HUI Score of 1.21) which is giving AH the opportunity to make a significant impact on Whole Foods’ health benefit costs
• Although still early, the population’s utilization rates appear to be headed lower than expected
• If Club Zero continues to show positive results, there is potential for significant growth in the population at the upcoming Whole Foods open enrollment
• This arrangement is allowing us to further fund and develop greater capabilities around care coordination
Early Success
40PROPRIETARY & CONFIDENTIAL - © 2018 PREMIER, INC.
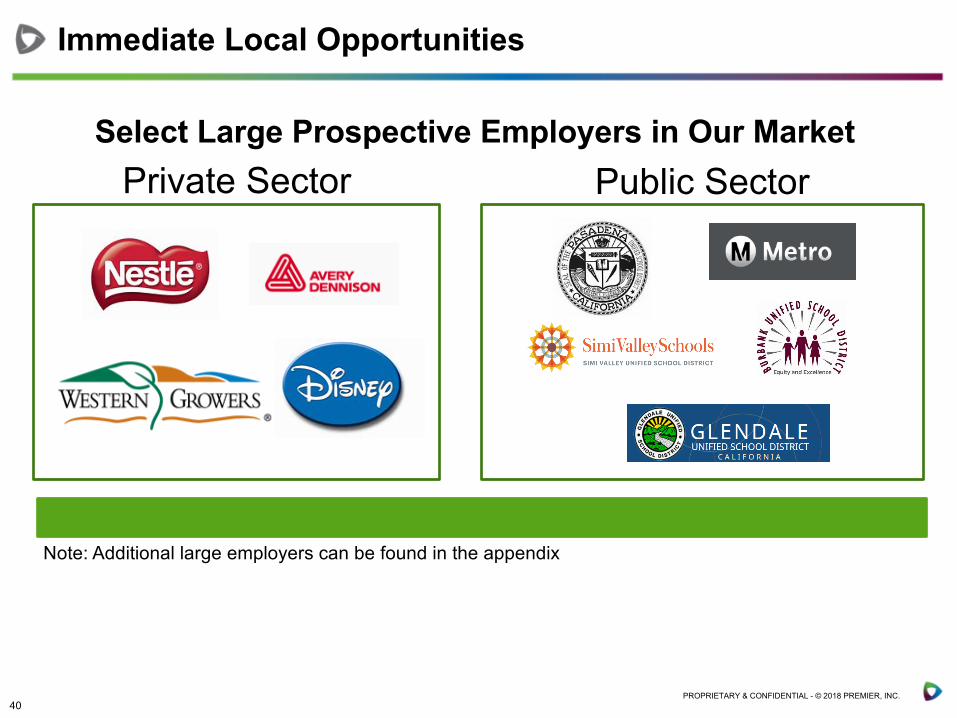
Select Large Prospective Employers in Our MarketPrivate Sector Public Sector
Note: Additional large employers can be found in the appendix
Immediate Local Opportunities

41PROPRIETARY & CONFIDENTIAL - © 2018 PREMIER, INC.
EmployerNumber of Employees Employer
Number of Employees
County of Los Angeles 97,500 Walt Disney 10,500
Los Angeles School District 73,300 Home Depot 10,200
Federal Government 48,100 Nestle 10,000
City of Los Angeles 47,700 Wells Fargo 9,500
State of California 30,400 MTA 9,200
Northrop Grumman 18,000 AT&T 8,900
Target 14,200 Cal Tech 8,900
Kroger 13,200 Edison International 8,300
Securitas Security Services 13,000 ABM Industries 8,300
Bank of America 12,000 Raytheon 8,200
Boeing 11,200 Warner Brothers 8,000
Note: Excludes healthcare providersSources: LA Almanac and Hoovers
Top Employers in Los Angeles County, Identified to Date

42PROPRIETARY & CONFIDENTIAL - © 2018 PREMIER, INC.
Los Angeles County
Ventura County Total
Number of businesses with 1,000+ employees (large)
253 16 269
Number of employees in the 1,000+ cohort
656,000 29,000 685,000
Estimated commercial beneficiaries in the market
3,900,000 436,000 4,336,000
Employees in large businesses as a percent of total commercial population
17% 7% 16%
By engaging employers with 1,000 or more employees, AH could capture a significant number of commercial members within the market and focus their resources
685,000 members make up an estimated 30,000 to 40,000 in acute commercial admissions
Sources: http://www.labormarketinfo.edd.ca.gov/LMID/Size_of_Business_Data.html and InterStudy Data 2015
The Market Opportunity: Focus on Large Employers (Over 1,000 employees)

43PROPRIETARY & CONFIDENTIAL - © 2018 PREMIER, INC.
• We are price competitive Price
• We have a regional network, but will need strategic partners in select marketsNetwork
• We have care coordination through PPA. Will continue to build as we add more contracts
Care Coordination Infrastructure
• Employers are already reaching out to Southern California regional management directly
RelationshipsCrit
ical
Suc
cess
Fac
tors
We Are Positioned for Success

44PROPRIETARY & CONFIDENTIAL - © 2018 PREMIER, INC.
Where Might We Have Gaps in Our Network

45PROPRIETARY & CONFIDENTIAL - © 2018 PREMIER, INC.
Whole Foods Employees and Covered Lives – Glendale Area
Map shows employee zip codes. Green represents employees within 10 miles of PCP, yellow within 15 miles, and red farther than 15.

46PROPRIETARY & CONFIDENTIAL - © 2018 PREMIER, INC.
Whole Foods California
Whole Foods California Employees
47PROPRIETARY & CONFIDENTIAL - © 2018 PREMIER, INC.
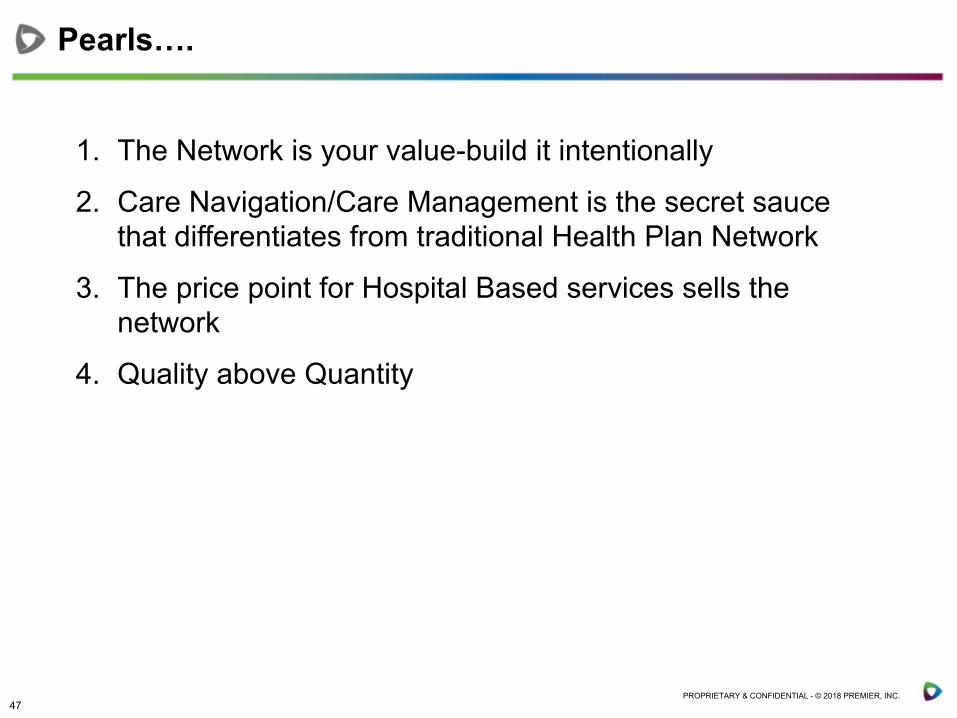
1. The Network is your value-build it intentionally
2. Care Navigation/Care Management is the secret sauce that differentiates from traditional Health Plan Network
3. The price point for Hospital Based services sells the network
4. Quality above Quantity
Pearls….