physiological adaptations in two ecotypes fucus vesiculosus with
TRANSCRIPT

i
Thesis for the Degree of Doctor of Philosophy in Biology
Sundsvall 2011
PHYSIOLOGICAL ADAPTATIONS IN TWO ECOTYPES OF FUCUS VESICULOSUS AND IN FUCUS RADICANS
WITH FOCUS ON SALINITY
Anna Maria Gylle
Supervisors:
Supervisor: Professor Nils GA Ekelund
Assistant supervisor: Docent Stefan Falk
Department of Natural Sciences, Engineering and Mathematics
Mid Sweden University, SE‐851 70 Sundsvall, Sweden
ISSN 1652‐893X
Mid Sweden University Doctoral Thesis 102, 2011 ISBN 978‐91‐86694‐25‐8

ii
Akademisk avhandling som med tillstånd av Mittuniversitetet i Sundsvall
framläggs till offentlig granskning för avläggande av filosofie doktorsexamen
fredagen den 25 mars 2011, kl. 10.15 i sal O102, Mittuniversitetet Sundsvall.
Seminariet kommer att hållas på svenska.
PHYSIOLOGICAL ADAPTATIONS IN TWO ECOTYPES OF FUCUS VESICULOSUS AND IN FUCUS RADICANS WITH FOCUS ON SALINITY Anna Maria Gylle
The picture on the front cover page illustrates the sublittoral, brackish Fucus
vesiculosus from the Archipelago Sea (6 practical salinity units, psu; Photo: 2005‐10‐
03 FORSTSTYRELSEN). The picture on the back cover page illustrates the intertidal
marine F. vesiculosus from the Norwegian Sea (34‐35 psu) during low tide in
January 2007 (Photo: DR. JON‐ARNE SNELI).
© Anna Maria Gylle, 2011
Department of Natural Sciences, Engineering and Mathematics
Mid Sweden University, SE‐851 70 Sundsvall
Sweden
Telephone: +46 (0)771‐975 000
Printed by Kopieringen Mid Sweden University, Sundsvall, Sweden, 2011

iii
PHYSIOLOGICAL ADAPTATIONS IN TWO ECOTYPES OF FUCUS VESICULOSUS AND IN FUCUS RADICANS WITH FOCUS ON SALINITY Anna Maria Gylle Department of Natural Sciences, Engineering and Mathematics
Mid Sweden University, SE‐851 70 Sundsvall, Sweden
ISSN 1652‐893X, Mid Sweden University Doctoral Thesis 102;
ISBN 978‐91‐86694‐25‐8
ABSTRACT
The in origin intertidal marine brown alga Fucus vesiculosus L. grow
permanently sublittoral in the brackish Bothnian Sea, side by side with the recently
discovered F. radicans L. Bergström et L. Kautsky. Environmental conditions like
salinity, light and temperature are clearly different between F. vesiculosus growth
sites in the Bothnian Sea (4‐5 practical salinity units, psu; part of the Baltic Sea) and
the tidal Norwegian Sea (34‐35 psu; part of the Atlantic Ocean). The general aims
of this thesis were to compare physiological aspects between the marine ecotype
and the brackish ecotype of F. vesiculosus as well as between the two Bothnian Sea
species F. vesiculosus and F. radicans.
The result in the study indicates a higher number of water soluble organic
compounds in the marine ecotype of F. vesiculosus compared to the brackish
ecotype. These compounds are suggested to be compatible solutes and be due to
an intertidal and sublittoral adaptation, respectively; where the intertidal ecotype
needs the compounds as a protection from oxygen radicals produced during high
irradiation at low tide. The sublittoral ecotype might have lost the ability to
synthesize these compound/compounds due to its habitat adaptation. The
mannitol content is also higher in the marine ecotype compared to the brackish
ecotype of F. vesiculosus and this is suggested to be due to both higher level of
irradiance and higher salinity at the growth site.
77 K fluorescence emission spectra and immunoblotting of D1 and PsaA
proteins indicate that both ecotypes of F. vesiculosus as well as F. radicans have an
uneven ratio of photosystem II/photosystem I (PSII/PSI) with an overweight of PSI.
The fluorescence emission spectrum of the Bothnian Sea ecotype of F. vesiculosus

iv
however, indicates a larger light‐harvesting antenna of PSII compared to the
marine ecotype of F. vesiculosus and F. radicans. Distinct differences in 77 K
fluorescence emission spectra between the Bothnian Sea ecotype of F. vesiculosus
and F. radicans confirm that this is a reliable method to use to separate these
species.
The marine ecotype of F. vesiculosus has a higher photosynthetic maximum
(Pmax) compared to the brackish ecotype of F. vesiculosus and F. radicans whereas
both the brackish species have similar Pmax. A reason for higher Pmax in the marine
ecotype of F. vesiculosus compared to F. radicans is the greater relative amount of
ribulose‐1.5‐bisphosphate carboxylase/oxygenase (Rubisco). The reason for higher
Pmax in marine ecotype of F. vesiculosus compare to the brackish ecotype however is
not due to the relative amount of Rubisco and further studies of the rate of CO2
fixation by Rubisco is recommended. Treatments of the brackish ecotype of F.
vesiculosus in higher salinity than the Bothnian Sea natural water indicate that the
most favourable salinity for high Pmax is 10 psu, followed by 20 psu. One part of the
explanation to a high Pmax in 10 psu is a greater relative amount of PsaA protein in
algae treated in 10 psu. The reason for greater amount of PsaA might be that the
algae need to produce more ATP, and are able to have a higher flow of cyclic
electron transport around PSI to serve a higher rate of CO2 fixation by Rubisco.
However, studies of the rate of CO2 fixation by Rubisco in algae treated in similar
salinities as in present study are recommended to confirm this theory.
Keywords: Bothnian Sea, brackish, brown algae, D1, 77 K fluorescence emission,
Fucus vesiculosus, Fucus radicans, light‐harvest antenna, mannitol, marine, NMR,
Norwegian Sea, quantum yield, photosynthetic maximum capacity (Pmax),
photosystem, (PSI, PSII), PsaA, Rubisco, salinity.
.

v
SVENSK SAMMANFATTNING (SUMMARY IN SWEDISH)
Fucus vesiculosus L. (Blåstång) är en brunalg som i huvudsak växer i
tidvattenzonen i marint vatten men arten klarar också att växa konstant under ytan
i det bräckta Bottenhavet. Norska havet och den del av Bottenhavet, där algerna är
insamlade i denna studie, har salthalterna 34‐35 psu (praktisk salthaltsenhet)
respektive 4‐5 psu. F. radicans L. Bergström et L. Kautsky (Smaltång) är en nyligen
upptäckt art (2005) som har utvecklats i Bottenhavet. F. radicans och Bottenhavets
ekotyp av F. vesiculosus växer sida vid sida och har tidigare ansetts vara samma art.
Sett till hela Östersjön, så ändras ytans salthalt från 25 till 1‐2 psu mellan Östersjöns
gräns mot Kattegatt och norra Bottenviken. Den låga salthalten i Östersjön beror på
det höga flödet av sötvatten från älvarna och på ett litet inflödet av saltvatten i
inloppet vid Kattegatt. Salthaltsgradienten är korrelerad med antalet arter som
minskar med minskad salthalt. Östersjön är ett artfattigt hav och de arter som finns
är till stor del en blandning av söt‐ och saltvattenarter. Det finns bara ett fåtal arter
som är helt anpassade till bräckt vatten och F. radicans är en av dem. Exempel på
miljöskillnader för F. vesiculosus i Norska havet och i Bottenhavet är salthalten,
tidvattnet, ljuset och temperaturen. Tidvattnet i Norska havet gör att algerna
växlar mellan att vara i vattnet och på land, vilket utsätter algerna för stora
ljusskillnader, snabba och stora temperaturväxlingar samt även torka. De alger
som växer i Bottenhavet har däremot en jämnare och lägre temperatur, istäcke på
vintern och mindre tillgång på ljus eftersom de alltid lever under vattenytan.
Skillnaderna i miljön mellan växtplatserna leder till skillnader i fysiologiska
anpassningar. Anledningen till att F. vesiculosus och F. radicans valdes som
studieobjekt i denna avhandling är att de är viktiga nyckelarter i Bottenhavet. F.
vesiculosus och F. radicans är de enda större bältesbildande alger som finns i det
artfattiga ekosystemet och de används därför flitigt som mat, gömställe,
parningsplats och barnkammare för t.ex. fisk. Att de är nyckelarter gör det
angeläget att försöka förstå hur algerna är anpassade och hur de reagerar på
miljöförändringar för att få veta hur de kan skyddas och bevaras. F. radicans
inkluderades även för att se hur en naturlig art i Bottenhavet är anpassad i
jämförelse med den invandrade F. vesiculosus. Marin F. vesiculosus inkluderades för
att vara en artreferens från artens naturliga växtplats.
Studien visar att det finns fler vattenlösliga organiska substanser (finns vissa
organiska substanser som har en proteinskyddande funktion) i den marina
ekotypen av of F. vesiculosus än i Bottenhavets ekotyp. Anledningen till detta
föreslås vara en anpassning till att växa i tidvattenzonen. Vid lågvatten utsätts F.
vesiculosus från Norska havet för starkt ljus, uttorkning, och snabba temperatur‐
växlingar vilket gör att den kan behöva dessa organiska substanser som skydd mot
vi
fria syreradikaler som bildas under lågvattenexponeringarna. F. vesiculosus från
Bottenhavet har troligen mist förmågan att syntetisera dessa substanser på grund
av anpassning till att hela tiden växa under ytan. Mängden mannitol (socker) är
högre i den marina ekotypen av of F. vesiculosus än i Bottenhavets ekotyp. Detta
föreslås bero på högre fotosyntetiskt maximum i F. vesiculosus från Norska havet
jämfört med ekotypen från Bottenhavet. Skillnaden i fotssyntetiskt maximum är
bland annat kopplat till ljus‐ och salthaltskillnaden på algernas växtplatser. Denna
teori styrks av att både fotosyntesen och halten av mannitol ökar i Bottenhavets
ekotyp när den behandlas i högre salthalt.
Studien visar även att båda ekotyperna av F. vesiculosus samt F. radicans har ett
ojämnt förhållande mellan fotosystem II och I (PSII och PSI) med en dominans av
PSI. Denna slutsats är baserad på fluorescens emissions mätningar vid 77 K (‐196
C) och mätning av den relativa mängden D1 protein (motsvarar PSII) och PsaA
protein (motsvarar PSI). F. vesiculosus från Bottenhavet visar ett emission spektrum
som pekar mot en jämnare fördelning av PSII och PSI jämfört med den marina
ekotypen och F. radicans. Detta stämmer dock inte med förhållandet mellan
D1/PsaA som indikerar att alla tre har mer PSI än PSII. Förklaringen till avvikelsen
mellan metoderna antas vara att F. vesiculosus från Bottenhavet har större ljus‐
infångande antennpigment än marin F. vesiculosus och F. radicans. De tydliga
skillnaderna i 77 K fluorescens emission spektra mellan Bottenhavets F. vesiculosus
och F. radicans visar att denna metod kan användas som säker artidentifiering.
Den marina ekotypen av F. vesiculosus har högre fotosyntetiskt maximum än de
båda arterna från Bottenhavet. Mätningar av den relativa mängden av enzymet
Rubisco, viktigt för upptaget av koldioxid hos växter och alger, visar att mängden
enzym är en sannolik förklaring till skillnaden i fotosyntetiskt maximum mellan
den marina ekotypen av F. vesiculosus och F. radicans och detta är troligen en
normal artskillnad. Mängden Rubisco kan dock inte förklara skillnaden i
fotosyntetiskt maximum mellan de båda ekotyperna av F. vesiculosus. För att
undersöka vad skillnaden mellan dessa två beror på så föreslås istället mätningar
av Rubisco’s koldioxidfixeringshastighet.
Det är en ökning av fotosyntetiskt maximum i Bottenhavets ekotyp av F.
vesiculosus när den behandlas i högre salthalt (10, 20 och 35 psu) och det högsta
fotosyntetiska maximumet uppmättes i alger som behandlats i 10 psu. Denna
ökning beror inte på ökning i den relativa mängden av Rubisco. Ökningen i
fotosyntesen speglas dock av en ökning av den relativa mängden PsaA. Detta antas
bero på att det behövs mer energi i form av ATP och att en ökning av detta kan ske
på grund av att mer PsaA kan driva den cykliska elektrontransporten i
fotosyntesreaktionen. Ökat behov av ATP antas bero på en ökning av Rubisco
aktiviteten men mätning av aktiviteten krävs för att bekräfta detta.

vii
TABLE OF CONTENTS
ABSTRACT ...................................................................................................................... III
SVENSK SAMMANFATTNING (SUMMARY IN SWEDISH) .............................. V
PAPERS ............................................................................................................................. IX
INCLUDED PAPERS ............................................................................................................ IX
CONTRIBUTION TO INCLUDED PAPERS ............................................................................... X
RELATED PAPERS NOT INCLUDED IN THIS THESIS .............................................................. X
ELUCIDATION ..................................................................................................................... X
ABBREVIATIONS AND DICTIONARY .................................................................. XII
INTRODUCTION .............................................................................................................. 1
WHY FUCUS? ...................................................................................................................... 1
THE BALTIC SEA ................................................................................................................. 1
GROWTH CONDITIONS: NORWEGIAN SEA VERSUS BOTHNIAN SEA ..................................... 4
Salinity ........................................................................................................................... 5
Tide versus no Tide: Light, Temperature and Desiccation ............................................ 5
Inorganic Carbon, pH and Nutrients ............................................................................. 6
THE SPECIES ....................................................................................................................... 6
Area of Distribution, Morphology and Reproduction .................................................... 6
Relationship and Genetic Divergence ............................................................................ 8
Physiology ...................................................................................................................... 8
PHOTOSYNTHESIS ............................................................................................................... 9
Electron Transport, NADPH2 and ATP in Photosynthesis ........................................... 10
Photosystem II .............................................................................................................. 10
Photosystem I ............................................................................................................... 12
Light Absorption Balance between PSII and PSI ......................................................... 12
Calvin Cycle, Rubisco and Carbon Supply .................................................................. 13
Photosynthetic Apparatus - Plants versus Brown Algae .............................................. 14
Chlorophyll a Fluorescence ......................................................................................... 14
COMPATIBLE SOLUTES, OSMOLYTES AND MANNITOL ...................................................... 16
THE AIMS OF THE THESIS .................................................................................................. 18
MATERIALS AND METHODS .................................................................................... 19
COLLECTIONS AND CULTIVATIONS ................................................................................... 19
EXPERIMENTAL PROCEDURES AND ANALYSES ................................................................. 19
Analysis of Water Soluble Organic Compounds and Chlorophyll ............................... 20
Chl a Fluorescence and Oxygen Evolution .................................................................. 20

viii
Relative Amount of D1 protein, PsaA protein and Rubisco .......................................... 21
Data Analysis ............................................................................................................... 21
RESULTS AND DISCUSSION ..................................................................................... 22
CONTENT OF WATER SOLUBLE ORGANIC COMPOUNDS AND THE CONCENTRATION OF
MANNITOL IN FUCUS VESICULOSUS (PAPER I, II) ............................................................... 22
Water Soluble Organic Compounds ............................................................................. 22
Mannitol ....................................................................................................................... 23
QUANTUM YIELD OF PSII PHOTOCHEMISTRY (PAPER II, IV) ............................................ 25
Fv/Fm as a Measure of Tolerance to Desiccation ......................................................... 25
Quantum Yield of PSII Photochemistry in Fucus vesiculosus and F. radicans ............ 25
77 K FLUORESCENCE EMISSION SPECTRA IN MARIN AND BRACKISH ECOTYPE OF FUCUS
VESICULOSUS AND FUCUS RADICANS (PAPER III) ................................................................ 26
77 K Fluorescence Emission Spectrum for Identifying of PSII and PSI ...................... 26
77 K Fluorescence Emission Spectrum – Comparison between Fucus Strains ............ 27
Effect of Salinity on the 77 K Fluorescence Emission Spectrum of the Bothnian Sea
Ecotype of F. vesiculosus ............................................................................................. 29
CONCENTRATION OF CHLOROPHYLL A AND C IN FUCUS VESICULOSUS AND FUCUS RADICANS
(PAPER II, III) ................................................................................................................... 30
PHOTOSYNTHESIS AND THE RELATIVE AMOUNT OF PHOTOSYNTHETIC PROTEINS IN FUCUS
VESICULOSUS AND FUCUS RADICANS (PAPER IV) ............................................................... 31
Pmax and the Relative Amounts of D1, PsaA and Rubisco Proteins in F. vesiculosus and
F. radicans ................................................................................................................... 32
Effect of salinity on Pmax and the Relative Amounts of D1, PsaA and Rubisco Proteins
in the Bothnian Sea ecotype of F. vesiculosus .............................................................. 34
CONCLUSIONS AND SUMMARY ............................................................................. 36
FUTURE PERSPECTIVES .............................................................................................. 37
TILLKÄNNAGIVANDEN ............................................................................................. 39
REFERENCES ................................................................................................................... 41

ix
PAPERS
Included Papers
The thesis is based on four Papers which are referred to in the thesis by Roman
numerals (Paper I‐IV):
Paper I Ecotype differentiation in qualitative content of water soluble organic
compounds between marine and brackish Fucus vesiculosus L.
(Phaeophyceae). Gylle AM, Isaksson D & Ekelund NGA. 2009.
Phycological Research, 57: 127‐130.
Paper II Desiccation and salinity effects on marine and brackish Fucus
vesiculosus L. (Phaeophyceae). Gylle AM, Nygård CA & Ekelund
NGA. 2009. Phycologia, 48 (3): 156‐164.
Paper III Fluorescence emission spectra of marine and brackish‐water ecotypes
of Fucus vesiculosus and Fucus radicans (Phaeophyceae) reveal
differences in light‐harvesting apparatus. Gylle AM, Rantamäki S,
Ekelund NGA & Tyystjärvi, E. 2011. Journal of Phycology, 47 (1): 98‐105.
Paper IV Photosynthesis and relative amounts of photosynthetic proteins (D1,
PsaA and Rubisco) in marine and brackish water ecotypes of Fucus
vesiculosus and Fucus radicans (Phaeophyceae). Gylle AM, Nygård CA,
Svan IC, Pocock T & Ekelund NGA. Manuscript.
Paper I and III are reprinted in this thesis by the permission of John Wiley and
Sons: Copyright © Phycological Research (2009) and Journal of Phycology (2010).
Paper II is reprinted in this thesis by the permission of Allen Press Publishing
Services: Copyright © (2009) International Phycological Society. From Phycologia,
by Gylle et al.

x
Contribution to Included Papers
Paper I: Took part in planning and field work, performed the experiment,
laboratory work, did the most of the data analysis and wrote the
paper.
Paper II: Took part in planning and field work, performed the experiment and
the chlorophyll and mannitol part of the laboratory work, did the
most of the data analysis and wrote the paper.
Paper III: Took part in planning and field work, performed the experiment and
the laboratory work, except the kinetics measurements, did the most
of the data analysis and wrote the paper.
Paper IV: Took part in planning and field work, performed the experiment and
the SDS‐PAGE and immunoblotting part of the laboratory work, did
the most of data analysis and wrote the paper.
Related Papers not Included in this Thesis
Impacts of UV radiation on photosynthesis of Fucus vesiculosus at low temperature
and different salinities. Nyberg (Gylle) M, Nygård CA, Ekelund NGA (2002)
Verh Internat Verein Theor Angew Limnol 28: 242‐245.
In situ study of relative electron transport rates in the marine macroalga Fucus
vesiculosus in the Baltic Sea at different depths and times of year Ekelund NGA,
Nygård CA, Nordström R, Gylle AM (2008). J Appl Phycol 20: 751–756.
Elucidation
1. The figures and tables reference written in bold style refers to figures and
tables in this thesis, and not to figures or tables in the included Paper I‐IV or
other references.
2. The quantifications made in Paper I‐IV are made in the aims to be a relative
comparison between the included algae and not in the aims to be absolute
quantifications.
3. The studies in Paper I‐IV are made in laboratory environment.
4. The word adaptation and acclimatization are used in the way they are
described in Hendersonʹs Dictionary of Biology (abbreviations and dictionary
below; Lawrence, 2008). The word adaptation is mainly used with respect to
the third point in the explanations with the exception of “dark adaptation”
which refers to a short treatment in dark (mostly ~20 min).
xi
Analogy of the energy transfer in photosynthesis (http://www.oxygraphics.co.uk/epm.htm)
Analogy of the energy transfer in photosynthesis (http://www.oxygraphics.co.uk/epm.htm)
This doctoral thesis is dedicated to my husband with love – you
are the “sun” in this analogy of photosynthesis:

xii
ABBREVIATIONS AND DICTIONARY
ADP/ATP: adenosine‐di/tri‐phosphate, molecules involved in energy transfer
AF: absorption factor
ASW: artificial sea water
Chl a, Chl c: chlorophyll a, chlorophyll c (c1 and c2)
DW: dry weight
ETR: electron transport
Fm: maximum chlorophyll a fluorescence in dark adapted algae
Fo: minimum chlorophyll a fluorescence in dark incubated algae
Fv: variable chlorophyll a fluorescence (Fm‐Fo)
Fv/Fm: maximum quantum yield of photosystem II photochemistry
F/F’m: effective quantum yield of photosystem II photochemistry
FW: fresh weight
LHC: light‐harvesting antenna complex associated to photosystem
M1PDH mannitol‐1‐phosphate dehydrogenase enzyme
NADP+ / nicotinamide adenine dinucleotide phosphate, carrier of reducing ‐
NADPH2: power
NMR: nuclear magnetic resonance
BSW: Bothnian Sea water
P680; P700: photosynthetic reaction center in photosystem II and I, respective
PAR photosynthetic active radiation
Pmax: photosynthetic maximum capacity
PS: photosystem (PSII and PSI)
psu: practical salinity units
QA; QB primary and secondary quinine electron acceptor on D2 and D1
protein, respective
Rubisco: ribulose‐1.5‐bisphosphate carboxylase/oxygenase
Acclimation: physiological habituation of an organism to a change in a particular
environmental factor for example the onset of winter (Lawrence,
2008).
Acclimatization: physiological and/or behavioural habituation of an organism to
different climate or environment (Lawrence, 2008).
Adaptation: 1) evolutionary process involving genetic change by which a
population becomes fitted to its prevailing environment 2) structure
or habitat fitted for some special environment or activity; 3)
processes by which a cell, organ or organism becomes habituated to
a particular level of stimulus then being needed to produce a
response (Lawrence, 2008).

1
INTRODUCTION
Why Fucus?
In the brackish water of the Bothnian Sea, the brown algae Fucus vesiculosus L.
and Fucus radicans L. Bergström et L. Kautsky (Bergström et al., 2005) grow side by
side. The species belongs to the class Phaeophyceae and are the only large belt‐
forming algae in the Bothnian Sea (northerly part of the Baltic Sea). As the only
large belt‐forming algae, the species are important for the functioning in the
ecosystem. The algae are key species and provide other species, such as some fish
and invertebrate species, with habitats for feeding, sheltering and breeding
(Kautsky et al., 1992; Engkvist et al., 2004; Råberg & Kautsky, 2007). One example is
Idotea baltica´s (Baltic isopod, Tånggråsugga) use of the algae for grazing. I. baltica is
even also a part of the structuring force in macroalgae communities in the southern
Baltic Sea (Engkvist et al., 2004) which confirm that Fucus constitute a basis for food
webs.
As a consequence of the importance of F. vesiculosus and F. radicans in the
Bothnian Sea ecosystem it is of high interests to increase the understanding of the
physiology of the algae in relation to the environment, and changes in the
environment, to know how to protect these species from harmful anthropogenic
disturbances. F. vesiculosus has an ability to survive and grow in a wide range of
natural environmental conditions, for example a broad salinity gradient from the
brackish waters in the Bothnian Sea to the normal marine salinity in the Atlantic
Ocean. This makes it highly interesting to study the species from an
ecophysiological point of view. To better understand the physiological adjustments
for the F. vesiculosus in the Bothnian Sea, this ecotype has been compared to the F.
vesiculosus ecotype growing in the algae’s original environment of fully marine
water. The physiological adjustment to salinity and the tolerance for changed
salinities of the marine (Norwegian Sea) and brackish (Bothnian Sea) ecotype of F.
vesiculosus are some questions addressed in this thesis. F. radicans was included in
two of the studies in this thesis because of its importance for the ecosystem
functions mentioned above but also in order to investigate how the native
Bothnian Sea species is adapted to the environment compared to the Bothnian Sea
ecotype of F. vesiculosus. F. radicans is a recently discovered species and not much is
known about the physiology in the alga.
The Baltic Sea
The Baltic Sea has since the last ice age pass through several different stages
and has only been in the present form for ~3000‐3500 years. The Baltic Sea may

2
therefore be considered as a relatively young ecosystem (Voipio & Leinonen, 1984).
The first weak marine influence in the Ancylus Lake stage is recorded about 10 100
calibrated years before present (BP) (c. 8900 14C BP), representing a complex
transition to the later Littorina Sea with different phases of brackish‐water inflow
(Andrén et al., 2000). The large fluctuations of the salinity in the area during these
different phases have probably altered between 0 and 10–15 practical salinity units
(psu; Gustafsson & Westman, 2002). The present Baltic Sea (Figure 1) has a lower
salinity than the previous Littorina Sea (~8000‐4000 years BP; Björk, 1995). The
alternations in phases have formed the Baltic Sea´s ecology and biological diversity
through time (Johannesson & André, 2006). The changes in environmental
conditions from a fresh water lake to a marine environment occurred relatively fast
and possessed a significant stress on the organisms. The present Baltic Sea is an
ecologically marginal zone ecosystem for immigrated marine species and many
species demonstrate signs of isolation and on the average the Baltic Sea
populations, e.g. F. vesiculosus, have lost genetic diversity compared to the Atlantic
Ocean populations (Johannesson & André, 2006). The present salinity in the Baltic
Sea is regulated by freshwater inflow from precipitation and rivers and the marine
contribution of water through the
Baltic Sea entrance at the Kattegat
(HELCOM, 2006). The Baltic Sea
area has a surface salinity gradient
between the range of 25 psu at the
entrance from Skagerrak, 4‐6 psu in
the Bothnian Sea, and 1‐2 psu in the
most northern part of the Bothnian
Bay (HELCOM, 1996).
The salinity in the Baltic Sea, as it
put forward by some scientists, is
expected to be even lower in the
future due to an increase of
precipitation and runoff in the
northern part of the sea as a
response to higher temperature due
to climate changes (HELCOM,
2006). On the other hand, as it put
forward by other scientists, it is not
obvious how a climate change will
influence the Baltic Sea salinity
(Omstedt & Hansson, 2006). Due to
several feedback mechanisms, a
Figure 1. The present borders of the Baltic Sea (map modified from the webpage HELCOM, 2011).

3
Figure 2. The made to order Remane diagram show the diversity trend in terms of number of species related to the salinity. The diagram is modified from Attrill &Rundle (2002).
warmer atmosphere may reduce snow on land and ice cover on sea and increase
the evaporation, which may cause reduced river runoff and net precipitation over
the Baltic Sea. The Baltic Sea is influenced by large‐scale atmospheric circulation
and changes in the atmospheric circulation may cause a shift in the hydrological
cycle (Omstedt & Hansson, 2006). The most recent results and calculations, due to
climate changes and temperature rise, predict an increase of the salinity in the
Baltic Sea with 2‐3 psu. The reasons for this prediction are a greater reduces of
river runoff in the southern part of the Baltic Sea compared to the expected
increase in river runoff in northern part, which is a net‐decrease of the fresh water
inflow (Hansson et al., 2010). The salinity increase is also due to the oncoming raise
of sea level and thereby an enlarging of the marine water inflow into the Baltic Sea
(Gustafsson, 2004). Climate change is also off interest for the temperature in the
water and the ice cover of the Baltic Sea. Calculations indicate that the Baltic Sea
will become almost completely ice free with an on average increased air
temperatures of 2 C. Beyond the ice cover and the sea temperature, the
temperature also influence the stratification (Omstedt & Hansson, 2006).
Changes in the salinity have a great impact on the ecosystem in the Baltic Sea. If
the prediction of 1) decreased salinity agrees, it will become a decline in, for the
ecosystem functioning, important marine
species diversity (Figure 2). The Baltic
Sea is a species‐poor ecosystem and the
distribution of species are a mix of fresh
water and marine organisms and only
few species have been evolved to
brackish specialists. Most of the species
are believed to have colonised the area
during the latest 8000 year (Snoeijs, 1999).
A species‐poor ecosystem is more
vulnerable to disturbances, e.g. alien
species, than a species‐rich ecosystem
(Kaiser et al., 2006). If on the other hand
the scenario with 2) increased salinity
agrees it will be more favourable for the
marine species. Thus, in either scenario
transition in the salinity gradient is
expected and makes the study of the
ecophysiology of Fucus even more vital.

4
Growth Conditions: Norwegian Sea versus Bothnian Sea
In general, the growth and distribution of algae are mainly controlled by
competition, salinity, light, temperature, nutrients, substratum, sedimentation, ice
scouring and strength in water movements (Ramus et al., 1977; Wethey, 1985;
Kautsky & Kautsky, 1989; Kirst, 1989; Malavenda & Voskoboinikov, 2009). These
environmental conditions are highly diverse between the Norwegian Sea (part of
the Atlantic Ocean; Figure 3) and the Bothnian Sea (part of the Baltic Sea; Figure 1,
3). Also the depth distribution of macroalgae is affected by the environmental
conditions as e.g. light. The depth distribution of macroalgae in the Baltic Sea is
mostly controlled by light, sediment cover and ice‐scouring (Wærn, 1952; Bäck &
Ruuskanen, 2000; Eriksson & Johansson, 2003) whereas the depth distribution of
the marine macroalgae is highly affected by species competition (Ramus et al.,
1977). The ongoing eutrophication, nevertheless, increase the competitive
environment in the Baltic Sea. Ephemeral and fast‐growing species benefit from
the increased nutrient at the expense of perennial slow‐growing species, such as
Fucus. Reduced levels of light because of shad from epiphytic algae and decreased
light penetration into the water column because of higher amount of
phytoplankton and other particles force the algae to growth shallower. Several
investigations demonstrate that F. vesiculosus, among other algae, growing
shallower and shallower in the Baltic Sea (Eriksson et al., 1998; Bergström, 2005;
Torn et al., 2006; Korpinen et al., 2007; Rhode et al., 2008; Schories et al., 2009).
Chlorophyll (Chl) a concentration has been observed to increase in F. vesiculosus in
environments with reduced levels of light, but not enough to compensate for the
light deficiency on growth (Rhode et al., 2008). Growing shallower in the Baltic Sea
will make the F. vesiculosus belts less stable, because a larger part of the belts will
be affected by disturbances such as ice‐scouring, low‐water events and strong
wave actions. This in turn might change the overall productivity and ecology in the
whole algae belt community (Eriksson et al., 1998). Another negative effect from
the eutrophication is the reduced opportunities for algae zygotes to establish. The
establishment of zygotes from perennial macroalgae, as e.g. Fucus require bare
rocks. Eutrophication leads to increased sedimentation, due to the higher amount
of phytoplankton, as well as by fast‐growing filamentous algae covered
substratum and reduce the accessibility of bare rocks (Schramm, 1996; Kautsky &
Serrao, 1997). So far however, the eutrophication in the more southern part of the
Baltic Sea has not, to so great extent, affected the Fucus communities in the
Bothnian Sea, where algae were collected in this study.
5
Salinity
In the areas for collection of algae in present study the salinity was 34‐35 psu for
the marine algae in the Norwegian Sea and between 4‐5 psu for the brackish algae
in the Bothnian Sea (Figure 3).
The ability to acclimate to changed salinity and occurrence of physiological
responses because of changed salinity have been compared between marine and
brackish ecotype of F. vesiculosus with respect to water soluble organic compounds
(Paper I), relative amount of mannitol concentration and Chl a, c1 and c2 (Chl c)
concentrations (Paper II). Salinity change effects on spectral features, Chl a and c
content (Paper III) oxygen evolution, the relative amount of ribulose‐1.5‐
bisphosphate carboxylase/oxygenase (Rubisco), D1 protein (core protein of
photosystem II, PSII) and PsaA protein (core protein of photosystem I, PSI) in the
brackish ecotype of F. vesiculosus was studied as well (Paper IV). Physiological
differences, between the marine the brackish ecotypes of F. vesiculosus and between
F. vesiculosus and F. radicans without any experimental influence were also studied.
The studied parts were spectral features by Chl a fluorescence emission and Chl a
and c content in Paper III and photosynthetic maximum capacity and relative
amount of Rubisco, D1 and PsaA protein in Paper IV.
Tide versus no Tide: Light, Temperature and Desiccation
The light and temperature are different between the algae’s growth site in the
Norwegian Sea compared to the growth site in the Bothnian Sea, mainly because of
the tides in the Norwegian Sea but also because of the part time ice cover in the
Bothnian Sea.
Light: The optical characteristics of the growth environment of the Bothnian Sea
algae differ greatly from those of the Norwegian Sea algae grow in tidal zone as
e.g. F. vesiculosus. The Norwegian Sea ecotype of F. vesiculosus alternate between
exposure to unfiltered sunlight during low tide and lower irradiance and filtered
sunlight during high tide. In sea water, wave scattering, dissolved substances,
suspended sediments, and density of planktons reduce the depth of light
penetration and diminish the amount of light availably for the photosynthesis
(Dring, 1992). The productive zone of coastal sea water absorbs the blue and red
parts of the visible spectrum at shallow water and allowing the green and green‐
yellow wavelengths to penetrate deepest (Dring, 1992). The constant sublittoral
growing Bothnian Sea species receive much lower irradiance and on the average a
narrower range of wavelengths, mainly the blue‐green light, than the Norwegian
Sea ecotype F. vesiculosus. In the present study, the ability to tolerate differences in
salinity in both light and darkness, with respect to effects on relative amount of
mannitol and Chl a and c content, have been compared between the marine and

6
brackish ecotype of F. vesiculosus (Paper II). Light is also an important part of the
discussions in Paper III and IV.
Temperature and desiccation: At low tide, the intertidal marine algae F.
vesiculosus can be exposed to partly desiccation and high or low (freezing)
temperatures during summer and winter, respectively. The temperature and the
risk of desiccation for intertidal algae’s fluctuate several times every day in the
tidal rhythm. The Bothnian Sea species are not exposed to desiccation or to extreme
and fast temperature changes but grows in a constant lower temperature
compared to the marine ecotype of F. vesiculosus. In the present study, the ability to
tolerate desiccation at different temperatures with respect to photosynthetic yield
and mannitol content has been compared relatively between the marine and
brackish ecotype of F. vesiculosus (Paper II).
Inorganic Carbon, pH and Nutrients
In seawater, dissolved inorganic carbon (DIC) is present as a mixture of, and
equilibrium between, CO2, HCO and CO . The relative proportion of CO2 and
HCO and CO in seawater depends on pH, salinity and temperature. At low pH
most of the DIC occurs as CO2 and at high pH most of the DIC occurs as CO . In
marine water (35 psu) with a pH around 8.2, 90 % of DIC is presented as HCO
(Lobban & Harrison, 1997). The total concentration of DIC is higher in Norwegian
Sea compared to the Bothnian Sea. In marine water the amount is ~2.0 mol m‐3
(Surif & Raven, 1989) and in the brackish water the amount is ~1.0 mol m‐3 (Raven
& Samuelsson, 1988).
As mentioned above, the eutrophication in the Baltic Sea affects perennial algae,
as F. vesiculosus and F. radicans, negatively by e.g. reducing light penetration in the
water. It has also been confirmed that high level of nutrients limits the growth of
perennial macroalgae, including F. vesiculosus whereas annual algae are stimulated
by nutrient enrichment (Kraufvelin et al., 2010). However, greater amounts of
nutrients have also been confirmed to contribute to an increase of photosynthesis
in the Baltic Sea F. vesiculosus (Nygård & Dring, 2008).
The Species
Area of Distribution, Morphology and Reproduction
The brown algae F. vesiculosus is primarily a marine, North Atlantic, intertidal
species (Powell, 1963) but the alga is also found in the sublittoral of the brackish
Baltic Sea in areas with salinity down to approximately 4 psu (Wærn, 1952; Figure
3). F. radicans is a native brackish water species and in all probability endemic to

7
the Bothnian Sea and its immediate
surroundings (Bergström et al., 2005;
Pereyra et al., 2009; Figure 3).
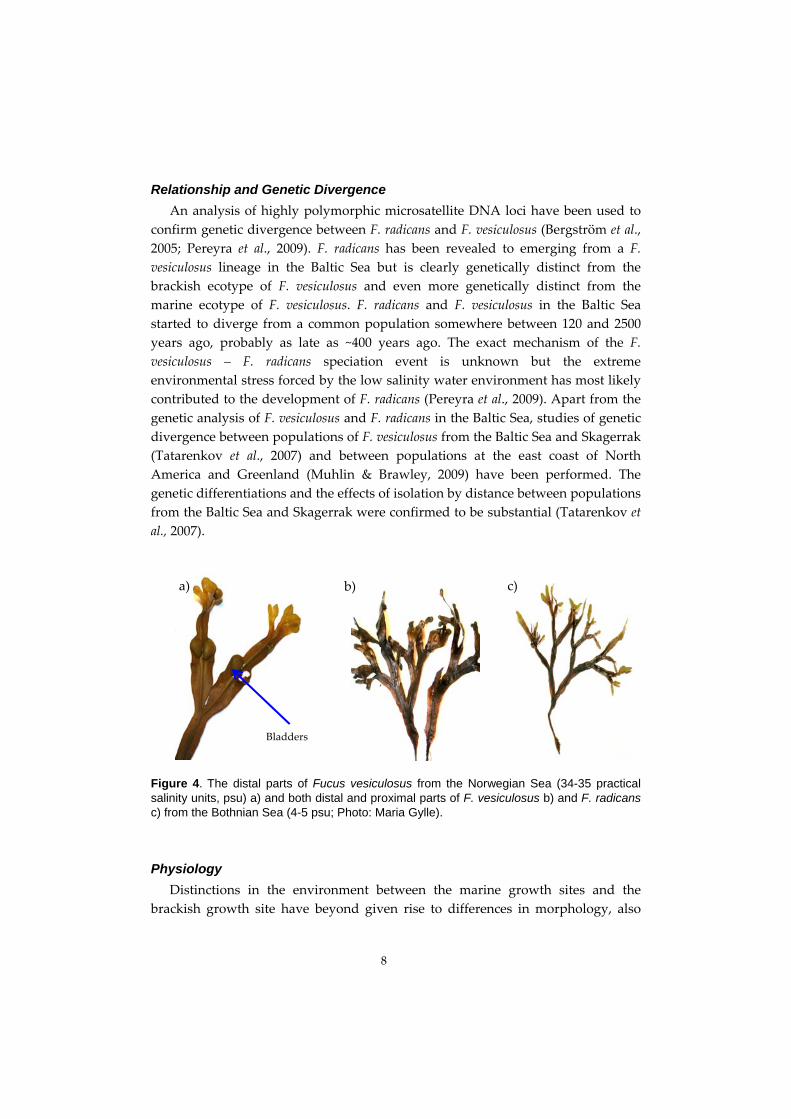
Comparison of the morphology
between the marine and brackish
ecotype of F. vesiculosus confirm that
the ecotype from low salinity is
smaller, have thinner thallus and lack
bladders (Kalvas & Kautsky, 1993;
Ruuskanen & Bäck, 1999; Figure 4a‐
b). The reasons for smaller size in
low salinity are probably due to low
photosynthetic rate, high respiration
(Munda & Kramer, 1977; Nygård &
Ekelund, 2006) and a constant
regulation of the cellular osmotic
potential (described below; Munda &
Kramer, 1977; Kaiser et al., 2006).
There are also differences between
brackish F. vesiculosus and F. radicans
from the Bothnian Sea with smaller,
thinner thallus and more branches at
F. radicans (Bergström et al., 2005;
Figure 4b‐c).
The northern distribution limit of
the Baltic Sea ecotype of F. vesiculosus
is probably determined by the
osmotic tolerance of the gametes (Serrão et al., 1996). According to Serrão et al.
(1999), F. vesiculosus does reproduce sexually in salinities down to 4 psu but the
reproduction is inhibited by physiological problems when the salinity becomes too
low. However, Fucus in the low salinity part of the Baltic Sea have also evolved
adaptive ecological characteristics by using of asexual reproduction by vegetative
propagules (spores; Tatarenkov et al., 2005; Bergström et al., 2005) and recent
findings of genetic diversity of F. vesiculosus show 30% cloned individuals in the
northern Baltic Sea (Johannesson & André, 2006). F. radicans reproduce sexually
but only to an extent of 20% of the individuals, the rest of the individuals have
asexual reproduction (Johannesson & André, 2006).
Figure 3. The range of distribution of Fucus vesiculosus () and the so far known range of distribution of F. radicans () around Scandinavia and Finland. Algae studied in present thesis were collected near Trondheim and at Åstön (map modified from the webpage Aqua-Scope, 2010).
8
Relationship and Genetic Divergence
An analysis of highly polymorphic microsatellite DNA loci have been used to
confirm genetic divergence between F. radicans and F. vesiculosus (Bergström et al.,
2005; Pereyra et al., 2009). F. radicans has been revealed to emerging from a F.
vesiculosus lineage in the Baltic Sea but is clearly genetically distinct from the
brackish ecotype of F. vesiculosus and even more genetically distinct from the
marine ecotype of F. vesiculosus. F. radicans and F. vesiculosus in the Baltic Sea
started to diverge from a common population somewhere between 120 and 2500
years ago, probably as late as ~400 years ago. The exact mechanism of the F.
vesiculosus – F. radicans speciation event is unknown but the extreme
environmental stress forced by the low salinity water environment has most likely
contributed to the development of F. radicans (Pereyra et al., 2009). Apart from the
genetic analysis of F. vesiculosus and F. radicans in the Baltic Sea, studies of genetic
divergence between populations of F. vesiculosus from the Baltic Sea and Skagerrak
(Tatarenkov et al., 2007) and between populations at the east coast of North
America and Greenland (Muhlin & Brawley, 2009) have been performed. The
genetic differentiations and the effects of isolation by distance between populations
from the Baltic Sea and Skagerrak were confirmed to be substantial (Tatarenkov et
al., 2007).
Figure 4. The distal parts of Fucus vesiculosus from the Norwegian Sea (34-35 practical salinity units, psu) a) and both distal and proximal parts of F. vesiculosus b) and F. radicans c) from the Bothnian Sea (4-5 psu; Photo: Maria Gylle).
Physiology
Distinctions in the environment between the marine growth sites and the
brackish growth site have beyond given rise to differences in morphology, also
b) a)
Bladders
c)
9
given rise to differences in physiological acclimatization and/or adaptation
mechanisms between the marine and brackish ecotype of F. vesiculosus.
In earlier studies, F. vesiculosus from the Baltic Sea areas has been confirmed to
have a lower growth rate, lower mannitol content, lower photosynthetic maximum
capacity (Pmax), greater dark respiration, lower ability to tolerant emersion stress,
lower tolerance threshold for heavy metals and a lower tolerance to ultraviolet‐b
radiation and high level of irradiance compared to F. vesiculosus from marine areas
(Bäck et al., 1992a; Bäck et al., 1992b; Pearson et al., 2000; Nygård, 2005; Nygård &
Ekelund, 2006; Nygård & Dring, 2008). The most important reasons for lower
growth rate and lower Pmax for the brackish ecotype of F. vesiculosus compared to
marine ecotype were confirmed to be the low salinity followed by lower
concentration of DIC (Nygård & Dring, 2008). For the recently discovered species
F. radicans there are only few physiological investigations made. These studies
however indicated that F. radicans has similar maximum quantum yield of PSII
photochemistry as both ecotypes of F. vesiculosus and similar dark respiration and
mannitol concentration as the Bothnian Sea ecotype (Nygård, 2005; Gylle, 2007).
Photosynthesis
Photosynthesis is the energy source for almost all life. Light energy is absorbed
as photons by pigments in the light‐harvesting antenna protein‐pigment complex
(LHC). LHC is located in the thylakoid membranes of the chloroplasts. The light
absorbing pigments in Fucus are mainly Chl a, fucoxanthin and Chl c. Chl’s absorb
red and blue light whereas fucoxanthin mainly absorb in the green region of light
(Dring, 1992). Photon capture by the LHC’s and the excitation transfer to PSII and
PSI provide the energy for oxidation of water (water split) and electron movement
to electron acceptors (Lawlor, 2001). The photon energy is transferred between
pigment molecules by resonance energy (a non‐radiative physical process) until it
reaches the core Chl a and the reaction centers (Taiz & Zeiger, 2006). When the
absorbed energy reaches the reaction centers, an electron is excited to a higher
energy level. In the excited stage of P680 (P680*) in PSII reaction center the energy is
1) used for electron transport in the photochemical reaction where the light energy
is converted to chemical energy (Figure 5), 2) re‐emitted as photon energy through
Chl a fluorescence when the excited electron falls back (Figure 6) or 3) dissipated as
heat. The relative sum of the energy is constant, so if the probability for
fluorescence increases the probabilities for photochemistry and/or heat dissipation
has to decrease (Taiz & Zeiger, 2006).

10
Electron Transport, NADPH2 and ATP in Photosynthesis
The electron transport system is found in the thylakoid membranes in the
chloroplast and might be considered in five parts: 1) the water‐splitting complex; 2)
the PSII protein‐pigment complex; 3) an electron carrier chain; 4) the PSI protein‐
pigment complex and 5) a group of electron carriers (reduce electron acceptors:
NADP+, O2; Lawlor, 2001; Figure 5). These multisubunit complexes convert the
light energy into chemical energy by catalyse of linear electron transport for a
production of reducing power, NADPH2, and carrier of energy, ATP. The energy
from the electron transport chain and 2H+ reduce 2NADP+ to 2NADPH2 at the
stroma side of PSI. The protons, produced at the water split generate ATP via ATP‐
synthase (catalyse ADP into ATP). ATP and NADPH2 are used in the further steps
of the photosynthesis reaction when CO2 is reduced to carbohydrates by the Calvin
cycle and for some other energy demanding processes such as nitrogen and
sulphur metabolism (Taiz & Zeiger, 2006). The photosynthetic status can be
determined by measuring of e.g. oxygen evolution or Chl a fluorescence. A usual
way to present the data is by photosynthesis/irradiance curves (P/I curves; Paper
IV). The initial slope () of the curve indicates the efficiency to use the absorbed light in the photosynthesis at limiting irradiance and the point where higher level
of irradiance no longer increase the photosynthesis, light saturation, indicate Pmax.
Photosystem II
Most of the electron transfer in PSII is coordinated by the core subunits
proteins, D1 and D2 in the reaction center (Mattoo et al., 1999). D1:D2 contains all the
primary reactants for charge separation within the PSII reaction center and are
structurally organized in five parts with binding sites for Chl´s, pheophytins
(Pheo), iron, caretenoids and plastoquinones where QA bounds to D2 and QB
bounds to D1 (McEvoy & Brudvig, 2006). Among components of PSII, the D1
protein is the most vulnerable for environmental stress. The D1 protein is rapidly
cycled during illumination and disruption of D1 protein cycling or losses of D1
protein pools are central to the photoinhibition of photosynthesis. The damage of
the D1 subunits requires D1 re‐synthesis and D1 replacement within PSII (Dasgupta
et al., 2008). Photoinhibition occurs by production of singlet oxygen, which
modifies the Chl a binding part of D1, under certain conditions as e.g. excess light,
ultraviolet radiation, low or high temperatures and salt (Sudhir & Murthy, 2004;
Nixon et al., 2005; Allakhverdiev et al., 2008; Dasgupta et al., 2008; Nixon et al.,
2010).

11
Figure 5. Photosynthetic electron transport in O2-evolving organism’s as plants, algae and blue-green bacteria. P680 is a chlorophyll molecule in the reaction center in photosystem II (PSII) which absorb light mainly at 680 nm. P700 is a chlorophyll molecule in the reaction center in PSI which absorbs light mainly at 700 nm. The primary step in oxygenic photosynthesis, the light induced charge separation, is when P680 absorb photons the molecule become excited to P680* and transfer electrons to pheophytin (Ph). The oxidized P680+ is re-reduced by the primary electron donator H2O via Mn4 in the oxygen evolution complex (OEC) and Yz. When H2O become oxidized the H2O molecule split and ½ O2 and 2H+ are released. On the reducing side of PSII, the electrons are transferred from pheophytin to the quinons, QA and QB, and further to the platstoquinon (PQ). The energized electrons pass through the electron transfer chain from molecules with more negative potential to molecules with less negative potential. When the PQ transfers electrons to the cytochrome b6f complex they also bring H+ from stroma to lumen and create a proton gradient over the thylakoid membrane, witch is used as energy in the ATP synthesis by the ATP synthase complex. The electrons from PQ are transferred further from cytochrome b6f complex to plastocyanin (PC) and to PSI where the electrons reach the oxidized P700+. Here the electrons is enegized again by excitation energy derived from photon energy trapped in the Chl. Electrons convert P700 to exited P700* and the electrons transfers further from P700* via the quinones, A0 and A1, membrane-bound iron-sulfur protein and ferredoxin (Fd) to the flavoprotein ferredoxin-NADP reductase (FNR) that reduces NADP to NADPH. The dashed red line represent cyclic electron flow around PSI and the F and H, in the purple box at the left side of the figure, represent energy dissipation as fluorescence and heat, respectively (Lawlor, 2001; Taiz & Zeiger, 2006). The figure is modified from a webpage of Ort (2007).

12
Photosystem I
Reaction center in PSI contains up to 14 subunits of which two are the large core
protein subunits PsaA and PsaB. PsaA and PsaB bounds most of reaction centers
Chl a and all the cofactors involved in light induced electron transfer from the
special Chl pair P700 to the electron acceptor ferredoxin (Hall & Rao, 1999; Nelson
& Ben‐Shem, 2006; Santabarbara et al., 2010). In addition to the linear electron
transfer involvement of PSI, there is a cyclic electron transfer around PSI. At least
two pathways of cyclic electron transport have been introduced: 1) the ferredoxin‐
plastoquinone reductase dependent route and 2) the NAD(P) dehydrogenase
dependent route (Johnson, 2005).
In the present study, Pmax and the relative amount of D1 protein (reflects relative
amounts of PSII) and PsaA protein (reflects relative amounts of PSI) with respect to
salinity, have been studied in the Bothnian Sea ecotype of F. vesiculosus (Paper IV).
Pmax and the relative amount of D1 protein and PsaA protein have also been
compared between the Norwegian Sea ecotype of F. vesiculosus, the Bothnian Sea
ecotype of F. vesiculosus and F. radicans (Paper IV).
Light Absorption Balance between PSII and PSI
Acclimation to light regimes is one of the most important and complex
responses of photosynthetic organisms to varying environmental conditions. Both
the level of irradiance and the quality of light influence the PSI and PSII
stoichiometry.
At low levels of irradiance, there are fewer PSII reaction centers in relation to
PSI reaction centers (Anderson et al., 1995; Hihara et al., 1998; Huang, 2006). Overall
a decrease in irradiance results in an increase of LHC in both PSII and PSI. The
increase of LHC might be achieved by 1) an increase in the size of existing
photosynthetic units or 2) by an increase in the number of photosynthetic units
(Dring, 1992; Lobban & Harrisson, 1997). In high levels of irradiance, however,
there are a decrease of cellular pigment content, photochemical activities (per‐cell
basis) and LHC size of PSII. There is also an increase of the PSII to PSI ratios,
Rubisco maximum photosynthetic rate (Anderson et al., 1995; Hihara et al., 1998;
Huang, 2006). Acclimations of the photosystems stoichiometry serve to regulate
the distribution of excitation energy between the photosystems and allow plants to
maintain a high quantum efficiency of photosynthesis under diverse light quality
(Chow et al., 1990; Anderson et al., 1995). In water, the light that reaching the
photosynthetic species depends on the degree of sunshine but also of the waters
optical absorbance, wave scattering, dissolved substances, suspended sediments,
density of plankton, growth depth and if the water is tidal or not.

13
Calvin Cycle, Rubisco and Carbon Supply
The energy stored in ATP and reducing power stored in NADPH2 is used in the
Calvin cycle when CO2 is reduced to carbohydrates through a series of reactions
and intermediates. The Calvin cycle consists of three major parts: 1) CO2
carboxylation of ribulose‐1.5‐bisphosphate (RuBP) catalyzed by Rubisco, 2)
formation of triose phosphate by reduction of 3‐phosphoglycerate catalyzed by 3‐
phosphoglycerate kinase and 3) regeneration of RuBP by several enzymatic
reactions steps (Taiz & Zeiger, 2006; Figure 5). In plants, the triose phosphate is
converted to fructose 6‐phosphate and further to starch in the chloroplasts or
sucrose in the cytosol. In Fucus and other brown algae, the triose phosphate is 1)
converted to fructose 6‐phosphate and further to laminaran in the cytosol or 2)
converted to mannitol in the chloroplast and/or cytosol. The products are
thereafter stored in the cytosol (Bidwell, 1958; Yamaguchi et al., 1966; Kremer, 1985;
Michel et al., 2010). It has been suggested that the synthesis of laminaran and
mannitol in the chloroplast are connected to the pyrenoids (Davis et al., 2003).
Michel et al. (2010) identified the genes for the enzymes involved in carbon storage
in the brown alga Ectocarpus siliculosus and confirmed that the alga has a complete
set of enzymes for synthesis of mannitol, laminaran and trehalose but missing the
pathways for sucrose, starch and glycogen.
Calvin cycle is the photosynthetic rate‐limiting step because of the rate‐limited
CO2 fixation by Rubisco. Rubisco is activated by Mg2+, CO2, light and specific
Rubisco activase (Lobban & Harrison, 1997). The most common structure of
Rubisco consists of eight large (L) subunits (50‐55 kDa) and eight small (S) subunits
(15 kDa), L8S8 (~550 kDa; Raven, 1997). The synthesis of Rubisco is regulated by
light on both transcriptional and post‐transcriptional levels (Berry et al., 1986).
Reduced dark transcription rate of mRNA is compensated by an increase in the
stability of the already available mRNA (Shiina et al., 1998). The levels of irradiance
impact on the regulatory mechanisms on Rubisco synthesis has been suggested to
be connected to the redox state in the chloroplasts (Salvador & Klein, 1999). In
algae the carbon supply is important in the regulation of the mechanisms behind
synthesis of Rubisco (Giordano et al., 2005). Fucus use HCO and CO2 as DIC
sources. Rubisco, however, requires CO2 as a substrate in catalysis of RuBP to 3‐
phosphoglycerate. Therefore, it has been suggested that HCO is converted to CO2
by acidification or by carbonic anhydrases in the cell wall (Raven, 1997).
In the present study, the relative amount of Rubisco with respect to salinity has
been investigated in the Bothnian Sea ecotype of F. vesiculosus (Paper IV). The
relative amount of Rubisco has also been compared between marine ecotype of F.
vesiculosus, brackish ecotype of F. vesiculosus and F. radicans (Paper IV).

14
Photosynthetic Apparatus - Plants versus Brown Algae
In general the photosynthesis is similar in Chl a/b plants and brown algae but
there are some differences in photosynthetic apparatus between the organisms: e.g.
1) plants only use atmospheric CO2 as DIC source while Fucus use both HCO and
CO2 (Lobban & Harrison, 1997), 2) plants have mainly Chl a and b as light‐
harvesting pigments whereas Fucus have Chl a, c and fucoxanthin (Dring, 1992), 3)
the plant chloroplasts have two membranes whereas Fucus have two membranes
plus two membranes of chloroplast endoplasmatic reticulum surrounding the
organelle (Davis et al., 2003), 4) plants has grana thylakoids in the chloroplasts
whereas the brown algae thylakoids are arranged in groups of three in the
chloroplasts (Gibbs, 1970; Berkaloff et al., 1983), 5) CO2 fixation by Rubisco and
formation of carbohydrates in plants occurs in the chloroplast stroma whereas
some brown algae have pyrenoids connected to the chloroplast where the reduce
of CO2 occurs (Davis et al., 2003), and 6) plants synthesis sucrose and starch as
primary photosynthetic products while brown algae synthesis mannitol and
laminaran (Bidwell, 1958; Yamaguchi et al., 1966; Davis et al., 2003).
Chlorophyll a Fluorescence
When an electron is excited to a higher level of energy state, by absorbed light
photons in PSII, the energy has three different pathways to transform: 1) light
energy convert to chemical energy by photochemical electron transport (described
above), 2) Chl a fluorescence and/or 3) dissipate as heat. The Chl a fluorescence
arise when the excited electron falls back and the energy is re‐emitted as photon
(light) energy through Chl a emission. The Chl a fluorescence emission can be
analysed and used to determine the status of photosynthesis by e.g. measuring of
maximum quantum yield of PSII photochemistry or electron transport (ETR). Chl a
fluorescence emission can also be used for identification of spectral features,
analysis of the photosynthetic apparatus and PSI/PSII stoichiometry.
The minimum fluorescence (Fo) is the emission from Chl a antenna before the
photochemical events take place and all reaction center of PSII are in the open state
(Figure 6). This reflects the size of PSII Chl antennae (Krause & Weise, 1991).
Reaction center II is considered as open when charge separation between electron
donator P680 and the primary electron acceptor pheophytin can occur; if not the
reaction center II is closed (Lazár, 2003). Fo can be induced and measured by giving
dark adapted algae a pulse of week red light and register the signal Chl a sends
back as fluorescence (Figure 6). The maximum fluorescence (Fm) is the fluorescence
when all reaction center II are closed (no further transfer of electrons from the
reaction center Chl because all electron acceptors after pheophytin, quinon A, are
reduced) and the fluorescence is emitted from excited state of the reaction center.
Fm can be induced and measured by giving dark adapted algae a pulse of

15
saturating light (Figure 6). Variable fluorescence (Fv) is the difference between Fm
and Fo. Fv indicate photochemical quenching of the fluorescence (photochemical
electron transport). A combination of fluorescence variables expressed as (Fm‐
Fo)/Fm = Fv/Fm indicate the maximum quantum yield of PSII photochemistry
(Krause & Weis, 1991) or the ability for PSII reaction centers to use the available
excitation energy for photochemistry (Falkowski & Raven, 1997). Fv/Fm is lowered
by all effects that cause decrease in the rate of linear electron transport like
inhibition of PSII reaction center and increase of heat dissipation. Both an increase
of Fo and/or a decrease of Fm may contribute to a decrease of Fv/Fm. The level of
emission of Chl a fluorescence in the pigment bed is affected by optical properties
(e.g. thallus structure), size of Chl antenna, Chl a concentration, functionality of
PSII reaction center, size of the core antenna versus peripheral antenna, rate of
State‐I‐State‐II transition, the efficiency of the photosynthetic protection system
(e.g. xanthophylls cycle) and stress level of the algae (Björkman & Demmig, 1987;
Krause & Weis, 1991; Hall & Rao, 1999; Pearson et al., 2000; Zhu et al., 2005).
Determination of the photosynthetic status by measuring of electron transport
can be done by an initial measurements of Fv/Fm and then repeated
measurements of F/F’m during stepwise increase of irradiance. F/F’m is the effective quantum yield of PSII photochemistry when the photosynthetic
apparatus is hit by light. ETR is calculated as:
ETR = PAR * AF * F/F’m * 0.5
AF is the absorption factor and can be measured as the fraction of incident PAR
absorbed by the thalli (Beer et al., 2000; Nygård & Dring, 2008). PAR is the
photosynthetic active radiation used at the stepwise increase of irradiance and 0.5
is used for allow of equal involvement of PSII and PSI (Beer et al., 2000; Nygård &
Dring, 2008).
For identification of spectral features and analysis of differences in the
photosynthetic apparatus and PSII/PSI stoichiometry in photosynthetic organisms,
Chl a fluorescence emission spectra at 77 K (–196 °C) can be used. 77 K emission
spectra provide information on the distribution of excitation energy between PSII
and PSI. The emission spectrum of leaves at 77 K demonstrates three major peaks
with maxima at around 685, 695 and 735 nm (Pospíšil et al., 1989) and it is
confirmed that peaks at 685 and 695 nm originating in PSII and a peaks at 720‐735
nm originating in PSI (Papageorgiou, 2004). The main emitter of the 685 nm peak
in higher plants and cyanobacteria is the CP43 reaction center chlorophyll‐binding
protein while the 695 nm shoulder is emitted by the Chl’s of the CP47 protein
(Keränen et al., 1999).

16
In present study, Chl a fluorescence has been used as an indicator of
photosynthetic status after experimental treatments (Paper II) and also in the aim
to compare the photosynthetic status between marine ecotype of F. vesiculosus,
brackish ecotype of F. vesiculosus and F. radicans (Paper IV). 77 K Chl a fluorescence
emission spectra have been used to identify differences in the spectral features and
PSII/PSII stoichiometry between the marine ecotype of F. vesiculosus, the brackish
ecotype and F. radicans. The method has also been used to analyse effects of salinity
changes at spectral features in the brackish ecotype of F. vesiculosus (Paper III).
Compatible Solutes, Osmolytes and Mannitol
Compatible solutes are organic molecules that sustain osmotic potential and
protecting and stabilizing enzymes, membranes and structural macromolecules in
the cell during salt stress conditions (Kirst, 1989). The protein protection effect
probably occurs by maintaining a hydration shell around the protein surface
Time
Fast phase (ms) Slow phase (s)
Fluorescence emission
Figure 6. Schematic figure of chlorophyll a fluorescence induction from photosystem II (PSII) during illumination after a dark adaption. Fo, (0) is the minimum fluorescence when photosystem II (PSII) reaction centre’s are open. Once the reaction centre chlorophylls are excited and quinon A (QA) becomes reduced (via pheophytin), the fluorescence rapidly rises to an inflection point, I. When electrons are transferred from reduced QA to QB the rate of increase in fluorescence decrease, D. Fm, (P) is the maximum fluorescence level when PSII reaction centre’s are closed for photon capture because all QA are reduced. The S phase is mainly due to non-photochemical quenching because the Calvin cycle CO2 assimilation is not fully activated. The M phase is caused by a temporary accumulation of NADPH2 due to suboptimal rates of CO2 reduction. Fv is the variable fluorescence. The figure is modified from Hall & Rao (1999).
17
(Arakawa & Timasheft, 1983) or by direct interaction with the proteins (Schobert,
1977). Commonly accumulated compatible solutes in algae are e.g. sugar alcohols
as mannitol and glycerol and the quaternary amine glycine betaine and the tertiary
sulphonium compound ‐(dimethylsulphonio)‐propionate (DMSP) (Kirst, 1989).
A relevant example of osmoregulation is when the marine F. vesiculosus grows
in the brackish, low salinity, water in the Bothnian Sea. In low salinity the algae are
exposed to hypoosmotic stress and this leads to a need of reducing the influx of
water into the cell. The algae adapt to low salinity by tolerating an expansion of the
cell volume or by a reduction of osmotically active solutes. In higher salinity the
opposite would occur. In the first phase of an osmotic acclimatization, a rapid
change of cellular turgor pressure caused by water flow in or out of the cell takes
place. The direction of the water flow depends on the osmotic gradient. In the
second phase, an osmotic adjustment by cellular concentration of osmolytes occurs
and this will continue until a new steady state is achieved (Kirst, 1989). The
osmolytes consist of inorganic ions that accumulate in the vacuole and organic
compounds accumulating in the cytosol (Kirst 1989; Bäck et al., 1992b). Brown
algae are capable of osmotic adjustment by changed concentrations of inorganic
ions, mostly K+, Cl‐ and NO3‐ in the vacuole (Kirst & Bisson, 1979; Davison & Reed,
1985) as well as changes in mannitol content in the cytosol (Munda & Kremer,
1977; Davison & Reed, 1985; Reed et al., 1985; Bäck et al., 1992b).
Mannitol is one of the most widely occurring sugar alcohol compounds and
found in bacteria, fungi, algae and plants. In these organisms the compound acts as
a compatible solute and has multiple functions, including osmoregulation, storage,
regeneration of reducing power and scavenging of active oxygen species (Iwamoto
& Shiraiwa, 2005). In Fucus mannitol is also one of the primary photosynthetic
products (Bidwell, 1958; Yamaguchi et al., 1966; Davis et al., 2003). The synthesis of
mannitol in brown algae has been suggested to occur in the cytosol (Kremer, 1985)
and/or in the chloroplast connected pyrenoid (Davis et al., 2003). The pathway for
synthesis of mannitol is revealed to be from the photosynthesis product triose
phosphate via fructose‐1.6‐2phosphate, fructose‐6‐phosphate and mannitol‐1‐
phosphate. An increase in the activity of the enzyme mannitol‐1‐phosphate
dehydrogenase (M1PDH), catalysing the step between fructose‐6‐phosphate and
mannitol‐1‐phosphate, has been confirmed as a response to increased salinities
(Davison & Reed, 1985; Ivamoto et al., 2003). Davison & Reed (1985) suggest that an
increase of mannitol in algae as a response to higher salinity also is an acclimation
connected to photosynthesis which enables brown algae to accumulate mannitol
for turgor adjustment. This suggestion is in agreement with an increase of
photosynthetic products built‐in to mannitol at higher salinities (Munda & Kremer,
1977). Lower mannitol content in the algae during the winter (Stewart et al., 1961;
Davison et al., 1984; Gómez & Wiencke, 1998; Gylle, 2007) gives a lower capacity
18
for osmotic adjustment and it has been suggested that a variety of minor
nitrogenous substances are part of cytoplasmic osmolytes during the winter
(Davison & Reed, 1985).
In the present study, the qualitative contents of water soluble organic
compounds and the compounds connection to salinity have been studied in marine
and brackish ecotypes of F. vesiculosus (Paper I). The relative quantitative contents
of mannitol and mannitol´s connection to salinity changes in light and dark have
been studied in marine and brackish ecotypes of F. vesiculosus (Paper II).
The Aims of the Thesis
The general aims of this thesis were to compare physiological aspects between
the Norwegian Sea ecotype and the Bothnian Sea ecotype of F. vesiculosus as well
as between the two Bothnian Sea species F. vesiculosus and F. radicans.
Experimental influences were above all to investigate the physiological ability of F.
vesiculosus to tolerate different salinities and also to investigate the algae’s
responses to light and dark. More specific, the aims in the included Papers were:
To compare the qualitative content of different types of water soluble organic
compounds in the Norwegian Sea ecotype of F. vesiculosus with the Bothnian
Sea ecotype and to evaluate whether qualitative content of compounds is
related to salinity at their respective growth sites (Paper I).
To investigate the response to temperatures and desiccation of the brackish
ecotype of F. vesiculosus in comparison to the marine ecotype. In addition, the
aim was to investigate the importance of salinity and light for mannitol as
available energy reserve and osmotic adjuster, and also the importance of
salinity and light for Chl content, in the two ecotypes of F. vesiculosus (Paper II).
To investigate if the light conditions in the Bothnian Sea have caused
compensatory changes in the photosynthetic apparatus of the Bothnian Sea
ecotype of F. vesiculosus and F. radicans compared to the Norwegian Sea ecotype
of F. vesiculosus. The aims were also to identify spectral features of both ecotype
of F. vesiculosus and F. radicans and to analyse differences in the photosynthetic
apparatus between the algae. In addition, the aim was to investigate if the
native Bothnian Sea species F. radicans had different spectral features
adaptations compared to the Bothnian Sea ecotype of F. vesiculosus. Finally,
there was also an aim to analyse the short‐term (1 week) effect of salinity (5, 10,
20, and 35 psu) on the photosynthetic apparatus of the Bothnian Sea ecotype of
F. vesiculosus (Paper III).

19
To investigate photosynthetic differences between the marine ecotype of F.
vesiculosus and the brackish ecotype of F. vesiculosus and F. radicans and to study
if photosynthetic differences were correlated to the relative amounts of
photosynthetic proteins, as Rubisco, D1 (reflects PSII) and PsaA (reflects PSI). In
addition, the aim was to investigate if the native Bothnian Sea species F. radicans
had other adaptations to the environment than the, in origin marine intertidal F.
vesiculosus ecotype in the Bothnian Sea. Further to this, the aim was to
investigate if photosynthesis and the relative amounts of Rubisco, D1 and PsaA
were correlated when the Bothnian Sea ecotype of F. vesiculosus was affected by
varying salinities (5, 10, 20, 35 psu) in the short‐term (1 week; Paper IV).
MATERIALS AND METHODS
Collections and Cultivations
The marine ecotype of F. vesiculosus was collected from the intertidal area at the
Norwegian Sea in Norway (34‐35 psu; Trondhjem Biological Station; 63°43´N;
10°39´E; Paper I‐IV; Figure 3). Brackish F. vesiculosus (Paper I‐IV) and F. radicans
(Paper III, IV) were collected from 2‐4 m depth in the Bothnian Sea in Sweden (4‐5
psu; East side of Åstön; 6224´N; 1745´E; Figure 3). The algae were transported in
plastic bags in darkness during the trips to the laboratory. Replicates were defined
individuals with own holdfast and replicate and controls were used in all studies
(n = 5 or 10). In the laboratory the algae were cultivated in natural salt water or in
artificial salt water in a cold room. For detailed culture conditions see Table 1 and
Paper I‐IV.
Experimental Procedures and Analyses
The experiments in Paper I and II were designed for studies of the Norwegian
Sea and the Bothnian Sea ecotypes of F. vesiculosus (n = 5) responses to different
salinities. The salinities used in the experiments were 5 and 35 psu. In Paper II
salinity responses in both dark and light cultivated algae were included. In Paper
III and IV only the brackish F. vesiculosus was tested in different salinities and the
salinities were 5, 10, 20 and 35 psu. A study of the response of the Norwegian Sea
and the Bothnian Sea ecotypes of F. vesiculosus to desiccation at different
temperatures was included in Paper II. Samples for analyses were collected before
(named initial), during and after experimental treatments and only healthy
vegetative part of the tips without epiphytes were used. Studies of the Norwegian
Sea ecotype of F. vesiculosus and the Bothnian Sea ecotype of F. vesiculosus and F.

20
radicans without any experimental influence are presented in Paper III and IV (n =
10). Details in materials and methods are presented in respective Paper.
Table 1. Compilation of the pre-experimental and experimental conditions used in Papers I-IV. The time of the year is the period for collection and the acclimation time is the period of pre-experimental procedures before the experiments started. N is the number of replicates. The same temperature and level of irradiance were used during the acclimation and experiments with exception of Paper II where some algae were treated in darkness during the experiment.
Papers Time of
the year
Acclimation
(days) n
Temp
(°C)
Irradiance
(mol m‐2 s‐1)
Paper I May 7 5 6‐11 45‐50
Paper II September
May
7
3 5
0; 6‐10; 20
6‐9
80
100
Paper III, IV May 2.5 5 or 10 6‐8 90
Analysis of Water Soluble Organic Compounds and Chlorophyll
For analyses of the differences in the content of water soluble organic
compounds (Paper I) and mannitol concentration (Paper II), 13C nuclear magnetic
resonance (NMR) and 1H NMR were used. The shift values were determined by
using acetone (215.94 ppm) as an internal reference for the 13C spectra and by using
3‐(Trimethylsilyl)‐1‐propanesulpfonic acid sodium salt (TMSPS; 0 ppm) as an
internal reference for the 1H spectra. For determination of mannitol concentrations
in Paper II, TMSPS was added in known concentrations and the relative amount of
mannitol is presented in mmol kg‐1 DW (dry weight).
For determination of Chl a and c content (Paper II, III), the Chl’s were extracted
by 90 % acetone and the absorbance was measured at 630, 664 and 750 nm. The
relative amount of Chl’s are presented in mg g‐1 FW (fresh weight) or DW.
Chl a Fluorescence and Oxygen Evolution
The ratio of Fv/Fm (Paper II) and relative ETR (Paper IV) were measured as an
indicator of differences in photosynthetic status by use of pulse amplitude
modulated fluorometer (Diving PAM, WALZ, Germany). The fluorescence was
measured after an initial 20 min dark adaptation. In the ETR measurements, nine
steps with increasing irradiance between 0 and 700 mol m‐2 s‐1 (30 s at each step)
were used to induce photosynthesis, interrupted by dark periods of 2 min.

21
In order to identify spectral features, analyse differences in the photosynthetic
apparatus and PSI/PSII stoichiometry in the algae, Chl a fluorescence emission
spectra at 77 K (‐196 °C; liquid nitrogen) and 193 K (‐80 °C; carbon acid ice) were
determined (Paper III).
Oxygen evolution by Clark‐type oxygen electrode (Rank Brothers Ltd, DM 10,
England) was measured in order to analyse photosynthetic status after treatments
in different salinities (Paper IV). Inorganic carbon was added at the measurements
(3 mM NaHCO3). Light periods (5 min) with increasing irradiance in eight steps
between 0 and 300 mol m‐2 s‐1 were used to induce photosynthesis, interrupted by
dark periods of 5 min.
Relative Amount of D1 protein, PsaA protein and Rubisco
For measuring of the relative amount of D1 protein, PsaA and Rubisco, SDS‐
PAGE and immunoblotting were used (Paper IV). Proteins in the extracted
samples contained 5 g ml‐1 Chl for detection of D1 and PsaA protein and 1 g ml‐1
Chl for detection of Rubisco. The proteins were electrophoretically separated by
SDS‐PAGE and then transferred to nitrocellulose membranes. After the
transferring, the proteins were probed by incubation in: 1) primary antibodies
PsbA (anti‐D1, PSII), PsaA (anti‐PSI‐A) and RbcL (anti‐Rubisco) in dilution 1:50
000, 1:500 and 1:5000, respectively and 2) secondary antibodies for PsbA, PsaA and
RbcL in dilution 1:10 000, 1:50 000 and 1:20 000, respectively. The antibody‐protein
complexes were visualized using ECL chemiluminescence detection reagents and
developed on X‐OMAT film. The blotting was repeated 5‐7 times for each replicate
and for each class of protein and the developed photos of the blots were analysed
by using ImageJ software (developed by Rasband, 1997‐2011; use reference, Shim et
al., 2010).
Data Analysis
In order to analyse differences and define effects of treatments a general linear
model analysis of variance (GLM ANOVA) or a one‐way analysis of variance
(ANOVA), followed by Tukey’s pairwise test for a complete comparison, have
been performed in Paper II‐IV. Before the ANOVA tests were preformed the
data’s were tested for normality by Anderson‐Darling goodness‐of‐fit test. All
factors have been categorical and fixed. The confidence intervals were set to 95%.
The standard deviation values are given in the Papers figures and tables. Paper I is
a qualitative investigation and does not include statistic.

22
RESULTS AND DISCUSSION
Content of Water Soluble Organic Compounds and the Concentration of Mannitol in Fucus vesiculosus (Paper I, II)
For qualitative analyses of differences in water soluble organic compounds
between marine ecotype and brackish ecotype of F. vesiculosus 13C NMR and 1H
NMR were used. The methods were also used to try to evaluate whether the
qualitative content of compounds was related to salinity at the algae’s respective
growth site (Paper I). 1H NMR was also used for quantification of mannitol
concentration (mmol kg‐1 DW) in the marine and the brackish ecotypes of F.
vesiculosus and to investigate differences between the algae (Paper II). The aims for
the quantifications of mannitol were 1) to investigate differences in mannitol
content responses to desiccation at different temperatures (0, 10 and 20 C) and 2) to investigate the importance of salinity and light for the available energy reserve
and osmotic adjustment in both ecotypes of F. vesiculosus.
Water Soluble Organic Compounds
The results indicate more water soluble organic compound/compounds in the
Norwegian Sea, marine ecotype of F. vesiculosus compared to the Bothnian Sea,
brackish ecotype of F. vesiculosus (Paper I; Figure 7). Experimental treatments with
the marine ecotype in low salinity (5 psu) and the brackish ecotype in high salinity
(35 psu) did not affect the number of water soluble organic compounds in neither
of the ecotypes (Paper I). The
results from the experiments
suggest that the differences
between the marine and the
brackish ecotype is related to
something else than the salinity
at the growth sites. Earlier
results have confirmed that
mannitol is the only organic
compound in Fucus that occurs
in enough concentrations to act
as osmolyte (Reed et al., 1985)
and the high numbers of scan
for detection of the compounds
in present study also indicate
that the content is too low to
have any impact on the osmotic
pressure.
Figure 7. Qualitative analysis by 13C nuclear magnetic resonance (NMR) spectra of a) marine Fucus vesiculosus (34-35 psu, practical salinity units) and b) brackish F. vesiculosus (4-5 psu) The spectra are representative of five replicates. A is acetone, the internal standard for calibrating of shift and M is mannitol.
a)
b)
Chemical shift (ppm)

23
An alternative explanation to the differences in water soluble organic
compound/compounds between the algae is a greater need of the compounds in
the intertidal environment for the marine ecotype of F. vesiculosus. One of the
differences in compounds between the ecotypes is suggested to be due to glycine
betaine, so far only detected in the intertidal marine ecotype of F. vesiculosus (Paper
I). Glycine betaine is a compatible solute and has been concluded to be involved in
the protection of protein complexes and membranes during drought and high and
low temperatures (Sakamoto & Murata, 1998; 2000). Therefore, it is possibility that
glycine betaine, or other compounds, synthesised in the marine ecotypes of F.
vesiculosus, but not in the brackish ecotype, have complementary functions in the
cells as compatible solutes to protect the algal cells from damaging oxygen radicals
formed during low tide. Production of reactive oxygen radicals has been confirmed
to increase after exposure to high levels of irradiance, ultraviolet radiation,
desiccation and/or rapid temperature changes (Collén & Davisson, 1999). It has
earlier been suggested that the brackish, sublittoral, Bothnian Sea ecotype of F.
vesiculosus has evolved reduced ability to grow in the tidal zone (Pearson et al.,
2000) and the results in Paper I suggest that lost of ability to synthesize certain
types of water soluble organic compounds could be a part of the explanation.
Mannitol
The results indicate a much higher mannitol concentration in the marine
ecotype compared to the brackish ecotype of F. vesiculosus (Paper II). This result is
in agreement with earlier measurements (Munda, 1967; Bäck et al., 1992b).
Experimental treatment of the algae in desiccation at different temperature did not
cause any changes in the mannitol content. It has previously been reported that the
tidal rhythm might be too short to achieve a new steady state of organic osmolyte
concentrations (Kirst, 1989). Therefore, 5 h of desiccation is probably too short time
to observe if there are any significant changes in mannitol content as a response to
desiccation (Paper II). The temperature however, indicates a mannitol content
response in the marine ecotype of F. vesiculosus. In the experiment the algae were
treated in 0, 10 and 20 C two days before the desiccation treatment and this was
enough time to change the mannitol content. The marine ecotype of F. vesiculosus
had higher level of mannitol in algae treated in 0 C compared to higher
temperatures (Paper II), and this is likely due to a decrease in respiration rate at
low temperatures observed by Atkin & Tjoelker (2003). A consequence of higher
mannitol concentration is a lowering of the freezing point in the algae, so this
increase of the mannitol might be an acclimation to protect intertidal F. vesiculosus
at low tide during the winter.
In Paper II there was also an experiment for investigation of the importance of
salinity and light for the available energy reserve and osmotic adjustment in both

24
ecotypes of F. vesiculosus included. The mannitol content was studied as a response
to salinity changes (5 and 35 psu), in both short time (6 h) and longer time (72 h),
and the algae were treated in both light and darkness. The measuring times used in
the experiment were chosen to resemble the tidal rhythm, but it was clear that 6 h
was too short for significant changes in mannitol content to occur (also discussed
above) in neither of the marine or the brackish ecotype of F. vesiculosus. Brown
algae use both mannitol and changing in inorganic ions concentration for osmotic
adjustment (Kirst & Bisson, 1979; Davison & Reed, 1985) and during short time
tidal rhythm the ions is probably the most important osmolytes (Kirst, 1989).
However, 24–72 h was enough time to confirm that salinity is an important factor
when explaining why the marine ecotype of F. vesiculosus has more mannitol than
the brackish ecotype. The experiment indicated that each ecotype approached the
other’s mannitol content when both ecotypes were treated at 35 psu and light.
When the marine F. vesiculosus was treated at 5 psu and the brackish ecotype was
treated at 35 psu, their mannitol contents became almost the same. It has earlier
been revealed that marine ecotype has a higher Pmax and lower respiration
compared to the brackish ecotype of F. vesiculosus and that the brackish algae
increase their Pmax under higher salinities (Nygård 2005; Nygård & Ekelund, 2006;
Nygård & Dring, 2008; Paper IV). These ecotypes differences in Pmax and the
brackish ecotype response in higher Pmax at higher salinity are most certainly an
important part of the explanations for mannitol differences between the two
ecotypes and the increase of mannitol in the brackish ecotype in higher salinity.
The results in Paper II also indicate that mannitol content in the brackish
ecotype of F. vesiculosus increases as a response to salinity in light but not in dark,
where the concentration was stable during 24 h and then decreased. This
demonstrates that light and continuous photosynthesis are necessary for osmotic
adjustment by mannitol, at least at a time scale longer than 24 h. An earlier study
demonstrated that the brown algae Pilayella littoralis increased its mannitol content
during the first 24 h at higher salinity in darkness (Reed et al. 1985). The suggestion
is therefore that the mechanism for osmotic adjustment by mannitol is complex
and due to increased activity by mannitol synthesizing enzymes (Davison & Reed,
1985; Iwamoto & Shiraiwa, 2005) and also acclimation connected to photosynthesis
(Munda & Kremer, 1977; Davison & Reed, 1985). A rapid decrease in mannitol
content in the marine ecotype of F. vesiculosus incubated in dark, regardless of
salinity; indicate that energy utilization is an important part of mannitol regulation
as well.
Generally, the results in Paper II point to that the differences in mannitol
content between the marine ecotype and the brackish ecotype F. vesiculosus are due
to differences in both salinity and light conditions in the growth environments. F.
radicans growth side by side with F. vesiculosus in the Bothnian Sea, in the same

25
level of irradiance and same salinity condition and earlier results has confirmed
similar mannitol concentration in these brackish Fucus species (Gylle, 2007).
Quantum Yield of PSII Photochemistry (Paper II, IV)
Maximum quantum yield of PSII photochemistry (maximum efficiency to use
the absorbed light in the photosynthesis), Fv/Fm values, were used to compare the
brackish ecotype and the marine ecotype F. vesiculosus response to desiccation at
different temperatures (0, 10 and 20 C; Paper II). In addition, Fv/Fm was used to
analyse the differences in PSII photochemical efficiency between the marine
ecotype of F. vesiculosus, the brackish ecotypes of F. vesiculosus and F. radicans
(Paper IV). In order to analyse differences in PSII photochemical efficiency in the
brackish ecotypes of F. vesiculosus treated in different salinities, the initial slopes () were calculated from P/I‐curves measured by oxygen evolution (Paper IV).
Fv/Fm as a Measure of Tolerance to Desiccation
Results from initial measurements of Fv/Fm indicated that both ecotypes of F.
vesiculosus have the same potential to use the available excitation energy for
photochemistry in PSII reaction center (Paper II). It has also earlier been confirmed
that this similarity in the photochemical efficiency between the ecotypes is
independent of season (May or November; Gylle, 2007). In the following
temperature‐ and desiccation experiments in Paper II, no changes of Fv/Fm could be
detected in the marine ecotype of F. vesiculosus. In the brackish ecotype, however,
there were a significant reduction of Fv/Fm as a response to desiccation in all
temperature but the decrease was most prominent at 20 C. These results indicated that the brackish ecotype has lower potential to use the available excitation energy
for photochemistry at desiccation compared to the marine ecotype of F. vesiculosus,
especially at higher temperatures. Suggested reason for this is a higher rate of
water loss in the brackish ecotype because of lower amounts of mannitol and
because of a thinner thallus (Paper II). More mannitol has earlier been suggested as
a reason to increased tolerance to desiccation (Pearson et al., 2000). An alternative
explanation for lower desiccation tolerance in the sublittoral Bothnian Sea ecotype
of F. vesiculosus might be the lack of some protective compatible solutes for the
photosynthesis apparatus, discussed above (Paper I).
Quantum Yield of PSII Photochemistry in Fucus vesiculosus and F. radicans
The measurements from Paper IV indicated similar results as the results in
Paper II, that both ecotypes of F. vesiculosus have the same photochemical
efficiency. Also F. radicans has the same photochemical efficiency as F. vesiculosus
26
and this result was in agreement with earlier findings (Gylle, 2007). Earlier
measurements of oxygen evolution also confirmed similar initial slopes (values for the two ecotypes of F. vesiculosus (Nygård & Ekelund, 2006). These findings are
not expected from the point of view of sun and shade adapted algae, where the
photochemical efficiency, as well as the Chl a concentration, used to be higher in
shade adapted algae (Ramus et al., 1977; Figueroa et al., 2003). The amount of Chl a
(discussed below) was only higher in the sublittoral ecotype of F. vesiculosus,
compared to the intertidal marine algae in Paper II (related to DW; Table 2) and
not in Paper III (related to FW; Table 2). Also F. radicans had similar Chl a
concentration as both ecotypes of F. vesiculosus (Paper III; Table 2). Pmax is also
related to the shad and sun acclimatization and/or adaptation of algae and use to
be lower in shade growing algae (Figueroa et al., 2003). This is in agreement with
the observed differences in Paper IV (Table 3) and also with earlier findings of a
higher Pmax in the intertidal marine ecotype of F. vesiculosus compared to the
sublittoral growing brackish ecotype (Bäck et al., 1992b; Nygård & Ekelund, 2006;
Nygård & Dring, 2008). The result in Paper IV also confirms a higher Pmax in the
marine ecotype of F. vesiculosus compared to F. radicans (Table 3). The fact that the
Bothnian Sea ecotype of F. vesiculosus and the Norwegian Sea ecotype have
different light regime at the growth sites however, can not entirely explain the
observed differences in Pmax because for the brackish ecotype of F. vesiculosus it is
clear that also the salinity at the growth site affect the Pmax (discussed more below).
77 K Fluorescence Emission Spectra in Marin and Brackish Ecotype of Fucus vesiculosus and Fucus radicans (Paper III)
Low‐temperature (77 K) Chl a fluorescence emission spectra were used to
identify PSII and PSI in F. vesiculosus. The method was also used to identify
spectral features of the marine ecotype and the brackish ecotype of F. vesiculosus
and F. radicans and to analyse differences in the photosynthetic apparatus between
the algae. In addition, low‐temperature emission spectra were used to investigate
whether the optical conditions of the brackish have led to compensatory changes in
the photosynthetic apparatus of the brackish ecotype of F. vesiculosus and F.
radicans. Also short‐term effects of salinity (1 week in 5, 10, 20, and 35 psu) on the
photosynthetic apparatus of the brackish ecotype of F. vesiculosus were analysed by
the emission spectra (Paper III).
77 K Fluorescence Emission Spectrum for Identifying of PSII and PSI
To identify PSII and PSI in Fucus, measurements of fluorescence emission
spectrum at 77 K in intact thallus of F. vesiculosus were performed. The results
27
indicate a strong peak in the far‐red region and only little emission <700 nm. To
confirm that the weak emission at <700 nm originates in PSII the effect of light‐
induced closure of PSII reaction centers at 77 K was measured. The results confirm
an increase in the emission yield <700 nm, peaking at 688 nm which indicates that
in intact thallus, PSII emits at 688 nm and the far red peak originates in PSI (Paper
III). These wavelengths are similar to emission peaks of cyanobacteria and green
algae (Murakami, 1997; Keränen et al., 1999), and the wavelengths of the identified
emission peaks are in agreement with earlier measurements from brown algae
(Barrett & Thorne, 1980; Berkaloff et al., 1990).
77 K Fluorescence Emission Spectrum – Comparison between Fucus Strains
For identifications of difference between the three Fucus strains, powdered
Fucus samples were used. The emission spectra measured at 77 K were
characterized with PSI emission at 717–728 nm and PSII emission peak at 692 nm
in all three Fucus strains (Paper III; Figure 8). The ratio of emission between PSII
and PSI was different between the Fucus strains. In the marine ecotype of F.
vesiculosus, the PSII emission peak was ~0.3 time lower than the PSI emission peak,
and in F. radicans, the PSII peak was ~0.5 time lower than the PSI emission peak. In
the brackish ecotype of F. vesiculosus on the other hand, the ratio of PSII/PSI
emission peaks was ~1. A simple explanation of these data would suggest a more
even photosystem stoichiometry in the Bothnian Sea ecotype of F. vesiculosus
compared to the other algal strains and that PSII absorbs the same number of
photons as PSI. This in turn would suggest that electron transport is much faster in
the Bothnian Sea ecotype of F. vesiculosus than in F. radicans and the Norwegian Sea
ecotype of F. vesiculosus. Faster electron transfer rate in the Bothnian Sea ecotype of
F. vesiculosus however, would disagree with the data indicating faster oxygen
evolution in the marine ecotype (Bäck et al., 1992b; Nygård & Ekelund, 2006).
Therefore, the conclusion from the data was that strong PSII fluorescence in the
brackish ecotype of F. vesiculosus reflects better ability of PSII to harvest the blue
excitation light used in the fluorescence measurements, rather than a high PSII/PSI
ratio, because of larger light‐harvest antenna of PSII compared to the marine algae
and also F. radicans. This conclusion is supported by the findings of almost equally
ratio of D1/PsaA proteins (reflects PSII/PSI) between all three Fucus stains (Paper
IV) and also by the finding that much lower level of irradiance is required to
saturate photosynthetic electron transport in the brackish ecotype than in the
marine ecotype (Nygård & Dring, 2008). Chl c has a much higher absorbance in
blue wave‐lengths than Chl a and less absorbance in red wavelengths (Büchel et al.,
1998). Therefore, if either biosynthesis or targeting of LHC proteins favours PSII at
the expense of PSI, the PSII emission peaks will increase in height. Thus, it is
tempting to speculate that the strong PSII fluorescence in the brackish ecotype of F.

28
Figure 8. The 77 K fluorescence emission spectra of powdered Fucus radicans and Fucus vesiculosus from the Bothnian Sea (4–5 psu, practical salinity units) and F. vesiculosus from the Norwegian Sea (34-35 psu), as indicated. Blue light between 400 and 450 nm was used for excitation. The insets show the variation in the spectral shape in all 10 replicates.
vesiculosus actually indicates that these algae
produce LHCI proteins, which may harvest
light for both PSI and PSII or occur free in
the thylakoid membranes. If so, more light‐
harvesting protein‐pigments might serve
PSII in the brackish ecotype of F. vesiculosus
than in the two other strains. This
speculation is supported by the high
biochemical similarity and similar Chl a/c
ratios of LHCI and LHCII proteins in brown
algae (De Martino et al., 2000). If the light‐
harvest antennae not are organized into
specific PSI and PSII LHCs and the PSI and
PSII are supplied with the same antenna
system, no imbalance in the energy
distribution between the photo‐systems
would occur (De Maritino et al., 2000). An
alternative explanation to the speculation of
LHCI proteins harvesting light for both PSI
and PSII in the Bothnian Sea F. vesiculosus
could be that LHCII instead contribute as
antenna to PSI in the marine ecotype of F.
vesiculosus and F. radicans but fail to do so in
the brackish F. vesiculosus. A study by
Yamazaki et al. (2005) confirmed a larger PSI
antenna size compared to the PSII antenna in
the marine green alga Ulva pertusa and
demonstrated that a substantial amount of LHCII served as antenna at PSI. F.
radicans does not show the similar large PSII antenna fluorescence as the Bothnian
Sea ecotype of F. vesiculosus, despite similar light conditions at the growth site. This
fact rather support the later explanation that LHCII contribute as antenna to PSI in
the marine ecotype of F. vesiculosus and F. radicans than the speculation above that
LHCI proteins harvesting light for PSII in the brackish ecotype of F. vesiculosus. The
differences between the Bothnian Sea species also suggest that factors other than
low‐light intensity contribute to the properties of PSII antenna in the Bothnian Sea
ecotype of F. vesiculosus. In addition, the Chl a/c ratio confirm more antenna
pigment in F. radicans compared to the Bothnian Sea ecotype of F. vesiculosus
(Paper III; Table 2). The 77 K fluorescence emission and Chl a/c ratio results
combined implies another distribution of the fucoxanthin‐Chl a‐c‐proteins and a
29
better low light adaptation in F. radicans compared to the Bothnian Sea ecotype of
F. vesiculosus.
The brackish ecotype of F. vesiculosus has a 703 nm peak, missing in the 77 K
emission spectra of the other two Fucus strains. In F. serratus embryos and the
rhodophyte Rhodella violacea, peaks at 702–705 nm has been assigned to uncoupled
LHCI dimers (Doan et al., 2003; Lamote et al., 2003). The 703 nm peak of the
brackish ecotype of F. vesiculosus likely has the same origin and energetically
uncoupled antenna complexes may show a high fluorescence yield.
The differences in 77 K fluorescence emission between the brackish ecotype of
F. vesiculosus and F. radicans deserves further attention The clear differences in the
fluorescence emission spectra between the two Bothnian Sea species of Fucus were
not only observed in the averaged emission spectra but also in all individual
replicates (n = 10; Paper III; insets of Figure 8). The two algal species differ
morphologically (Bergström et al., 2005), but the identification of these two species
is not entirely reliable without a DNA test. The results of the study in Paper III
suggest that 77 K fluorescence emission spectra can be used as a reliable method to
distinguish the brackish ecotype of F. vesiculosus from F. radicans as well.
Effect of Salinity on the 77 K Fluorescence Emission Spectrum of the Bothnian Sea Ecotype of F. vesiculosus
The short‐term (1 week) salinity experiment of the brackish ecotype of F.
vesiculosus did only cause minor changes in the spectral form, indicating that the
emission spectra of the brackish and the marine ecotypes of F. vesiculosus are
different because of persistent differences in the photosynthesis machinery, and
not because salinity has a crucial effect on PSII/PSI ratio (Paper III). However,
worth mention is the salinity effect on the 703 nm emission peak, even if not
discussed in Paper III. The 703 nm peak was less visible in algae treated in 10 psu
compared to algae treated in the other salinities and the reason might be a reduced
amount of uncoupled LHCI dimmers.
The heights of the peaks were affected by the salinity. The results indicated a
higher 77 K Chl a fluorescence emission peak from both PSI and PSII in algae
treated in 10 psu compared to algae treated in BSW, 5, 20 and 35 psu (p < 0.001 for
all; Paper III). The higher fluorescence emission peaks in the brackish ecotype of F.
vesiculosus treated 10 psu were not pointed out in Paper III because the absolute
intensities of fluorescence depends on various optical properties of the sample,,
difficult to control precisely in 77 K fluorescence (e.g. frost formation on the
surface, size and patterns of ice crystals). However, in the light of high agreements
between the fluorescence emission results, especially the PSI emission, and results
in Paper IV, discussed below, the distinction in fluorescence emissions spectra
between algae treated in different salinities is worth notice.

30
Concentration of Chlorophyll a and c in Fucus vesiculosus and Fucus radicans (Paper II, III)
Analyses of the Chl a and c content (mg g‐1 DW) were performed in the aim to
investigate the importance of salinity and light for the concentration of Chl in the
marine and the brackish ecotype of F. vesiculosus (Paper II). The Chl’s were
measured initially and after 24 and 72 h during an experiment where both ecotypes
of F. vesiculosus were treated in 5 and 35 psu in both light and darkness (Paper II).
The Chl concentrations (mg g‐1 FW) were also measured as a complement to the 77
K fluorescence emission spectra (Paper III).
The results in Paper II indicates higher Chl a and c content in the brackish
ecotype of F. vesiculosus compared to the marine ecotype (Table 2). In Paper III, the
results indicate higher Chl c content in both the brackish Fucus strains compared to
the marine ecotype of F. vesiculosus (Table 2). Higher Chl content in the brackish
ecotype of F. vesiculosus compared to the marine ecotype is contradictory to results
from other measurements (Nygård & Ekelund, 2006; Ekelund et al., manuscript in
preparation). The differences observed between the present study (Paper II, III)
and the other studies are most certainly due to the time of collections, May vs.
January‐February. The brackish ecotype of F. vesiculosus and F. radicans, have
probably a seasonal acclimation with a resting period at winter because of the low
levels of irradiance under the ice‐cover (below the compensation point; Lehvo et
al., 2001) and a synthesis of much pigment would be a waste of energy.
The reason for higher Chl c in the brackish ecotype of F. vesiculosus and F.
radicans in May compare to the marine ecotype of F. vesiculosus (Table 2) is
probably because of the differences in the levels of irradiance at the growth sites.
The Bothnian Sea species growth in a dark environment relative to the marine F.
vesiculosus and therefore the algae need more light‐harvesting pigments. The result
from the experiments in Paper II confirm that F. vesiculosus is capable of
synthesizing Chl a in complete darkness, at least within certain time‐frames. The
brackish ecotype of F. vesiculosus is also capable of synthesizing Chl c in darkness.
It has earlier been confirmed that pine and cyanobacteria synthesise Chl in
darkness (Mannan & Pakrasi, 1993; Schoefs & Franck, 1998).
Nygård (2005) confirmed higher photosynthetic efficiency () based on fresh weight in the brackish F. vesiculosus but not based on Chl a and at the same time
higher Pmax based on Chl a but not based on fresh weight. These findings indicate
that an increase in pigment because of low irradiance originates from increased
size of the photosynthetic units that is antennae size (Dring, 1992; Nygård, 2005).
In brown algae the pigments are organized in fucoxanthin‐Chl a‐c2‐protein and Chl
a‐c2 + c2‐protein complexes (Dring, 1992). Therefore, increases in Chl c and/or
fucoxanthin relative to Chl a in low light must be accompanied by increases in the

31
proportion of light‐harvesting protein‐pigment in the photosynthetic units and a
consequence of this is an increase in the size of existing photosynthetic units
(Gallagher et al., 1984).
It was no clear salinity effect on Chl a and c concentration in F. vesiculosus in
neither of the experimental studies in Paper II and III. These results indicate that
salinity has no effect on Chl concentration at short time (1 week). These results
however, do not exclude that salinity have effect on Chl concentration at longer
time as observed by Nygård & Ekelund (2006).
Photosynthesis and the Relative Amount of Photosynthetic Proteins in Fucus vesiculosus and Fucus radicans (Paper IV)
P/I‐curves and immunoblotting were performed in the aim of studying if Pmax
was connected to the relative amounts of photosynthetic proteins (D1, reflects PSII;
PsaA, reflects PSI; Rubisco) on a Chl basis and if there were any differences
between the three Fucus strains (Paper IV). F. radicans was included in he study in
order to investigate if the native Bothnian Sea species has other adaptations to the
environment than the in origin marine F. vesiculosus ecotype in the Bothnian Sea.
Further to this, the aim was to investigate if photosynthesis and the relative
amounts of Rubisco, D1 and PsaA on a Chl basis were correlated when the brackish
ecotype of F. vesiculosus was affected by salinity (5, 10, 20, 35 psu) in the short‐term
(1 week; Paper IV).
Table 2. Initial chlorophyll (Chl) a and c (c1 and c2) measurements of the Norwegian Sea (34-35 practical salinity units, psu) ecotype of Fucus vesiculosus, the Bothnian Sea (4-5 psu) ecotype of F. vesiculosus (Paper II, III) and F. radicans (Paper III). Different raised letters indicate significant (p < 0.05) difference between the Fucus strains within the Paper. No raised letter means no differences compared to the other Fucus strains.
Chl (mg ∙ g‐1 DW*)
%**
Chl (mg ∙ g‐1 FW*)
%**
Paper II Paper III
Algae a c a c a / c
F. vesiculosus Norwegian Sea 1.739A
100
0.041A
100
0.733s
100
0.047A
100
15.6A
100
F. vesiculosus Bothnian Sea 2.326B
134
0.097B
237
0.724q
99
0.058B
123
12.5B
80
F. radicans Bothnian Sea 0.675s
92
0.066B
140
10.3C
66
* DW, dry weight; FW, fresh weight
** % Chl related to the Norwegian Sea F. vesiculosus

32
Pmax and the Relative Amounts of D1, PsaA and Rubisco Proteins in F. vesiculosus and F. radicans
The results indicate a significantly higher Pmax in the marine ecotype of F.
vesiculosus compared to the brackish ecotype of F. vesiculosus and F. radicans
whereas no differences between the both Bothnian Sea Fucus strains were detected
(Table 3). Low Pmax in the brackish water ecotype of F. vesiculosus compared to the
marine ecotype of F. vesiculosus is in agreement with earlier investigations (Bäck et
al., 1992b; Nygård & Ekelund, 2006; Nygård & Dring, 2008).
The study in Paper IV was a first attempt to reveal what cause the differences
in Pmax between the marine ecotype of F. vesiculosus and the brackish Fucus species.
The results indicate that neither of the relative amounts of PsaA or the PSII/PSI
(D1/PsaA) ratio appears to contribute to the differences in Pmax between the Fucus
strains (Paper IV; Table 3).
The PSII/PSI ratio however indicates an uneven photosystem stoichiometry
within Fucus, with an overweight of PSI (Paper IV; Table 3). PSII/PSI ratios differ
between different organisms and have e.g. been observed to be 1.43‐1.72 in
terrestrial plants as Spinacia oleracea (spinach), Cucumis sativus (cucumber) and
Populus deltoides (poplar), 0.43 in blue‐green algae, and 0.90, 1.03, and 0.84 in the
green algae Dunaliella tertiolecta, Bryopsis maxima and Ulva pertusa, respectively
(Melis & Brown, 1980; Falkowski et al., 1981; Yamazaki et al., 2005; Fan et al., 2007).
The reasons for generally lower PSII/PSI ratio in marine algae compared to
terrestrial plants have been suggested to be 1) a need of greater ATP/NADPH ratio
as energy to import various nutrients and therefore more PSI to mediates cyclic
electron transport and 2) the imbalance in the photosystem stoichiometry protects
algae from photoinhibition in the blue‐green light that preferentially excites PSII
(Yamazaki et al., 2005). PSII/PSI ratio has also been confirmed to fluctuate with a
plants developing state, seasons and between different parts of the plants as in
Macrocystis pyrifera (Giant Kelp) with PSII/PSI 1.8 in the surface blades and 2.2 in ‐
20 m blades (Melis & Brown, 1980; Major & Dunton, 2000; Smith & Melis, 1987).
The confirmed uneven photosystem stoichiometry within Fucus, with an
overweight of PSI observed by protein blotting (Paper IV) are in agreement with
77 K Chl a fluorescence emission spectra for the marine F. vesiculosus and in F.
radicans (Paper III; Figure 8). 77 K fluorescence emission spectra of the brackish
ecotype of F. vesiculosus however, indicated a PSII/PSI ratio ~1 (Paper III; Figure 8)
whereas the results by protein blotting indicate a PSII/PSI ratio ~0.4 (Paper IV;
Table 3). The reason for the high fluorescence emission in the brackish F.
vesiculosus was concluded to be due to larger light‐harvesting antenna of PSII and
not because of a higher PII/PSI ratio at ~1. This interpretation of the 77 K
fluorescence emission of the brackish ecotype of F. vesiculosus in Paper III is in
agreement of the PSII/PSI ratio measured by D1/PsaA (Paper IV; Table 3).
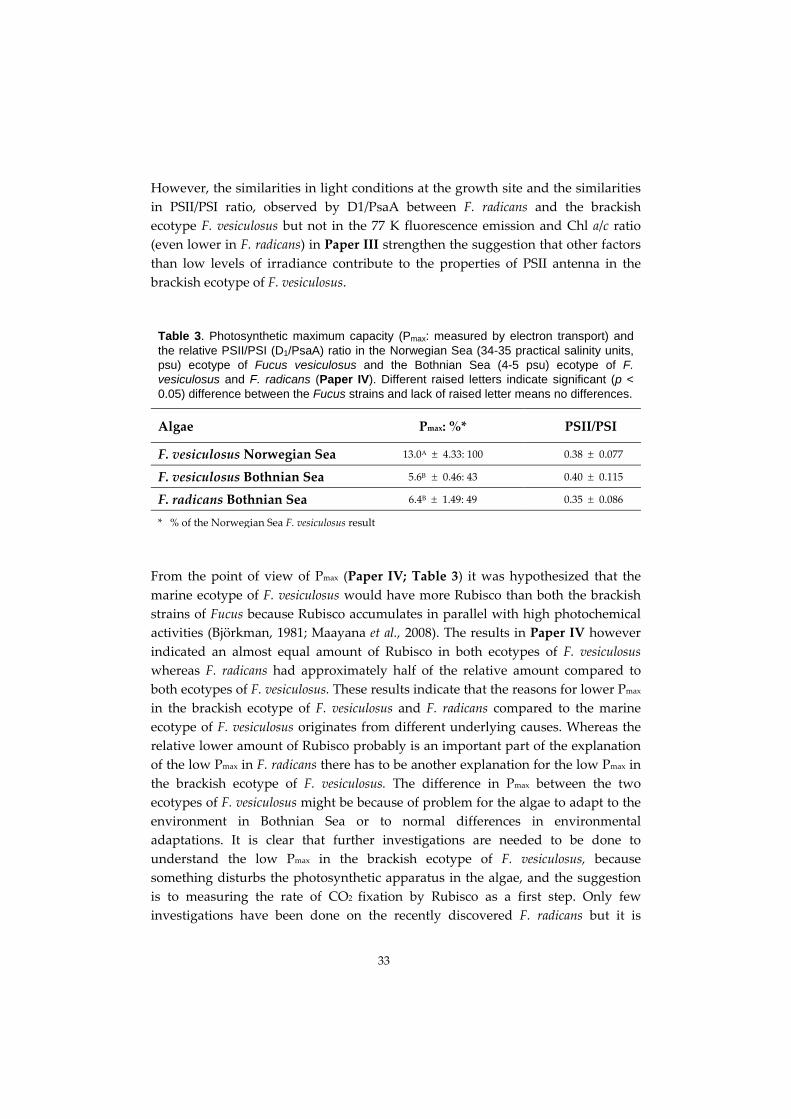
33
However, the similarities in light conditions at the growth site and the similarities
in PSII/PSI ratio, observed by D1/PsaA between F. radicans and the brackish
ecotype F. vesiculosus but not in the 77 K fluorescence emission and Chl a/c ratio
(even lower in F. radicans) in Paper III strengthen the suggestion that other factors
than low levels of irradiance contribute to the properties of PSII antenna in the
brackish ecotype of F. vesiculosus.
Table 3. Photosynthetic maximum capacity (Pmax: measured by electron transport) and the relative PSII/PSI (D1/PsaA) ratio in the Norwegian Sea (34-35 practical salinity units, psu) ecotype of Fucus vesiculosus and the Bothnian Sea (4-5 psu) ecotype of F. vesiculosus and F. radicans (Paper IV). Different raised letters indicate significant (p < 0.05) difference between the Fucus strains and lack of raised letter means no differences.
Algae Pmax: %* PSII/PSI
F. vesiculosus Norwegian Sea 13.0A 4.33: 100 0.38 0.07700
F. vesiculosus Bothnian Sea 5.6B 0.46: 43 0.40 0.11500
F. radicans Bothnian Sea 6.4B 1.49: 49 0.35 0.08600
* % of the Norwegian Sea F. vesiculosus result
From the point of view of Pmax (Paper IV; Table 3) it was hypothesized that the
marine ecotype of F. vesiculosus would have more Rubisco than both the brackish
strains of Fucus because Rubisco accumulates in parallel with high photochemical
activities (Björkman, 1981; Maayana et al., 2008). The results in Paper IV however
indicated an almost equal amount of Rubisco in both ecotypes of F. vesiculosus
whereas F. radicans had approximately half of the relative amount compared to
both ecotypes of F. vesiculosus. These results indicate that the reasons for lower Pmax
in the brackish ecotype of F. vesiculosus and F. radicans compared to the marine
ecotype of F. vesiculosus originates from different underlying causes. Whereas the
relative lower amount of Rubisco probably is an important part of the explanation
of the low Pmax in F. radicans there has to be another explanation for the low Pmax in
the brackish ecotype of F. vesiculosus. The difference in Pmax between the two
ecotypes of F. vesiculosus might be because of problem for the algae to adapt to the
environment in Bothnian Sea or to normal differences in environmental
adaptations. It is clear that further investigations are needed to be done to
understand the low Pmax in the brackish ecotype of F. vesiculosus, because
something disturbs the photosynthetic apparatus in the algae, and the suggestion
is to measuring the rate of CO2 fixation by Rubisco as a first step. Only few
investigations have been done on the recently discovered F. radicans but it is

34
important to keep in mind that F. radicans, unlike the brackish ecotype of F.
vesiculosus, is a native species in the Bothnian Sea environment. Therefore,
differences between the two ecotypes of F. vesiculosus and F. radicans in relative
amount of Rubisco, as well as the lower relative amount of D1 in F. radicans
compared to the marine ecotype of F. vesiculosus (Paper IV), are probably due to
typical differences between species. To notice is also that the similarity in Pmax
between the Bothnian Sea species despite lower relative amount of Rubisco in F.
radicans points toward a more efficient CO2 fixation in F. radicans.
In a discussion of Pmax and Rubisco it is also important to consider the amount
of DIC (dissolved inorganic carbon) in the water. There is a substantially greater
concentration of DIC in fully marine waters (~2.0 mmol m‐3; Surif & Raven, 1989)
compared with brackish waters as in the Bothnian Sea (~1.0 mmol m‐3; Raven &
Samuelsson, 1988). I addition to the instant effect of the DIC concentration, because
Rubisco use of CO2, the carbon supply is also important in the regulation of
mechanisms behind synthesis of Rubisco in algae (Giordano et al., 2005). Nygård &
Dring (2008) however, demonstrated that salinity is a more important factor than
DIC for the photosynthetic difference between the marine and brackish ecotype of
F. vesiculosus.
Effect of salinity on Pmax and the Relative Amounts of D1, PsaA and Rubisco Proteins in the Bothnian Sea ecotype of F. vesiculosus
Overall, there were higher Pmax in the brackish ecotype of F. vesiculosus treated
in the higher salinities, 10, 20 and 35 psu, compared to Pmax in algae treated in BSW
and 5 psu and the most favourable salinity was 10 psu followed by 20 psu (Paper
IV; Figure 9). These results are in agreement with earlier ETR measurements of the
brackish ecotype of F. vesiculosus treated in different salinities together with low or
high concentration of DIC and nutrients (Nygård & Dring, 2008).
In this first attempt to explain the differences in the Pmax of the brackish ecotype
of F. vesiculosus, treated in different salinities, the results did not indicate any
differences in the amount of either D1 or Rubisco (Paper IV). It has earlier been
confirmed by Northern analysis of transcript abundance for Rubisco that Rubisco
demonstrate variations as a response to light and hydration status of F. vesiculosus
(Pearson et al., 2001). Those variations do not appear to count for salinity changes
in the range used in present study (5‐35 psu) or in the used time scale (1 week;
Paper IV). However, the Pmax results indicate some salinity effects on Rubisco, even
if no changes are observed on the relative amount of Rubisco. Therefore,
measurements of the CO2 fixation rate by Rubisco in algae treated in different
salinities are needed.
The measurements of the relative amount of PsaA proteins from PSI and the
PSII/PSI ratios however indicate a salinity effect in the brackish ecotype of F.
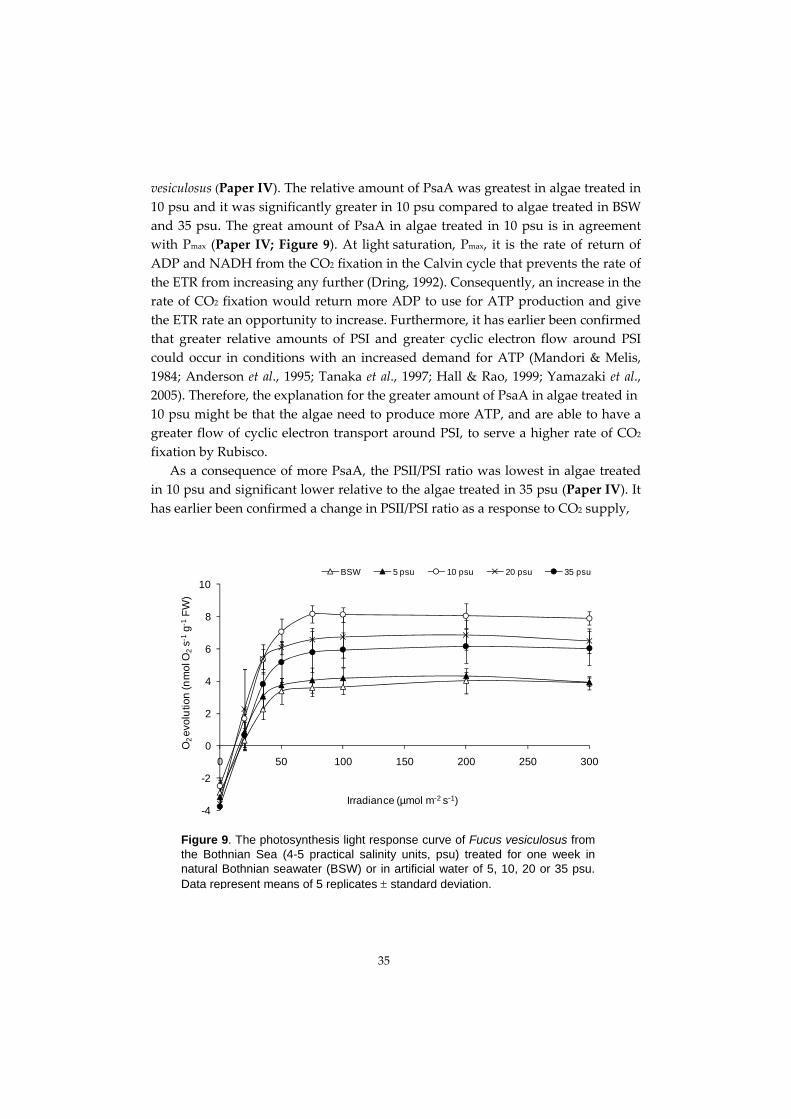
35
vesiculosus (Paper IV). The relative amount of PsaA was greatest in algae treated in
10 psu and it was significantly greater in 10 psu compared to algae treated in BSW
and 35 psu. The great amount of PsaA in algae treated in 10 psu is in agreement
with Pmax (Paper IV; Figure 9). At light saturation, Pmax, it is the rate of return of
ADP and NADH from the CO2 fixation in the Calvin cycle that prevents the rate of
the ETR from increasing any further (Dring, 1992). Consequently, an increase in the
rate of CO2 fixation would return more ADP to use for ATP production and give
the ETR rate an opportunity to increase. Furthermore, it has earlier been confirmed
that greater relative amounts of PSI and greater cyclic electron flow around PSI
could occur in conditions with an increased demand for ATP (Mandori & Melis,
1984; Anderson et al., 1995; Tanaka et al., 1997; Hall & Rao, 1999; Yamazaki et al.,
2005). Therefore, the explanation for the greater amount of PsaA in algae treated in
10 psu might be that the algae need to produce more ATP, and are able to have a
greater flow of cyclic electron transport around PSI, to serve a higher rate of CO2
fixation by Rubisco.
As a consequence of more PsaA, the PSII/PSI ratio was lowest in algae treated
in 10 psu and significant lower relative to the algae treated in 35 psu (Paper IV). It
has earlier been confirmed a change in PSII/PSI ratio as a response to CO2 supply,
Figure 9. The photosynthesis light response curve of Fucus vesiculosus from the Bothnian Sea (4-5 practical salinity units, psu) treated for one week in natural Bothnian seawater (BSW) or in artificial water of 5, 10, 20 or 35 psu. Data represent means of 5 replicates standard deviation.
-4
-2
0
2
4
6
8
10
0 50 100 150 200 250 300
O2 e
volu
tion
(nm
ol O
2s-1
g-1
FW
)
Irradiance (µmol m-2 s-1)
BSW 5 psu 10 psu 20 psu 35 psu

36
irradiance, nitrogen supply and because of salinity shock (Mandori & Melis, 1984;
Kim et al., 1993; Berges et al, 1996; Tanaka et al., 1997). The salinity effect on the
PSII/PSI ratio in Paper IV however is not in agreement with the 77 K Chl a
fluorescence emission spectra (Paper III). In Paper III the salinity only caused
minor changes (the changes rather indicated a higher PSII/PSI in10 psu instead of
the opposite as in Paper IV), and the conclusion was that the emission spectra of
the brackish and the marine ecotypes of F. vesiculosus were different because of
persistent differences in the photosynthesis machinery, and not because salinity
has a crucial effect on PSII/PSI ratio. In light of both studies (Paper III, IV) it
appears that this conclusion is perhaps premature. An explanation for the
difference between the studies might be that fluorescence emission from PSII and
PSI in Paper III origin from both the antenna Chl and the core Chl whereas the
PSII/PSI ratio measurements by immunoblotting in Paper IV only involve the core
of the photosystems (D1/PsaA). Therefore further investigations are needed in
order to understand what cause the difference in PSII/PSI ratio between the studies
and what salinity might affect in the PSII/PSI ratio and a suggestion is to
investigate the light‐harvesting antenna proteins as a first step.
CONCLUSIONS AND SUMMARY
The general aims of this thesis were to compare physiological aspects between
the marine ecotype and the brackish ecotype of F. vesiculosus as well as between the
two Bothnian Sea species F. vesiculosus and F. radicans.
The marine ecotype of F. vesiculosus has a higher number of water soluble
organic compounds compared to the brackish ecotype of F. vesiculosus. These
compounds are suggested to be compatible solutes and be due to an intertidal
and sublittoral adaptation, respectively. The sublittoral ecotype might have lost
the ability to synthesize these compound/compounds due to habitat adaptation.
The mannitol concentration is higher in the marine ecotype compared to the
brackish ecotype of F. vesiculosus and the higher mannitol concentration in the
marine ecotype is suggested to be due to both higher level of irradiance and
higher salinity at the growth site.
Both ecotypes of F. vesiculosus as well as F. radicans have an uneven PSII/PSI
ratio with overweight of PSI. The brackish ecotype of F. vesiculosus however has
larger light‐harvesting antenna of PSII compared to the marine ecotype of F.
vesiculosus and F. radicans.

37
77 K fluorescence emission spectra are a reliable method to separate the
brackish ecotype of F. vesiculosus and F. radicans. The two algal species differ
morphologically but the identification of these two species is not completely
reliable without a DNA test or as this study indicates, by 77 K fluorescence
emission spectra.
The marine ecotype of F. vesiculosus has higher Pmax compare to the brackish
ecotype of F. vesiculosus and F. radicans whereas both the brackish species have
similar Pmax. One reason for higher Pmax in the marine ecotype of F. vesiculosus
compare to F. radicans is more relative amount of Rubisco. The reason for higher
Pmax in marine ecotype of F. vesiculosus compared to the brackish ecotype of F.
vesiculosus however is not due to the relative amount of Rubisco.
Pmax in the brackish ecotype of F. vesiculosus indicates a most favourable salinity
at 10 psu followed by 20 psu. One part of the explanation of a high Pmax in 10
psu might be the confirmed greater relative amount of PsaA protein. The reason
for greater amount of PsaA is suggested to be that the algae need to produce
more ATP to serve a higher rate of CO2 fixation by Rubisco. Nevertheless, more
studies of the rate of CO2 fixation by Rubisco in algae treated in similar salinities
as in present study are needed to confirm this theory
FUTURE PERSPECTIVES
As a consequence of the importance of, the in origin marine F. vesiculosus and
the native F. radicans in the Bothnian Sea ecosystem it is of high interests to
continue to increase the understanding of the physiology in the algae in relation to
the environment, and changes in the environment, to know how to protect these
key species from harmful anthropogenic disturbances. It is already known that F.
vesiculosus in the Baltic Sea is vulnerable for eutrophication. Eutrophication force
the algae to grow shallower and thereby the F. vesiculosus belts become less stable
because a larger part of the belts will be affected by ice‐scouring, low‐water events
and strong wave actions (Eriksson et al., 1998; Bergström, 2005; Torn et al., 2006;
Korpinen et al., 2007; Rhode et al., 2008; Schories et al., 2009). F. radicans is possibly
even more vulnerable to anthropogenic changes, as e.g. eutrophication with the
following decrease in light penetration, than other Fucus. This is because F. radicans
does not growth in the shallow water and a declines in Fucus populations as a
response to decreased levels of irradiance are generally first visible at their lower
depth limits (Råberg & Kautsky, 2007). Climate changes and the following changes
in temperature, precipitation, runoff and salinity will probably affect the
distribution of species in the Bothnian Sea and cause significant ecological changes.
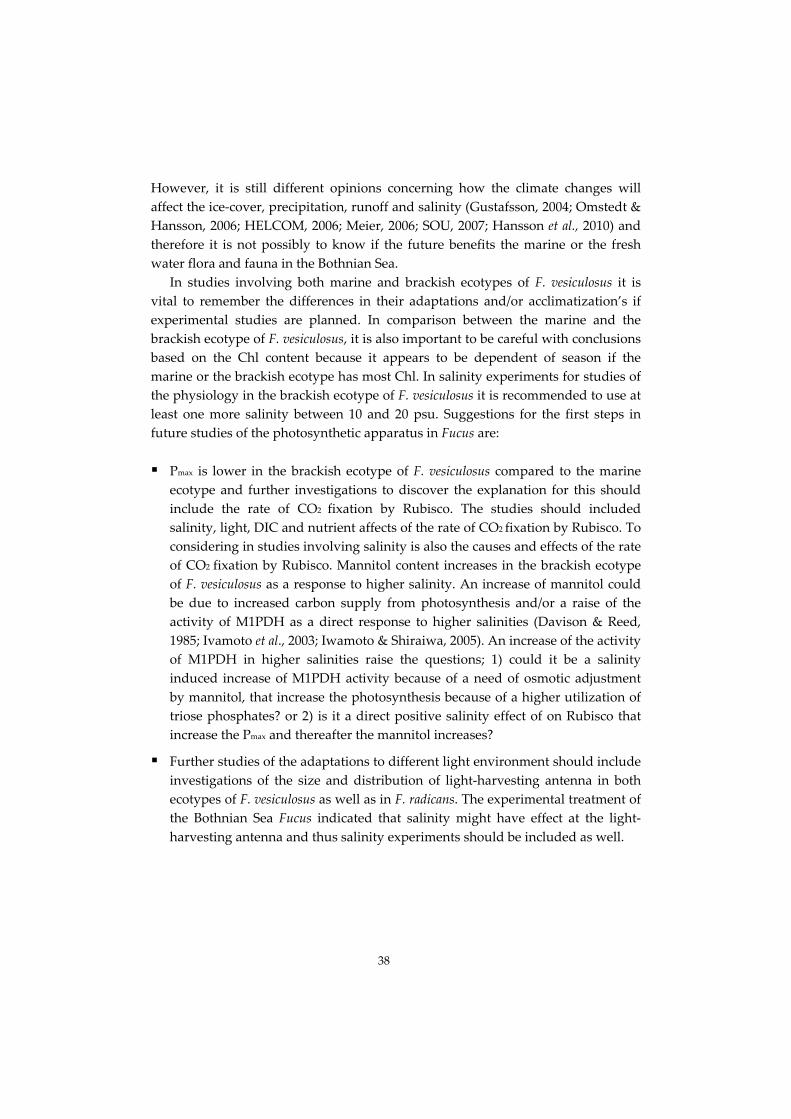
38
However, it is still different opinions concerning how the climate changes will
affect the ice‐cover, precipitation, runoff and salinity (Gustafsson, 2004; Omstedt &
Hansson, 2006; HELCOM, 2006; Meier, 2006; SOU, 2007; Hansson et al., 2010) and
therefore it is not possibly to know if the future benefits the marine or the fresh
water flora and fauna in the Bothnian Sea.
In studies involving both marine and brackish ecotypes of F. vesiculosus it is
vital to remember the differences in their adaptations and/or acclimatization’s if
experimental studies are planned. In comparison between the marine and the
brackish ecotype of F. vesiculosus, it is also important to be careful with conclusions
based on the Chl content because it appears to be dependent of season if the
marine or the brackish ecotype has most Chl. In salinity experiments for studies of
the physiology in the brackish ecotype of F. vesiculosus it is recommended to use at
least one more salinity between 10 and 20 psu. Suggestions for the first steps in
future studies of the photosynthetic apparatus in Fucus are:
Pmax is lower in the brackish ecotype of F. vesiculosus compared to the marine
ecotype and further investigations to discover the explanation for this should
include the rate of CO2 fixation by Rubisco. The studies should included
salinity, light, DIC and nutrient affects of the rate of CO2 fixation by Rubisco. To
considering in studies involving salinity is also the causes and effects of the rate
of CO2 fixation by Rubisco. Mannitol content increases in the brackish ecotype
of F. vesiculosus as a response to higher salinity. An increase of mannitol could
be due to increased carbon supply from photosynthesis and/or a raise of the
activity of M1PDH as a direct response to higher salinities (Davison & Reed,
1985; Ivamoto et al., 2003; Iwamoto & Shiraiwa, 2005). An increase of the activity
of M1PDH in higher salinities raise the questions; 1) could it be a salinity
induced increase of M1PDH activity because of a need of osmotic adjustment
by mannitol, that increase the photosynthesis because of a higher utilization of
triose phosphates? or 2) is it a direct positive salinity effect of on Rubisco that
increase the Pmax and thereafter the mannitol increases?
Further studies of the adaptations to different light environment should include
investigations of the size and distribution of light‐harvesting antenna in both
ecotypes of F. vesiculosus as well as in F. radicans. The experimental treatment of
the Bothnian Sea Fucus indicated that salinity might have effect at the light‐
harvesting antenna and thus salinity experiments should be included as well.

39
TILLKÄNNAGIVANDEN
Först av alla vill jag tacka min handledare Professor Nils Ekelund för att du gav
mig chansen att nå ända fram, för ditt stöd, dina råd och ditt oändliga tålamod. Jag
vill också tacka min biträdande handledare, Dr. Stefan Falk, för dina råd och
värdefulla kommentarer.
Till mina ”icke officiella” handledare Dr. Tessa Pocock och Dr. Esa Tyystjärvi
vill jag också rikta ett mycket stort tack. Tessa – jag har sagt det förut men det tål
att upprepas ‐ vad skulle jag ha gjort utan ditt stöd och ditt härliga stora varma
smittsamma skratt på labb? Och hur skulle jag ha klarat mig utan din ”rödpenna” i
manuskripten? Esa – tack så mycket för ditt varma mottagande ‐ tack även till Dr.
Taina Tyystjärvi ‐ när jag kom till ditt labb på University of Turku. Tack även för
att du tog dig tid att göra 77 K klorofyll a fluorescens emissions mätningar på de
”tråkiga” Fucus algerna. Vilken tur att det i slutänden visade sig att de inte alls var
tråkiga. Tack också för din ”stränga rödpenna” i skrivandet av manuskriptet och
dina tålmodiga svar på oändliga frågor – du har lärt mig mycket. Tack även till er
andra med eller utan Dr. grad ‐ som är och eller har varit på Mittuniversitetet – och
som hjälpt mig genom åren – ingen nämnd ingen glömd.
Torborg Jonsson och Håkan Norberg – också till er tål det att upprepas vad jag
tidigare sagt – utan er inget labbarbete. Alltså ett stort stort tack för all hjälp med
att få ihop allting på labb och för att ni funnits där när jag behövt er. Torborg – tack
också för din vänskap och alla goda råd du delar med dig av. Håkan – ännu en
gång tack för våra stulna stunder i NMR rummet – känns skönt att veta att det bara
är du och jag som vet vad som egentligen hände. Glöm inte att använda de
kunskaper och erfarenheter du fick under de stunderna om du, mot förmodan,
någon gång skulle behöva dem.
Ni som har hjälpt till i fält förtjänar en stjärna i himlen, stort stort tack – utan er
ingen algforskning. Undervattensgänget: Joakim Andersson, Ieva Ciparsons,
Robert Nordström och framför allt ”halv‐delfinen” Dr. Dan Isaksson.
Landkrabborna: Dr. Åsa Bång, Jesper Moderatho, Carina Svan och hennes pappa
samt min käre make Per. Mest imponerande insatsen var när Dan och Ieva
hoppade i vattnet när det var ‐10 C på land och mellan 0 and 4 C i vattnet. Dan – du såg lite missnöjd ut när du kom upp ur vattnet den gången – enda gången jag
såg dig missnöjd efter dykning. Men var vad det du var missnöjd med, kylan? Nej
knappast, min ständigt dyksugne medhjälpare var missnöjd för att han inte hade
tagit med mer luft så att han kunde gå ner igen, det var ju så härligt
därnere……..Hm(?). För administrativ hjälp, speciellt tack till Anne Åhlin, Anna
Haeggström och Christina Olsson.
Tack också till er på Trondhjem Biological Station för stöd och hjälp vid alg‐ och
vattenhämtning. Speciellt till Dr. Jon‐Arne Sneli, Dr. Sten Karlsson och Dr. Kjersti

40
Andresen. Jon‐Arne, Joakim och Dan, tack också för de bilder ni tagit, jag använder
dem i min presentation.
Till övriga arbetskamrater genom åren vill jag säga tack för den roliga tiden
tillsammans med er och ert stöd. Några speciellt härliga arbetskamrater och kära
vänner, där både många glada skratt och ledsamheter har delats genom åren, är
Marie Andersson, Dr. Åsa Bång, Ann‐Christin Lundman och Veronica Jägbrant.
Tack för att jag fått lära känna er och för er varaktiga, ovärderlig, vänskap. Åsa ‐
du kommer väl ihåg att det är älgört du har doktorerat på och inte mjölkört?
Till er andra: min kära familj och mina övriga kära vänner – ni vet vilka ni är ‐
tack för att ni funnits där hela tiden och fortfarande finns där, tack för ert stöd och
för att ni stått ut med min ”sociala inkompetens” under dessa år. När jag tog min
licentiatexamen lovade jag att ”nu ska jag bli imponerande social och imponerande
glad”. Det löftet gick ju inte så bra att hålla, så denna gång lovar jag bara att jag ska
göra så gott jag kan. Ni ska veta att jag sätter stort värde på er trots att jag lyser
med min frånvaro.
Slutligen vill jag tacka dig Per, min kära livskamrat och man, för ditt tålamod
och stora stöd genom åren. Kärleken är trots allt det bästa i livet………
Till sist‐
Till oss alla och ett bidrag till värdens samlade visdom från en berömd forskare:
“A person who never made a mistake never tried anything new.”
Albert Einstein
Härnösand den 15 februari 2011

41
REFERENCES
Allakhverdiev SI, Kreslavski VD, Klimov VV, Los DA, Carpentier R, Mohanty P
(2008) Heat stress: an overview of molecular responses in photosynthesis.
Photosynth Res 98: 541‐550.
Anderson JM, Chow WS, Park Y‐I (1995) The grand design of photosynthesis:
acclimation of the photosynthetic apparatus to environmental cues. Photosynth
Res 46: 129‐139.
Andrén E, Andrén T, Sohlenius G (2000) The holocene history of the southwestern
Baltic Sea as reflected in a sediment core from the Bornholm Basin. Boreas 29:
233‐250.
Aqua‐Scope 2010. Webpage: http://www.vattenkikaren.gu.se/. 2010‐11‐ 08
Arakawa T, Timasheff SN (1983) Preferential interactions of proteins with solvent
components in aqueous amino acid solutions. Arch Biochem Biophys 224: 169‐177.
Atkin OK, Tjoelker MG (2003) Thermal acclimation and the dynamic response of
plant respiration to temperature. Trends Plant Sci 8: 343‐351.
Attrill MJ, Rundle SD (2002) Ecotone or Ecocline: Ecological Boundaries in
Estuaries. Estuar Coast Shelf Sci 55: 929–936.
Barrett J, Thorne SW (1980) Isolation of a F694‐chlorophyll a‐protein complex with
low fluorescence yield from brown algae. FEBS Lett 120: 24‐28.
Beer S, Larsson C, Poryan O, Axelsson L (2000) Photosynthetic rates of Ulva
(Chlorophyta) measured by pulse amplitude modulated (PAM) fluorometry.
Eur J Phycol 35: 69‐74.
Berges JA, Charlebois DO, Mauzerall DC, Falkowski PG (1996) Differential effects
of nitrogen limitation on photosynthetic efficiency of photosystems I and II in
microalgae. Plant Physiol 110: 689‐696.
Bergström L (2005) Macroalgae in the Baltic Sea ‐ responses of low salinity and
nutrient enrichment. PhD Thesis, Umeå University, Umeå, Sweden.
Bergström L, Tatarenkov A, Johannesson K, Jönsson RB, Kautsky L (2005)
Genetic and morphological identification of Fucus radicans sp. Nov (Fucales,
Phaeophyceae) in brackish Baltic Sea. J Phycol 41 (5): 1025‐1038.
Berkaloff C, Duval JC, Hauswirth N, Rousseau B (1983) Freeze fracture study of
thylakoids of Fucus serratus. J Phycol 19: 96‐100.
Berkaloff C, Caron L, Rousseau B (1990) Subunit organization of PSI particles from
brown algae and diatoms: polypeptide and pigment analysis. Photosynth Res 23:
181‐193.
Berry JO, Nikolau BJ, Carr JP, Klessig DF (1986) Translational regulation of light
induced ribulose 1,5‐bisphosphate carboxylase gene expression in amaranth.
Mol Cell Biol 6(7): 2347‐2353.

42
Bidwell RGS, Craigie JS, Krotkov G (1955) Biosynthesis of radioactive mannitol
from C14O2 by Fucus vesiculosus. Science 128: 776.
Björck S (1995 A review of the history of the Baltic Sea, 13.0‐8.0 ka BP. Quaternary
Int 27: 19‐40.
Björkman O (1981) Responses to different quantum flux densities. In: Physiological
Plant Ecology I. Responses to the Physical Environment Ed. Lange OL,
Nobel PS, Osmond CB & Ziegler H. Encyclopedia of Plant Physiology, Springer,
Berlin, Germany, 12. pp. 57–107.
Björkman O, Demmig B (1987) Photon yield of O2 evolution and chlorophyll
fluorescence characteristics at 77 K among vascular plants of diverse origins.
Planta 170: 489‐504.
Büchel C, Razi Naqvi K, Melø TB (1998) Pigment–pigment interactions in
thylakoids and LHCII of chlorophyll a:c containing alga Pleurochloris
meiringensis: analysis of fluorescence‐excitation and triplet‐minus‐singlet
spectra. Spectrochim Acta Mol Spectros 54: 719‐726.
Bäck S, Collins JC, Russel G (1992a) Effects of salinity on growth of Baltic and
Atlantic Fucus vesiculosus. Br Phycol J 27: 39‐47.
Bäck S, Collins JC, Russel G (1992b) Comparative ecophysiology of Baltic and
Atlantic Fucus vesiculosus. Mar Ecol Prog Ser 84: 71‐82.
Bäck S, Ruuskanen A (2000). Distribution and maximum growth depth of Fucus
vesiculosus along the Gulf of Finland. Mar Biol l36: 303‐307.
Chow WS, Anastasios M, Anderson JM (1990) Adjustments of photosystem
stoichiometry in chloroplasts improve the quantum efficiency of
photosynthesis. Proc Natl Acad Sci Unit States Am 87: 7502‐7506.
Collén J, Davison IR (1999) Reactive oxygen production and damage in intertidal
Fucus Spp. (Phaeophyceae). J Phycol 35: 54‐61.
Dasgupta J, Ananyev GM, Dismukes GC (2008) Photoassembly of the water‐
oxidizing complex in photosystem II. Coord Chem Rev 252: 347‐360.
Davis TA, Volescy B, Mucci A (2003) A review of the biochemistry of heavy
metal biosorption by brown algae. Water Res 37: 4311‐4330.
Davison IR, Andrews M, Stewart WDP (1984) Regulation of growth in Laminaria
digitata: use of in‐vivo nitrate reductase activities as an indicator of nitrogen
limitation in field populations of Laminaria spp. Mar Biol 84: 207‐217.
Davison IR, Reed RH (1985) The physiology significance of mannitol accumulation
in brown algae: the role of mannitol as a compatible cytoplasmic solute.
Phycologia 24 (4): 449‐457.
De Martino A, Douady D, Quinet‐Szely M, Rousseau B, Crépineau F, Apt K, Caron
L (2000) The light‐harvesting antenna of brown algae. Highly homologous
proteins encoded by a multigene family. Eur J Biochem 267: 5540‐5549.

43
Doan J‐M, Schoefs B, Ruban AV, Etienne A‐L (2003) Changes in the LHCI
aggregation state during iron repletion in the unicellular red alga Rhodella
violacea. FEBS Lett 533: 59‐62.
Dring MJ (1992) The biology of marine plants. Cambridge University Press,
Cambridge, UK.. pp. 48‐66.
Engkvist R, Malm T, Nilsson J (2004) Interaction between isopod grazing and wave
action: a structuring force in macroalgal communities in the southern Baltic Sea.
Aquat Ecol 38: 403‐413.
Eriksson BK, Johansson G, Snoeijs P (1998) Long‐term changes in the sublittoral
zonation of brown algae in the southern Bothnian Sea. Eur J Phycol 33: 241‐249.
Eriksson BK, Johansson G (2003) Sedimentation reduces recruitment success of
Fucus vesiculosus in the Baltic Sea. Eur J Phycol 38: 217‐222.
Falkowski PG, Owens TG, Ley AC, Mauzerall DC (1981) Effects of growth
irradiance levels on the ratio of reaction centers in two species of marine
phytoplankton. Plant Physiol 68: 969‐973.
Falkowski PG, Raven JA (1997) Aquatic photosynthesis. Blackwell Science, Malden
MA, USA. p. 92.
Fan D‐Y, Hope AB, Smith PJ, Jia H, Pace RJ, Anderson JM, Chow WS (2007) The
stoichiometry of the two photosystems in higher plants revisited. Biochim
Biophys Acta 1767: 1064‐1072.
Figueroa FL, Nygård C, Ekelund N, Gómez I (2003) Photobiological characteristics
and photosynthetic UV responses in two Ulva species (Chlorophyta) from
southern Spain. J Photochem Photobiol B Biol 72: 35‐44.
Gallagher JC, Wood AM, Alberte RS (1984) Ecotypic differentiation in the marine
diatom Skeletonema costatum: influence of light intensity on the photosynthetic
apparatus. Mar Biol 82: 121‐134.
Gibbs SP (1970) The comparative ultrastructure of the algal chloroplast. Ann NY
Acad Sci 175: 433‐444.
Giordano M, Beardall J, Raven JA (2005) CO2 concentrating mechanisms in algae:
mechanisms, environmental modulation, and evolution. Annu Rev Plant Biol
56: 99‐131.
Gómez I, Wiencke C (1998) Seasonal changes in C, N and major organic
compounds and their signifcance to morpho‐functional processes in the
endemic Antarctic brown alga Ascoseira mirabilis. Polar Biol 19: 115‐124.
Gustafsson BG, Westman P (2002) On the causes for salinity variations in the Baltic
Sea during the last 8500 years. Paleoceanography 17: 12.1‐12.14.
Gustafsson BG (2004) Sensitivity of Baltic Sea salinity to large perturbations in
climate. Clim Res 27: 237‐251.

44
Gylle M (2007) Physiological responses of marine and brackish Fucus vesiculosus
L. with respect to salinity. Licentiat Thesis, Mid Sweden University,
Sundsvall, Sweden.
Hall DO, Rao KK (1999) Photosynthesis. Cambridge University Press, Cambridge,
UK. pp. 175‐178.
Hansson D, Eriksson C, Omstedt A, Chen D (2010) Reconstruction of river runoff
to the Baltic Sea, AD 1500–1995. Int J Climatol DOI: 10.1002/joc.2097.
HELCOM (1996) Third Periodic Assessment of the State of the Marine
Environment of the Baltic Sea, 1989–1993; Background Document. Baltic Sea
Environment Proceedings. Helsinki Commission, Helsinki, Finland. In:
Bergström L, Tatarenkov A, Johannesson K, Jönsson RB, Kautsky L (2005)
Genetic and morphological identification of Fucus radicans sp. Nov (Fucales,
Phaeophyceae) in brackish Baltic Sea. J Phycol 41 (5): 1025‐1038.
HELCOM (2006) Climate Change in the Baltic Sea area. Draft HELCOM Thematic
Assessment in 2006. HELCOM Stakeholder Conference on the Baltic Sea Action
Plan Helsinki, Finland.
HELCOM 2011. Webpage: http://www.helcom.fi/environment2/nature/en_GB/facts
2011‐02‐12.
Hihara Y, Sonoike K, Ikeuchi M (1998) A novel gene, pmgA, specifically regulates
photosystem stoichiometry in the cyanobacterium Synechocystis species PCC
6803 in response to high light. Plant Physiol 117: 1205‐1216.
Hist‐Geo 2010. Webpage: http://www.hist‐geo.co.uk/ 2010‐11‐08.
Huang B (2006) Plant‐Environment Interactions. CRC Press, Boca Raton, FL, USA.
p. 80.
Iwamoto K, Kawanobe H, Ikawa T, Shiraiwa Y (2003) Characterization of salt
regulated mannitol‐1‐1phosphate dehydrogenase in the red alga Calogloss
continua. Plant Physiol 133: 893‐900.
Iwamoto K, Shiraiwa Y (2005) Salt‐regulated mannitol metabolism in algae. Mar
Biotechnol 7: 407‐415.
Johannesson K, André C (2006) Life on the margin: genetic isolation and diversity
loss in a peripheral marine ecosystem, the Baltic Sea. Mol Ecol 15: 2013‐2029.
Johnson GN (2005) Cyclic electron transport in C3 plants: fact or artefact? J Exp Bot
56: 407‐416.
Kaiser M, Attrill M, Jennings S, Thomas DN, Barnes D, Brierley A, Polunin N,
Raffaelli, D, Le B Williams P Le B (2006) Marine ecology: processes, systems
and impacts. Oxford University Press, Oxford, UK.
Kalvas A, Kautsky L (1993) Geographical variation in Fucus vesiculosus
morphology in the Baltic and North Seas. Eur J Phycol 28: 85‐91.

45
Kautsky L, Kautsky H (1989) Algal species diversity and dominance along
gradients of stress and disturbance in marine environments. Vegetatio 83: 259‐
267.
Kautsky H, Kautsky L, Kautsky N, Kautsky U, Lindblad C (1992) Studies on the
Fucus vesiculosus community in the Baltic Sea. Acta Phytogeogr Suec 78: 33‐48.
Kautsky L, Serrão EA (1997) Reproductive ecology in Fucus vesiculosus: a key
species on rocky shores in the Baltic Sea. In: Eriksson BK, Johansson G, Snoeijs P
(1998) Long‐term changes in the sublittoral zonation of brown algae in the
southern Bothnian Sea. Eur J Phycol 33: 241‐249.
Keränen M, Aro E‐M & Tyystjärvi E (1999) Excitation‐emission map as a tool in
studies of photosynthetic pigment‐protein complexes. Photosynthetica 37: 225‐
237.
Kim JH, Click, RE, Melis A (1993) Dynamics of photosystem stoichiometry
adjustment by light quality in chloroplasts. Plant Physiol 102: 181‐190.
Kirst GO (1989) Salinity tolerance in eukaryotic marine algae. Annu Rev Plant
Physiol Plant Mol Biol 41: 21‐53.
Kirst GO, Bisson MA (1989) Regulation of turgor pressure in marine algae: ions
and low moleculare weight organic compounds. Aust J Plant Physiol 6: 539‐556.
Korpinen S, Honkanen T, Vesakoski O, Hemmi A, Koivikko R, Loponen J,
Jormalainen V (2007) Macroalgal communities face the challenge of changing
biotic interactions: Review with focus on the Baltic Sea. Ambio 36: 203‐211.
Kraufvelin P, Lindholm A, Pedersen MF, Kirkerud LA, Bonsdorff E (2010)
Biomass, diversity and production of rocky shore macroalgae at two nutrient
enrichment and wave action levels. Mar Biol 157: 29‐47.
Krause GH, Weis E (1991) Chlorophyll fluorescence and photosynthesis: The
basics. Annu Rev Plant Physiol Plant Mol Biol 42: 313‐349.
Kremer BP (1985) Aspects of cellular compartmentation in brown marine
macroalgae. J Plant Physiol 120: 401‐407.
Lamote M, Darko E, Schoefs B, Lemoine Y (2003) Assembly of the photosynthetic
apparatus in embryos from Fucus serratus L. Photosynth Res 77: 45‐52.
Lawlor DW (2001) Photosynthesis, third edition. BIOS Scientific Publisher Limited,
Oxford, UK. pp. 386.
Lawrence E (Ed.) (2008) Hendersonʹs Dictionary of Biology, 14th edition. Benjamin
Cummings, San Francisco, CA, USA. pp. 776.
Lazár D (2003) Chlorophyll a fluorescence rise induced by high light illumination
of dark‐adapted plant tissue studied by means of a model of photosystem II
and considering photosystem II heterogeneity. J Theor Biol 220: 469‐503.
Lehvo A, Bäck S, Kiirikki M (2001) Growth of Fucus vesiculosus L. (Phaeophyta) in
the northern Baltic proper: Energy and nitrogen storage in seasonal
environment. Bot Mar 4: 345‐350.

46
Lobban CS, Harrisson PJ (1997) Seaweed ecology and physiology. Cambridge
University Press, Cambridge, UK. pp. 366.
Maayana I, Shayaa F, Ratnera K, Mania Y, Laveeb S, Avidana B, Shahaka J,
Ostersetzer ostersetzer ‐Birana O (2008) Photosynthetic activity during olive
(Olea europaea) leaf development correlates with plastid biogenesis and Rubisco
levels. Physiol Plantarum 134: 547‐558.
Major KM, Dunton KH (2000) Photosynthetic performance in Syringodium filiforme:
seasonal variation in light‐harvesting characteristics. Aquat Bot 68: 249‐264.
Malavenda SV, Voskoboinikov GM (2009) Influence of abiotic factors on the
structure of the population of the brown alga Fucus vesiculosus in East Murman
(Barents Sea). Russ J Mar Biol 35 (2): 132‐137.
Mandori A, Melis A (1984) Photochemical apparatus organization in Anacystis
nidulans (Cyanophyceae); Effect of CO2 concentration during cell growth. Plant
Physiol 74: 67‐71.
Mannan RM, Pakrasi HB (1993) Dark heterotrophic growth conditions result in an
increase in the content of photosystem II units in the filamentous
cyanobacterium Anabaena variabilis. ATCC 29413. Plant Physiol 103: 971‐977.
Mattoo AK, Giardi M‐T, Raskind A, Edelman M (1999) Dynamic metabolism of
photosystem II reaction center proteins and pigments. Physiol Plantarum 107:
454‐461.
McEvoy JP, Brudvig GW (2006) Water‐splitting chemistry of photoystem II. Chem
Rev 106 (11): 4455‐4483.
Meier MHE (2006) Baltic Sea climate in the late twenty‐first century: a dynamical
downscaling approach using two global models and two emission scenarios.
Climate Dynamics 27: 39‐68.
Melis A, Brown JS (1980) Stoichiometry of system I and system II reaction centers
and of plastoquinone in different photosynthetic membranes (photoreaction /
electrontransport / spectrophotometry / chloroplastfunction / P700‐chlorophyll).
Proc Nati Acad Sci USA 77 (8): 4712‐4716.
Michel G, Tonon T, Scornet D, Cock JM, Kloareg B (2010) Central and storage
carbon metabolism of the brown alga Ectocarpus siliculosus: insights into the
origin and evolution of storage carbohydrates in Eukaryotes. New Phytologist
188: 67‐81.
Muhlin JF, Brawley SH (2009) Recent versus relic: Discerning the genetic signature
of Fucus vesiculosus (Heterokontophyta; Phaeophyceae) in the northwestern
Atlantic. J Phycol 45: 828‐837.
Munda IM (1967) Der Einfluss der Salinität auf die chemische Zusammensetzung,
das Wachstum und die Fruktifikation einiger Fucaceen. Nova Hedwigia 13: 471‐
508.

47
Munda IM, Kremer BP (1977) Chemical composition and physiological properties
of fucoids under conditions of reduced salinity. Mar Bio 42: 9‐16.
Murakami A (1997) Quantitative analysis of 77K fluorescence emission spectra in
Synechocystis sp. PCC 6714 and Chlamydomonas reinhardtii with variable
PSI⁄PS II stoichiometries. Photosynth Res 53: 141‐148.
Nelson N, Ben‐Shem A (2006) Structure, function and regulation of plant
photosytem I. In: Photosystem I: the light‐driven plastocyanin:ferredoxin
oxidoreductase. Ed. Golbeck JH. Kluwer Academic Publishers (Springer),
Dordrecht, The Netherlands. pp. 71‐77.
Rasband WS 1997‐2010. ImageJ, Webpage: http://rsb.info.nih.gov/ij/. U.S. National
Institutes of Health, Bethesda, MD, USA, 2011‐02‐12.
Nixon PJ, Barker M, Boehm M, de Vries R (2005) FtsH‐mediated repair of the
photosystem II complex in response to light stress. J Exp Bot 56: 357‐363.
Nixon PJ, Michoux F, Yu J, Boehm M, Komenda J (2010) Recent advances in
understanding the assembly and repair of photosystem II. Ann Bot 106: 1‐16.
Nygård CA (2005) Ecophysiological responses of Baltic and Atlantic Fucus
vesiculosus to environmental factors. PhD Thesis, Mid Sweden University,
Sundsvall, Sweden.
Nygård CA, Ekelund NGA (2006) Photosynthesis and UV‐B tolerance of the
marine alga Fucus vesiculosus at different sea water salinities. J Appl Phycol 18:
461‐467.
Nygård CA, Dring MJ (2008) Influence of salinity, temperature, dissolved
inorganic carbon and nutrient concentration on the photosynthesis and growth
of Fucus vesiculosus from the Baltic and Irish Seas. Eur J Phycol 43: 253‐262.
Omstedt A, Hansson D (2006) The Baltic Sea ocean climate system memory and
response to changes in the water and heat balance components. Continent Shelf
Res 26: 236‐251.
Ort DR 2007. Webpage: http://www.life.uiuc.edu/govindjee/photoweb/ortlab2.gif.
Agricultural Research Service. 2007‐02‐15
Papageorgiou GC (2004) Fluorescence of photosynthetic pigments in vitro and in
vivo. In: Chlorophyll a Fluorescence: A Signature of Photosynthesis. Ed.
Papageorgiou GC & Govindjee. Springer, Dordrecht, The Netherlands. pp. 43‐
63.
Pearson G, Kautsky L, Serrão E (2000) Recent evolution in Baltic Fucus vesiculosus:
reduced tolerance to emersion stresses compared to intertidal (North Sea)
populations. Mar Ecol Prog Ser 202: 67–79.
Pearson G, Serrão, EA, Cancela ML (2001) Suppression subtractive
hybridization for studying gene expression during aerial exposure and
desiccation in fucoid algae. Eur J Phycol 36: 359‐366.
48
Pereyra RT, Bergström L, Kautsky L, Johannesson K (2009) Rapid speciation in a
newly opened postglacial marine environment, the Baltic Sea. BMC Evol Biol 9:
70.
Pospíšil P, Skotnica J, Nauš J (1998) Low and high temperature dependence of
minimum F0 and maximum FM chlorophyll fluorescence in vivo. Biochim Biophys
Acta 1363 (2): 95‐99.
Powell HT (1963) S peciation in the genus Fucus L. and related genera. In:
Speciation in the sea. Ed. Harding JP & Tebble N. Systematics Association
Publication, London, UK. pp. 63‐77.
Ramus J, Lemons F, Zimmerman C (1977) Adaptation of light‐harvesting pigments
to downwelling light and the consequent photosynthetic performance of the
eulittoral rockweeds Ascophyllum nodosum and Fucus vesiculosus. Mar Biol 42:
293‐303.
Raven JA, Samuelson G (1988) Ecophysiology of Fucus vesiculosus L. close to its
northern limit in the Gulf of Bothnia. Bot Mar 31: 399‐410.
Raven JA (1997) Putting the C in phycology. Eur J Phycol 32: 319‐333.
Reed RH, Davison IR, Chudek JA, Foster R (1985) The osmotic role of mannitol in
the Phaeophyta: an appraisal. Phycologia 24: 35‐47.
Rhode S, Hiebenthal C, Wahl M, Karez R, Bischof K (2008) Decreased depth
distribution of Fucus vesiculosus (Phaeophyceae) in the Western Baltic: effects of
light deficiency and epibionts on growth and photosynthesis. Eur J Phycol 43 (2):
143‐150.
Ruuskanen A & Bäck S (1999) Morphological variation of northern Baltic sea Fucus
vesiculosus L. Ophelia 50 (1): 43‐59.
Råberg S, Kautsky L (2007) A comparative biodiversity study of the associated
fauna of perennial fucoids and filamentous algae. Estuar Coast Shelf Sci 73: 249‐
258.
Sakamoto A, Alia, Murata N (1998) Metabolic engineering of rice leading to
biosynthesis of glycinebetaine and tolerance to salt and cold. Plant Mol Biol 38:
1011‐1019.
Sakamoto A, Murata N (2000) Genetic engineering of glycinebetaine synthesis in
plants: current status and implication for. J Exp Bot 51 (342): 81‐88.
Salvador ML, Klein U (1999) The redox state regulates RNA degradation in the
chloroplast of Chlamydomonas reinhardtii. Plant Physiol 121: 1367‐1374.
Santabarbara S, Galuppini L, Casazza AP (2010) Bidirectional Electron Transfer in
the reaction centre of photosystem I. J Integr Plant Biol 52 (8): 735‐749.
Schobert B (1977) Is there an osmotic regulatory mechanism in algae and higher
plants? J Theo Biol 68: 17‐26.
Schoefs B, Franck, F (1998) Chlorophyll synthesis in dark grown pine primary
needles. Plant Physiol 118: 1159‐1168.

49
Schories D, Pehlke C, Selig U (2009) Depth distributions of Fucus vesiculosus L. and
Zostera marina L. as classification parameters for implementing the European
water framework directive on the german Baltic coast. Ecol Indicat 9: 670‐680.
Schramm W (1996) The Baltic Sea and its transition zones. In: Eriksson BK,
Johansson G, Snoeijs P (1998) Long‐term changes in the sublittoral zonation of
brown algae in the southern Bothnian Sea. Eur J Phycol 33: 241‐249.
Serrão EA, Kautsky L, Brawley SH (1996) Distributional success of the marine
seaweed Fucus vesiculosus L. in the brackish Baltic Sea correlates with osmotic
capabilities of Baltic gametes. Oecologica 107: 1‐12.
Serrão EA, Brawley SH, Hedman J, Kautsky L, Samuelsson G (1999) reproductive
success in Fucus vesiculosus (Phaeophyceae) in the Baltic Sea. J Phycol 35: 254‐69.
Shiina T, Allison L, Maliga P (1998) rbcL transcript levels in tobacco plastids are
independent of light: reduced dark transcription rate is compensated by
increased mRNA stability. Plant Cell 10: 1713‐1722.
Shim JS, Matsui Y, Bhat S, Nacev BA, Xu J, Bhang H‐EC, Dhara S, Chung Han K,
Chong CR, Pomper MG, So A, Liu JO (2010) Effect of nitroxoline on
angiogenesis and growth of human bladder cancer. J Natl Cancer Inst. 102 (24):
1855‐1873.
Smirnoff N, Cumbes QJ (1989) Hydroxyl radical‐scavenging activity of
compatible solutes. Phytochemistry 28: 1057‐1060.
Smith BM, Melis A (1987) Photosystem stoichiometry and excitation distribution in
chloroplasts from surface and minus 20 meter blades of Macrocystis pyrifera, the
Giant Kelp. Plant Physiol 84: 1325‐1330.
Snoeijs P (1999) Marine and brackish waters. In: Rydin H, Snoeijs P and Diekmann
M (eds) Swedish plant geography. Acta Phytogeogr Suec 84: 187‐212.
SOU (2007) Climate and vulnerability investigation: Sweden and climate change:
threats and possibilities. Ministry for Environment. Swedish State Public
Inquiry.
Stewart CM, Higgins HG, Austin S (1961) Seasonal variation in alginic acid,
mannitol, laminarin and fucoidin in brown alga Ecklonia radiata. Nature
(London) 192: 1208.
Sudhir P, Murthy SDS (2004) Effects of salt stress on basic processes of
photosynthesis. Photosynthetica 42 (4): 481‐486.
Surif MB, Raven JA (1989) Exogenous inorganic carbon sources for
photosynthesis in seawater by members of the Fucales and the Laminariales
(Phaeophyta): ecological and taxonomic implications. Oecol 78: 97‐105.
Taiz L, Zeiger E (2006) Plant Physiology. Sinauer Associates Inc Publishers,
Sunderland, MA, USA. pp. 702.
Tanaka Y, Katada S, Ishikawa H, Ogawa T, Takabe T (1997) Electron flow from
NAD(P)H dehydrogenase to photosystem I is required for adaptation to salt
50
shock in the cyanobacterium Synechocystis sp. PCC 6803. Plant Cell Physiol 38
(12): 1311‐1318.
Tatarenkov A, Bergström L, Jönsson RB, Serraõ EA, Kautsky L, Johannesson K
(2005) Intriguing asexual life in marginal populations of the brown seaweed
Fucus vesiculosus. Mol Ecol 14 (2): 647‐651.
Tatarenkov A, Jönsson, RB, Kautsky L, Johannesson K (2007) Genetic structure in
populations of Fucus vesiculosus (Phaeophyceae) over spatial scales from 10 m to
800 km. J Phycol 43: 675‐685.
Torn K, Krause‐Jensen D, Martin G (2006) Present and past depth distribution of
bladderwrack (Fucus vesiculosus) in the Baltic Sea. Aquat Bot 84: 53‐62.
Voipio A, Leinonen M (1984) Östersjön – vårt hav. LTs förlag (Natur & Kultur),
Stockholm, Sweden. pp. 180.
Wethey DS (1985) Catastrophe, Extinction, and Species Diversity: A Rocky
Intertidal Example. Ecology 66 (2): 445‐456.
Wærn M (1952) Rocky‐shore algae in the Oregrund archipelago. Acta Phytogeogr
Suec 30: 1–298.
Yamaguchi T, Ikawa T, Nisizawa K (1966) Incorporation of radioactive carbon
from H14CO3 into sugar constituents by a brown alga, Eisenia bicyclis, during
photosynthesis and its fate in the dark. Plant Cell Physiol 7: 217‐229.
Yamazaki J‐Y, Suzuki T, Maruta, Kamimura Y (2005) The stoichiometry and
antenna size of the two photosystems in marine green algae, Bryopsis maxima
and Ulva pertusa, in relation to the light environment of their natural habitat. J
Exp Bot 56 (416): 1517‐1523.
Zhu XG, Govindjee, Baker NR, deSturler E, Ort DR, Long SP (2005) Chlorophyll a
fluorescence induction kinetics in leaves predicted from a model describing
each discrete step of excitation energy and electron transfer associated with
Photosystem II. Planta 223: 114‐133.