pilot testing of self-healing coatings in structural concrete · pilot testing of self-healing...
TRANSCRIPT
Pilot Testing of Self-Healing Coatings in Structural Concrete
Submitted to the Faculty of
Worcester Polytechnic Institute
in partial fulfillment of the requirements for the
Degree of Bachelor of Science
in
Chemical Engineering
Civil Engineering
By
__________________________________
Sebastien Deveau
__________________________________
Max Foster
__________________________________
Logan Nichols
__________________________________
Anna Schab
Date: 3/3/2017
Project Advisors:
__________________________________
Amy Peterson
__________________________________
Aaron Sakulich
This report represents work of WPI undergraduate students submitted to the faculty as evidence of a
degree requirement. WPI routinely publishes these reports on its web site without editorial or peer
review. For more information about the projects program at WPI, see
http://www.wpi.edu/Academics/Projects.

1
Abstract
In the United States, reinforced concrete is used in almost all types of infrastructure. Reinforced
concrete is a versatile building material; however, it is vulnerable to damage from the inner steel rebar. This
MQP focused on furthering research into the application of self-healing capsules onto the rebar within the
concrete. Parking stops with healing capsules were manufactured and placed outdoors to begin weathering
for a future MQP. Various colorimetric and micrograph healing tests were performed to evaluate capsule
deterioration over time. Information about capsule oxidation and degradation was compiled, evaluated, and
reported. Groundwork was laid for future testing and potential wide-spread application of self-healing
coating technology.

2
Executive Summary
In the United States, reinforced concrete is used in almost all types of infrastructure. As of 2015,
there were over 7 billion yd3 (6.4 billion m3) of reinforced concrete in use in the United States and roughly
an additional 380 million yd3 (291 million m3) are constructed each year.[1] For reinforced concrete, more
resilient coatings on rebar are necessary to better prevent corrosion. Real-time corrosion effects were
studied on rebar with an applied self-healing coating cast in concrete parking stops. In addition to the
parking stop tests, the oxidation of the capsule contents was investigated and the healing ability over varying
levels of oxidation was evaluated.
The first step in manufacturing reinforced concrete is making the rebar. The metal bars can be
manufactured to different standards, which affect their intended purpose, performance, and service life. It
is worth noting that some other types of rebar treatment are possible when manufacturing reinforced
concrete. Rebar can also be made from non-metal materials, such as fiberglass. Although reinforced
concrete offers high tensile strength and durability, it is also vulnerable to corrosion through its internal
steel rebar.
The governing document for a standard concrete mix is ACI 211.1 Proportions for Normal,
Heavyweight, and Mass Concrete. A concrete mix is generally made up of three components: water,
aggregate (rock, gravel, and/or sand), and portland cement. The concrete mix used for the parking stops
was a standard mix that emphasized workability due to the small spaces of the parking molds. A major
threat to the longevity of steel-reinforced concrete Infrastructure is steel corrosion due to chlorides.
Thereby, freeze/thaw conditions were considered because stops in areas of heavy freeze/thaw would have
more exposure to chlorides.
Due to the vulnerability of steel rebar to corrosion, there is a need for protective coatings on the
rebar. Conventional epoxy coatings are brittle and susceptible to damage in the form of cracks that are
nearly impossible to detect or repair. A previous MQP group investigated tung oil as an appropriate healing
agent for rebar due to its ability to polymerize into a hard waterproof film when exposed to air. Another
MQP group continued this work using accelerated corrosion testing with different coating damaging
techniques. The most common strategy for creating a self-healing coating is to encapsulate a healing agent
in a micro/nanocapsule. Microcapsules have been used in many areas such as pharmaceuticals, adhesives,
insecticides, etc. Tung oil is an effective self-healing agent due to its ability to polymerize into a waterproof
film when exposed to air.[17]
This project focused on two main goals: creating pilot reinforced concrete samples to be analyzed
and advancing research about the microcapsules’ self-healing capabilities over time.

3
The procedure for the encapsulation of tung oil was based on the method used in Samadzadeh et
al. The microcapsules used in testing were of varying synthesis conditions. To make the experimental self-
healing epoxy coating, 10 wt.% of microcapsules was mixed with a two-part epoxy coating consisting of
an epoxy resin and a curing agent (Super Glaze, Rust-Oleum Parks). A total number of 12 samples of #3
rebar were coated: eight with modified (self-healing) coating, and four with unmodified epoxy coating.
Coated and cured rebar samples were then subjected to impact damage.
Real-time corrosion effects were studied on concrete parking stops that contained rebar with an
applied self-healing coating. . These parking stops were between 4’ (1.23m) and 6’ (1.83m) in length and
3’6” (1.07m) to 6’5” (1.96m) in height to assure optimal safety both for vehicle and pedestrians. In addition
to the parking stop tests, the oxidation of the capsule contents was investigated and the healing ability over
varying levels of oxidation was evaluated. A total of six wooden molds, made with whitewood planks and
studs, were created to produce the six parking stops. To have the rebar fit securely in the mold, concrete
spacers were fabricated from Quikrete to support the rebar during concrete casting. The coated rebar
sections were placed on the spacers in the molds prior to concrete casting. Supplementary handholds were
slotted into the main molds, then screwed into place.
Five batches of microcapsules synthesized under different conditions were studied
using colorimetric tests. Microcapsule effectiveness was analyzed through micrographic observation of
healing capacity. A microcapsule crush test was also used to identify a qualitative measure of the amount
of liquid tung oil present in the microcapsules after exposure to air. The 10 wt.% coatings were prepared
by mixing 0.2 g of capsules into 0.988 g of epoxy resin with a planetary centrifugal (Thinky) mixer set at
500 rpm for 3 minutes.
Diffusion is a process by which molecules travel from a region of high concentration to low
concentration through random motion, also known as Brownian motion.[20] Diffusion is important to
consider in understanding the effectiveness of microcapsules for self-healing coatings because tung oil can
diffuse through the microcapsule shell.
Diffusion of encapsulated tung oil through the poly-urea formaldehyde, pUF, microcapsule shell
wall was modeled and compared against the trends found in the colorimetry studies performed. Fick’s Laws
of Diffusion were used to create a model for diffusion of tung oil in this study. To simplify Fick’s Second
Law of diffusion, an approximation for transient one dimensional diffusion through a plane wall was used.
The two major components for the parking stop fabrication were the concrete mix and the molds.
After reviewing the final molds, the concrete mix was designed with workability emphasized. Once the six
parking stops were placed at Gateway, it was observed that snowplows pushed the stops to a variety of
different places in the lot. Experimental Stop 2 was selected at random on 2/21/17 to be broken. The stop

4
had only been exposed to freeze/thaw conditions for ten weeks before being broken open, and showed
minimal signs of corrosion.
Microcapsule diameter and shell thickness for each synthesis condition was expected to impact the
diffusion and oxidation that would affect absorbance readings. Microcapsule thickness appears to have an
effect on absorbance trends; however, other synthesis conditions are difficult to relate to the trends
observed. It was also found that the rate of absorbance diminished over time. Because original
measurements of absorbance varied greatly between replicates, it was necessary to normalize the data by
measuring increasing absorbance for each individual replicate.
Results for the two tests measuring effectiveness varied over the synthesis conditions and time
periods. When the test was repeated using capsules left exposed to oxidize, less evidence of the cuts sealing
with tung oil was present. This reduction of healing is particularly notable in S2 and S3, which both showed
almost no tung oil sealing the cracks after three days of healing. It is important to note that significant
difficulty was encountered when creating samples for this healing test, so further analysis was performed
to understand the presence of healing tung oil in the microcapsules over time. This second test involved
crushing the microcapsules between two glass slides. After the capsules were ruptured, less liquid tung oil
was observed flowing from the capsules exposed for a week versus the non-exposed capsules.
To estimate the mass diffusivity, DAB, of tung oil in pUF a model for diffusivity of alcohol in
amorphous polystyrene was used. The value for CA,s was assumed to be constant and equal to the molar
density of tung oil because of the infinite well assumption. Using the estimated value of DAB, the one-term
approximation described in the methodology was solved over time with varying microcapsule thicknesses.
The diffusion rate decreased with increasing microcapsule shell thickness. The theoretical model of the
tung oil concentration on the surface of the capsule shows that tung oil initially quickly diffuses out of the
capsules, then the diffusion rate slows over time. It is crucial to note that the theoretical models predict that
diffusion will halve after about a week of exposed capsule time. The experimental data did not perfectly
match the theoretical diffusion model, which can be attributed to some of the assumptions to the model. As
previously noted, an infinite well was assumed, which was not the case with the real capsules. Furthermore,
as tung oil leaves the microcapsule, less of the spherical surface area is being used for diffusion of the
remaining oil.
It is important to work to improve the service life of structural concrete because of its wide
application in the construction industry, from highway bridges to towering skyscrapers. This project aimed
to further research into the field of self-healing microcapsules that could potentially lengthen this service
life. Future research could explore alternate pilot-testing of self-healing coatings in structural concrete.

5
Authorship
Each team member chose sections of the report that they felt most confident writing about. That
team member wrote the initial draft of each of those sections, then these sections were reviewed by the
other team members. This process was repeated for the introduction, background, methodology, and
conclusion sections until all sections were written and reviewed by everyone. For the experimental portion,
the team attempted to divide the work so the four members spent an equal amount of time and effort in the
labs, as well as ensuring that each team member participated to some degree with each facet of the project.
Sections Leader(s)
Introduction Anna Schab
Background: Parking Stop Anna Schab
Background: Concrete Anna Schab
Background: Rebar Max Foster
Background: Colorimetry Sebastien Deveau
Background: Diffusion Sebastien Deveau & Max Foster
Methodology: Molds Max Foster
Methodology: Concrete Anna Schab
Methodology: Rebar Max Foster & Logan Nichols
Methodology: Micrograph Logan Nichols & Sebastien Deveau
Methodology: Rupture Max Foster
Results: Parking Stops Anna Schab
Results: Colorimetry Sebastien Deveau
Results: Diffusion Logan Nichols
Results: Micrograph Max Foster
Conclusions Logan Nichols
Citations Max Foster
Experimental: Molds Logan Nichols
Experimental: Concrete Anna Schab
Experimental: Rebar Max Foster
Experimental: Colorimetry Sebastien Deveau
Experimental: Micrograph Logan Nichols
Experimental: Rupture Sebastien Deveau & Anna Schab
Abstract Max Foster
Executive Summary Anna Schab
Final Report Editing Anna Schab
Final Report Formatting Sebastien Deveau
6
Table of Contents
Abstract 1
Executive Summary 2
Authorship 5
Table of Contents 6
Table of Figures 8
Table of Tables 11
1.0 Introduction 12
2.0 Background 13
2.1 Concrete Mix Design 13
2.2 Metal Rebar Fabrication 13
2.4 Levels of Freeze/Thaw Environments 14
2.5 Chlorides in Relation to Corrosion 15
2.6 Conventional and Self-Healing Coatings for Rebar 15
2.7 Self-Healing Coatings (Microcapsules) 17
2.9 The Diffusion Process 18
2.10 Application of Reinforced Concrete 19
3.0 Methodology 20
3.1 Synthesis of Tung Oil Microcapsules 20
3.3 Preparation of Self-Healing Coating 21
3.4 Preparation of Coated Rebar 21
3.5 Concrete Mix for Parking Stops 21
3.6 Parking Stop Mold and Fabrication of Parking Stops 22
3.7 Observation of Corrosion Effects 25
3.8 Colorimetric Analysis 25
3.9 Microcapsule Diffusion 26
4.0 Results and Discussion 28
4.1 Parking Stops 28
4.1.1 Parking Stop Fabrication and Placement 28
4.1.2 Identifying Potential Rebar Corrosion 30
4.2 Microcapsules 31

7
4.2.1 Colorimetric Analysis of Microcapsules 31
4.2.2 Effect of Oxidation on Healing 34
4.3 Diffusion Model 37
5.0 Conclusions 41
Appendix A: Synthesis Conditions 42
Appendix B: Healing 44
Appendix C: Microcapsule Healing over Time 46
Appendix D: Microcapsule Rupture Test 47
Appendix E: SEM Images of Synthesis Conditions 48
Appendix F: Microcapsule Dimensions 50
Civil Engineering Design Statement 55
Professional Licensure Statement 56
References 57

8
Table of Figures
Figure 1. Freeze/Thaw Environment of the USA 15
Figure 2. Demonstration of anodic and cathodic reactions 16
Figure 3. Autonomous healing concept: crack propagation can be halted and repaired when a healing
agent is released and activated 17
Figure 4. (a) A SEM image of a scratch on an epoxy coating containing self-healing tung oil
microcapsules; (b) A SEM image of a scratch in the same coating after 24 hours of healing 18
Figure 5. Common parking stop design 19
Figure 6. Blueprints for Parking Stop Molds 23
Figure 7. Hand-holds for Parking Stop Molds 23
Figure 8. Blueprint of a Fully Assembled Parking Stop Mold 24
Figure 9. Blueprint of the Cast Concrete Parking Stop 24
Figure 10. Model of the Diffusion of Tung Oil through pUF 27
Figure 11. Concrete stop after 24 hours with breaks in hand holds 28
Figure 12. (a) Concrete vibration tool operated on filled mold. (b) Concrete stops after 24 hours 29
Figure 13. Parking stop exposed in snowbank 29
Figure 14. Three-point bending system for concrete stop damage 30
Figure 15. Concrete stop broken to expose rebar 31
Figure 16. Rebar experimental coating stripped off 31
Figure 17 . Absorbance measurements of the microcapsules of varying synthesis conditions demonstrate
an overall increasing trend that plateaus. Each datum comprises the average increase in absorbance of the
five wells. The error bars indicate the standard deviation 33
Figure 18. S5 fresh capsules after cut versus three days of healing 34
Figure 19. S1 capsule healing. (a) Fresh capsules. (b) Capsules allowed to oxidize one week. (c) Capsules
allowed to oxidize three weeks. Healing is fairly consistent across oxidation periods 34
Figure 20. S2 capsule healing. (a) Fresh capsules. (b) Capsules allowed to oxidize one week. (c) Capsules
allowed to oxidize three weeks. Healing is significantly reduced after three-week oxidation periods 35

9
Figure 21. S3 capsule healing. (a) Fresh capsules. (b) Capsules allowed to oxidize one week. (c) Capsules
allowed to oxidize three weeks. Healing is significantly reduced after three-week oxidation periods 35
Figure 22. Liquid tung oil present in S2. (a) Fresh capsules where liquid is viewable pooling around the
capsules. The arrow points to visible evidence of liquid pooling. (b) Capsules allowed to oxidize one
week. The amount of liquid tung oil is shown to decrease after one week of oxidation 36
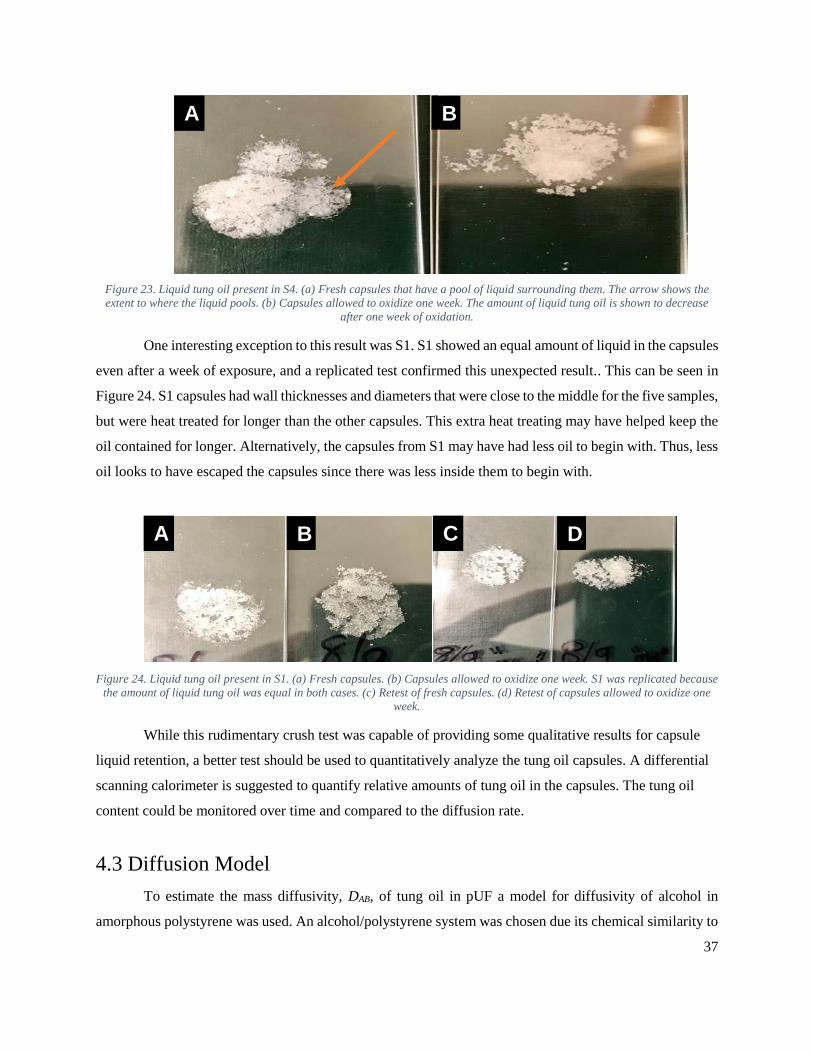
Figure 23. Liquid tung oil present in S4. (a) Fresh capsules that have a pool of liquid surrounding them.
The arrow shows the extent to where the liquid pools. (b) Capsules allowed to oxidize one week. The
amount of liquid tung oil is shown to decrease after one week of oxidation 37
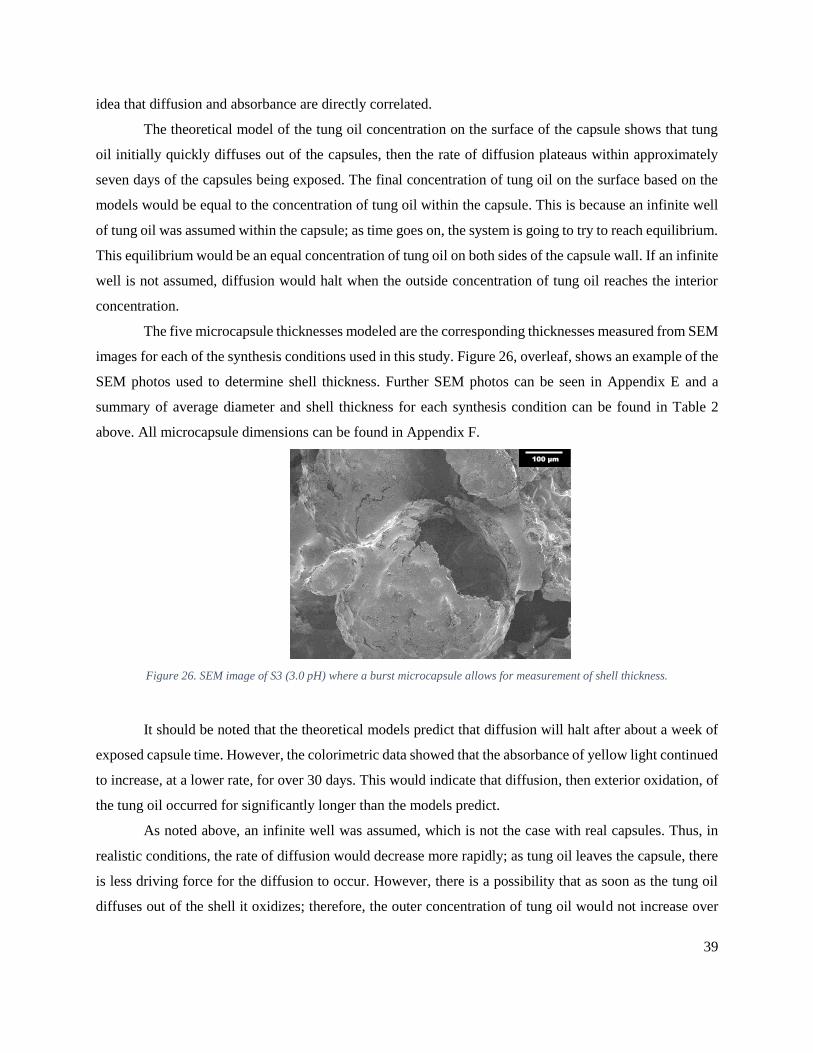
Figure 24. Liquid tung oil present in S1. (a) Fresh capsules. (b) Capsules allowed to oxidize one week. S1
was replicated because the amount of liquid tung oil was equal in both cases. (c) Retest of fresh capsules.
(d) Retest of capsules allowed to oxidize one week 37
Figure 25. This graph shows the theoretical resulting concentration over time at the outside surface of the
microcapsule, CA(0,t), at varying microcapsule thicknesses 38
Figure 26. SEM image of S3 (3.0 pH) where a burst microcapsule allows for measurement of shell
thickness 39
Figure 27. S1 fresh capsules after cut versus three days of healing 44
Figure 28. S2 fresh capsules after cut versus three days of healing 44
Figure 29. S3 fresh capsules after cut versus three days of healing 45
Figure 30. S4 fresh capsules after cut versus three days of healing 45
Figure 31. S4 capsule healing. (a) Fresh capsules. (b) Capsules allowed to oxidize one week. (c) Capsules
allowed to oxidize three weeks 46
Figure 32. Liquid tung oil present in S3. (a) Fresh capsules that have a pool of liquid surrounding them.
(b) capsules allowed to oxidize one week 47
Figure 33. Liquid tung oil present in S5. (a) fresh capsules that have a pool of liquid surrounding them.
(a) capsules allowed to oxidize one week 47
Figure 34. SEM images of S1 capsules 48
Figure 35. SEM images of S2 capsules 48
Figure 36. SEM images of S3 capsules 48
Figure 37. SEM images of S4 capsules 48

10
Figure 38. SEM images of S5 capsules 49

11
Table of Tables
Table 1. Material distribution for the concrete mix used in the concrete parking stops 22
Table 2. Average diameter and shell thickness for each synthesis condition plus or minus the standard
deviation. 32
Table 3. S1 (5 hr) raw measurements from SEM images 50
Table 4. S1 (5 hr) average dimensions 50
Table 5. S2 (4.0 pH) raw measurements from SEM images 51
Table 6. S2 (4.0 pH) average dimensions 51
Table 7. S3 (3.0 pH) raw measurements from SEM images 52
Table 8. S3 (3.0 pH) average dimensions 52
Table 9. S4 (1.5x uF) raw measurements from SEM images 53
Table 10. S4 (1.5x uF) average dimensions 53
Table 11. S5 (0.8x EMA) raw measurements from SEM images 54
Table 12. S5 (0.8x EMA) average dimensions 54

12
1.0 Introduction
In the United States, reinforced concrete is used in almost all types of infrastructure. From bridges
to foundations, there is a growing focus on the need for more durable and longer lasting reinforced concrete.
One of the ways this could be accomplished is through the use of resilient coatings that would prevent rebar
corrosion and concrete deterioration.
As of 2015, there were over 7 billion yd3 (6.4 billion m3) of utilized reinforced concrete in the
United States and roughly an additional 380 million yd3 (291 million m3) constructed each year.[1] Rebar is
a steel bar placed in concrete that greatly improves tensile strength of concrete, which makes rebar a widely-
used building material. Reinforced concrete is vulnerable to corrosion through rusting of its internal steel
rebar. The added volume of oxidized iron can cause the internal pressure to surpass the tensile strength of
the concrete, thereby creating cracks.[2] To extend the service life of rebar, a protective epoxy coating can
be applied; however, conventional epoxy coatings are prone to imperfections and damage. When an epoxy
coating is damaged it is no longer able to protect the rebar from corrosive threats.
More resilient coatings are necessary to more effectively prevent the corrosion of rebar. Two past
MQP projects, advised by Amy Peterson and Aaron Sakulich, investigated a possible solution that improves
the service life of reinforced concrete through the application of a self-healing epoxy coating. By adding
microcapsules that release a self-healing agent upon rupture to the epoxy coating, damage that would lead
to rusting and failure can be autonomously healed.[2]
Real-time corrosion effects were studied on rebar with an applied self-healing coating cast in
concrete parking stops. These modified parking stops, along with parking stops that incorporate an
unmodified rebar coating, were placed at Gateway #1, 60 Prescott St, Worcester, MA and will be exposed
to all regular weather conditions until clear visual evidence of weathering has occurred.
In addition to the parking stop tests, the oxidation of the capsule contents was investigated and
the healing ability over varying levels of oxidation was evaluated. The capsules’ absorbance of a yellow
wavelength of light over time was compared to their ability to heal the epoxy in which they were
incorporated. As the microcapsules are exposed to air, the encapsulated tung oil diffuses outward and
oxidizes, which causes a yellow coloration. A mathematical model for tung oil diffusion was created and
compared to trends in oxidation coloration. These correlations aided in predicting the shelf life of tung oil
microcapsules synthesized under various conditions.

13
2.0 Background
2.1 Concrete Mix Design
The governing document for a standard concrete mix is ACI 211.1, Proportions for Normal,
Heavyweight, and Mass Concrete. The publication notes that “...the selection of concrete proportions
involves a balance between economy and requirements for placeability, strength, durability, and
appearance.”[4] By adhering to this balance, the optimal mix can be achieved for the specific concrete
product.
A concrete mix is generally made up of three components: water, aggregate (rock, gravel, and/or
sand), and portland cement. A mix can also contain admixtures, glass fibers, etc., that are added depending
on the properties desired for that specific mixture. Certain properties, like workability, strength, durability,
etc., are influenced by the mix ratios and design considerations. Also, because concrete is produced in bulk,
the costs associated with each material are considered.[5] However, since the materials used in concrete are
universal raw materials, concrete production is relatively cheap. Concrete is naturally resistant to
compressive forces; however, tensile forces can cause it to crack. This cracking can quickly propagate and
lead to structural failure if not treated quickly. Fortunately, there are ways to fortify concrete and make it a
more flexible, durable construction material. One way to address this problem is by installing metal
reinforcing bars (rebar) that provide better resistance to these tensile forces. This reinforced concrete is
stronger, lasts longer, and can be used in more applications, such as overpasses, buildings, and parking
stops.[3]
2.2 Metal Rebar Fabrication
The first step in manufacturing reinforced concrete is making the rebar. The most common metal
used is steel due to its high strength, durability, and relatively low cost. Steel is created through an iron
refinement process, in which iron is superheated, coked with carbon, and subjected to impurity oxidization
through the Bessemer process.[6] When carbon coke, a carbon fuel with few impurities, is burned it reduces
iron ore to molten pig iron and slag. This pig iron then has a stream of oxygen passed through it, which
removes impurities and excess carbon from the iron, refining it into steel.
The metal bars can be manufactured to different standards, which affect their intended purpose,
performance, and service life. Ridges are usually formed on the bars, which provide better mechanical
interlocking with the surrounding concrete.[7] The steel itself can be made to different strengths, grades, and
14
types, depending on its carbon content and how it is rolled.
It is worth noting that some other types of rebar treatment are possible when manufacturing
reinforced concrete. Stainless steel and hot-dip galvanized rebar are particularly relevant; both treatments
add initial cost but extend the service life of the concrete by increasing corrosion resistance. Hot-dip
galvanizing involves placing clean steel bars in molten zinc, which reacts with the steel to form an alloy.
This alloy metallically bonds with the rebar, providing a coating that is resistant to both physical damage
and corrosion over time.[8]
Rebar can also be made from non-metal materials, such as fiberglass. Fiberglass is more expensive
than steel for this application and only provides slightly higher strength. However, fiberglass rebar has a
higher corrosion resistance and a longer overall service-life. Fiberglass rebar is crafted by setting high-
strength glass fibers in a resin matrix to form the desired rod shape. This rod can be coated and set into
concrete as normal.[9]
Although reinforced concrete offers high tensile strength and durability, it is also vulnerable to
corrosion through its internal steel rebar. Concrete, as a porous material, allows for the passage of both air
and humidity, which allows oxygen to interact with the rebar even while encased in the concrete. Corrosion
(in the form of oxidation) of the steel rebar is a long-term process and can take place over several years.
This poses a problem because the oxidization of the steel can cause expansion in volume of up to eight
times its original size. The added volume of oxidized steel can cause the internal pressure to surpass the
tensile strength of the concrete, thereby creating cracks.[3]
2.4 Levels of Freeze/Thaw Environments
Freeze/thaw can cause major corrosion of concrete surfaces. The freeze/thaw phenomenon occurs
when water enters the pores that exist in concrete and then freezes. The freezing water expands and can
cause cracking and expose rebar to corrosive agents. Freeze/thaw environments across the world range
between nonexistent, moderate, and severe. A nonexistent environment means concrete adjustments usually
are not necessary. A moderate environment or severe freeze/thaw environment will often have admixtures
or different material ratios in place to correct for the adverse effects. Massachusetts falls into the severe
category and therefore is exposed to weather conditions that cause the most corrosion on concrete (Figure
1, overleaf). Massachusetts is one of many states that uses deicing salts that contribute greatly to corrosion.

15
Figure 1. Freeze/Thaw Environment of the USA[10]
2.5 Chlorides in Relation to Corrosion
A major threat to the longevity of steel-reinforced concrete infrastructure is steel corrosion due to
chlorides. Bentz et al. demonstrated how transverse cracks provide a major pathway for detrimental species
to reduce the service-life of concrete.[3] The diffusion of chloride ions in relation to both the depth and width
of a rectangular transverse crack was modeled.
A unique aspect of this research was its two-dimensional approach to studying the diffusion of
chloride ions through concrete. Corrosion of rebar due to chloride ions is a complex phenomenon, in part
because chloride diffusion cannot be accurately described by Fickian diffusion. This is because there are
two different types of chloride ions that pass through the concrete, either free chlorides or bound chlorides.
The free chlorides undergo diffusion as proposed by Fick’s law, 𝐽 = 𝐷𝑑𝜑
𝑑𝑥; however, the bound chlorides
react with and bind to hydrated cement. [22] The study demonstrated it was not only the kinetics of the
diffusion that affects corrosion, but the chloride binding as well. Therefore, the binding of chlorides in
concrete hinders the ability of the chloride ions to penetrate further into the concrete, thus protecting the
rebar.[11] The conclusion of this study was that by taking into account the effect of binding on infrastructure
corrosion, the overall service life estimation increased.[3]
2.6 Conventional and Self-Healing Coatings for Rebar
Due to the vulnerability of steel rebar to corrosion, there is a need for protective coatings. Epoxy
coating systems are commonly applied to rebar to form a dense barrier against corrosive agents. Because

16
concrete has a high pH, it forms a passive neutral film around the rebar thereby protecting it from corrosion.
However, when the concrete is penetrated by water, chloride ions, and oxygen, the pH of the concrete is
lowered thus disabling the film protecting the rebar. Once this film is breached, two simultaneous reactions
occur. The anodic reaction causes the rebar to lose electrons due to oxidation, react with hydroxides,
produce ferrous oxide, and then react with oxygen to form rust. The cathodic reaction uses the free electrons
from the oxidation to form hydroxide ions from the water and oxygen diffusing through the concrete. These
two reactions can be seen in Figure 2 below. Therefore, the physical barrier that the epoxy coating provides
is valuable in protecting the concrete from corrosion, but this is only half of its usefulness.[12] The epoxy
coating also aids in the reduction of corrosion through increased electrical resistance.[13]
Figure 2. Demonstration of anodic and cathodic reactions.[12]
Conventional epoxy coatings are brittle and susceptible to damage in the form of cracks that are
nearly impossible to detect or repair. One way to improve conventional epoxy coatings is to incorporate
encapsulated self-healing agents that have the ability to release repairing polymers when damaged. These
self-healing agents are released during crack propagation to form a barrier to corrosive agents and prevent
further damage. Self-healing coatings in general are capable of passively repairing minor damage without
the need for manual repair and have become an area of scientific interest in the past two decades.[14]
A previous MQP group investigated tung oil as an appropriate healing agent for rebar due to its
ability to polymerize into a hard waterproof film when exposed to air.[2] In this study, self-healing coatings
were prepared by incorporating microcapsules containing tung oil into conventional epoxy coatings. Both
the modified self-healing and unmodified epoxy coatings were then applied to rebar. The coated rebar was
cut to simulate a crack in the coating before being cast in concrete then exposed to accelerated corrosion
testing. The result showed that the self-healing coating incorporating tung oil microcapsules extended the
service life of concrete reinforcement by over 300% as compared to unmodified conventional epoxy
coatings.[2]
Another MQP group continued this work of accelerated corrosion testing with different coating

17
damaging techniques. The coatings were damaged with cuts and impact damage, and it was determined that
impact damaging had the most distinguishable effects on service life of the rebar. The results of this study
showed a similar increase of service life of approximately 300% of reinforced concrete containing tung oil
microcapsule modified epoxy coated rebar compared to rebar with unmodified epoxy.[15]
2.7 Self-Healing Coatings (Microcapsules)
The most common strategy for creating a self-healing coating is to encapsulate a healing agent in
a micro/nanocapsule. These capsules are incorporated into a coating and remain suspended in a material as
seen in Figure 3. When a crack begins to propagate through a coating or when damage exposes the
underlying substrate, the incorporated microcapsules rupture and release healing agents to repair the
damage by forming a new protective layer.[16]
Figure 3. Autonomous healing concept: crack propagation can be halted and repaired when a healing agent is released and
activated.[11]
Tung oil is an effective self-healing agent due to its ability to polymerize into a waterproof film
when exposed to air.[17] This is important because when damage occurs to conventional epoxy coatings,
corrosion is able to proceed unbarred. On the other hand, epoxy coatings containing the self-healing agent
will be able to reform the barrier after damage has been applied. The self-healing effects of tung oil
microcapsules embedded in epoxy coating can be seen in Figure 4.

18
Figure 4. (a) A SEM image of a scratch on an epoxy coating containing self-healing tung oil microcapsules; (b) A SEM image of
a scratch in the same coating after 24 hours of healing.[18]
Microcapsules have been used in many areas such as pharmaceuticals, adhesives, insecticides, etc. While
there are many methods to synthesize microcapsules, the most common and easiest method for poly(urea-
formaldehyde), or pUF, encapsulation is in situ polymerization.[14] The method for synthesizing these
microcapsules is through an emulsification reaction.[19] This method allows for several variations depending
on the amount of material used, the ratio of different materials, and the rate and temperature of agitation.
2.9 The Diffusion Process
Diffusion is a process by which molecules travel from a region of high concentration to low
concentration through random motion, also known as Brownian motion.[20] The rate of diffusion is thus
directly proportional to the concentration gradient.[21] It is through this mechanism that a drop of ink mixes
with water, the scent of a flower permeates a room, or calcium permeates through bone.[22] The phenomenon
by which Brownian motion transports molecules is mathematically described by Fick’s law, 𝐽 = 𝐷𝑑𝜑
𝑑𝑥.[22]
The law states that the mean rate at which molecules travel from high concentrations to low concentrations,
𝐽, is proportional to the density gradient, 𝑑𝜑
𝑑𝑥.[22] Conservation of mass and energy and the relations of the
diffusive fluxes and heat flow all work to determine diffusivity.[23] Diffusivity is defined as “the ability of
a molecule to diffuse through a sea of other molecules.”[24]
Considering diffusion is important in understanding the effectiveness of microcapsules for self-
healing coatings. Over time the tung oil within the capsules diffuses outward through the polymer shell,
depleting the reserve of tung oil healing agent. As the tung oil diffuses outward it reacts with oxygen,
polymerizes, and creates a hard, yellowed shell. This change in coloration is expected to be directly related
to diffusion. Therefore, the more tung oil that has diffused out of the shell, the more yellow the coloration

19
becomes, and the less the microcapsules are able to heal. Understanding the rate of diffusion of tung oil
through the polymer shell would allow for an estimation of the service life of the microcapsules.[20]
2.10 Application of Reinforced Concrete
As stated, reinforced concrete has found use in various construction applications. This study
focuses on a small-scale application: parking stops, the rectangular block on the end of a parking space that
prevents a vehicle from pulling through a parking spot. The typical dimensions and shape of a parking stop
are shown in Figure 5. The dimensions of a parking stop have been designed to keep both the safety of
pedestrians in mind and to prevent any damage to vehicles. The slanted sides allow for a vehicle to roll onto
the stop rather than enduring possible tire damage on sharp corners, and the width of the stop is sufficient
to account for the tire span of most, if not all, vehicles.[25]
Figure 5. Common parking stop design.[26]
Parking stops should be between 4’ (1.23m) and 6’ (1.83m) and in length and 3’6” (1.07m) to 6’5”
(1.96m) in height to assure optimal safety both for vehicle and pedestrians. A parking stop is composed of
reinforced concrete which results in a 150 lb. to 250 lb. (68 to 113 kg) weight range.[25] While the actual
parking stop may cost around $22, it is recommended to use a local distributor for the purchase of parking
stops as shipping is very costly due to weight.[27] Concrete parking stops were chosen as a means to pilot
test real-time corrosion effects on self-healing coated rebar because they allow for exposure to the elements,
contain two separate pieces of rebar that , and are relatively easy to move and manufacture.

20
3.0 Methodology
This project focused on two main goals: creating and analyzing pilot reinforced concrete samples
and advancing research about the microcapsules’ self-healing capabilities over time. Parking stops with
both microcapsule modified epoxy (experimental) and unmodified epoxy rebar coatings (control) were
fabricated from molds, then placed in a location exposed to freeze/thaw elements. One of the parking stops
was broken open after about three months to observe any corrosion effects. Following that, microcapsules
of different synthesis specifications were analyzed to observe their change in color. At the same time,
coatings with these different microcapsules were made and then damaged to determine their healing
effectiveness over varying levels of oxidation.
3.1 Synthesis of Tung Oil Microcapsules
The procedure for the encapsulation of tung oil was based on the method used in Samadzadeh et
al. All the microcapsules used in this experiment were previously synthesized in Amy Peterson’s laboratory
by REU students. Tung oil was encapsulated in a pUF shell using an oil-in-water emulsion. Deionized water
(200 mL) was mixed with 25 mL of ethyl maleic anhydride (EMA, a surfactant), 0.5 g of ammonium
chloride (a pH buffer), 0.5 g of resorcinol (a stabilizer), and 5 g of urea (a component of the polymer shells)
in a beaker. The solution was placed into a room temperature water bath and pH was then adjusted to 3.5,
using a sodium hydroxide solution, to control the morphology of the polymer shells. Tung oil (50 mL) was
slowly added while the solution was mechanically stirred until a stabilized emulsion had formed.
Formaldehyde (13 g) was added to the emulsion and the temperature was raised to 60°C for 4 hours in order
to facilitate polymerization between the urea and formaldehyde. The solution was then cooled and vacuum
filtered to extract the microcapsules, which were then washed with acetone and water and allowed to air
dry. More details on this synthesis method can be seen in Chen et al.[2]
Five different synthesis conditions were considered: S1, S2, S3, S4, and S5. The synthesis
conditions are classified by their differences from the baseline conditions described above. Condition S1
was heated for 5 hours, as compared to the 4 hour baseline. S2 had the pH adjusted to 4.0 and S3 had the
pH adjusted to 3.0, as compared to the baseline of 3.5 pH. S4 had 150% urea and formaldehyde amounts
of the baseline (7.5 g urea and 19.5g formaldehyde), and S5 had 80% of the EMA amount that the baseline
contained (20 mL). For complete synthesis conditions, see Appendix A. All five synthesis conditions of
microcapsules used were imaged with a scanning electron microscope (SEM) in order to measure diameters
and shell thicknesses for each respective condition.

21
3.3 Preparation of Self-Healing Coating
To make the experimental self-healing epoxy coating, 10 wt. % of microcapsules was mixed with
a two-part epoxy coating consisting of an epoxy resin and a curing agent (Super Glaze, Rust-Oleum Parks).
A microcapsule loading of 10 wt. % was chosen because it was used in past reports and found to be
effective.[2] Microcapsules were mixed into the epoxy resin using a planetary centrifugal mixer, and then
degassed at 300 rpm for five minutes. Degassing was necessary in order to remove air bubbles, to prevent
void formation in the coating. The microcapsule/epoxy resin mixture was then hand mixed into the curing
agent immediately prior to application to rebar samples. The unmodified coating was prepared in a similar
fashion by hand mixing the epoxy resin (with no microcapsules or other additives) and the curing agent.
3.4 Preparation of Coated Rebar
12 samples of #3 rebar were coated with either modified (self-healing) or unmodified epoxy
coating. The rebar was cut to 36” (91.4 cm) lengths and cleaned to remove particulates before being coated.
The coatings were manually applied with brushes to completely cover the surface of the bars. Eight samples
of rebar were coated with the epoxy coating containing microcapsules and the remaining four samples of
rebar were coated with unmodified epoxy coating. All samples were allowed to cure for 72 hours at room
temperature.
Coated and cured rebar samples were then subjected to impact damage. Impact damage was
determined to be an effective and controlled method for comparing self-healing and unmodified coatings
and showed distinguishable corrosion effects under accelerated corrosion testing.[28] All coated rebar
samples were impacted in two locations, 10.5” (26.67cm) from each end. Impact damage was applied to all
of the samples using an Instron Dynatup 8250 impact tester. The tester was set up with a 1” (2.54 cm)
diameter spherical nose drop weight, weighing 11 lb (5 kg), that was dropped from a height of 3” (7.25
cm). The samples were allowed 72 hours to heal after being damaged before being cast in concrete. These
damaged, coated rebar sections were slotted into the parking stop mold assemblies, which were now ready
for the addition of concrete mix.
3.5 Concrete Mix for Parking Stops
The concrete mix was designed to emphasize workability and strength. Through the ASTM
standard mix design, the selected mix was a non-air entrained mix that had a design yield of 00.17 lb/yd3
(0.101 kg/m3). The material distribution is presented in Table 1. Using a large mixer, half the coarse

22
aggregate, half the fine aggregate, and half the water were combined and then mixed for three minutes.
Then, the rest of the coarse aggregate, fine aggregate, and water were added along with all the cement. The
materials were mixed for five minutes.
Table 1. Material distribution for the concrete mix used in the concrete parking stops.
Mix Design Yield per m3 or yd3 Mix Design Actual Mix Design Actual
kg/m3 (lb/yd3) kg (lb) (%)
Water 207.55 (350.00) 26.78 (59.50) 6.80
Cement 432.39 (729.16) 55.78 (123.96) 14.10
Coarse Aggregate 1436.63 (2422.65) 185.33 (411.85) 46.80
Fine Aggregate 990.68 (1670.63) 127.80 (284.01) 32.30
Total 5172.44 (3067.26) 395.69 (879.31) 100.00
3.6 Parking Stop Mold and Fabrication of Parking Stops
Real-time corrosion effects were studied on rebar with an applied self-healing coating cast in
concrete parking stops. These modified parking stops, along with parking stops that incorporate an
unmodified rebar coating, were placed at Gateway #1, 60 Prescott St, Worcester, MA and will be exposed
to weather conditions until clear visual evidence of weathering has occurred.
In addition to the parking stop tests, the oxidation of the capsule contents was investigated and the
healing ability over varying levels of oxidation was evaluated. The capsules’ absorbance of a yellow
wavelength of light over time was compared to their ability to heal the epoxy in which they were
incorporated. As the microcapsules are exposed to air, the encapsulated tung oil diffuses outward and
oxidizes, which causes a yellow coloration. A mathematical model for tung oil diffusion was created and
compared to trends in oxidation coloration. These correlations aided in predicting the shelf life of different
tung oil microcapsules made under various conditions.
Six wooden molds, made with whitewood planks and studs, were created to produce the six parking
stops. The inner dimensions of each mold were: 40” (102 cm) long, 7.25” (18.4 cm) wide, and 4.75” (12.1
23
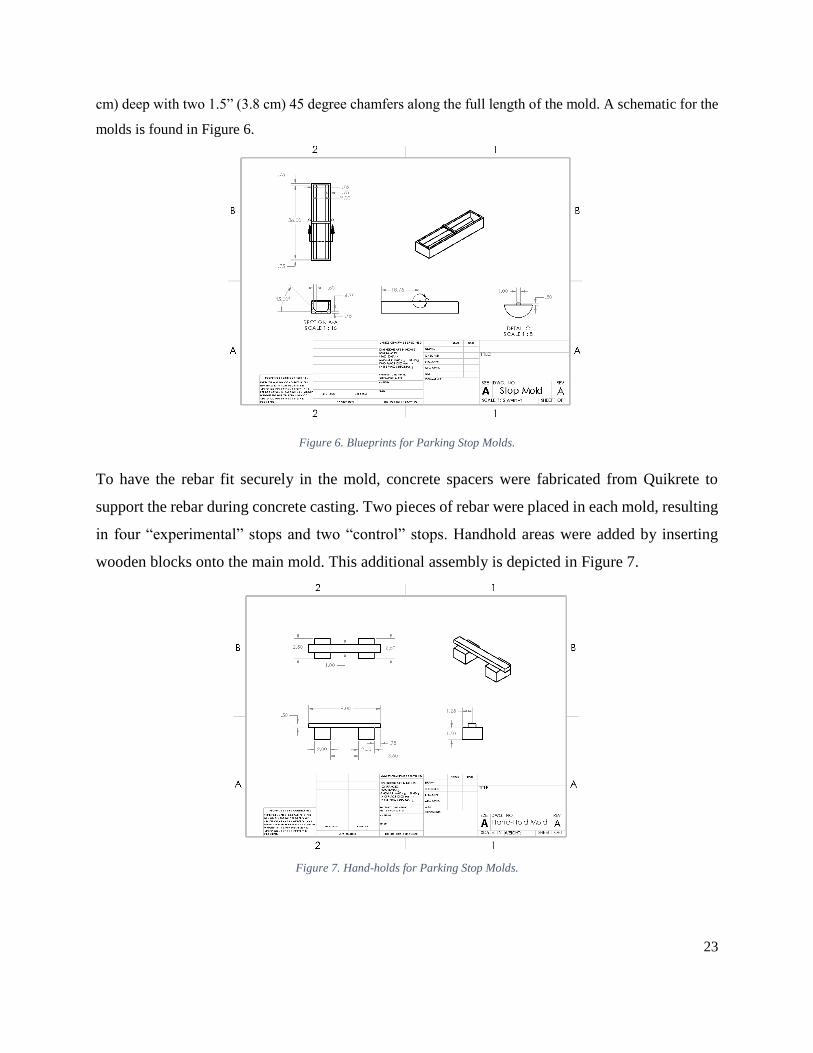
cm) deep with two 1.5” (3.8 cm) 45 degree chamfers along the full length of the mold. A schematic for the
molds is found in Figure 6.
Figure 6. Blueprints for Parking Stop Molds.
To have the rebar fit securely in the mold, concrete spacers were fabricated from Quikrete to
support the rebar during concrete casting. Two pieces of rebar were placed in each mold, resulting
in four “experimental” stops and two “control” stops. Handhold areas were added by inserting
wooden blocks onto the main mold. This additional assembly is depicted in Figure 7.
Figure 7. Hand-holds for Parking Stop Molds.

24
These supplementary handholds were slotted into the main molds, then screwed into place. This had the
added effect of bracing the sides of the mold. The mold assembly is pictured in Figure 8, and the resulting
cast is depicted in Figure 9 below.
Figure 8. Blueprint of a Fully Assembled Parking Stop Mold.
Figure 9. Blueprint of the Cast Concrete Parking Stop.
Concrete spacers were made to suspend the rebar inside the wooden molds during concrete casting.
The spacers were designed to maintain a minimum concrete cover of 1.5” (3.81 cm) from each piece of
rebar to the exterior. A Quikrete sand/topping mix was used to create the spacers. Quikrete was chosen
because it provides better binding to the concrete cast compared to conventional plastic and metal rebar
spacer alternatives.
The coated rebar sections were placed on the spacers in the molds prior to concrete casting. Each
mold had two rebar sections with the same coating placed inside, for a total of two control molds containing
standard epoxy rebar and four experimental molds containing modified epoxy rebar. The interior wooden
surfaces of the mold were sprayed with cooking oil as a release agent to aid removal of the concrete cast.
The concrete mix was prepared as described in Section 3.4 and poured into each mold. The cast concrete
was rodded and degassed with a concrete vibrator before being covered and cured at room temperature for
24 hours. The cast molds were then uncovered and transferred to a humidity-controlled curing room. After

25
20 days of curing the molds were disassembled and the parking stops were removed. The parking stops
were marked and placed outside on 12/6/16 in the parking lot at 60 Prescott St, Worcester, MA.
3.7 Observation of Corrosion Effects
One parking stop was selected at random to be broken open for observation of corrosion effects
after approximately three months of being exposed to winter conditions. The parking stop was examined
by first observing the surface for cracks and other signs of significant corrosion, such as an expanded
volume of steel resulting from oxidation. Then, a sledgehammer was used to break away pieces of the
concrete to partially expose the rebar. The exposed rebar was examined for signs of corrosion and then the
remaining concrete was removed with a sledgehammer. The fully exposed rebar was then closely examined,
paying particular attention to the impact damaged locations, to look for corrosive effects. It was then
determined if significant corrosion had occurred and if breaking open further stops would be necessary.
3.8 Colorimetric Analysis
Five batches of microcapsules synthesized with different synthesis conditions were analyzed. A
multi-well scanning spectrophotometer (Perkin-Elmer 1420 Multi-Label Counter) was used to measure
absorbance values for each of the chosen batches of microcapsules. The microcapsules were then analyzed
to determine healing effectiveness in an epoxy-resin mix.
The tung oil microcapsules studied for these colorimetric tests were created in the same procedure
detailed in Section 3.1. The batches of tung oil microcapsules chosen, labeled S1 (5 hr), S2 (4.0 pH), S3
(3.0 pH), S4 (1.5x uF), and S5 (0.8x EMA), have their synthesis conditions, diameters and shell thicknesses
detailed in Table 2 in the Results section. Five 0.2 g samples of each of the five batches were weighed into
a 96-well tray for a total of 25 filled wells. Approximately 2.0 g more of each batch were separated into
glass vials for further testing and stored in the same conditions as the 96-well tray. The 96-well tray was
then slotted into the plate reader and analyzed using Perkin-Elmer 2030 Workstation software. A custom
protocol was used that measured the absorbance of each well using two different wavelengths of light: 540
nm and 590 nm. The 590 nm wavelength was repeated a second time, to get more reliable results. These
measurements were 0.1 seconds each, with a one second delay between measurements. This was to quantify
the capsules visibly changing color over time as a result of tung oil diffusion and oxidation. The 96-well
plate was left to age in open-air conditions at room temperature and relative humidity and new readings
were taken at weekly intervals. The resulting absorbance values were then compared against microcapsule
effectiveness.

26
Microcapsule effectiveness was analyzed through observation of healing capability. This was
conducted by preparing a 10 wt. % microcapsule in epoxy coating on a glass slide, curing the coating for
72 hours, damaging the coating with a razor blade, and observing healing via microscopy. A set of coatings
were prepared using capsules from the open-air vials of each of the five batches, at each time point when
the 96-well tray was measured for absorbance values.
Another method was used to identify a qualitative measure of the amount of liquid tung oil present
in microcapsules after exposure to air. The microcapsule rupture test used the same batches as were
mentioned previously to determine the amount of liquid tung oil present after one week of exposure to air.
0.2 grams of preserved microcapsules and microcapsules exposed to air for one week were weighed out
and placed on individually labeled glass slides. After all microcapsules were weighed and placed on the
respective slides, another glass slide was placed on top of the microcapsules and pressure was applied to
cause rupturing. Micrographic evidence was taken to determine differences in liquid tung oil.
The 10 wt. % coatings were prepared by mixing 0.2 g of capsules into 0.988 g of epoxy resin with a
planetary centrifugal (Thinky) mixer set at 500 rpm for 3 minutes. An equal volume of epoxy activator,
weighing 0.812 g, was then added and the sample was mixed again at 500 rpm for 3 minutes, as
recommended by the epoxy instructions. The 10 wt. % coating samples were then poured onto glass
microscope slides and allowed to cure for three days. After curing, the samples were cut through with a
razor blade and allowed to heal for an additional three days. Images were taken immediately after the cutting
and again after three days of healing with a Leica DFC420 microscope using Leica Application Suite
software. Images were taken in 2592 x 1944 resolution, with a 5.7 ms exposure time. These micrographs
were used in order to observe self-healing capabilities of the coating for each time point corresponding with
an absorbance reading. The plate reader was set to measure the absorbance of yellow light.
3.9 Microcapsule Diffusion
Diffusion of encapsulated tung oil through the poly-urea formaldehyde microcapsule shell wall was
modeled and compared against the trends found in the colorimetry studies performed. A mathematical
model of diffusion over time was created and the resulting curves were used to evaluate expected trends.
Fick’s Laws of Diffusion were used to create a model for diffusion of tung oil in this study. Fick’s
Second Law of Diffusion describes one-dimensional diffusion of a species A in a stationary medium B in
terms of concentration change over time[29]:
𝜕2𝐶𝐴𝜕𝑥2
=1
𝐷𝐴𝐵
𝜕𝐶𝐴𝜕𝑡

27
Where CA is the concentration of species A, DAB is the mass diffusivity constant for species A diffusing
through B, x is the position in the media, and t is the time elapsed. In this study, the diffusing species A is
encapsulated tung oil and the stationary medium B is the pUF shell. Air diffusing into the microcapsule
was not considered.
To simplify Fick’s Second Law of diffusion, an approximation for transient one dimensional
diffusion through a plane wall was used[29]. This approximation, known as the one-term approximation, is
as follows:
𝐶𝐴(𝑥, 𝑡) − 𝐶𝐴,𝑠𝐶𝐴,𝑖 − 𝐶𝐴,𝑠
= 𝐶1 exp (𝛇𝟏𝟐𝑫𝑨𝑩
𝑳𝟐𝒕) 𝒄𝒐𝒔(𝛇
𝟏𝒙∗)
where CA(x,t) is the concentration of tung oil at position x and time t, CA,s is the concentration of tung oil
at the inner surface of the pUF shell, CA,i is the initial concentration of tung oil in the pUF shell, L is the
thickness of the pUF shell, and x* is the position relative to the surfaces (defined as x*= x/L.) The
constants ζ1 and C1 are defined as ζ1 = 1.57 radians and C1 = 1.27, when the assumption is made that
species transfer by diffusion is much larger than the resistance to species transfer by convection at the
surface[29]. An infinite reservoir of tung oil was assumed, resulting in a constant value of CA,s. Figure 10
depicts the system to be analyzed, where the tung oil reservoir on the left diffuses through the pUF shell
to the surface exposed to air on the right.
Figure 10. Model of the Diffusion of Tung Oil through pUF.[29]
In this analysis CA(0,t), the concentration over time of tung oil at the outer surface of the pUF
microcapsule, was solved for multiple shell thicknesses. The resulting curves were compared against the
curves for absorbance found through the colorimetry study to look for correlations between diffusion of
tung oil and light absorbance.

28
4.0 Results and Discussion
4.1 Parking Stops
4.1.1 Parking Stop Fabrication and Placement
The two major components for the parking stop fabrication were the concrete mix and the molds.
The molds were sturdy enough to hold the setting concrete and create the desired shape; however, it was
difficult to remove parts of the molds from the concrete. Canola oil cooking spray and duct tape were used
on the mold surfaces to allow for easy removal of concrete. If cooking spray was used more liberally, it
likely would have been easier to remove the molds. Although the molds were designed to be disposable,
portions of the wood were stuck to the concrete, especially the handhold portions. This is evident in Figure
11. The design called for handholds that were flush against the walls of the mold. This led to the holds
experiencing excessive compression forces. If these holds were set against the wall but were tall enough to
rise above the rest of the mold then removal would have been easier and breakage at the corners of the
handholds could have been avoided.
Figure 11. Concrete stop after 24 hours with breaks in hand holds.
After reviewing the final molds, the concrete mix was designed with workability emphasized. Since
there were multiple small spaces within the molds, it was crucial to have a mix that would be able to fill
these gaps without disturbing the spacers. The concrete vibrator tool was imperative to the successful
degassing and setting of the concrete inside the molds before placement in the curing room. The tool
eliminated the air voids and allowed the team to fill the entirety of the mold, creating a homogenous mixture
capable of setting, as is evident in Figure 12, overleaf. The concrete stops after 24 hours are pictured in
Figure 13, overleaf.

29
Figure 12. (a) Concrete vibration tool operated on filled mold. (b) Concrete stops after 24 hours.
Once the six parking stops were placed at Gateway, it was observed that once the snow fell, and
the parking lot was plowed, the stops were pushed to a variety of different places in the lot. All stops ended
up in the snow banks and were subsequently covered in snow and ice. Figure 13 shows parking stops in
one of the snow banks in the Gateway Lot. Although this is not necessarily a true field condition for parking
stops, this was beneficial for an “accelerated” corrosion effect because all of the stops were buried in
freeze/thaw conditions.
Figure 13. Parking stop exposed in snowbank.
A B
30
4.1.2 Identifying Potential Rebar Corrosion
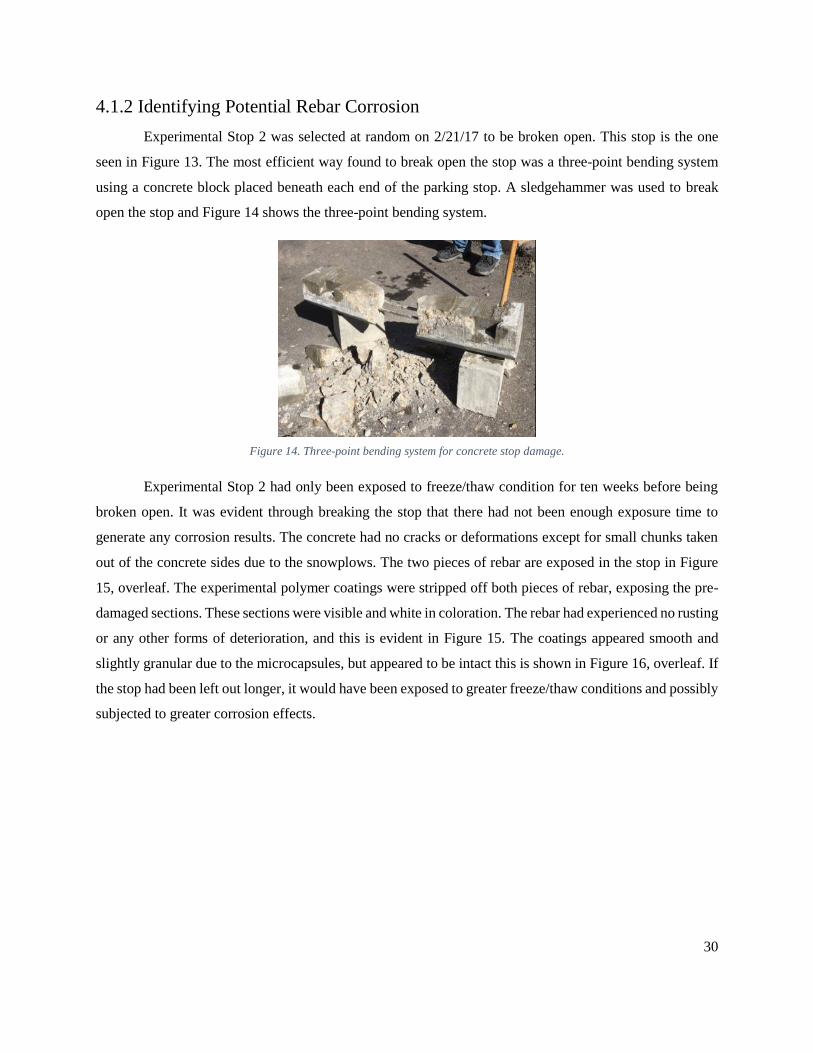
Experimental Stop 2 was selected at random on 2/21/17 to be broken open. This stop is the one
seen in Figure 13. The most efficient way found to break open the stop was a three-point bending system
using a concrete block placed beneath each end of the parking stop. A sledgehammer was used to break
open the stop and Figure 14 shows the three-point bending system.
Figure 14. Three-point bending system for concrete stop damage.
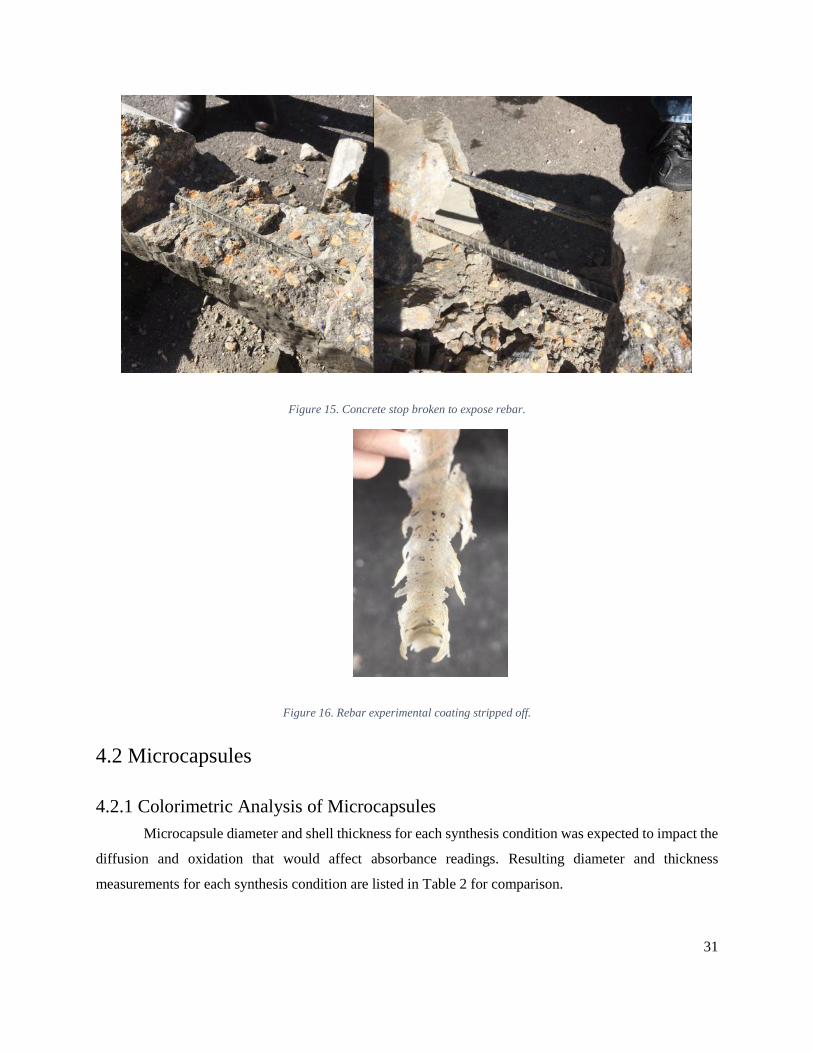
Experimental Stop 2 had only been exposed to freeze/thaw condition for ten weeks before being
broken open. It was evident through breaking the stop that there had not been enough exposure time to
generate any corrosion results. The concrete had no cracks or deformations except for small chunks taken
out of the concrete sides due to the snowplows. The two pieces of rebar are exposed in the stop in Figure
15, overleaf. The experimental polymer coatings were stripped off both pieces of rebar, exposing the pre-
damaged sections. These sections were visible and white in coloration. The rebar had experienced no rusting
or any other forms of deterioration, and this is evident in Figure 15. The coatings appeared smooth and
slightly granular due to the microcapsules, but appeared to be intact this is shown in Figure 16, overleaf. If
the stop had been left out longer, it would have been exposed to greater freeze/thaw conditions and possibly
subjected to greater corrosion effects.
31
Figure 15. Concrete stop broken to expose rebar.
Figure 16. Rebar experimental coating stripped off.
4.2 Microcapsules
4.2.1 Colorimetric Analysis of Microcapsules
Microcapsule diameter and shell thickness for each synthesis condition was expected to impact the
diffusion and oxidation that would affect absorbance readings. Resulting diameter and thickness
measurements for each synthesis condition are listed in Table 2 for comparison.

32
Table 2. Average diameter and shell thickness for each synthesis condition plus or minus the standard deviation.
Synthesis Condition Average Diameter (µm) Average Shell Thickness (µm)
S1 (5 hr) 395 +/- 56 24.4 +/- 7.2
S2 (4.0 pH) 413 +/- 79 35.2 +/- 5.8
S3 (3.0 pH) 466 +/- 86 23.1 +/- 4.2
S4 (1.5x uF) 303 +/- 51 21.5 +/- 4.9
S5 (0.8x EMA) 267 +/- 48 18.9 +/- 2.5
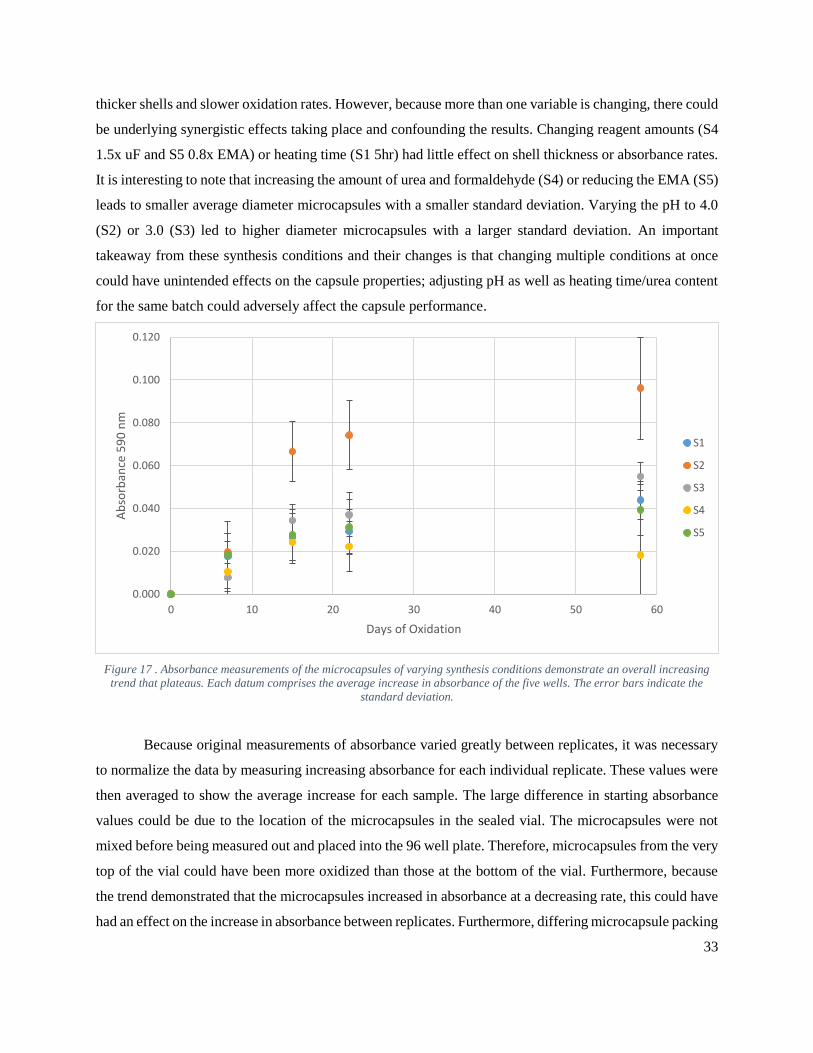
Microcapsule absorbance at 590 nm increased over time, as is shown in Figure 17. However, some
capsules had a higher rate of increasing absorbance than others. Because each batch of microcapsules tested
had different synthesis conditions, this would indicate that the rate of oxidation changes with said synthesis
conditions.
Microcapsule thickness appears to have an effect on absorbance trends. The increase of absorbance
over time seems to be directly correlated with increasing shell thickness. The largest change in absorbance
over time was in S2 (4.0 pH), which had the largest shell thickness. The smallest change in absorbance over
time was in S4 (1.5x uF) and S5 (0.8x EMA), which have the two smallest shell thicknesses. S1 (5 hr) and
S3 (3.0 pH) have thicknesses and absorbance rates that fall between the other synthesis conditions. This
trend supports the hypothesis of slower diffusion and oxidation with increasing shell thickness. The thicker
shell will take longer for encapsulated tung oil to diffuse outward, leading to a greater change in absorbance
over time compared to thinner shells, where tung oil quickly diffuses, leading to a smaller change over time.
It was found that the rate of absorbance of the microcapsules diminished over time. This may be
due to depleted reserves of tung oil in the capsules or increased resistance to diffusion with increasing
surface polymerization. Because the mechanism behind the oxidation of the tung oil is based on passive
diffusion, where molecules move from an area of high concentration to low concentration through the pUF,
the rate of diffusion will decrease over time as the reserves are depleted. Another possible reason for the
diminishing rate of absorbance could be due to the build-up of polymerized tung oil on the external shell
of the pUF. As the tung oil diffuses out of the microcapsule it reacts with oxygen and polymerizes on the
outside of the shell. While this mechanism of forming a hard, polymerized layer is the primary reason the
tung oil is used as the self-healing agent, it could also inhibit further diffusion.
The trends shown in figure 17 are difficult to attribute to synthesis conditions. S2 with a pH of 4.0
has the highest absorbance change over time where S3 at 3.0 pH has the second highest. Furthermore, the
remaining S1, S4, and S5, which have 3.5 pH, have the three lowest changes in absorbance. This may
suggest changing the pH from the baseline value of 3.5 during synthesis, either higher or lower, leads to
33
thicker shells and slower oxidation rates. However, because more than one variable is changing, there could
be underlying synergistic effects taking place and confounding the results. Changing reagent amounts (S4
1.5x uF and S5 0.8x EMA) or heating time (S1 5hr) had little effect on shell thickness or absorbance rates.
It is interesting to note that increasing the amount of urea and formaldehyde (S4) or reducing the EMA (S5)
leads to smaller average diameter microcapsules with a smaller standard deviation. Varying the pH to 4.0
(S2) or 3.0 (S3) led to higher diameter microcapsules with a larger standard deviation. An important
takeaway from these synthesis conditions and their changes is that changing multiple conditions at once
could have unintended effects on the capsule properties; adjusting pH as well as heating time/urea content
for the same batch could adversely affect the capsule performance.
Figure 17 . Absorbance measurements of the microcapsules of varying synthesis conditions demonstrate an overall increasing
trend that plateaus. Each datum comprises the average increase in absorbance of the five wells. The error bars indicate the
standard deviation.
Because original measurements of absorbance varied greatly between replicates, it was necessary
to normalize the data by measuring increasing absorbance for each individual replicate. These values were
then averaged to show the average increase for each sample. The large difference in starting absorbance
values could be due to the location of the microcapsules in the sealed vial. The microcapsules were not
mixed before being measured out and placed into the 96 well plate. Therefore, microcapsules from the very
top of the vial could have been more oxidized than those at the bottom of the vial. Furthermore, because
the trend demonstrated that the microcapsules increased in absorbance at a decreasing rate, this could have
had an effect on the increase in absorbance between replicates. Furthermore, differing microcapsule packing
0.000
0.020
0.040
0.060
0.080
0.100
0.120
0 10 20 30 40 50 60
Ab
sorb
ance
59
0 n
m
Days of Oxidation
S1
S2
S3
S4
S5

34
in the wells could also account for some of the variation in results.
4.2.2 Effect of Oxidation on Healing
Results for the two tests measuring effectiveness varied over the synthesis conditions and time
periods. In all cases, the fresh capsules showed significant healing to the applied razor cuts. Tung oil from
ruptured capsules flowed into the cracks and sealed them. The capsules allowed to oxidize for one week
also showed strong signs of healing where cuts made were sealed to a similar degree. A before healing and
after healing image of a cut with new microcapsules is shown in Figure 18. Micrographs of before healing
and after healing for the rest of the synthesis conditions can be seen in Appendix B.
Figure 18. S5 fresh capsules after cut versus three days of healing.
When the test was repeated using these oxidized capsules, evidence of the cuts sealing with tung
oil was present. However, significant differences in healing potential was observed after the capsules were
exposed to air for three weeks. This is evident in the Figures 19, 20, and 21 below where the degree of
sealing is reduced with increasing oxidation. Degree of sealing is a qualitative measure regarding the
thickness of the cut after three days of healing.
Figure 19. S1 capsule healing. (a) Fresh capsules. (b) Capsules allowed to oxidize one week. (c) Capsules allowed to oxidize
A B C
1 mm 1 mm
1 mm 1 mm 1 mm

35
three weeks. Healing is fairly consistent across oxidation periods.
This reduction of healing is particularly notable in S2 and S3, which both showed almost no tung
oil sealing in the cracks after three days of healing. This result could be due to a lack of liquid tung oil
present in the microcapsules at the time of damage. A lack of tung oil in the capsules suggests that the tung
oil had diffused and oxidized prior to the capsules’ placement in the epoxy. Furthermore, many of these
three-week-old capsules embedded in the epoxy were not ruptured by the razor. Oxidized tung oil on the
surface of each capsule added thickness to the capsule walls, which helped keep the capsules sealed.
Figure 20. S2 capsule healing. (a) Fresh capsules. (b) Capsules allowed to oxidize one week. (c) Capsules allowed to oxidize
three weeks. Healing is significantly reduced after three-week oxidation periods.
Figure 21. S3 capsule healing. (a) Fresh capsules. (b) Capsules allowed to oxidize one week. (c) Capsules allowed to oxidize
three weeks. Healing is significantly reduced after three-week oxidation periods.
It is important to note that significant difficulty was encountered when creating samples for this
healing test. While fresh capsules evenly dispersed throughout the epoxy mix with no trouble, capsules
exposed for more than two weeks began to agglomerate. Evenly mixing the capsules into the epoxy became
more difficult, as evidenced by the significant clumps of microcapsules shown in the three-week
micrographs. The group tried several methods to separate the capsules, and eventually found some success
by breaking the capsules apart with a metal scoopula and glass stirring rod before mixing them into the
epoxy with a Thinky mixer. Capsules allowed to oxidize for two weeks were also tested; however, the
method that was used to separate clumps was not implemented and the resulting test could not be
A B C
A B C
1 mm 1 mm 1 mm
1 mm 1 mm 1 mm
36
considered. While further samples would assist in exploring the degradation of healing over time, the longer
the capsules were exposed to air, the more they fused together and the harder it became to separate them
properly. Micrographs of the other synthesis conditions as well as for the second week of healing can be
found in Appendix C.
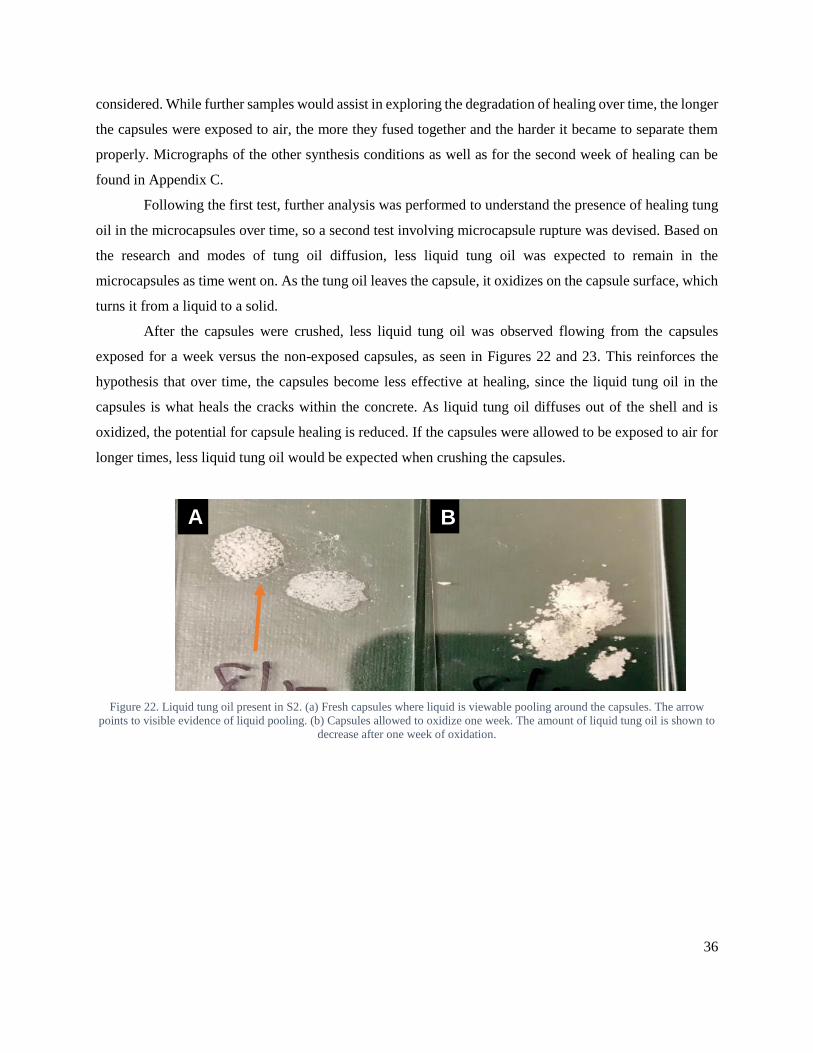
Following the first test, further analysis was performed to understand the presence of healing tung
oil in the microcapsules over time, so a second test involving microcapsule rupture was devised. Based on
the research and modes of tung oil diffusion, less liquid tung oil was expected to remain in the
microcapsules as time went on. As the tung oil leaves the capsule, it oxidizes on the capsule surface, which
turns it from a liquid to a solid.
After the capsules were crushed, less liquid tung oil was observed flowing from the capsules
exposed for a week versus the non-exposed capsules, as seen in Figures 22 and 23. This reinforces the
hypothesis that over time, the capsules become less effective at healing, since the liquid tung oil in the
capsules is what heals the cracks within the concrete. As liquid tung oil diffuses out of the shell and is
oxidized, the potential for capsule healing is reduced. If the capsules were allowed to be exposed to air for
longer times, less liquid tung oil would be expected when crushing the capsules.
Figure 22. Liquid tung oil present in S2. (a) Fresh capsules where liquid is viewable pooling around the capsules. The arrow
points to visible evidence of liquid pooling. (b) Capsules allowed to oxidize one week. The amount of liquid tung oil is shown to
decrease after one week of oxidation.
A B
37
Figure 23. Liquid tung oil present in S4. (a) Fresh capsules that have a pool of liquid surrounding them. The arrow shows the
extent to where the liquid pools. (b) Capsules allowed to oxidize one week. The amount of liquid tung oil is shown to decrease
after one week of oxidation.
One interesting exception to this result was S1. S1 showed an equal amount of liquid in the capsules
even after a week of exposure, and a replicated test confirmed this unexpected result.. This can be seen in
Figure 24. S1 capsules had wall thicknesses and diameters that were close to the middle for the five samples,
but were heat treated for longer than the other capsules. This extra heat treating may have helped keep the
oil contained for longer. Alternatively, the capsules from S1 may have had less oil to begin with. Thus, less
oil looks to have escaped the capsules since there was less inside them to begin with.
Figure 24. Liquid tung oil present in S1. (a) Fresh capsules. (b) Capsules allowed to oxidize one week. S1 was replicated because
the amount of liquid tung oil was equal in both cases. (c) Retest of fresh capsules. (d) Retest of capsules allowed to oxidize one
week.
While this rudimentary crush test was capable of providing some qualitative results for capsule
liquid retention, a better test should be used to quantitatively analyze the tung oil capsules. A differential
scanning calorimeter is suggested to quantify relative amounts of tung oil in the capsules. The tung oil
content could be monitored over time and compared to the diffusion rate.
4.3 Diffusion Model
To estimate the mass diffusivity, DAB, of tung oil in pUF a model for diffusivity of alcohol in
amorphous polystyrene was used. An alcohol/polystyrene system was chosen due its chemical similarity to
A B
A B C D

38
a tung oil/pUF system. The DAB value was interpolated from the data in for 25°C and for a molecule with
18 carbons, which is the majority of the composition of tung oil.[30] The resulting value of DAB was 3.9e-11
cm2/s. It is assumed that this approximate value for DAB will be within an order of magnitude of the actual
DAB value for tung oil in pUF. The value used for CA,s was assumed to be constant and equal to the molar
density of tung oil because of the infinite well assumption. The resulting value of CA,s was 0.0035 mol/cm3.
Using the estimated value of DAB, the one-term approximation, described in the methodology, was solved
over time with varying microcapsule thicknesses. Figure 25 shows the resulting curves for this diffusion
model for different capsule thicknesses.
Figure 25. This graph shows the theoretical resulting concentration over time at the outside surface of the microcapsule, CA(0,t),
at varying microcapsule thicknesses.
The diffusion rate decreased with increasing microcapsule shell thickness. The diffusion rates in
decreasing order, in terms of synthesis conditions, are S5 (0.8x EMA), S4 (1.5x uF), S3 (3.0 pH), S1 (5 hr),
and S2 (4.0 pH), with S2 having the lowest diffusion rate. The corresponding average shell thicknesses, in
the same order, are 18.9 µm (S5), 21.5 µm (S4), 23.1 µm (S3), 24.4 µm (S1), and 35.2 µm (S2). This
supported the theory that increasing shell thickness leads to a decreasing diffusion rate. The trends seen in
this diffusion model are similar to the trends seen in the colorimetric analysis results. Both the diffusion
and absorbance trends show an exponential increase over time that reaches an asymptote. This supports the
0
0.0005
0.001
0.0015
0.002
0.0025
0.003
0.0035
0.004
0 1 2 3 4 5 6 7 8 9 10
CA(0
,t)
(mo
l/cm
3)
Time (days)
S1 (5 hr) S2 (4.0 pH) S3 (3.0 pH) S4 (1.5x uF) S5 (0.8x EMA)
39
idea that diffusion and absorbance are directly correlated.
The theoretical model of the tung oil concentration on the surface of the capsule shows that tung
oil initially quickly diffuses out of the capsules, then the rate of diffusion plateaus within approximately
seven days of the capsules being exposed. The final concentration of tung oil on the surface based on the
models would be equal to the concentration of tung oil within the capsule. This is because an infinite well
of tung oil was assumed within the capsule; as time goes on, the system is going to try to reach equilibrium.
This equilibrium would be an equal concentration of tung oil on both sides of the capsule wall. If an infinite
well is not assumed, diffusion would halt when the outside concentration of tung oil reaches the interior
concentration.
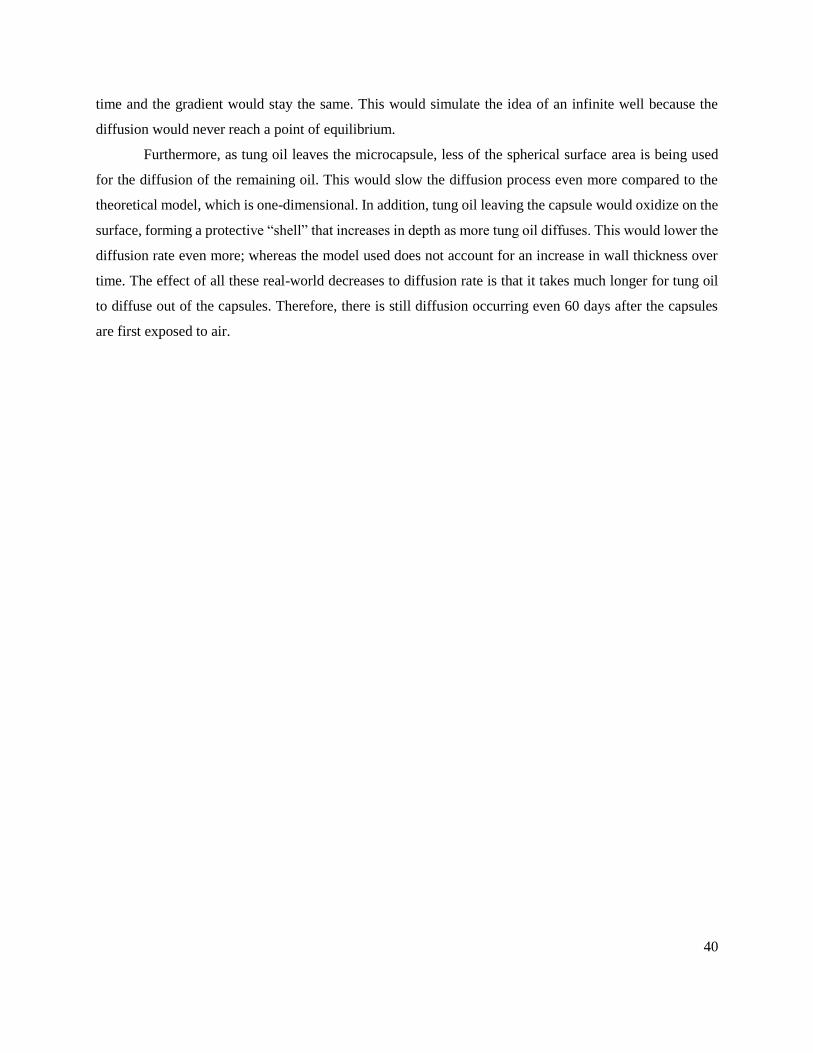
The five microcapsule thicknesses modeled are the corresponding thicknesses measured from SEM
images for each of the synthesis conditions used in this study. Figure 26, overleaf, shows an example of the
SEM photos used to determine shell thickness. Further SEM photos can be seen in Appendix E and a
summary of average diameter and shell thickness for each synthesis condition can be found in Table 2
above. All microcapsule dimensions can be found in Appendix F.
Figure 26. SEM image of S3 (3.0 pH) where a burst microcapsule allows for measurement of shell thickness.
It should be noted that the theoretical models predict that diffusion will halt after about a week of
exposed capsule time. However, the colorimetric data showed that the absorbance of yellow light continued
to increase, at a lower rate, for over 30 days. This would indicate that diffusion, then exterior oxidation, of
the tung oil occurred for significantly longer than the models predict.
As noted above, an infinite well was assumed, which is not the case with real capsules. Thus, in
realistic conditions, the rate of diffusion would decrease more rapidly; as tung oil leaves the capsule, there
is less driving force for the diffusion to occur. However, there is a possibility that as soon as the tung oil
diffuses out of the shell it oxidizes; therefore, the outer concentration of tung oil would not increase over
100 µm
40
time and the gradient would stay the same. This would simulate the idea of an infinite well because the
diffusion would never reach a point of equilibrium.
Furthermore, as tung oil leaves the microcapsule, less of the spherical surface area is being used
for the diffusion of the remaining oil. This would slow the diffusion process even more compared to the
theoretical model, which is one-dimensional. In addition, tung oil leaving the capsule would oxidize on the
surface, forming a protective “shell” that increases in depth as more tung oil diffuses. This would lower the
diffusion rate even more; whereas the model used does not account for an increase in wall thickness over
time. The effect of all these real-world decreases to diffusion rate is that it takes much longer for tung oil
to diffuse out of the capsules. Therefore, there is still diffusion occurring even 60 days after the capsules
are first exposed to air.
41
5.0 Conclusions It is important to work to improve the service life of structural concrete because it affects many
facets of every-day life. Structural concrete is a leading building material in the United States. In
construction zones alone there were 669 fatalities in 2014, which is equal to 1.8 work zone fatalities per
day. Work zone crashes totaled 2% of road-based fatalities nationally. If self-healing coated rebar was
widely implemented, then the need for concrete repairs would decrease as well as the related fatalities.[31]
Outside of safety concerns, the environment is heavily impacted by the production of new concrete.
Concrete is made of base ingredients of water, cement, coarse aggregate, and fine aggregate. Cement
production accounts for 7% of global atmospheric carbon dioxide loading. Furthermore, because the use of
concrete is widespread in the U.S., continual efforts are needed to maintain the supply. This drives
producers to collect materials in ways that are detrimental to the environment. For coarse and fine aggregate,
unsustainable mining practices contribute to both topsoil loss and deforestation.[32]
This project aimed to further research into the field of self-healing microcapsules. In particular, it
was discovered that exposing microcapsules for upwards of one week significantly reduced their healing
ability. However, thicker-walled capsules were more resistant to this aging effect. If these capsules were to
be widely implemented, synthesis conditions focus on providing a thicker shell should be used.
Furthermore, proper labeling and training should be implemented to ensure that exposure to air during
transportation and on-site storage is minimized.
Future research could explore alternate pilot-scale testing of self-healing coatings in structural
concrete. Parking stops incorporating tung oil-modified epoxy coated rebar could be exposed to a more
controlled corrosive environment, such as a salt-water bath. Additionally, further colorimetric analysis is
required to support the trends investigated in this study. Verifying these trends is important to further define
the effect of air exposure to microcapsule healing ability. A future study should synthesize fresh
microcapsules for experimentation purposes. Quantitative measures should be used to measure remaining
tung oil in the microcapsules over time, such as differential scanning calorimetry.

42
Appendix A: Synthesis Conditions S1: 5 hours heat
● 200 ml DI water
● 25 ml EMA
● 0.5063 g resorcinol
● 0.5038 g ammonium chloride
● 5.0142 g urea
● Initial pH of 2.08, adjusted to 3.50 with 1.5mL NaOH
● 50 ml tung oil
● 13.0087g formaldehyde
● Heat set at 60°C for 5 hours
S2: 4.0 pH
● 200 ml DI water
● 25 ml EMA
● 0.5052g resorcinol
● 0.05012g ammonium chloride
● 5.0166g urea
● Initial pH 2.01, adjusted to 4.00 with 1.9 mL NaOH
● 50 mL tung oil
● 13.0554 g formaldehyde
● Heat set at 60°C for 4 hours
S3: 3.0 pH
● 200mL DI
● 25 ml EMA
● 0.5077g resorcinol
● 0.5049g ammonium chloride
● 5.0186g urea
● Initial pH 2.28, adjusted to 3.00 with 0.112 ml NaOH
● 50 mL tung oil
● 13.0465g formaldehyde
● Heat set at 60°C for 4 hours
S4: 1.5x uF
● 200 ml DI water
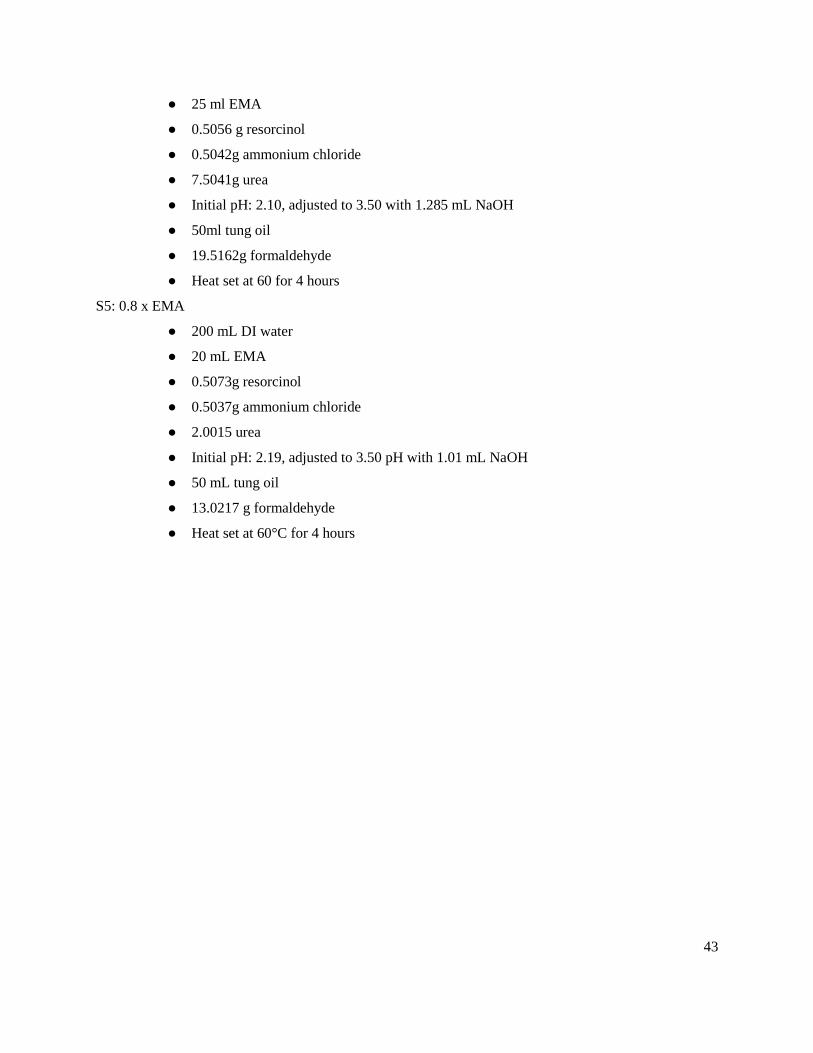
43
● 25 ml EMA
● 0.5056 g resorcinol
● 0.5042g ammonium chloride
● 7.5041g urea
● Initial pH: 2.10, adjusted to 3.50 with 1.285 mL NaOH
● 50ml tung oil
● 19.5162g formaldehyde
● Heat set at 60 for 4 hours
S5: 0.8 x EMA
● 200 mL DI water
● 20 mL EMA
● 0.5073g resorcinol
● 0.5037g ammonium chloride
● 2.0015 urea
● Initial pH: 2.19, adjusted to 3.50 pH with 1.01 mL NaOH
● 50 mL tung oil
● 13.0217 g formaldehyde
● Heat set at 60°C for 4 hours
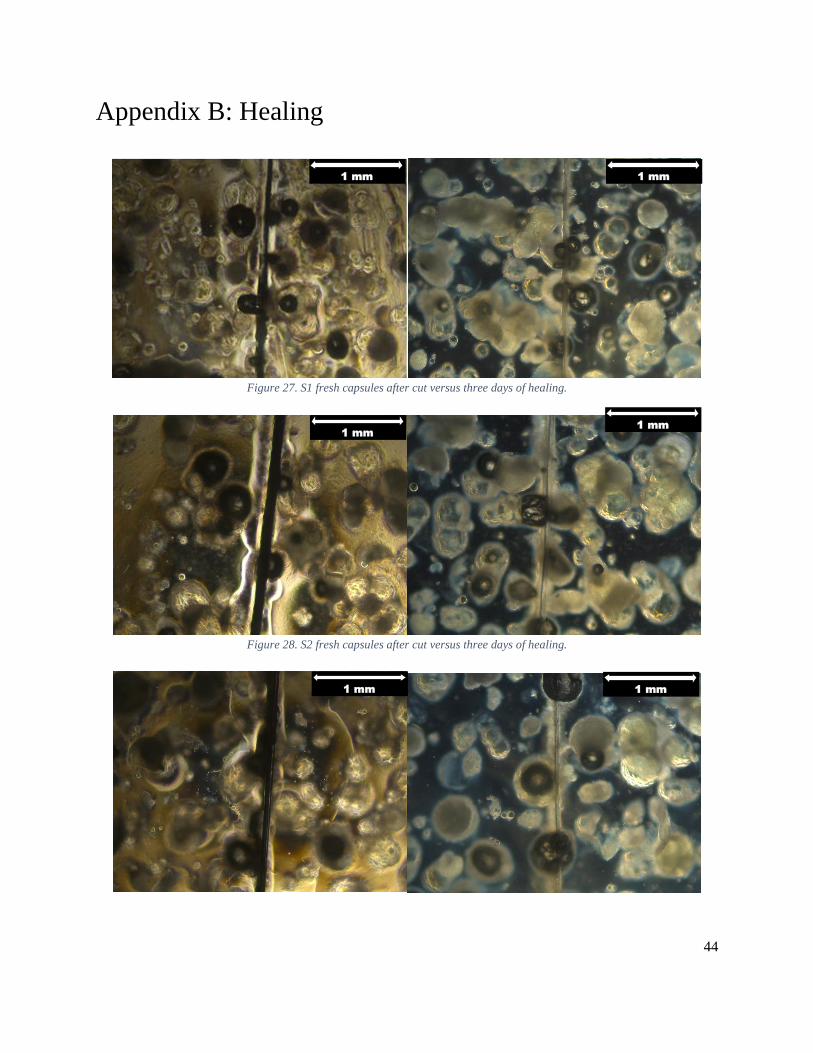
44
Appendix B: Healing
Figure 27. S1 fresh capsules after cut versus three days of healing.
Figure 28. S2 fresh capsules after cut versus three days of healing.
1 mm 1 mm
1 mm 1 mm
1 mm 1 mm
1 mm 1 mm
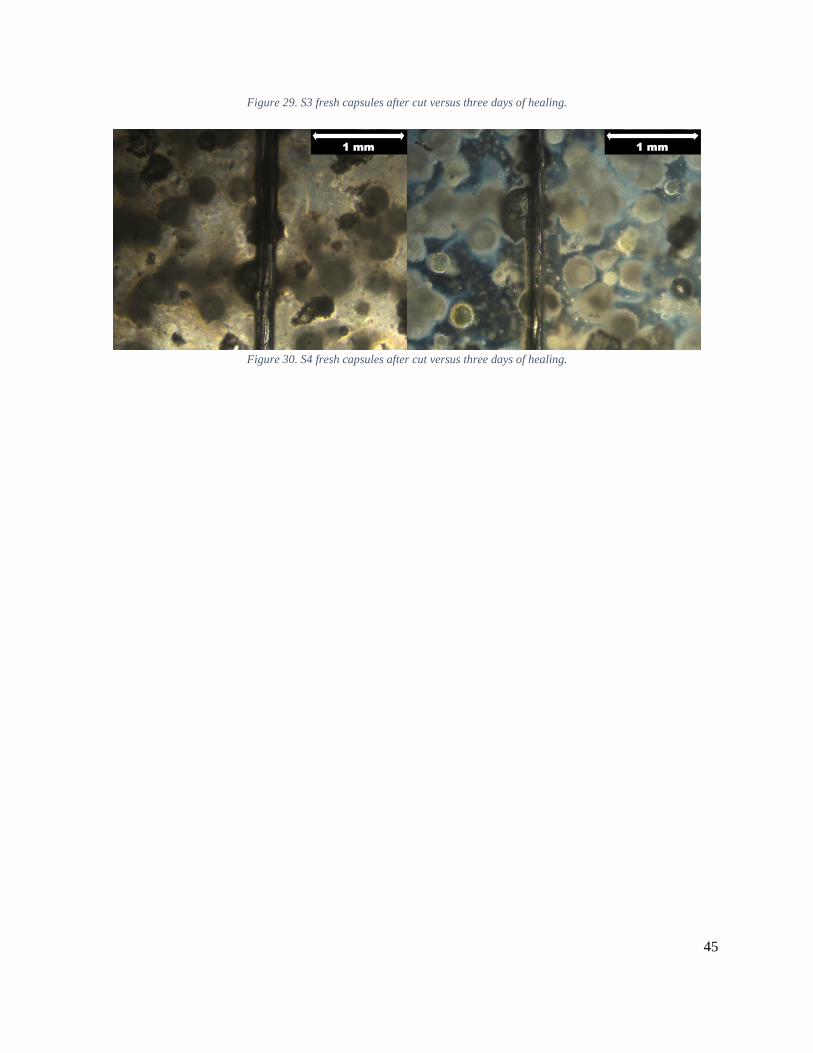
45
Figure 29. S3 fresh capsules after cut versus three days of healing.
Figure 30. S4 fresh capsules after cut versus three days of healing.
1 mm 1 mm

46
Appendix C: Microcapsule Healing over Time
Figure 31. S4 capsule healing. (a) Fresh capsules. (b) Capsules allowed to oxidize one week. (c) Capsules allowed to oxidize
three weeks.
A B C 1 mm 1 mm 1 mm

47
Appendix D: Microcapsule Rupture Test
Figure 32. Liquid tung oil present in S3. (a) Fresh capsules that have a pool of liquid surrounding them. (b) Capsules allowed to
oxidize one week.
Figure 33. Liquid tung oil present in S5. (a) Fresh capsules that have a pool of liquid surrounding them. (a) Capsules allowed to
oxidize one week.
A
A
B
B

48
Appendix E: SEM Images of Synthesis Conditions
Figure 34. SEM images of S1 capsules.
Figure 35. SEM images of S2 capsules.
Figure 36. SEM images of S3 capsules.
Figure 37. SEM images of S4 capsules.
100 µm 100 µm 100 µm
100 µm 100 µm 100 µm
100 µm 100 µm 100 µm
100 µm 100 µm 100 µm

49
Figure 38. SEM images of S5 capsules.
100 µm 100 µm 100 µm
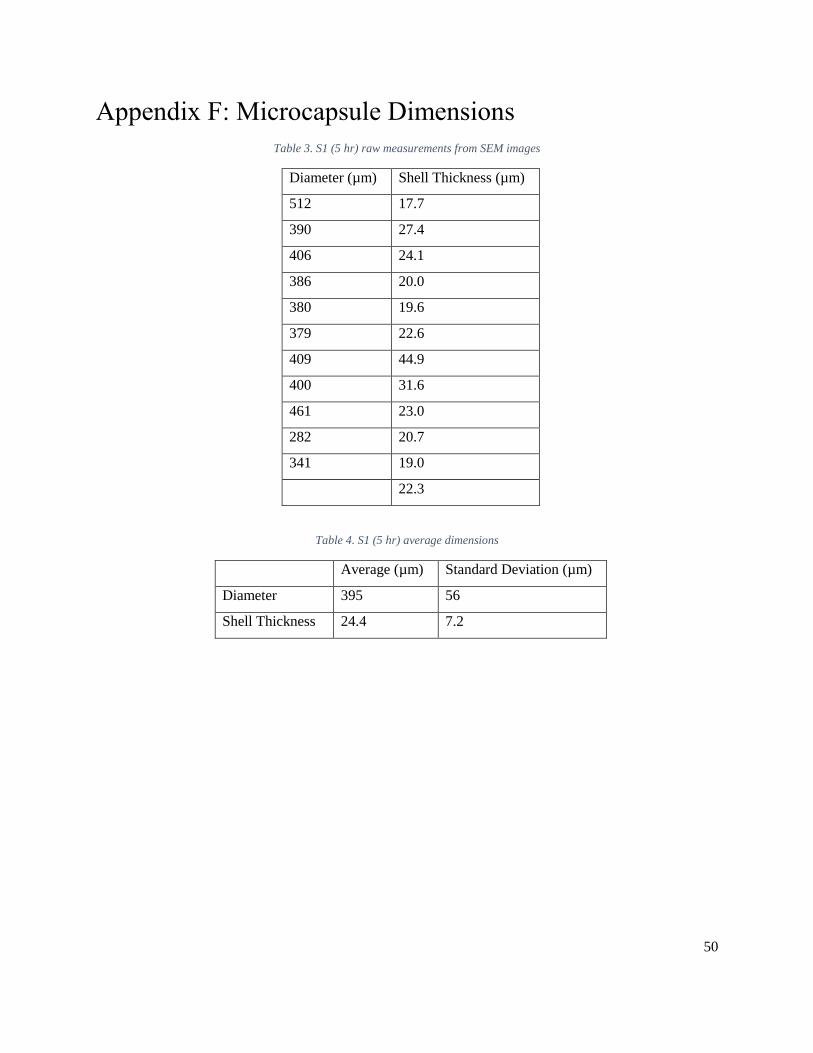
50
Appendix F: Microcapsule Dimensions
Table 3. S1 (5 hr) raw measurements from SEM images
Diameter (µm) Shell Thickness (µm)
512 17.7
390 27.4
406 24.1
386 20.0
380 19.6
379 22.6
409 44.9
400 31.6
461 23.0
282 20.7
341 19.0
22.3
Table 4. S1 (5 hr) average dimensions
Average (µm) Standard Deviation (µm)
Diameter 395 56
Shell Thickness 24.4 7.2

51
Table 5. S2 (4.0 pH) raw measurements from SEM images
Diameter (µm) Shell Thickness (µm)
356 28.3
347 34.2
482 32
503 42.8
496 41.7
416 40
262 37.2
375 26.2
477 42.7
28.5
33.7
Table 6. S2 (4.0 pH) average dimensions
Average (µm) Standard Deviation (µm)
Diameter 413 79
Shell Thickness 35.2 5.8

52
Table 7. S3 (3.0 pH) raw measurements from SEM images
Diameter (µm) Shell Thickness (µm)
512 19.3
511 17.7
323 27.8
540 18.5
483 20.7
338 20.9
560 17.7
462 25.5
367 28.7
559 27.4
30
24.3
22.3
Table 8. S3 (3.0 pH) average dimensions
Average (µm) Standard Deviation (µm)
Diameter 466 86
Shell Thickness 23.1 4.2
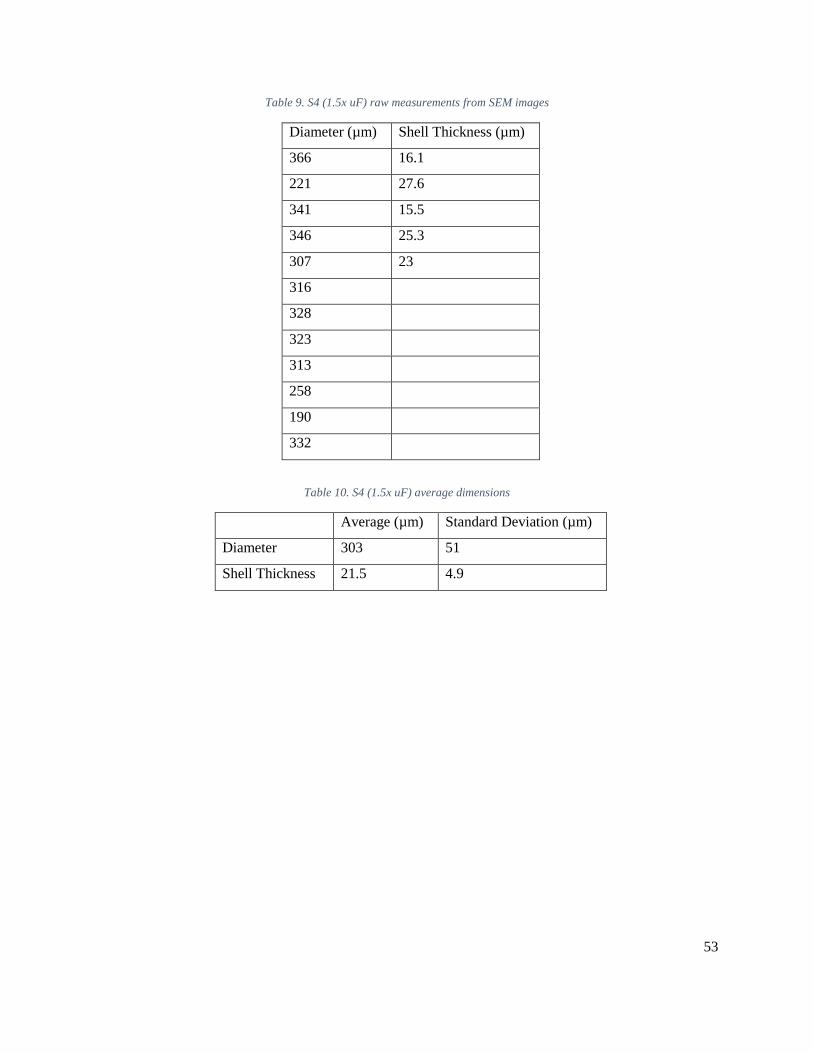
53
Table 9. S4 (1.5x uF) raw measurements from SEM images
Diameter (µm) Shell Thickness (µm)
366 16.1
221 27.6
341 15.5
346 25.3
307 23
316
328
323
313
258
190
332
Table 10. S4 (1.5x uF) average dimensions
Average (µm) Standard Deviation (µm)
Diameter 303 51
Shell Thickness 21.5 4.9
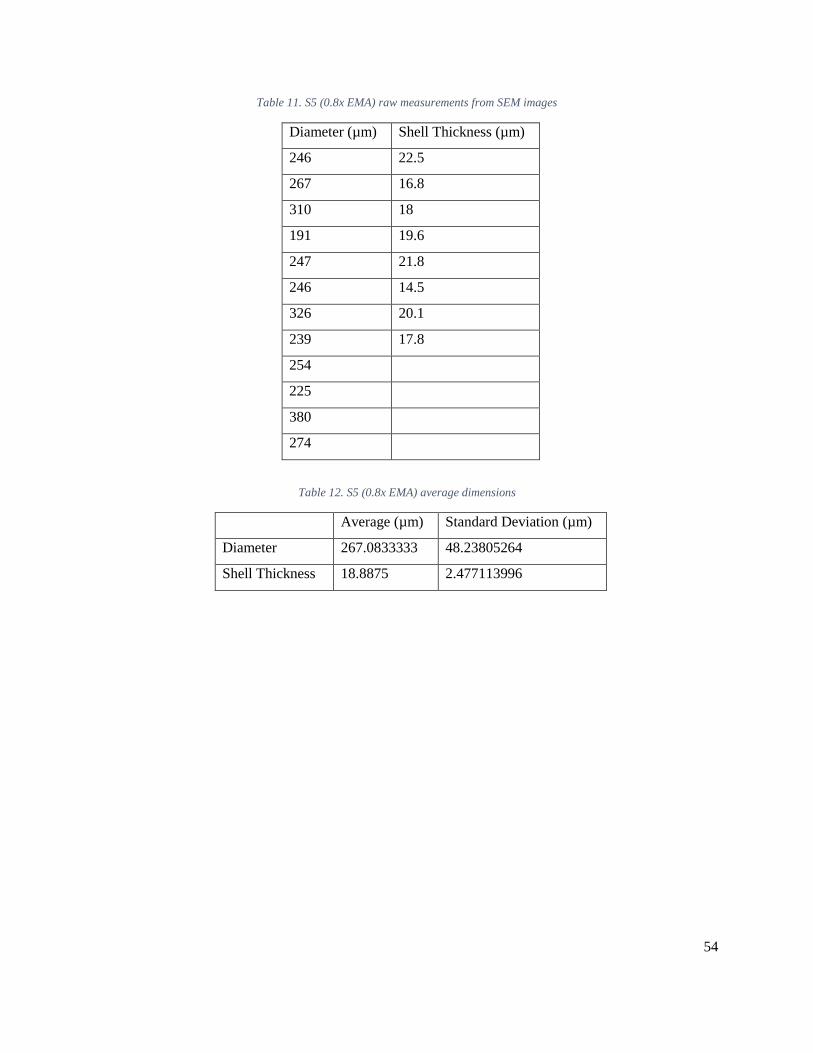
54
Table 11. S5 (0.8x EMA) raw measurements from SEM images
Diameter (µm) Shell Thickness (µm)
246 22.5
267 16.8
310 18
191 19.6
247 21.8
246 14.5
326 20.1
239 17.8
254
225
380
274
Table 12. S5 (0.8x EMA) average dimensions
Average (µm) Standard Deviation (µm)
Diameter 267.0833333 48.23805264
Shell Thickness 18.8875 2.477113996

55
Civil Engineering Design Statement
This project was a combination of civil and chemical engineering. There were two major
deliverables created by the team. First, a team-designed self-healing microcapsule coating was applied to
rebar encased in team-designed concrete parking stops that were tested alongside regular epoxy coating
parking stops in the severe freeze/thaw environment of Worcester, MA. There were qualitative tests
performed on the microcapsule coatings to determine the effectiveness of the self-healing coatings. The
primary testing was damaging the rebar using a machine that produced consistent damage across all
samples. One parking stop was broken open at the end of the project phase to be observed and collect
qualitative results while the rest of the stops were left to be looked at in three years by another team.
The team had to design and assemble parking stop molds that would allow for the creation of six
reinforced concrete parking stops. This required research of parking stop dimensions and consideration for
the general safety laws and placement of parking stops. The molds were completely team designed,
including spacers and handholds. Through communication with WPI Facilities personnel, the team was
able to secure placement of the six stops in the ZipCar spaces at Gateway. The team followed the ASTM
standards for concrete mix design.
The six parking stops were designed as four “experimental” and two “control” stops. The difference
is the epoxy coating on the rebar encased within the concrete. The control stops contained rebar with a
regular epoxy coating, and the experimental stops had a 10 weight % microcapsule coating. The
microcapsules were tested to correlate the oxidized coloration to the self-healing ability of the
microcapsules. Five different microcapsule samples were exposed to oxygen over a constant period of time,
and five of the same types were kept at a consistent oxygen environment. Microscopy was performed on
both sets for six trials to produce both quantitative and qualitative results.
Through these two deliverables, qualitative and quantitative results were produced regarding the
effect of time on the self-healing capability of microcapsules and the applied results for a practical use for
the experimental epoxy coating in parking stops.
56
Professional Licensure Statement
In the field of civil engineering, there are three steps to obtain professional licensure. The first step
is to pass the Fundamentals of Engineering (FE) exam. There is an FE exam for a variety of engineering
disciplines but, in particular, the exam for civil engineers covers: mathematics, probability and statistics,
computational tools, ethics and professional practice, engineering economics, statics, dynamics, mechanics
of materials, materials, fluid mechanics, hydraulics and hydrologic systems, structural design, geotechnical
engineering, transportation engineering, environmental engineering, construction, and surveying. Once an
individual has passed, that person serves as an Engineer-in-Training for four years under the tutelage of a
professional engineer.
After the four years, the individual can take the Principles and Practice of Engineering (PE) exam.
The PE exam is offered in each state, and once passed, that individual will be licensed to practice as a PE
in that particular state. This exam is specific to certain civil disciplines that include: construction,
geotechnical, structural, transportation, and water resources and environmental.
It is beneficial to obtain a PE license for the general public, the individual, and the profession of
civil engineering. The title of PE is a reassurance to the general public that is affected by that individual's
work as it guarantees that engineer has the necessary background and education to safely execute that work.
The PE title also commends the individual who has earned it as the title demonstrates the individual’s
passion and their willingness to invest their time to the profession of civil engineering. The addition of a
PE to the field of civil engineering also helps the profession to grow and encourage the industry standards
and practices emphasized in the FE and PE exam.
57
References
[1] Koch, G.; Brongers, M. “Corrosion Costs and Preventive Strategies in the United States. NACE
International.” 2009. Available: http://www.wpi.edu/academics/library/ Accessed: Sep. 26, 2016.
[2] Chen, Yixi, et al. "Self-Healing Coatings for Steel-Reinforced Infrastructure," WPI, 2015. Accessed:
Sep. 26, 2016.
[3] D. Bentz, E. Garboczi, Y. Lu, N. Martys, A. Sakulich, and J. Weiss, "Modeling of the Influence of
Transverse Cracking on Chloride Penetration into Concrete," Cement and Concrete Composites, vol. 38,
pp. 65–74, Apr. 2013.
[4] "Concrete Mix Design Basics," in Concrete Network. [Online]. Available:
http://www.concretenetwork.com/concrete-mix-design/basics.html. Accessed: Feb. 26, 2017.
[5] S. H. Kosmatka, B. Kerkhoff, W. C. Panarese, and D. B. Whitney, Design and control of concrete
mixtures (engineering bulletin (Skokie, ill.).), 14th ed. United States: Portland Cement Association, 2002.
[6] K. Walker, Steel Times International, no. 38, pp. 21–23, Jul. 2014.
[7] B. State, "Reinforced concrete," in Cement.org. [Online]. Available: http://www.cement.org/concrete-
basics/buildings-structures/design-aids/reinforced-concrete. Accessed: Oct. 1, 2016.
[8] C. Maki, "Q&A About Galvanized Reinforcing Steel," in Concrete Construction, 2012. [Online].
Available: http://www.concreteconstruction.net/how-to/materials/q-a-about-galvanized-reinforcing-
steel_o. Accessed: Jan. 22, 2017.
[9] "GFRP vs Black Steel," in TUF-BAR.com. [Online]. Available: http://www.tuf-
bar.com/application/gfrp-vs-steel/gfrp-vs-black-steel/. Accessed: Jan. 23, 2017.
[10] M. M. masonrymagazine, "MASONRY," Masonry Magazine, 2016. [Online]. Available:
http://www.masonrymagazine.com/. Accessed: Feb. 28, 2017.
[11] H. Hirao, K. Yamada, H. Takahashi, and H. Zibara, "Chloride Binding of Cement Estimated by
Binding Isotherms of Hydrates," Journal of Advanced Concrete Technology, pp. 77–84, 2005.
[12] A. Griffith and M. Laylor, "State Research Project #527: Epoxy Coated Reinforcement Study," in
Oregon Department of Transportation, 1999. [Online]. Available: https://ntl.bts.gov/data/epoxy.pdf.
Accessed: Feb. 26, 2017.
[13] K. Clear and A. Sohanghpurwala, "Effectiveness of Epoxy Coatings in Minimizing Corrosion of
Reinforcing Steel in Concrete," Transportation Research Record, vol. 1268, 1990.
[14] A. Makhlouf, Handbook of Smart Coatings for Materials Protection. 2014.
[15] M. Carpenter and R. Loucks. "Self-Healing Coatings for Steel-Reinforced Infrastructure," WPI,
2016. Accessed: Sep. 28, 2016.

58
[16] M. Samadzadeh, S. Boura, M. Peikari, S. Kasiriha, and A. Ashrafi, "A Review on Self-Healing
Coatings Based on Micro/nanocapsules," Progress in Organic Coatings, vol. 68, no. 3, pp. 159–164, Jul.
2010.
[17] S. Russell, "Linseed and Tung Oil,". [Online]. Available:
http://prorestorers.org/notes/LinseedTungOil.htm. Accessed: Oct. 11, 2016.
[18] M. Samadzadeh, S. Boura, M. Peikari, A. Ashrafi, and M. Kasiriha, "Tung oil: An Autonomous
Repairing Agent for Self-Healing Epoxy Coatings," Progress in Organic Coatings, vol. 70, no. 4, pp.
383–387, Apr. 2011.
[19] "Minor Oil Crops - Individual Monographs," in FAO.org. [Online]. Available:
http://www.fao.org/docrep/X5043E/x5043E0e.htm. Accessed: Oct. 11, 2016.
[20] The Editors of Encyclopædia Britannica, "Brownian Motion | Physics," in Encyclopædia Britannica,
Encyclopædia Britannica, 2015. [Online]. Available: https://www.britannica.com/science/Brownian-
motion. Accessed: Feb. 27, 2017.
[21] The Editors of Encyclopædia Britannica, "Diffusion | Physics," in Encyclopædia Britannica,
Encyclopædia Britannica, 2009. [Online]. Available: https://www.britannica.com/science/diffusion.
Accessed: Feb. 27, 2017.
[22] The Editors of Encyclopædia Britannica, "Principles of Physical Science - Concepts Fundamental to
the Attitudes and Methods of Physical Science," in Encyclopædia Britannica, Encyclopædia Britannica,
2017. [Online]. Available: https://www.britannica.com/science/principles-of-physical-science/Concepts-
fundamental-to-the-attitudes-and-methods-of-physical-science#ref366360. Accessed: Feb. 27, 2017.
[23] The Editors of Encyclopædia Britannica, "Mechanics of Solids - Basic Principles | Physics," in
Encyclopædia Britannica, Encyclopædia Britannica, 2006. [Online]. Available:
https://www.britannica.com/science/mechanics-of-solids/Basic-principles#ref611597. Accessed: Feb. 27,
2017.
[24] The Editors of Encyclopædia Britannica, "Liquid - Solutions and Solubilities | State of Matter," in
Encyclopædia Britannica, Encyclopædia Britannica, 2012. [Online]. Available:
https://www.britannica.com/science/liquid-state-of-matter/Solutions-and-solubilities#ref506864.
Accessed: Feb. 27, 2017.
[25] M. Short, "Wheelstop (Parking Block) Safety - Expert Article on Parking Lot Safety," in Robson
Forensic, 2015. [Online]. Available: http://www.robsonforensic.com/articles/wheelstop-parking-block-
safety-expert-article-on-parking-lot-safety. Accessed: Sep. 10, 2016.
[26] "Parking Bumpers," in Commercial Concrete Products. [Online]. Available:
http://www.commercialconcreteproducts.com/parking-bumpers. Accessed: Oct. 13, 2016.
59
[27] "Parking Curbs/Bumpers," in Century Group. [Online]. Available:
http://www.centurygrp.com/Products/Concrete-Steps/Parking-CurbsBumpers. Accessed: Oct. 1, 2016.
[28] Carpenter, Matthew, et al. "Self-Healing Coatings for Steel-Reinforced Infrastructure," WPI, 2016.
Accessed: Sep. 29, 2016.
[29] T. L. Bergman, F. P. Incropera, D. P. DeWitt, and A. S. Lavine, Fundamentals of heat and mass
transfer, 7th ed. Oxford, United Kingdom: Wiley, John & Sons, 2011.
[30] G. Bernardo, "Diffusivity of alcohols in amorphous polystyrene," Journal of Applied Polymer
Science, vol. 127, no. 3, pp. 1803–1811, May 2012.
[31] "Work zone safety - FHWA facts and statistics - FHWA work zone," in Federal Highway
Administration, 2014. [Online]. Available: https://ops.fhwa.dot.gov/wz/resources/facts_stats/safety.htm.
Accessed: Mar. 2, 2017.
[32] P. Kumar Mehta, "Reducing the Environmental Impact of Concrete," in Concrete International, 2001.
[Online]. Available: http://maquinamole.net/EcoSmartconcrete.com/docs/trmehta01.pdf. Accessed: Mar.
2, 2017.