pinal county housing needs assessment and conclusions public...... household and housing unit...
TRANSCRIPT
PINAL COUNTY HOUSING NEEDS
ASSESSMENT MAY 2008
Prepared for:
Pinal County Department of Health and Human Services PO Box 868
Florence, AZ 85232
Prepared by:
Martina Kuehl
Kuehl Enterprises LLC
PO Box 642
Humboldt, AZ 86329
928-899-4339

Pinal County Housing Needs Assessment – March 2008 Final Draft
Kuehl Enterprises LLC PO Box 642 Humboldt, AZ 86329 928-899-4339 Page i
TABLE OF CONTENTS
INTRODUCTION.......................................................................................................................................................................................................................................... 1 PURPOSE AND PROCESS..................................................................................................................................................................................................... 1 DATA................................................................................................................................................................................................................................. 2
DEMOGRAPHICS........................................................................................................................................................................................................................................ 3 POPULATION TRENDS ......................................................................................................................................................................................................... 3 HOUSEHOLD SIZE............................................................................................................................................................................................................... 5 POPULATION PROJECTIONS................................................................................................................................................................................................. 5 AGE OF HOUSEHOLDER ...................................................................................................................................................................................................... 9 FAMILY TYPE ................................................................................................................................................................................................................... 10
ECONOMICS ............................................................................................................................................................................................................................................. 13 INDUSTRIES, OCCUPATIONS AND HOUSING AFFORDABILITY ................................................................................................................................................. 14 PLACE OF WORK AND TRAVEL TIME TO WORK .................................................................................................................................................................... 14 INCOME TRENDS AND MEDIAN INCOME............................................................................................................................................................................... 18 CONCLUSIONS – DEMOGRAPHICS AND ECONOMICS ............................................................................................................................................................ 21
HOUSING .................................................................................................................................................................................................................................................. 23 HOUSING VARIETY............................................................................................................................................................................................................ 23
Housing units added 2000 – 2006 .............................................................................................................................................................................. 23 Type of Structure and Tenure ..................................................................................................................................................................................... 27
OCCUPANCY AND VACANCY .............................................................................................................................................................................................. 28 TENURE........................................................................................................................................................................................................................... 31
Tenure, Income and Family Type ............................................................................................................................................................................... 32 HOUSING QUALITY - AGE OF THE HOUSING STOCK ............................................................................................................................................................. 36
Renters and Age of the Housing Stock ........................................................................................................................................................................ 38 HOUSING AFFORDABILITY ................................................................................................................................................................................................. 40 HOMEOWNERSHIP AFFORDABILITY..................................................................................................................................................................................... 41
Values and Sales Prices ............................................................................................................................................................................................. 41 Sales and Sales Price Trends ..................................................................................................................................................................................... 43 New Housing Production ........................................................................................................................................................................................... 46 Cost Burdened Owners............................................................................................................................................................................................... 47 National Economic Indicators.................................................................................................................................................................................... 48 Median Income and Affordability ............................................................................................................................................................................... 50

Pinal County Housing Needs Assessment – March 2008 Final Draft
Kuehl Enterprises LLC PO Box 642 Humboldt, AZ 86329 928-899-4339 Page ii
HOME PURCHASE AFFORDABILITY ANALYSIS ...................................................................................................................................................................... 52 Financing Types and Interest Rates ........................................................................................................................................................................... 53 The Subprime Market ................................................................................................................................................................................................. 55 Delinquency and Foreclosure .................................................................................................................................................................................... 56
RENTAL AFFORDABILITY.................................................................................................................................................................................................... 60 Trends in Monthly Rent .............................................................................................................................................................................................. 60 Trends in Rental Affordability 1990 - 2000 ................................................................................................................................................................ 60 Trends in Rental Affordability 1990 - 2000 ................................................................................................................................................................ 61
RENTAL AFFORDABILITY ANALYSIS PINAL COUNTY 2006 ..................................................................................................................................................... 62 Cost Burdened Renters by Income Level .................................................................................................................................................................... 62
Assistance to Low Income Renters ............................................................................................................................................................................................... 63 Estimated Rental Units Needed by Income Category.................................................................................................................................................. 64 Investors and Flippers................................................................................................................................................................................................ 65 Apartment Rental Survey............................................................................................................................................................................................ 66 Subsidized Apartment Units ....................................................................................................................................................................................... 67
WORKFORCE HOUSING ..................................................................................................................................................................................................... 68 BARRIERS TO AFFORDABLE HOUSING DEVELOPMENT ..................................................................................................................................................................... 71
RESOURCES AND DELIVERY SYSTEM .................................................................................................................................................................................................. 77 THE PRIVATE SECTOR ...................................................................................................................................................................................................... 77 THE NONPROFIT SECTOR.................................................................................................................................................................................................. 78 FEDERAL AND STATE GOVERNMENT.................................................................................................................................................................................. 78 COUNTY AND LOCAL GOVERNMENT ................................................................................................................................................................................... 81
HOUSING NEEDS AND THE HOUSING MARKET CONCLUSIONS ......................................................................................................................................................... 83 HOUSING VARIETY............................................................................................................................................................................................................ 83 HOUSING QUALITY............................................................................................................................................................................................................ 83 HOMEOWNERSHIP AND HOME PURCHASE AFFORDABILITY ................................................................................................................................................... 84 RENTALS, RENTAL AFFORDABILITY AND RENTAL UNITS NEEDED.......................................................................................................................................... 84 OTHER MARKET FACTORS ................................................................................................................................................................................................ 85 THE DELIVERY SYSTEM AND REGULATORY BARRIERS ......................................................................................................................................................... 86
OVERVIEW AND CONDITIONS BY JURISDICTION ................................................................................................................................................................................. 87 PINAL COUNTY AND UNINCORPORATED AREAS ................................................................................................................................................................... 87
Arizona City ............................................................................................................................................................................................................... 87 Oracle ........................................................................................................................................................................................................................ 87
Pinal County Housing Needs Assessment – March 2008 Final Draft
Kuehl Enterprises LLC PO Box 642 Humboldt, AZ 86329 928-899-4339 Page iii
San Manuel ................................................................................................................................................................................................................ 88 Unincorporated Pinal County .................................................................................................................................................................................... 88
APACHE JUNCTION ........................................................................................................................................................................................................... 90 CASA GRANDE ................................................................................................................................................................................................................. 92 COOLIDGE ....................................................................................................................................................................................................................... 94 ELOY............................................................................................................................................................................................................................... 97 FLORENCE ....................................................................................................................................................................................................................... 99 KEARNY......................................................................................................................................................................................................................... 101 MAMMOTH ..................................................................................................................................................................................................................... 102 MARICOPA ..................................................................................................................................................................................................................... 103 QUEEN CREEK ............................................................................................................................................................................................................... 105 SUPERIOR...................................................................................................................................................................................................................... 107
POLICY AND STRATEGY MENU ................................................................................................................................................................................................................ 1 HOW TO USE THE MENU ..................................................................................................................................................................................................... 1
2007 PUBLIC INPUT MEETING SUMMARY................................................................................................................................................................................................ 1 MEETING STRUCTURE......................................................................................................................................................................................................... 1 SAN MANUEL ..................................................................................................................................................................................................................... 2 APACHE JUNCTION ............................................................................................................................................................................................................. 6 CASA GRANDE ................................................................................................................................................................................................................. 10
2008 PUBLIC INPUT MEETING SUMMARY................................................................................................................................................................................................ 2

Pinal County Housing Needs Assessment – March 2008 Final Draft
Kuehl Enterprises LLC PO Box 642 Humboldt, AZ 86329 928-899-4339 Page iv
TABLE OF TABLES
TABLE 1 - POPULATION AND NUMBER OF HOUSEHOLDS TRENDS BY JURISDICTION 1990 - 2006.................................................................................................... 4
TABLE 2 - AVERAGE NUMBER OF PERSONS PER HOUSEHOLD 2000 ................................................................................................................................................... 5
TABLE 3 - POPULATION, HOUSEHOLD AND HOUSING UNIT PROJECTIONS 2010 – SLOW, MODERATE, AGGRESSIVE GROWTH SCENARIO ................................ 7
TABLE 4 - POPULATION, HOUSEHOLD AND HOUSING UNIT PROJECTIONS 2020 – SLOW, MODERATE, AGGRESSIVE GROWTH SCENARIO ................................ 8
TABLE 5 - AGE OF HOUSEHOLDER BY JURISDICTION AND GEOGRAPHIC AREA 2000...................................................................................................................... 11
TABLE 6 - FAMILY TYPE BY JURISDICTION AND GEOGRAPHIC AREA 2000........................................................................................................................................ 12
TABLE 7 - EMPLOYMENT STATUS BY AGE BY JURISDICTION 2000..................................................................................................................................................... 16
TABLE 8 - PLACE OF WORK AND TRAVEL TIME TO WORK 2000 .......................................................................................................................................................... 17
TABLE 9 - MEDIAN HOUSEHOLD INCOME TRENDS AND PROJECTIONS BY JURISDICTION 1990 - 2020 .......................................................................................... 19
TABLE 10 - MEDIAN NON-FAMILY HOUSEHOLD INCOME TRENDS AND PROJECTIONS BY JURISDICTION 1990 - 2020 .................................................................. 20
TRENDS IN HOUSING VARIETY BY JURISDICTION - 2000 TO 2006 ...................................................................................................................................................... 24
TABLE 11 - HOUSING VARIETY (TYPE OF STRUCTURE AND UNITS IN STRUCTURE) BY JURISDICTION 2006................................................................................. 25
TABLE 12 - TRENDS IN HOUSING VARIETY BY JURISDICTION 2000 - 2006 ......................................................................................................................................... 26
TABLE 13 - OCCUPANCY, TENURE AND VACANCY FOR ALL UNITS BY JURISDICTION 2000 ............................................................................................................ 29
TABLE 14 - RENTER OCCUPIED UNITS BY UNITS IN STRUCTURE BY JURISDICTION 2000 ............................................................................................................... 30
TABLE 15 - OWNERSHIP STATUS BY AGE OF HOUSEHOLDER BY JURISDICTION 2000 .................................................................................................................... 34
TABLE 16 - HOMEOWNERSHIP BY FAMILY TYPE BY JURISDICTION 2000........................................................................................................................................... 35
TABLE 17 - AGE OF THE HOUSING STOCK BY JURISDICTION 2006 .................................................................................................................................................... 37
TABLE 18 - REGISTERED SINGLE FAMILY AND MULTI-PLEX RENTAL STRUCTURES BY YEAR BUILT PINAL COUNTY ................................................................... 39

Pinal County Housing Needs Assessment – March 2008 Final Draft
Kuehl Enterprises LLC PO Box 642 Humboldt, AZ 86329 928-899-4339 Page v
TABLE 19 - MEDIAN VALUE AND MEDIAN PRICE ASKED BY JURISDICTION 2000............................................................................................................................... 41
TABLE 20 - HOUSING VALUES BY VALUE RANGE – SELECTED SINGLE FAMILY UNITS 2000 BY JURISDICTION............................................................................. 42
TABLE 21 - UNITS BY PRICE RANGE – SAMPLING OF FOR SALE HOUSING UNITS SEPTEMBER 2007 BY GEOGRAPHIC AREA .................................................... 44
TABLE 22 - MEDIAN RESALE AND NEW CONSTRUCTION PRICES AND VOLUME BY PROPERTY ADDRESS BY SELECTED MARKET AREA- 4TH QUARTER 2006 46
TABLE 23 - PERMITS ISSUED PINAL COUNTY 2000 - 2007.................................................................................................................................................................... 47
TABLE 24 - TRENDS IN MORTGAGE STATUS AND OWNER COST BURDEN PINAL COUNTY 1990 - 2006.......................................................................................... 48
TABLE 25 - HOMEOWNERSHIP AFFORDABILITY BY JURISDICTION – 2000......................................................................................................................................... 51
TABLE 26 - HOMEOWNERSHIP AFFORDABILITY BY PROPERTY ADDRESS - 2006 ............................................................................................................................. 51
TABLE 27 - HOME PURCHASE AFFORDABILITY 2006 – PINAL COUNTY .............................................................................................................................................. 52
TABLE 28 - CONVENTIONAL HOME PURCHASE AND REFINANCING LOANS BY SUBPRIME LENDERS BY PROPERTY ADDRESS 2000 – 2004............................. 58
TABLE 29 - ESTIMATED IMPACT OF SUBPRIME FORECLOSURES....................................................................................................................................................... 59
TABLE 30 - TRENDS IN MONTHLY GROSS RENT AND INCOME REQUIRED TO AFFORD THE MEDIAN RENT BY JURISDICTION 1990 TO 2000 ............................ 61
TABLE 31 - TRENDS IN RENTAL AFFORDABILITY PINAL COUNTY – 2000 TO 2006............................................................................................................................. 62
TABLE 32 - TRENDS IN PERCENTAGE OF RENTERS COST BURDENED BY INCOME LEVEL PINAL COUNTY 1990 - 2006 ............................................................... 63
TABLE 33 - ESTIMATED RENTAL UNITS NEEDED BY INCOME CATEGORY 2010 AND 2020 – PINAL COUNTY................................................................................. 64
TABLE 34 - AUGUST 2007 SAMPLING OF APARTMENT RENTALS PINAL COUNTY COMMUNITIES OF CASA GRANDE, COOLIDGE AND ELOY ............................. 66
TABLE 35 - AUGUST 2007 SAMPLING OF SUBSIDIZED UNITS BY SUBSIDY TYPE –COMMUNITIES OF CASA GRANDE, COOLIDGE, ELOY ................................... 67
TABLE 36 - SUBSIDIZED APARTMENT UNITS BY JURISDICTION PINAL COUNTY ............................................................................................................................... 67
TABLE 37 - HOUSING AFFORDABILITY BY INDUSTRY FOR PRIMARY INDUSTRIES PINAL COUNTY 2006 ........................................................................................ 69
TABLE 38 - HOUSING AFFORDABILITY FOR PRIMARY OCCUPATIONS FOR PINAL COUNTY 2006.................................................................................................... 70

Pinal County Housing Needs Assessment – March 2008 Final Draft
Kuehl Enterprises LLC PO Box 642 Humboldt, AZ 86329 928-899-4339 Page vi
TABLE 39 - BARRIERS TO AFFORDABLE HOUSING DEVELOPMENT, VARIETY AND AFFORDABILITY .............................................................................................. 72
HOME PURCHASE AFFORDABILITY 2006 – APACHE JUNCTION MARKET AREA ................................................................................................................................ 90
HOME PURCHASE AFFORDABILITY 2006 – CASA GRANDE MARKET AREA ........................................................................................................................................ 92
HOME PURCHASE AFFORDABILITY 2006 – COOLIDGE MARKET AREA............................................................................................................................................... 95
HOME PURCHASE AFFORDABILITY 2006 – ELOY MARKET AREA........................................................................................................................................................ 98
HOME PURCHASE AFFORDABILITY 2006 – FLORENCE MARKET AREA ............................................................................................................................................ 100
HOME PURCHASE AFFORDABILITY 2006 – KEARNY MARKET AREA ................................................................................................................................................. 101
HOME PURCHASE AFFORDABILITY 2006 – MAMMOTH MARKET AREA ............................................................................................................................................. 102
HOME PURCHASE AFFORDABILITY 2006 – MARICOPA MARKET AREA............................................................................................................................................. 103
HOME PURCHASE AFFORDABILITY 2006 – QUEEN CREEK MARKET AREA ...................................................................................................................................... 105
HOME PURCHASE AFFORDABILITY 2006 – SUPERIOR MARKET AREA ............................................................................................................................................. 107
GOAL 1: INCREASE CAPACITY FOR AND COORDINATION OF AFFORDABLE HOUSING PROGRAMS AND PROJECTS ..................................................................... 2
GOAL 2: INCREASE THE AVAILABILITY OF AND ACCESS TO A VARIETY OF FUNDING RESOURCES................................................................................................. 5
GOAL 3: INCREASE THE AVAILABILITY AND DEDICATION OF LAND FOR FUTURE AFFORDABLE HOUSING PRODUCTION............................................................. 7
GOAL 4: INCORPORATE AFFORDABLE HOUSING AND HOUSING AFFORDABILITY INTO PLANNING AND ZONING PROCESSES AND DECISIONS ........................ 8
GOAL 4: INCORPORATE AFFORDABLE HOUSING AND HOUSING AFFORDABILITY INTO PLANNING AND ZONING PROCESSES AND DECISIONS ...................... 10
GOAL 5: ENCOURAGE PRIVATE INVESTMENT IN AFFORDABLE HOUSING......................................................................................................................................... 12
GOAL 6: DEVELOP AND DELIVER COMMUNITY-BASED PROGRAMS ................................................................................................................................................... 14
Pinal County Housing Needs Assessment – March 2008 Final Draft
Kuehl Enterprises LLC PO Box 642 Humboldt, AZ 86329 Page 1
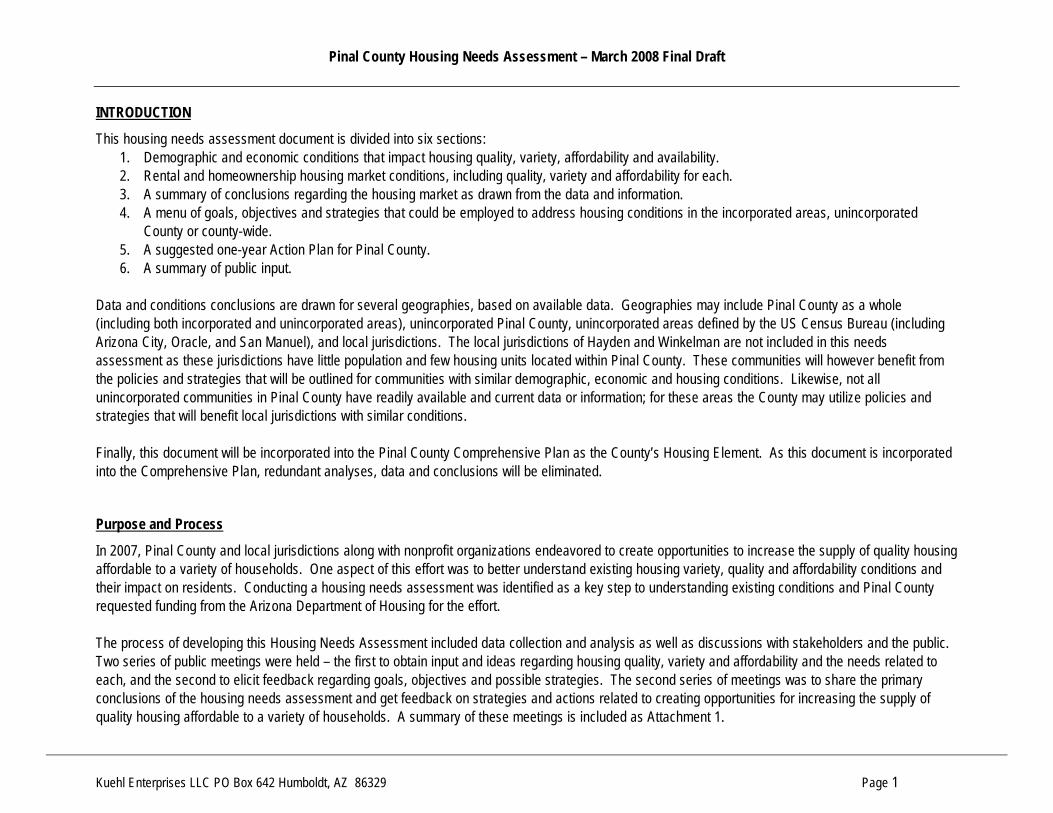
INTRODUCTION
This housing needs assessment document is divided into six sections: 1. Demographic and economic conditions that impact housing quality, variety, affordability and availability. 2. Rental and homeownership housing market conditions, including quality, variety and affordability for each. 3. A summary of conclusions regarding the housing market as drawn from the data and information. 4. A menu of goals, objectives and strategies that could be employed to address housing conditions in the incorporated areas, unincorporated
County or county-wide. 5. A suggested one-year Action Plan for Pinal County. 6. A summary of public input.
Data and conditions conclusions are drawn for several geographies, based on available data. Geographies may include Pinal County as a whole (including both incorporated and unincorporated areas), unincorporated Pinal County, unincorporated areas defined by the US Census Bureau (including Arizona City, Oracle, and San Manuel), and local jurisdictions. The local jurisdictions of Hayden and Winkelman are not included in this needs assessment as these jurisdictions have little population and few housing units located within Pinal County. These communities will however benefit from the policies and strategies that will be outlined for communities with similar demographic, economic and housing conditions. Likewise, not all unincorporated communities in Pinal County have readily available and current data or information; for these areas the County may utilize policies and strategies that will benefit local jurisdictions with similar conditions. Finally, this document will be incorporated into the Pinal County Comprehensive Plan as the County’s Housing Element. As this document is incorporated into the Comprehensive Plan, redundant analyses, data and conclusions will be eliminated.
Purpose and Process
In 2007, Pinal County and local jurisdictions along with nonprofit organizations endeavored to create opportunities to increase the supply of quality housing affordable to a variety of households. One aspect of this effort was to better understand existing housing variety, quality and affordability conditions and their impact on residents. Conducting a housing needs assessment was identified as a key step to understanding existing conditions and Pinal County requested funding from the Arizona Department of Housing for the effort. The process of developing this Housing Needs Assessment included data collection and analysis as well as discussions with stakeholders and the public. Two series of public meetings were held – the first to obtain input and ideas regarding housing quality, variety and affordability and the needs related to each, and the second to elicit feedback regarding goals, objectives and possible strategies. The second series of meetings was to share the primary conclusions of the housing needs assessment and get feedback on strategies and actions related to creating opportunities for increasing the supply of quality housing affordable to a variety of households. A summary of these meetings is included as Attachment 1.

Pinal County Housing Needs Assessment – March 2008 Final Draft
Kuehl Enterprises LLC PO Box 642 Humboldt, AZ 86329 Page 2
Data
The data included in this housing needs assessment is drawn from many sources. Governmental sources include the US Census Bureau, the Internal Revenue Service, the US Department of Housing and Urban Development, Pinal County and local jurisdictions. Other sources include Arizona State University Realty Studies center, the Mortgage Bankers Association, and Central Arizona Association of Governments. The Central Arizona Association of Governments (CAAG) maintains data for Pinal County on multiple levels. The contents of this housing needs assessment reflect the views of the Author/Consultant who is responsible for the facts and accuracy of the data presented herein. The contents do not necessarily reflect the official views or policies of CAAG or any other data source and have not been approved or endorsed by CAAG or any other data source.

Pinal County Housing Needs Assessment – March 2008 Final Draft
Kuehl Enterprises LLC PO Box 642 Humboldt, AZ 86329 Page 3
DEMOGRAPHICS
Population Trends
The general dependence of the housing market on population growth is readily recognized – without population growth additional housing units are not needed. Predictions of housing demand depend largely on accurate predictions of population growth and household size as well as socioeconomic trends associated with a growing population. A population study, including projections, is currently underway for Pinal County. People move for a variety of reasons including the availability of employment, affordable housing, favorable tax structure, and favorable weather. Population growth and the housing market in Pinal County were buoyed earlier in the decade by:
• Expanding employment in the metropolitan Phoenix and Tucson areas;
• Relative affordability of housing, compared to metropolitan Phoenix and Tucson;
• Early retirement of many baby boomers; • Low mortgage interest rates and liberal financing terms; • Investors acquiring rental properties and second homes; • Homeowners buying up to larger units; and • Renters entering the homeownership market.
The greatest amount of growth has been where the commute is relatively short - in the incorporated and unincorporated areas closest to I-10 and to metropolitan Phoenix and Tucson. During the economic and housing boom of 2000 to 2006, households and investors from all over the United States invested in real estate in Pinal County. Pinal County was particularly attractive to households previously living in Maricopa County. According to the Internal Revenue Service, more than one in ten (11.2%) of taxpayer households added to Pinal County’s population from 2005 to 2006, moved from Maricopa County.
Households Living in Unincorporated and Incorporated Communities 1990 - 2006
-30,00060,00090,000
120,000
1990 2000 2006
Sources: 1990 US Census, Census 2000, CAAG, Author
Unincorporated Pinal County Incorporated Communities
Households by Jurisdiction 1990 - 2006
0
5,000
10,000
15,000
20,000
Apache
Junct
ionCas
a Gran
deCoo
lidge
EloyFlo
rence
Kearny
Mammoth
Marico
paQue
en Cree
kSup
erior
Sources: 1990 US Census, Census 2000, CAAG, Author
1990
2000
Est 2006

Pinal County Housing Needs Assessment – March 2008 Final Draft
Kuehl Enterprises LLC PO Box 642 Humboldt, AZ 86329 Page 4
TABLE 1 - POPULATION AND NUMBER OF HOUSEHOLDS TRENDS BY JURISDICTION 1990 - 2006
1990 (1) 2000 (2) 1990 – 2000 Change Estimated 2006 (3) 2000 – 2006 Estimated Change
Jurisdiction Pop HH % Pinal
Co
Pop HH % Pinal
Co
Pop HH % change in HH
Pop HH % Pinal
Co
Pop HH % change in HH
Pinal County 116,379 39,181 100.0% 179,727 61,413 100.0% 63,348 22,232 56.7% 322,368 122,393 00.0% 142,641 60,980 99.3%
Unincorporated Pinal Co(4) 54,330 16,805 46.7% 92,781 28,831 51.6% 38,451 12,026 71.6% 173,587 59,934 53.8% 80,806 31,103 107.9%
Apache Junction (Pinal Co Part) 18,023 7,607 15.5% 31,085 13,449 17.3% 13,062 5,842 76.8% 38,784 18,644 12.0% 7,699 5,195 38.6%
Arizona City CDP 1,950 845 2.2% 4,177 1,777 2.9% 2,227 932 110.3% 6,545 2,489 2.0% 2,368 712 40.1%
Casa Grande 19,082 6,442 16.4% 25,321 8,834 14.1% 6,239 2,392 37.1% 43,302 16,786 13.4% 17,981 7,952 90.0%
Coolidge 6,927 2,377 6.0% 7,788 2,590 4.3% 861 213 9.0% 11,433 4,225 3.5% 3,645 1,635 63.1%
Eloy 7,201 2,026 6.2% 8,900 2,529 5.0% 1,699 503 24.8% 11,594 3,661 3.6% 2,694 1,132 44.7%
Florence 3,333 1,314 2.9% 5,314 2,234 3.0% 1,981 920 70.0% 9,547 4,459 3.0% 4,233 2,225 99.6%
Kearny 2,262 786 1.9% 2,255 821 1.3% (7) 35 4.5% 2,280 922 0.7% 25 101 12.3%
Mammoth 1,845 586 1.6% 1,802 561 1.0% (43) (25) -4.3% 1,787 618 0.6% (15) 57 10.2%
Maricopa(5) - - 0.0% 1,080 281 0.6% 1,080 281 n/a 26,259 9,984 8.1% 25,179 9,703 2601.5%
Oracle CDP 3,043 1,071 2.6% 3,517 1,365 2.0% 474 294 27.5% 5,687 2,452 1.8% 2,170 1,087 79.7%
Queen Creek (Pinal Co Part) - - 0.0% 139 49 0.1% 139 49 n/a 407 159 0.1% 268 110 225.3%
San Manuel CDP 4,009 1,247 3.4% 4,375 1,447 2.4% 366 200 16.0% 4,503 1,655 1.4% 128 208 14.4%
Superior 3,376 1,238 2.9% 3,262 1,234 1.8% (114) (4) -0.3% 3,388 1,424 1.1% 126 190 15.4%
(1) Source: 1990 US Census (2) Source: Census2000 (3) Source: Central Arizona Association of Governments; No estimates for Maricopa County parts of Apache Junction and Queen Creek. Eloy and Florence households include incarcerated population. Estimates for Oracle and San Manuel by Arizona Department of Economic Security. (4) Includes population living on Tribal Lands /Excludes population in Pinal County parts of Hayden and Winkleman (5) Maricopa CDP Census 2000 data

Pinal County Housing Needs Assessment – March 2008 Final Draft
Kuehl Enterprises LLC PO Box 642 Humboldt, AZ 86329 Page 5
Household Size
While overall population is important to understanding growth, households occupy housing and therefore are key to identifying housing needs and demand. The US Census defines a household as “all the people who occupy a housing unit”. A household includes both related and unrelated people who share the housing unit. A person living alone and groups of unrelated people sharing a housing unit, such as partners or roomers are also counted as households. Individuals in group quarters, including incarcerated individuals, are excluded from households and the estimate of household size.
TABLE 2 - AVERAGE NUMBER OF PERSONS PER HOUSEHOLD 2000
Pinal County
Apache Junction
Arizona City
Casa Grande
Coolidge Eloy Florence Kearny Mammoth Maricopa Oracle Queen Creek
San Manuel
Superior
2.68 2.27 2.39 2.81 2.97 3.57 2.38 2.86 3.21 4.03 2.57 2.67 3.00 2.64 Source: Census 2000
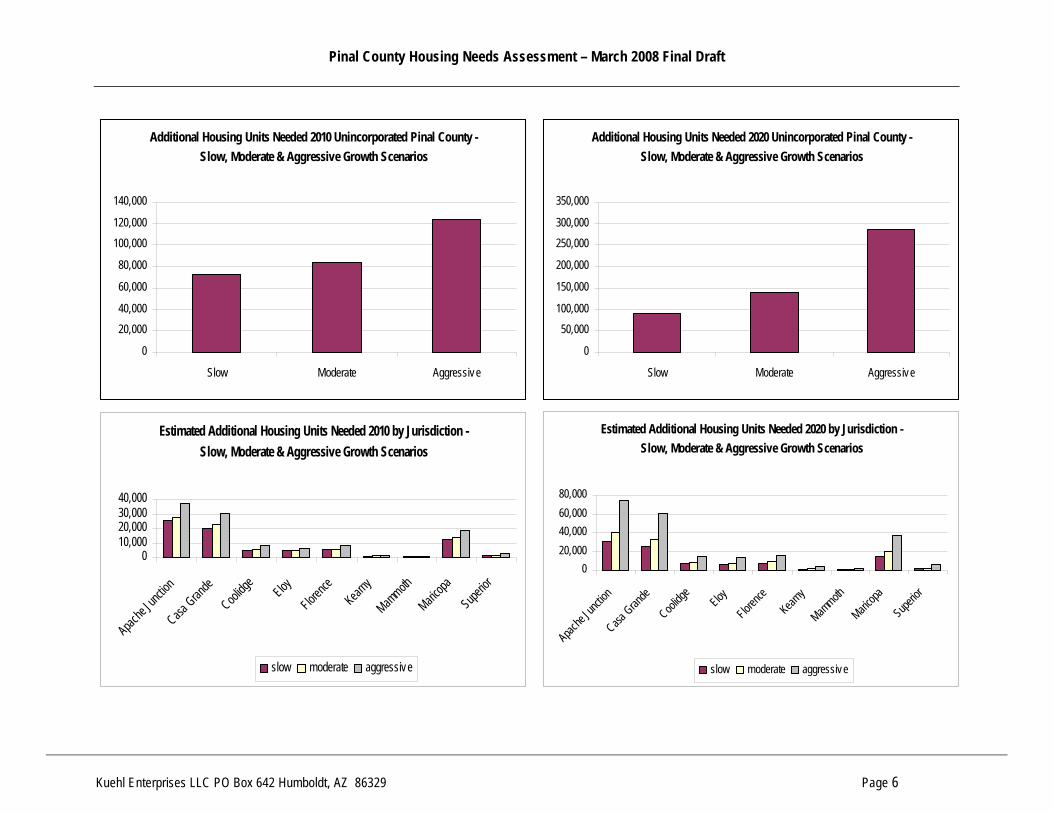
Population Projections
Population projections are difficult in the best of circumstances and especially challenging for Pinal County given the population boom of 2000 to 2006, which reflected a growth pattern significantly different than occurred over the preceding decades. The question that looms largest for Pinal County is whether the population growth that occurred from 2000 to 2006 is an accurate predictor of population growth moving forward. For the purposes of this housing needs assessment, three population, household and housing unit need projections are made: slow, moderate, and aggressive. All housing unit growth projections are based on the average household size by jurisdiction and use 2006 housing unit estimates, including vacant units as a baseline number for additional units needed.
1. Slow assumes the estimated annual growth rate (2.9% annually) for Arizona as defined by the US Census Bureau. 2. Moderate assumes the growth rate that occurred from the 1990 Census to Census 2000 for each jurisdiction and for Pinal County as a whole. 3. Aggressive assumes the growth rate that occurred from Census 2000 to 2006 CAAG Population Estimates for each jurisdiction and for Pinal
County as a whole.
Pinal County Housing Needs Assessment – March 2008 Final Draft
Kuehl Enterprises LLC PO Box 642 Humboldt, AZ 86329 Page 6
Additional Housing Units Needed 2010 Unincorporated Pinal County - Slow, Moderate & Aggressive Growth Scenarios
0
20,00040,000
60,000
80,000
100,000120,000
140,000
Slow Moderate Aggressive
Additional Housing Units Needed 2020 Unincorporated Pinal County - Slow, Moderate & Aggressive Growth Scenarios
0
50,000100,000
150,000
200,000
250,000300,000
350,000
Slow Moderate Aggressive
Estimated Additional Housing Units Needed 2010 by Jurisdiction - Slow, Moderate & Aggressive Growth Scenarios
010,00020,00030,00040,000
Apache
Junctio
nCasa
Grande
Coolidg
e
EloyFlore
nceKear
nyMam
mothMaric
opaSupe
rior
slow moderate aggressive
Estimated Additional Housing Units Needed 2020 by Jurisdiction - Slow, Moderate & Aggressive Growth Scenarios
020,00040,00060,00080,000
Apache
Junctio
nCasa
Grande
Coolidg
e
EloyFlore
nce
Kearny
Mammoth
Maricopa
Superior
slow moderate aggressive
Pinal County Housing Needs Assessment – March 2008 Final Draft
Kuehl Enterprises LLC PO Box 642 Humboldt, AZ 86329 Page 7
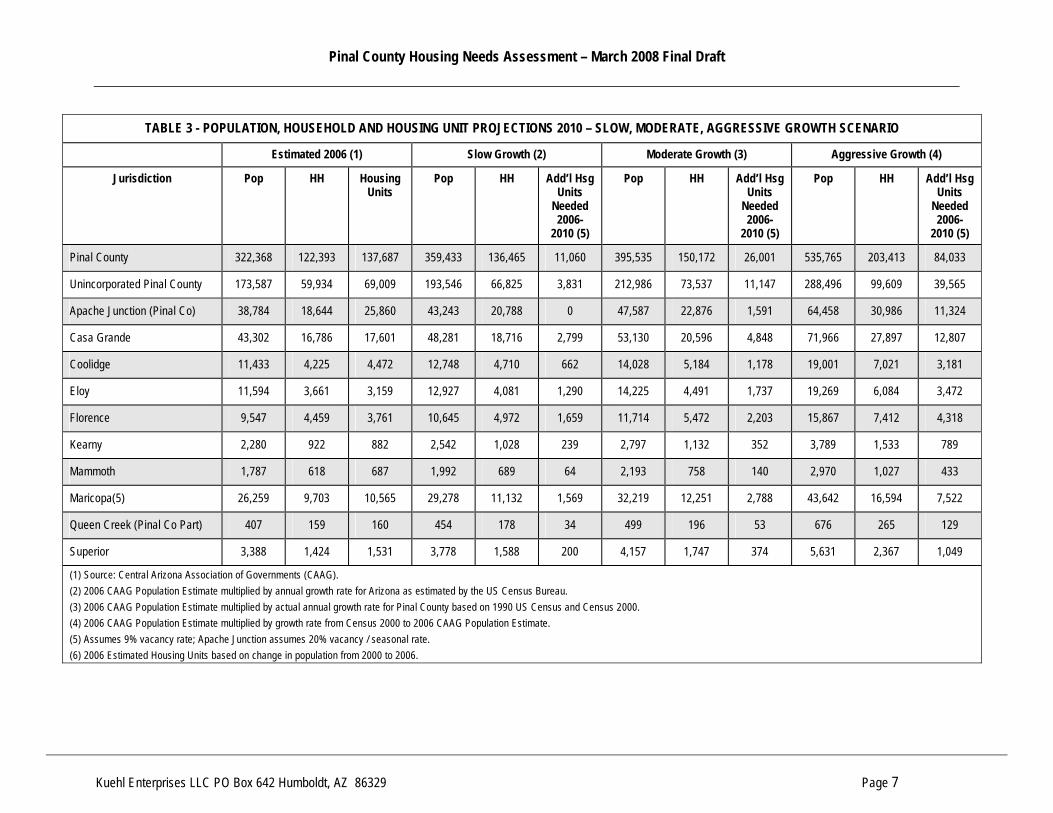
TABLE 3 - POPULATION, HOUSEHOLD AND HOUSING UNIT PROJECTIONS 2010 – SLOW, MODERATE, AGGRESSIVE GROWTH SCENARIO
Estimated 2006 (1) Slow Growth (2) Moderate Growth (3) Aggressive Growth (4)
Jurisdiction Pop HH Housing Units
Pop HH Add’l Hsg Units
Needed 2006-
2010 (5)
Pop HH Add’l Hsg Units
Needed 2006-
2010 (5)
Pop HH Add’l Hsg Units
Needed 2006-
2010 (5)
Pinal County 322,368 122,393 137,687 359,433 136,465 11,060 395,535 150,172 26,001 535,765 203,413 84,033
Unincorporated Pinal County 173,587 59,934 69,009 193,546 66,825 3,831 212,986 73,537 11,147 288,496 99,609 39,565
Apache Junction (Pinal Co) 38,784 18,644 25,860 43,243 20,788 0 47,587 22,876 1,591 64,458 30,986 11,324
Casa Grande 43,302 16,786 17,601 48,281 18,716 2,799 53,130 20,596 4,848 71,966 27,897 12,807
Coolidge 11,433 4,225 4,472 12,748 4,710 662 14,028 5,184 1,178 19,001 7,021 3,181
Eloy 11,594 3,661 3,159 12,927 4,081 1,290 14,225 4,491 1,737 19,269 6,084 3,472
Florence 9,547 4,459 3,761 10,645 4,972 1,659 11,714 5,472 2,203 15,867 7,412 4,318
Kearny 2,280 922 882 2,542 1,028 239 2,797 1,132 352 3,789 1,533 789
Mammoth 1,787 618 687 1,992 689 64 2,193 758 140 2,970 1,027 433
Maricopa(5) 26,259 9,703 10,565 29,278 11,132 1,569 32,219 12,251 2,788 43,642 16,594 7,522
Queen Creek (Pinal Co Part) 407 159 160 454 178 34 499 196 53 676 265 129
Superior 3,388 1,424 1,531 3,778 1,588 200 4,157 1,747 374 5,631 2,367 1,049
(1) Source: Central Arizona Association of Governments (CAAG). (2) 2006 CAAG Population Estimate multiplied by annual growth rate for Arizona as estimated by the US Census Bureau. (3) 2006 CAAG Population Estimate multiplied by actual annual growth rate for Pinal County based on 1990 US Census and Census 2000. (4) 2006 CAAG Population Estimate multiplied by growth rate from Census 2000 to 2006 CAAG Population Estimate. (5) Assumes 9% vacancy rate; Apache Junction assumes 20% vacancy / seasonal rate. (6) 2006 Estimated Housing Units based on change in population from 2000 to 2006.

Pinal County Housing Needs Assessment – March 2008 Final Draft
Kuehl Enterprises LLC PO Box 642 Humboldt, AZ 86329 Page 8
TABLE 4 - POPULATION, HOUSEHOLD AND HOUSING UNIT PROJECTIONS 2020 – SLOW, MODERATE, AGGRESSIVE GROWTH SCENARIO
Estimated 2006 (1) Slow Growth (2) Moderate Growth (3) Aggressive Growth (4)
Jurisdiction Pop HH Housing Units
Pop HH Add’l Hsg Units
Needed 2006-2020
(5)
Pop HH Add’l Hsg Units
Needed 2006-2020
(5)
Pop HH Add’l Hsg Units
Needed 2006-2020
(5)
Pinal County 322,368 122,393 137,687 446,057 169,354 46,909 578,452 219,620 101,699 1,069,256 405,963 304,812
Unincorporated Pinal County 173,587 59,934 69,009 240,191 82,930 21,385 311,482 107,545 48,215 575,767 198,795 147,677
Apache Junction (Pinal Co) 38,784 18,644 25,860 53,665 25,798 5,098 69,593 33,455 14,286 128,642 61,841 48,350
Casa Grande 43,302 16,786 17,601 59,917 23,226 7,716 77,700 30,120 15,230 143,628 55,676 43,086
Coolidge 11,433 4,225 4,472 15,820 5,846 1,900 20,515 7,581 3,791 37,922 14,013 10,802
Eloy 11,594 3,661 3,159 16,042 5,065 2,362 20,804 6,568 4,001 38,456 12,142 10,075
Florence 9,547 4,459 3,761 13,210 6,171 2,965 17,131 8,002 4,961 31,666 14,792 12,362
Kearny 2,280 922 882 3,155 1,276 509 4,091 1,655 922 7,562 3,059 2,453
Mammoth 1,787 618 687 2,473 855 245 3,207 1,109 522 5,927 2,050 1,548
Maricopa(5) 26,259 9,703 10,565 36,334 13,815 4,494 47,119 17,916 8,963 87,098 33,117 25,533
Queen Creek (Pinal Co Part) 407 159 160 563 221 80 730 286 152 1,350 529 416
Superior 3,388 1,424 1,531 4,688 1,970 617 6,079 2,555 1,254 11,238 4,723 3,618
(1) Source: Central Arizona Association of Governments (CAAG). (2) 2006 CAAG Population Estimate multiplied by annual growth rate for Arizona as estimated by the US Census Bureau. (3) 2006 CAAG Population Estimate multiplied by actual annual growth rate for Pinal County based on 1990 US Census and Census 2000. (4) 2006 CAAG Population Estimate multiplied by growth rate from Census 2000 to 2006 CAAG Population Estimate. (5) Assumes vacancy rate by jurisdiction constant from Census 2000. (6) 2006 Estimated Housing Units based on change in population from 2000 to 2006.

Pinal County Housing Needs Assessment – March 2008 Final Draft
Kuehl Enterprises LLC PO Box 642 Humboldt, AZ 86329 Page 9
Age of Householder
While population projections are helpful to estimating the number of housing units that may be needed, more critical than the actual numbers are the patterns of growth and expectations regarding that growth. As no area can truly control population growth or the lack of population growth, understanding the types of families and the ages of family members currently living in and expected to move to an area can help a community plan for a variety of housing units, community amenities, services and infrastructure. Older householders are less likely to participate in the workforce, more likely to own than rent, may seek smaller housing units requiring little or no maintenance, are more likely to have accumulated wealth and pay cash or make a significant down payment when purchasing housing, and are more likely to purchase second or seasonal housing units. Older householders are also more likely to relocate based on the availability and quality of health care and recreation opportunities, and to be close to children and families. At the same time, older householders and the communities they comprise depend upon younger working householders to provide these services. Younger households are usually larger and most often require financing to purchase a home. Younger households also require a range of employment opportunities, including the ability to move up within an industry, high-quality educational opportunities, and appropriate recreation. They are more likely to relocate for employment opportunities and for quality schools than for other reasons.
The attractiveness of Pinal County to more established households and to retirees of all ages is evident in the age distribution of householders. In 2000, the largest proportion of the population in Pinal County was between the ages of 35 and 44 and just over one-half were between the ages of 25 and 54. Throughout the County, three householder age patterns were evident. The largest proportion of householders:
• Between the ages of 35 and 54 in Casa Grande, Coolidge, Mammoth, Maricopa, Oracle, and San Manuel;
• Over the age of 55 in Unincorporated Pinal County, Apache Junction, Arizona City, Florence, Queen Creek, and Superior.
Only a few geographic areas, had more than 20% of their householders aged 34 and under: Casa Grande, Eloy, Maricopa and San Manuel.
Age of Householder by Geographic Area 2000
0%20%40%60%80%
100%
Uninc.
Pinal C
oApa
che Ju
nction
AZ City
CDPCas
a Gran
deCoo
lidge
EloyFlo
rence
Kearny
Mammoth
Marico
paOrac
leQue
en Cree
kSan
Man
uel
Superi
or
Source: Census 2000 34 and under 35 to 54 55 and over

Pinal County Housing Needs Assessment – March 2008 Final Draft
Kuehl Enterprises LLC PO Box 642 Humboldt, AZ 86329 Page 10
Family Type
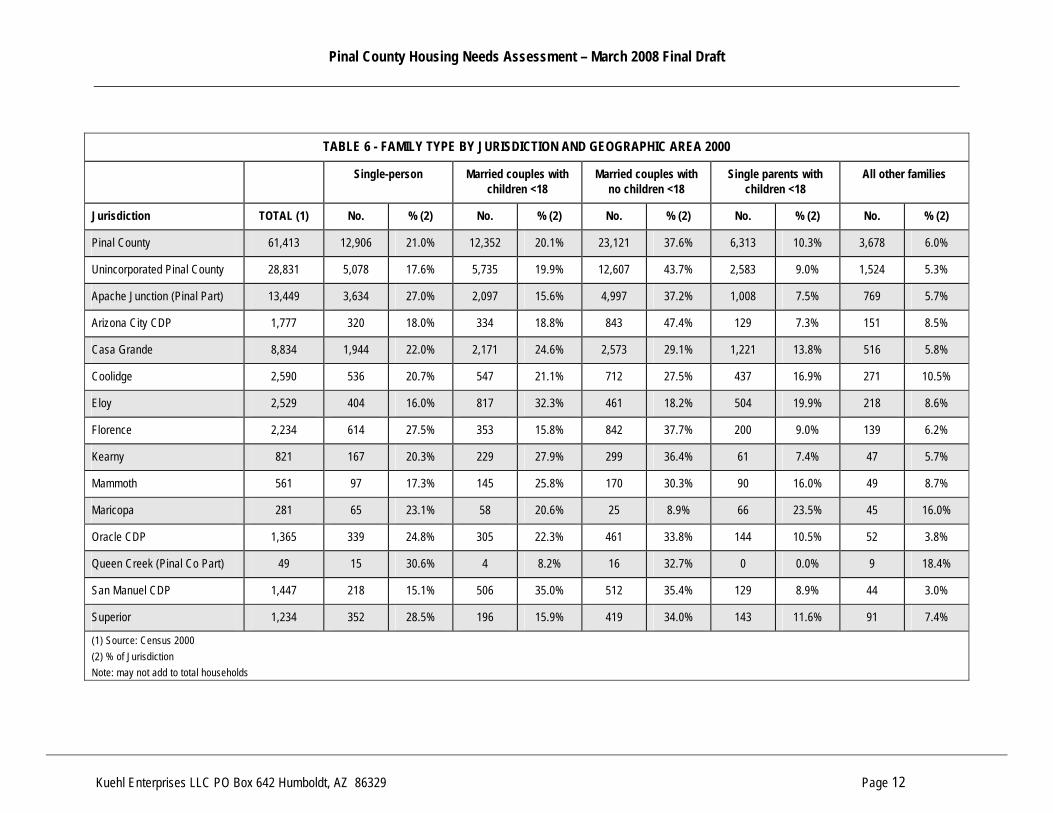
All families, regardless of composition or income, seek housing that is both affordable to and appropriate for their family. Safe neighborhoods and housing values that remain stable or increase over time are another primary factor in choosing a location to call home. Understanding the types of families that comprise a community helps to identify the most appropriate types and price ranges of housing. Along with that housing, appropriate services and recreation can then also be identified. Families with dependent children, whether dual-parent of single-parent seek quality educational opportunities and housing that is located near schools, child care, employment opportunities, and appropriate recreation. Families with children also seek housing near relatives or other social support networks. With the exception of adult education opportunities, singles and families without dependent children are less likely to consider schools when making a housing choice. In 2000, married couples with no dependent children were the most prevalent family type throughout Pinal County, with the exception of Eloy where the most prevalent family type was married couples with dependent children. This family type demonstrates the attractiveness of Pinal County to retirees of all ages. It also demonstrates the likelihood that families without children will locate where a commute is necessary. Single-person families are a growing proportion of the population. Growth in this family type may be attributed to an aging population and to less social pressure to marry and remain married. In 2000, over one-quarter of families were single-person families in Apache Junction, Florence, and Superior. In addition to single-person families, single-parents with dependent children are a growing proportion of the population. In 2000, nearly 15% of families in Casa Grande, Coolidge and Eloy were single-parent families.
Family Type by Geographic Area 2000
0%20%40%60%80%
100%
Uninc
Pina
l Co
Apac
he Ju
nc...
AZ C
ity C
DPCa
sa G
rande
Cooli
dge
Eloy
Floren
ceKe
arny
Mammoth
Marico
paOr
acle
Quee
n Cree
kSa
n Man
uel
Supe
rior
Source: Census 2000Single-person Married couples, children <18
Married couples, no children <18 Single parents, children <18

Pinal County Housing Needs Assessment – March 2008 Final Draft
Kuehl Enterprises LLC PO Box 642 Humboldt, AZ 86329 Page 11
TABLE 5 - AGE OF HOUSEHOLDER BY JURISDICTION AND GEOGRAPHIC AREA 2000
15 – 24 25 – 34 35 – 44 45 – 54 55 – 64 65 -74 75 and over
Jurisdiction TOTAL (1)
No. % (2) No. % (2) No. % (2) No. % (2) No. % (2) No. % (2) No. % (2)
Pinal County 61,364 2,379 3.9% 8,347 13.6% 11,166 18.2% 10,540 17.2% 10,290 16.8% 11,026 18.0% 7,616 12.4%
Unincorporated Pinal Co (3) 28,675 799 2.8% 3,398 11.9% 5,364 18.7% 5,110 17.8% 5,647 19.7% 5,262 18.4% 3,095 10.8%
Apache Junction (Pinal Part) 13,570 538 4.0% 1,665 12.3% 2,157 15.9% 1,982 14.6% 2,053 15.1% 2,795 20.6% 2,380 17.5%
Arizona City CDP 1,777 70 3.9% 191 10.7% 348 19.6% 263 14.8% 245 13.8% 400 22.5% 260 14.6%
Casa Grande 8,905 440 4.9% 1,768 19.9% 1,704 19.1% 1,590 17.9% 1,159 13.0% 1,350 15.2% 894 10.0%
Coolidge 2,603 165 6.3% 307 11.8% 559 21.5% 515 19.8% 352 13.5% 415 15.9% 290 11.1%
Eloy 2,472 292 11.8% 485 19.6% 573 23.2% 454 18.4% 324 13.1% 240 9.7% 104 4.2%
Florence 2,233 41 1.8% 331 14.8% 318 14.2% 313 14.0% 305 13.7% 483 21.6% 442 19.8%
Kearny 789 16 2.0% 121 15.3% 105 13.3% 168 21.3% 145 18.4% 121 15.3% 113 14.3%
Mammoth 562 18 3.2% 92 16.4% 110 19.6% 124 22.1% 98 17.4% 58 10.3% 62 11.0%
Maricopa(4) 268 17 6.3% 76 28.4% 95 35.4% 49 18.3% 4 1.5% 18 6.7% 9 3.4%
Oracle CDP 1,369 66 4.8% 127 9.3% 322 23.5% 276 20.2% 285 20.8% 144 10.5% 145 10.6%
Queen Creek (Pinal Co Part) 52 0 0.0% 0 0.0% 0 0.0% 5 9.6% 26 50.0% 11 21.2% 10 19.2%
San Manuel CDP 1,458 63 4.3% 245 16.8% 368 25.2% 272 18.7% 246 16.9% 194 13.3% 59 4.0%
Superior 1,235 53 4.3% 104 8.4% 181 14.7% 230 18.6% 177 14.3% 273 22.1% 217 17.6%
Source: Census 2000 (1) Census 2000 (2) Percent of Jurisdiction (3) Includes population living on Tribal Lands /Excludes population in Pinal County parts of Hayden and Winkleman. (4) Maricopa CDP Census 2000 data
Pinal County Housing Needs Assessment – March 2008 Final Draft
Kuehl Enterprises LLC PO Box 642 Humboldt, AZ 86329 Page 12
TABLE 6 - FAMILY TYPE BY JURISDICTION AND GEOGRAPHIC AREA 2000
Single-person Married couples with children <18
Married couples with no children <18
Single parents with children <18
All other families
Jurisdiction TOTAL (1) No. % (2) No. % (2) No. % (2) No. % (2) No. % (2)
Pinal County 61,413 12,906 21.0% 12,352 20.1% 23,121 37.6% 6,313 10.3% 3,678 6.0%
Unincorporated Pinal County 28,831 5,078 17.6% 5,735 19.9% 12,607 43.7% 2,583 9.0% 1,524 5.3%
Apache Junction (Pinal Part) 13,449 3,634 27.0% 2,097 15.6% 4,997 37.2% 1,008 7.5% 769 5.7%
Arizona City CDP 1,777 320 18.0% 334 18.8% 843 47.4% 129 7.3% 151 8.5%
Casa Grande 8,834 1,944 22.0% 2,171 24.6% 2,573 29.1% 1,221 13.8% 516 5.8%
Coolidge 2,590 536 20.7% 547 21.1% 712 27.5% 437 16.9% 271 10.5%
Eloy 2,529 404 16.0% 817 32.3% 461 18.2% 504 19.9% 218 8.6%
Florence 2,234 614 27.5% 353 15.8% 842 37.7% 200 9.0% 139 6.2%
Kearny 821 167 20.3% 229 27.9% 299 36.4% 61 7.4% 47 5.7%
Mammoth 561 97 17.3% 145 25.8% 170 30.3% 90 16.0% 49 8.7%
Maricopa 281 65 23.1% 58 20.6% 25 8.9% 66 23.5% 45 16.0%
Oracle CDP 1,365 339 24.8% 305 22.3% 461 33.8% 144 10.5% 52 3.8%
Queen Creek (Pinal Co Part) 49 15 30.6% 4 8.2% 16 32.7% 0 0.0% 9 18.4%
San Manuel CDP 1,447 218 15.1% 506 35.0% 512 35.4% 129 8.9% 44 3.0%
Superior 1,234 352 28.5% 196 15.9% 419 34.0% 143 11.6% 91 7.4%
(1) Source: Census 2000 (2) % of Jurisdiction Note: may not add to total households

Pinal County Housing Needs Assessment – March 2008 Final Draft
Kuehl Enterprises LLC PO Box 642 Humboldt, AZ 86329 Page 13
ECONOMICS
In general, the housing market moves roughly in line with the rest of the economy over the long term. As employment in the overall economy grows, it is expected that employment in the housing economy will grow. As population grows and the number of households expands, the number of housing units is expected to grow proportionately. As income grows, we expect both the size and quality, and consequently the cost of housing to increase. Housing affordability is an economic issue. As incomes increase, the quality and quantity of housing that may be purchased also increases. As incomes stagnate or decrease, the ability to maintain housing that has already been purchased and the ability to purchase resale or new housing units decreases. A variety of economic indicators influence the housing market and the housing market is itself a major economic indicator. Employment and unemployment, major industries and occupations, and income levels are key indicators that both reflect and impact the housing market. The economy of Pinal County is directly linked to the economy of Maricopa County, and in some southern County areas linked to the economy of Pima County. As the housing market and the economy in the metropolitan areas moves, so will the housing market and economy of Pinal County move. The upward trend in population, economic and housing growth in the metropolitan areas during the early part of the decade led to the economic and housing market expansion of Pinal County. However, as the economy of the nation and the State change, so will the economy of Pinal County. People between the ages of 25 and 54 represent the largest proportion of the employed population. Individuals under the age of 25 are often employed but are also more likely to be single, employed part-time, and in school or living with parents or other family members. Individuals over the age of 55 are more likely to be retired, although many continue to work either part-time or full-time. One risk of an economy dependent on employment in an adjacent jurisdiction is that households may choose to move based on the economy in the adjacent jurisdiction. As the economy changes in the major metropolitan areas, the changes may influence more working families to live closer to employment outside of Pinal County to save both travel time and transportation costs. In short, “Driving until you Qualify” to enter the home purchase market may be less likely as qualifying closer to work becomes more possible. At the same time, households less reliant on employment opportunities and lengthy commutes will continue to find Pinal County attractive as long as appropriate community amenities, services and infrastructure address their needs and desires.
Employment by Age By Geographic Area 2000
0%25%50%75%
100%Un
inc P
inal C
oAp
ache
Junc
...AZ
City
CDP
Casa
Gran
deCo
olidg
e
Eloy
Floren
ceKe
arny
Mamm
othMa
ricop
aOr
acle
Quee
n Cree
kSa
n Man
uel
Supe
rior
Source: Census 2000 15 to 24 25 to 54 55 and older

Pinal County Housing Needs Assessment – March 2008 Final Draft
Kuehl Enterprises LLC PO Box 642 Humboldt, AZ 86329 Page 14
Industries, Occupations and Housing Affordability
Employment data is produced monthly by the Bureau of Labor Statistics. Data includes information on employment, hours, and wages in all industries, including those tied to housing such as residential construction, real estate, and finance. Data on construction employment is especially indicative of the level of housing activity but is only reported at the state and major metropolitan level and lags as much as one year behind. The challenge with this data is it only measures those working in the industry who are documented and employed; it does not measure undocumented workers, most temporary help, or those who are self-employed. According to an October 5, 2007 Bureau of Labor Statistics “Employment Situation Summary”, 17% of individuals working in construction are self-employed and 28% are foreign-born and may be undocumented. Bureau of Labor Statistics data for the Phoenix metropolitan area (including Pinal County) indicate an increase in employment in construction-related occupations from 2000 to 2006, which is a good measure of the positive economic impact of the housing boom. Overall employment from 2000 to 2006 increased 20.9% and employment in construction-related occupations increased 49.8%. From September 2006 to September 2007 as the housing market slowed, construction employment declined 9.4% overall. During that same period, financial services related to real estate, including rental and leasing increased 1.5%. Construction-related occupations represented 7.7% of employment in 2000, 9.8% in 2006, and 8.8% in October 2007. As construction and sales levels move to a lower level and jobs are lost, the impact on the housing market and overall economy will be felt through decreased incomes and a possible increase in delinquency and foreclosure rates.
Place of Work and Travel Time to Work
While adequate income to rent, purchase and maintain quality housing is the heart of the affordability issue, the ability of two earner households to find appropriate employment close to quality affordable housing and desired amenities and infrastructure is a key issue in attracting and retaining a qualified and diverse employment base. Further, the stability of primary industries and consequently the stability of household income contribute to the stability of communities in general. Communities that lack diverse yet stable employment opportunities are challenged to sustain or grow.
Employment by Major Industries 2006
All others30.5%
Accommodation & Food Serv ices
7.8%
Educational Serv ices7.9%
Health Care & Social Assistance
9.3%
Construction9.8%
Public Administration10.5%
Manufacturing12.7%
Retail Trade11.5%
Source: Arizona Workforce Informer

Pinal County Housing Needs Assessment – March 2008 Final Draft
Kuehl Enterprises LLC PO Box 642 Humboldt, AZ 86329 Page 15
According to Census 2000, for the employed population living in “places” in Pinal County, only Casa Grande (64%), Florence (58%), and San Manuel (73%) had more than fifty percent of employed residents working locally. Those with the fewest “local” employees included Arizona City (1.8%), Maricopa (12.8%), and Oracle (14.4%) For commuters, both within the local jurisdiction and without, the majority enjoyed commute times of less than 20 minutes, with the exception of Apache Junction, Oracle and Queen Creek, where most commuters experienced a travel time to work of between 20 and 39 minutes. The proximity of many areas of Pinal County to the major metropolitan areas allows one or more employees in each household to commute to Phoenix or Tucson. Along with population growth and the dependence of many Pinal County households on employment in Maricopa and Pima counties, travel time to work has also grown.
According to data from the US Census Bureau, travel time to work increased for many Pinal County households from 2000 to 2006. In 2006, 33% of employees traveled less than 20 minutes to work, down from 45% in 2000. At the same time, those traveling 40 to 59 minutes increased from 16% to 19% and those traveling 60 to 89 minutes increased from 8% to 12%. Among the growth in employed persons in Pinal County, nearly one-quarter (23%) travel 40 to 59 minutes to work.
Trends in Travel Time to Work in Minutes 2000 - 2006
0%5%
10%15%20%25%30%35%40%45%50%
Up to 19 20 to 39 40 to 59 60 to 89 90 or more
2000 2006
Percent of Employees Working in Place of Residence 2000
0%20%40%60%80%
100%
Apache Juncti
onArizo
na City
Casa Gran
deCoolid
geEloy
Florence
KearnyMammothMarico
paOracl
eQueen Cree
kSan Manuel
Superior
Source: Census 2000
Outside Place of Residence
In Place of Residence
Pinal County Housing Needs Assessment – March 2008 Final Draft
Kuehl Enterprises LLC PO Box 642 Humboldt, AZ 86329 Page 16
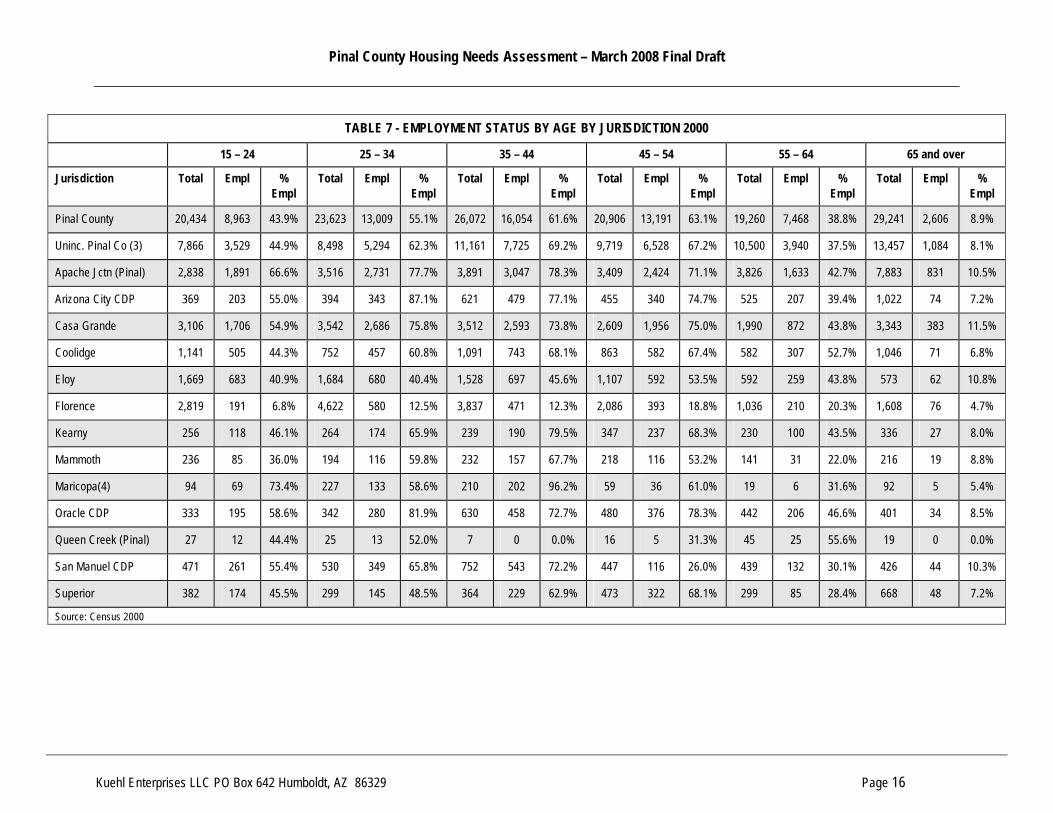
TABLE 7 - EMPLOYMENT STATUS BY AGE BY JURISDICTION 2000
15 – 24 25 – 34 35 – 44 45 – 54 55 – 64 65 and over
Jurisdiction Total Empl % Empl
Total Empl % Empl
Total Empl % Empl
Total Empl % Empl
Total Empl % Empl
Total Empl % Empl
Pinal County 20,434 8,963 43.9% 23,623 13,009 55.1% 26,072 16,054 61.6% 20,906 13,191 63.1% 19,260 7,468 38.8% 29,241 2,606 8.9%
Uninc. Pinal Co (3) 7,866 3,529 44.9% 8,498 5,294 62.3% 11,161 7,725 69.2% 9,719 6,528 67.2% 10,500 3,940 37.5% 13,457 1,084 8.1%
Apache Jctn (Pinal) 2,838 1,891 66.6% 3,516 2,731 77.7% 3,891 3,047 78.3% 3,409 2,424 71.1% 3,826 1,633 42.7% 7,883 831 10.5%
Arizona City CDP 369 203 55.0% 394 343 87.1% 621 479 77.1% 455 340 74.7% 525 207 39.4% 1,022 74 7.2%
Casa Grande 3,106 1,706 54.9% 3,542 2,686 75.8% 3,512 2,593 73.8% 2,609 1,956 75.0% 1,990 872 43.8% 3,343 383 11.5%
Coolidge 1,141 505 44.3% 752 457 60.8% 1,091 743 68.1% 863 582 67.4% 582 307 52.7% 1,046 71 6.8%
Eloy 1,669 683 40.9% 1,684 680 40.4% 1,528 697 45.6% 1,107 592 53.5% 592 259 43.8% 573 62 10.8%
Florence 2,819 191 6.8% 4,622 580 12.5% 3,837 471 12.3% 2,086 393 18.8% 1,036 210 20.3% 1,608 76 4.7%
Kearny 256 118 46.1% 264 174 65.9% 239 190 79.5% 347 237 68.3% 230 100 43.5% 336 27 8.0%
Mammoth 236 85 36.0% 194 116 59.8% 232 157 67.7% 218 116 53.2% 141 31 22.0% 216 19 8.8%
Maricopa(4) 94 69 73.4% 227 133 58.6% 210 202 96.2% 59 36 61.0% 19 6 31.6% 92 5 5.4%
Oracle CDP 333 195 58.6% 342 280 81.9% 630 458 72.7% 480 376 78.3% 442 206 46.6% 401 34 8.5%
Queen Creek (Pinal) 27 12 44.4% 25 13 52.0% 7 0 0.0% 16 5 31.3% 45 25 55.6% 19 0 0.0%
San Manuel CDP 471 261 55.4% 530 349 65.8% 752 543 72.2% 447 116 26.0% 439 132 30.1% 426 44 10.3%
Superior 382 174 45.5% 299 145 48.5% 364 229 62.9% 473 322 68.1% 299 85 28.4% 668 48 7.2%
Source: Census 2000

Pinal County Housing Needs Assessment – March 2008 Final Draft
Kuehl Enterprises LLC PO Box 642 Humboldt, AZ 86329 Page 17
TABLE 8 - PLACE OF WORK AND TRAVEL TIME TO WORK 2000
Place of Work Commute Time to Work
Jurisdiction Worked In Place of Residence
Worked at Home Worked Outside Place of
Residence
Up to 19 minutes
20 to 39 minutes 40 to 59 minutes 60 to 89 minutes 90 minutes or more
No. % No. % No. % No. % No. % No. % No. % No. %
Apache Junction (Pinal Part) 2,398 19.5% 276 11.5% 9,926 80.5% 3,780 30.7% 4,342 35.2% 2,517 20.4% 994 8.1% 415 3.4%
Arizona City CDP 190 11.9% 28 1.8% 1,564 98.2% 633 42.4% 509 32.0% 231 14.5% 131 8.2% 58 3.6%
Casa Grande 6,414 63.8% 217 3.4% 3,632 36.2% 6,766 67.4% 1,869 18.6% 776 7.7% 338 3.4% 80 0.8%
Coolidge 984 37.8% 53 5.4% 1,621 62.2% 1,479 56.8% 770 29.6% 175 6.7% 100 3.8% 28 1.1%
Eloy 1,044 36.2% 69 6.6% 1,842 63.8% 1,424 49.3% 942 32.6% 210 7.3% 141 4.9% 100 3.5%
Florence 1,090 58.0% 40 3.7% 788 42.0% 1,414 75.3% 169 9.0% 117 6.2% 86 4.6% 52 2.8%
Kearny 325 38.5% 7 2.2% 519 61.5% 666 78.9% 79 9.4% 35 4.1% 36 4.3% 21 2.5%
Mammoth 123 23.7% 8 6.5% 396 76.3% 177 34.1% 116 22.4% 100 19.3% 88 17.0% 30 5.8%
Maricopa 57 12.8% 0 0.0% 387 87.2% 238 53.6% 106 23.9% 44 9.9% 48 10.8% 8 1.8%
Oracle CDP 159 14.4% 3 0.3% 948 85.6% 460 41.6% 434 39.2% 137 12.4% 73 6.6% 0 0.0%
Queen Creek (Pinal Part) 20 36.4% 5 25.0% 35 63.6% 10 18.2% 23 41.8% 17 30.9% 0 0.0% 0 0.0%
San Manuel CDP 1075 73.0% 26 1.8% 398 27.0% 1,260 85.5% 76 5.2% 42 2.9% 44 3.0% 25 1.7%
Superior 344 35.2% 20 5.8% 634 64.8% 398 40.7% 203 20.8% 201 20.6% 120 12.3% 36 3.7%
Source: Census 2000
Pinal County Housing Needs Assessment – March 2008 Final Draft
Kuehl Enterprises LLC PO Box 642 Humboldt, AZ 86329 Page 18
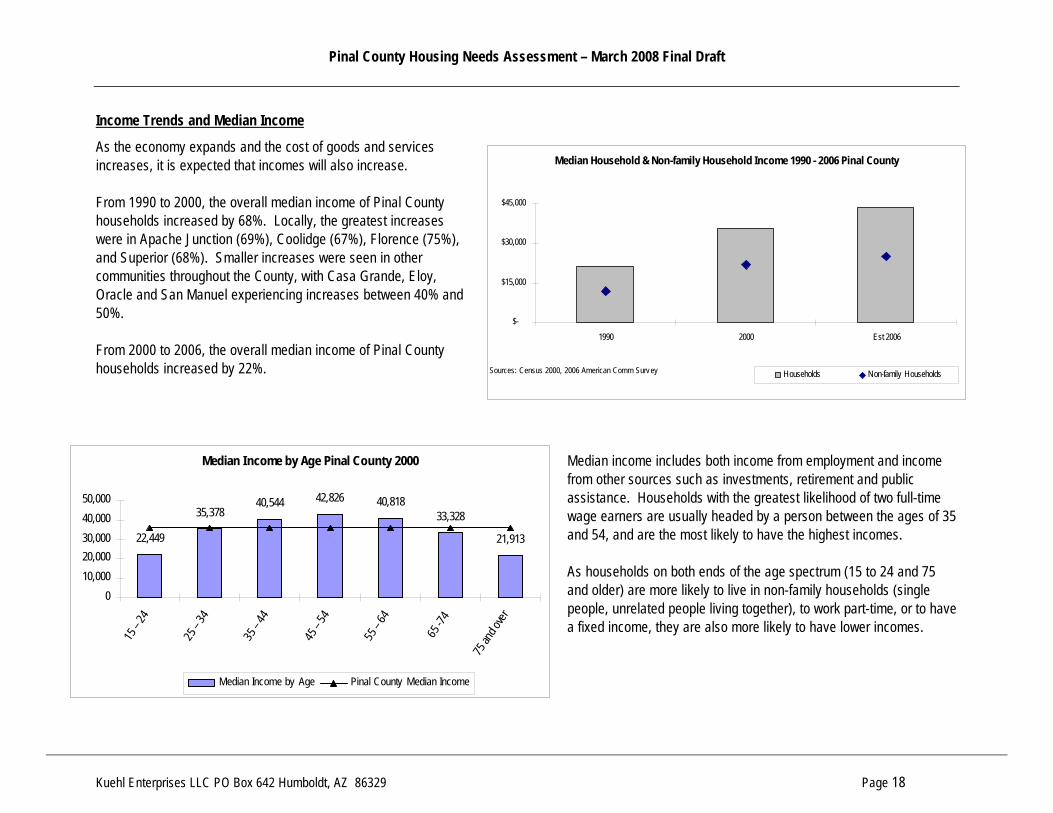
Income Trends and Median Income
As the economy expands and the cost of goods and services increases, it is expected that incomes will also increase. From 1990 to 2000, the overall median income of Pinal County households increased by 68%. Locally, the greatest increases were in Apache Junction (69%), Coolidge (67%), Florence (75%), and Superior (68%). Smaller increases were seen in other communities throughout the County, with Casa Grande, Eloy, Oracle and San Manuel experiencing increases between 40% and 50%. From 2000 to 2006, the overall median income of Pinal County households increased by 22%.
Median income includes both income from employment and income from other sources such as investments, retirement and public assistance. Households with the greatest likelihood of two full-time wage earners are usually headed by a person between the ages of 35 and 54, and are the most likely to have the highest incomes. As households on both ends of the age spectrum (15 to 24 and 75 and older) are more likely to live in non-family households (single people, unrelated people living together), to work part-time, or to have a fixed income, they are also more likely to have lower incomes.
Median Income by Age Pinal County 2000
22,449
35,37840,544 42,826 40,818
33,328
21,913
010,00020,00030,00040,00050,000
15 –
24
25 –
34
35 –
44
45 –
54
55 –
64
65 -7
4
75 an
d over
Median Income by Age Pinal County Median Income
Median Household & Non-family Household Income 1990 - 2006 Pinal County
$-
$15,000
$30,000
$45,000
1990 2000 Est 2006
Sources: Census 2000, 2006 American Comm Survey Households Non-family Households

Pinal County Housing Needs Assessment – March 2008 Final Draft
Kuehl Enterprises LLC PO Box 642 Humboldt, AZ 86329 Page 19
TABLE 9 - MEDIAN HOUSEHOLD INCOME TRENDS AND PROJECTIONS BY JURISDICTION 1990 - 2020
2000 (2) 1990 – 2000 change Jurisdiction 1990 (1)
Amt % Pinal County
Amt %
Est. 2005 (3)
Est. 2000 – 2005 change
Est 2006 (4)
Est 2007 (4)
Est 2010 (5)
Est 2015 (5)
Est 2020 (5)
Pinal County $ 21,301 $35,856 100.0% $14,555 68% $ 42,548 $ 6,692 $ 43,637 $ 42,911 $ 47,027 $ 54,782 $ 63,816
Apache Junction (Pinal Part) 19,686 33,367 93.1% 13,681 69% 39,594 6,227 40,608 39,932 43,762 50,979 59,386
Arizona City CDP 25,610 37,432 104.4% 11,822 46% 44,418 6,986 45,555 44,797 49,094 57,190 66,621
Casa Grande 25,926 36,212 101.0% 10,286 40% 42,970 6,758 44,070 43,337 47,494 55,326 64,450
Coolidge 17,422 29,049 81.0% 11,627 67% 34,471 5,422 35,353 34,765 38,099 44,382 51,701
Eloy 17,981 26,518 74.0% 8,537 47% 31,467 4,949 32,273 31,736 34,780 40,515 47,197
Florence 20,833 36,372 101.4% 15,539 75% 43,160 6,788 44,265 43,529 47,704 55,570 64,735
Kearny 31,436 39,906 111.3% 8,470 27% 47,354 7,448 48,566 47,758 52,339 60,970 71,024
Mammoth 25,081 29,861 83.3% 4,780 19% 35,434 5,573 36,341 35,736 39,164 45,623 53,146
Oracle CDP 27,635 38,267 106.7% 10,632 38% 45,409 7,142 46,571 45,796 40,166 46,790 54,506
Maricopa(6) n/a 30,625 85.4% 30,625 n/a 36,341 5,716 37,271 36,651 50,189 58,466 68,107
Queen Creek (Pinal Co Part) 36,806 36,250 101.1% -556 -2% 43,016 6,766 44,117 43,383 47,544 55,384 64,518
San Manuel CDP 29,058 40,019 111.6% 10,961 38% 47,488 7,469 48,704 47,893 52,487 61,142 71,226
Superior 16,118 27,069 75.5% 10,951 68% 32,121 5,052 32,943 32,395 35,502 41,357 48,177
(1) 1990 US Census (2) Census 2000 (3) 2005 US Census American Community Survey (Sampling Error of ±3.4%); local jurisdictions @ percent of Pinal County 2000 (4) Pinal County 72.6% of HUD median income; local jurisdictions @ percent of Pinal County 2000 (5) 3.1% average annual increase based on 1999 – 2005 % change (6) Maricopa CDP Census 2000 data
Pinal County Housing Needs Assessment – March 2008 Final Draft
Kuehl Enterprises LLC PO Box 642 Humboldt, AZ 86329 Page 20
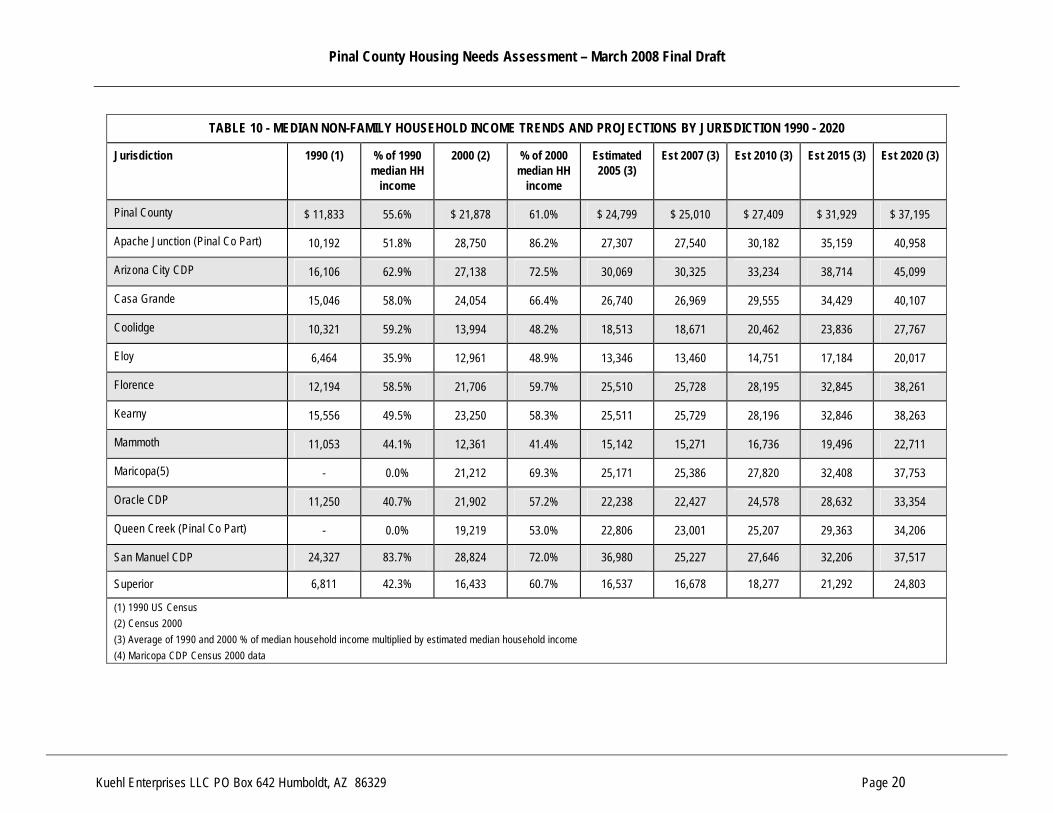
TABLE 10 - MEDIAN NON-FAMILY HOUSEHOLD INCOME TRENDS AND PROJECTIONS BY JURISDICTION 1990 - 2020
Jurisdiction 1990 (1) % of 1990 median HH
income
2000 (2) % of 2000 median HH
income
Estimated 2005 (3)
Est 2007 (3) Est 2010 (3) Est 2015 (3) Est 2020 (3)
Pinal County $ 11,833 55.6% $ 21,878 61.0% $ 24,799 $ 25,010 $ 27,409 $ 31,929 $ 37,195
Apache Junction (Pinal Co Part) 10,192 51.8% 28,750 86.2% 27,307 27,540 30,182 35,159 40,958
Arizona City CDP 16,106 62.9% 27,138 72.5% 30,069 30,325 33,234 38,714 45,099
Casa Grande 15,046 58.0% 24,054 66.4% 26,740 26,969 29,555 34,429 40,107
Coolidge 10,321 59.2% 13,994 48.2% 18,513 18,671 20,462 23,836 27,767
Eloy 6,464 35.9% 12,961 48.9% 13,346 13,460 14,751 17,184 20,017
Florence 12,194 58.5% 21,706 59.7% 25,510 25,728 28,195 32,845 38,261
Kearny 15,556 49.5% 23,250 58.3% 25,511 25,729 28,196 32,846 38,263
Mammoth 11,053 44.1% 12,361 41.4% 15,142 15,271 16,736 19,496 22,711
Maricopa(5) - 0.0% 21,212 69.3% 25,171 25,386 27,820 32,408 37,753
Oracle CDP 11,250 40.7% 21,902 57.2% 22,238 22,427 24,578 28,632 33,354
Queen Creek (Pinal Co Part) - 0.0% 19,219 53.0% 22,806 23,001 25,207 29,363 34,206
San Manuel CDP 24,327 83.7% 28,824 72.0% 36,980 25,227 27,646 32,206 37,517
Superior 6,811 42.3% 16,433 60.7% 16,537 16,678 18,277 21,292 24,803
(1) 1990 US Census (2) Census 2000 (3) Average of 1990 and 2000 % of median household income multiplied by estimated median household income (4) Maricopa CDP Census 2000 data
Pinal County Housing Needs Assessment – March 2008 Final Draft
Kuehl Enterprises LLC PO Box 642 Humboldt, AZ 86329 Page 21
Conclusions – Demographics and Economics
Basic economic theory suggests that where housing-job imbalances exist, either people will move to areas with more employment opportunities or employers will move to areas with more workforce opportunities. The housing market therefore impacts employment as well as employment impacting the housing market. If housing prices are higher than wages, then movement due to housing prices is less attractive. In Pinal County, housing prices have been low enough to cause movement of households from surrounding metropolitan areas. The future challenge, along with appropriate infrastructure and services, is to sustain the population growth with local employment opportunities that pay sufficiently to cover the housing costs. There are many ways the housing market can influence the economy. Housing is for many households the vast majority of their wealth and house price inflation impacts households’ ability to move within or outside of a market. On the other hand, the economy is influenced by the housing market as house prices might discourage or encourage migration of the workforce. Affordable housing costs generally allow for greater expenditure on local goods and services. Economic wealth invested in high housing costs is economic wealth not invested in local goods and services. House price inflation therefore impacts both workforce availability and the health of local goods- and services-producing businesses. These effects, along with socio-economic characteristics of households play a role in explaining the differences in housing markets across the County. Income trends and projections and employment-related data contribute to the quantification of demand for various housing types at various price points. Housing that is both attractive and affordable to a variety of people at diverse income levels is necessary to retain and attract diverse quality employment opportunities and to achieve a healthy, balanced community. • The economy of Pinal County communities may be categorized as commuter, self-sufficient, limited growth, and emerging. The following conclusions
are based on population and housing market growth from 2000 to 2006 yet assume that local employment and economies have remained relatively stable since the 2000 US Census. Where local economies have changed since 2000, communities and geographic areas may need to select a more suitable category given today’s economic conditions. 1. Commuter communities are those on the “fringe” of the major metropolitan areas or of other employment centers including Apache Junction,
Arizona City Maricopa, Queen Creek, Oracle and unincorporated areas near these communities and the metropolitan areas. 2. Self-sufficient communities are those where more than one-half of the employed population works in the same place they live. These
communities included Casa Grande, Florence, San Manuel, and the unincorporated areas near these communities. 3. Limited growth communities are those that experienced little population or housing growth during the housing boom. These communities are
more geographically isolated and their small size results in limited employment opportunities. These communities include Kearny, Mammoth, Superior and the unincorporated areas near these communities.
4. Emerging communities are those that have experienced some growth but the growth is not as explosive as that in the commuter communities. Commuting to nearby employment centers in a self-sufficient community is a likely scenario. Coolidge, Eloy and the unincorporated areas near these communities characterize emerging communities.
Pinal County Housing Needs Assessment – March 2008 Final Draft
Kuehl Enterprises LLC PO Box 642 Humboldt, AZ 86329 Page 22
• As Pinal County urbanizes, the economic well-being, as well as the health of the housing market in Pinal County are directly related to the economic well-being of the metropolitan areas. Most areas in Pinal County do not have sufficient employment opportunities to support the current population. More than 50% of the employed population commutes and a significant challenge moving forward is to expand local employment options and provide appropriate infrastructure and community services.
• Many households that moved to Pinal County during the housing boom chose to do so in order to qualify for homeownership. But “drive until you
quality” becomes less attractive as commute times lengthen and housing near employment centers becomes increasingly affordable. • Construction and related industries have played a major role in the expansion of the economy in Pinal County. As the housing market slows and
employment in these industries declines, the housing market may be impacted by unemployment and increased foreclosures or loss of population. Those communities with a stable local employment base are least likely to experience negative impacts from this decline.
• The aging of the population in general and the attractiveness of Pinal County as an active retirement area, add to the stability of the economy and the
housing market. Housing for an aging population and for the workforce that is employed in serving an aging population is critical to future economic stability throughout the County.
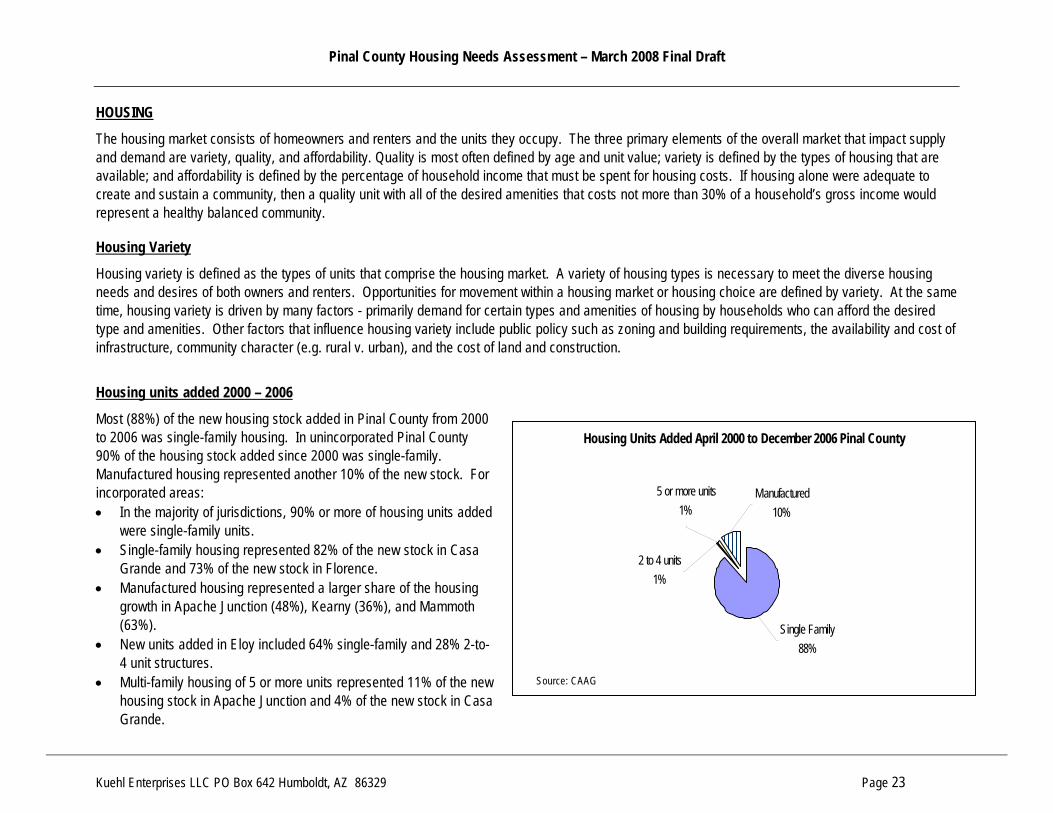
Pinal County Housing Needs Assessment – March 2008 Final Draft
Kuehl Enterprises LLC PO Box 642 Humboldt, AZ 86329 Page 23
HOUSING
The housing market consists of homeowners and renters and the units they occupy. The three primary elements of the overall market that impact supply and demand are variety, quality, and affordability. Quality is most often defined by age and unit value; variety is defined by the types of housing that are available; and affordability is defined by the percentage of household income that must be spent for housing costs. If housing alone were adequate to create and sustain a community, then a quality unit with all of the desired amenities that costs not more than 30% of a household’s gross income would represent a healthy balanced community.
Housing Variety
Housing variety is defined as the types of units that comprise the housing market. A variety of housing types is necessary to meet the diverse housing needs and desires of both owners and renters. Opportunities for movement within a housing market or housing choice are defined by variety. At the same time, housing variety is driven by many factors - primarily demand for certain types and amenities of housing by households who can afford the desired type and amenities. Other factors that influence housing variety include public policy such as zoning and building requirements, the availability and cost of infrastructure, community character (e.g. rural v. urban), and the cost of land and construction.
Housing units added 2000 – 2006
Most (88%) of the new housing stock added in Pinal County from 2000 to 2006 was single-family housing. In unincorporated Pinal County 90% of the housing stock added since 2000 was single-family. Manufactured housing represented another 10% of the new stock. For incorporated areas: • In the majority of jurisdictions, 90% or more of housing units added
were single-family units. • Single-family housing represented 82% of the new stock in Casa
Grande and 73% of the new stock in Florence. • Manufactured housing represented a larger share of the housing
growth in Apache Junction (48%), Kearny (36%), and Mammoth (63%).
• New units added in Eloy included 64% single-family and 28% 2-to-4 unit structures.
• Multi-family housing of 5 or more units represented 11% of the new housing stock in Apache Junction and 4% of the new stock in Casa Grande.
Housing Units Added April 2000 to December 2006 Pinal County
2 to 4 units1%
Manufactured10%
5 or more units1%
Single Family88%
Source: CAAG

Pinal County Housing Needs Assessment – March 2008 Final Draft
Kuehl Enterprises LLC PO Box 642 Humboldt, AZ 86329 Page 24
TRENDS IN HOUSING VARIETY BY JURISDICTION - 2000 TO 2006
Trends in Housing Variety Unincorporated Pinal County 2000 - 2006
0
10000
20000
30000
40000
50000
60000
Single Family 2 or more Manufactured
Sources: Census 2000, CAAG2000 2006
Single Family
0
2,000
4,000
6,000
8,000
10,000
12,000
ApacheJunction
CasaGrande
Coolidge Eloy Florence Kearny Mammoth Maricopa QueenCreek
Superior
2000 2006
2 or more units
0
2,000
4,000
6,000
8,000
10,000
12,000
ApacheJunction
CasaGrande
Coolidge Eloy Florence Kearny Mammoth Maricopa QueenCreek
Superior
2000 2006
Manufactured Housing / Mobile Homes
0
2,000
4,000
6,000
8,000
10,000
12,000
14,000
ApacheJunction
CasaGrande
Coolidge Eloy Florence Kearny Mammoth Maricopa QueenCreek
Superior
2000 2006

Pinal County Housing Needs Assessment – March 2008 Final Draft
Kuehl Enterprises LLC PO Box 642 Humboldt, AZ 86329 Page 25
TABLE 11 - HOUSING VARIETY (TYPE OF STRUCTURE AND UNITS IN STRUCTURE) BY JURISDICTION 2006
Total
Units (1) Single-family detached
and attached 2 to 4 units 5 or more units
Manufactured Housing / Mobile
Homes
No. % No. % No. % No. %
Pinal County 137,687 89,146 64.7% 4,312 3.1% 5,057 3.7% 35,975 26.1%
Unincorporated Pinal County 69,009 50,005 72.5% 1,091 1.6% 370 0.5% 16,694 24.2%
Apache Junction (Pinal Co Part) 25,860 7,738 29.9% 1,132 4.4% 1,383 5.3% 12,888 49.8%
Casa Grande 17,601 11,552 65.6% 1,072 6.1% 2,351 13.4% 2,777 15.8%
Coolidge 4,472 3,363 75.2% 235 5.3% 236 5.3% 642 14.4%
Eloy 3,159 1,892 59.9% 331 10.5% 289 9.1% 733 23.2%
Florence 3,761 1,619 43.0% 321 8.5% 285 7.6% 1,623 43.2%
Kearny 882 760 86.2% 29 3.3% 25 2.8% 74 8.4%
Mammoth 687 403 58.7% 38 5.5% 39 5.7% 208 30.3%
Maricopa (2) 10,565 10,413 98.6% 6 0.1% 0 0.0% 146 1.4%
Queen Creek (Pinal Co Part) 160 134 83.8% 0 0.0% 0 0.0% 26 16.3%
Superior 1,531 1,267 82.8% 57 3.7% 79 5.2% 164 10.7%
Sources: Central Arizona Association of Governments and Census 2000 (1) Includes Census 2000 “other” units (boats, buses, RVs) (2) Maricopa CDP Census 2000 data
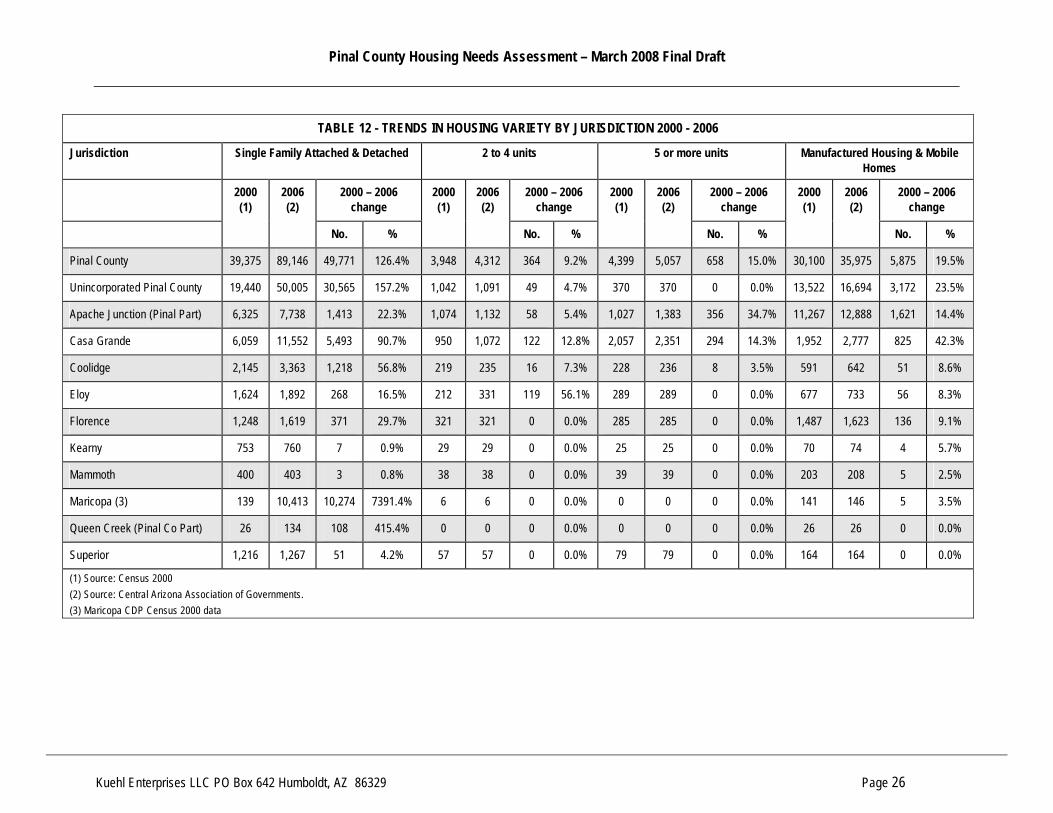
Pinal County Housing Needs Assessment – March 2008 Final Draft
Kuehl Enterprises LLC PO Box 642 Humboldt, AZ 86329 Page 26
TABLE 12 - TRENDS IN HOUSING VARIETY BY JURISDICTION 2000 - 2006
Jurisdiction Single Family Attached & Detached 2 to 4 units 5 or more units Manufactured Housing & Mobile Homes
2000 – 2006 change
2000 – 2006 change
2000 – 2006 change
2000 – 2006 change
2000 (1)
2006 (2)
No. %
2000 (1)
2006 (2)
No. %
2000 (1)
2006 (2)
No. %
2000 (1)
2006 (2)
No. %
Pinal County 39,375 89,146 49,771 126.4% 3,948 4,312 364 9.2% 4,399 5,057 658 15.0% 30,100 35,975 5,875 19.5%
Unincorporated Pinal County 19,440 50,005 30,565 157.2% 1,042 1,091 49 4.7% 370 370 0 0.0% 13,522 16,694 3,172 23.5%
Apache Junction (Pinal Part) 6,325 7,738 1,413 22.3% 1,074 1,132 58 5.4% 1,027 1,383 356 34.7% 11,267 12,888 1,621 14.4%
Casa Grande 6,059 11,552 5,493 90.7% 950 1,072 122 12.8% 2,057 2,351 294 14.3% 1,952 2,777 825 42.3%
Coolidge 2,145 3,363 1,218 56.8% 219 235 16 7.3% 228 236 8 3.5% 591 642 51 8.6%
Eloy 1,624 1,892 268 16.5% 212 331 119 56.1% 289 289 0 0.0% 677 733 56 8.3%
Florence 1,248 1,619 371 29.7% 321 321 0 0.0% 285 285 0 0.0% 1,487 1,623 136 9.1%
Kearny 753 760 7 0.9% 29 29 0 0.0% 25 25 0 0.0% 70 74 4 5.7%
Mammoth 400 403 3 0.8% 38 38 0 0.0% 39 39 0 0.0% 203 208 5 2.5%
Maricopa (3) 139 10,413 10,274 7391.4% 6 6 0 0.0% 0 0 0 0.0% 141 146 5 3.5%
Queen Creek (Pinal Co Part) 26 134 108 415.4% 0 0 0 0.0% 0 0 0 0.0% 26 26 0 0.0%
Superior 1,216 1,267 51 4.2% 57 57 0 0.0% 79 79 0 0.0% 164 164 0 0.0%
(1) Source: Census 2000 (2) Source: Central Arizona Association of Governments. (3) Maricopa CDP Census 2000 data
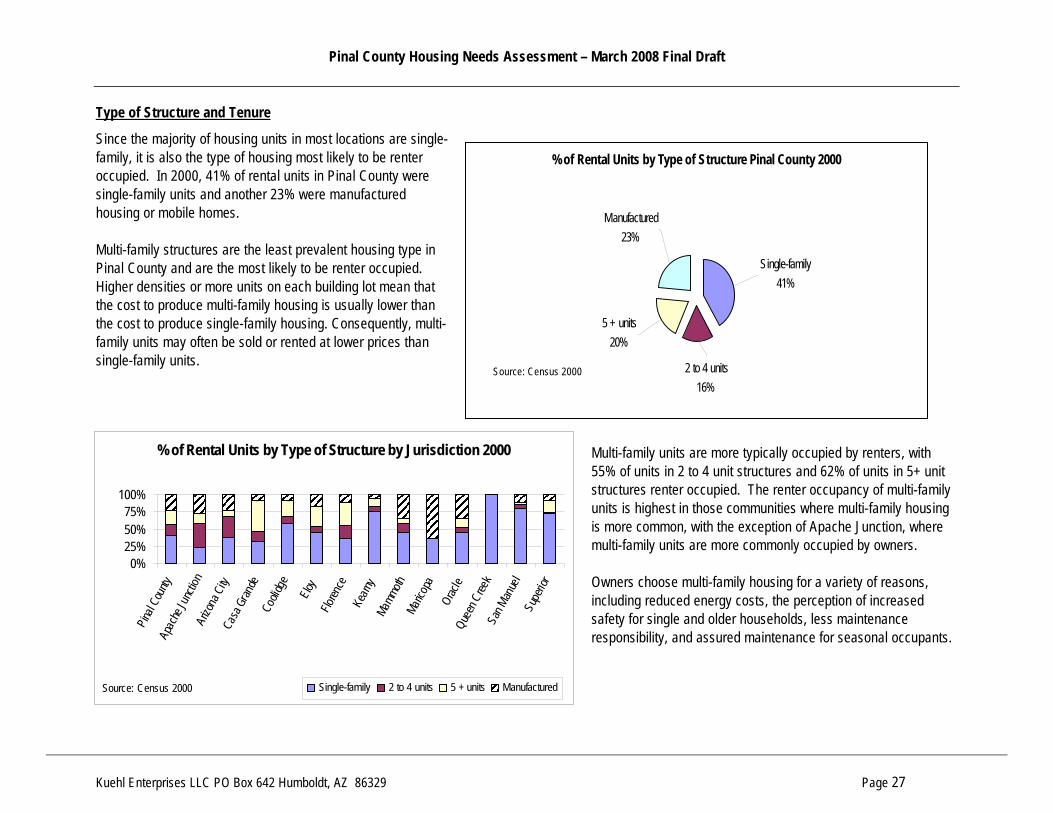
Pinal County Housing Needs Assessment – March 2008 Final Draft
Kuehl Enterprises LLC PO Box 642 Humboldt, AZ 86329 Page 27
Type of Structure and Tenure
Since the majority of housing units in most locations are single-family, it is also the type of housing most likely to be renter occupied. In 2000, 41% of rental units in Pinal County were single-family units and another 23% were manufactured housing or mobile homes. Multi-family structures are the least prevalent housing type in Pinal County and are the most likely to be renter occupied. Higher densities or more units on each building lot mean that the cost to produce multi-family housing is usually lower than the cost to produce single-family housing. Consequently, multi-family units may often be sold or rented at lower prices than single-family units.
Multi-family units are more typically occupied by renters, with 55% of units in 2 to 4 unit structures and 62% of units in 5+ unit structures renter occupied. The renter occupancy of multi-family units is highest in those communities where multi-family housing is more common, with the exception of Apache Junction, where multi-family units are more commonly occupied by owners. Owners choose multi-family housing for a variety of reasons, including reduced energy costs, the perception of increased safety for single and older households, less maintenance responsibility, and assured maintenance for seasonal occupants.
% of Rental Units by Type of Structure Pinal County 2000
Manufactured23%
5 + units20%
2 to 4 units16%
Single-family41%
Source: Census 2000
% of Rental Units by Type of Structure by Jurisdiction 2000
0%25%50%75%
100%
Pinal
Coun
tyAp
ache
Junc
tion
Arizo
na C
ityCa
sa G
rande
Cooli
dge
Eloy
Floren
ceKe
arny
Mamm
othMa
ricop
aOr
acle
Quee
n Cree
kSa
n Man
uel
Supe
rior
Source: Census 2000 Single-family 2 to 4 units 5 + units Manufactured

Pinal County Housing Needs Assessment – March 2008 Final Draft
Kuehl Enterprises LLC PO Box 642 Humboldt, AZ 86329 Page 28
Occupancy and Vacancy
The proportion of occupied units and the vacancy status of vacant units reflect both demand for housing in general and the primary use(s) of housing units. General occupancy and tenure data serve as the basis by which other housing data related to quality, variety and affordability may be assessed.
Occupancy rates throughout Pinal County range from a low of 60% in Apache Junction to a high of approximately 90% in Eloy. Overall, the occupancy rate in Pinal County is 76%. Eighty-two percent of units in the unincorporated County are occupied. The vacancy status of vacant housing units is a key indicator of the demand for housing. A large volume of vacant units for sale or for rent indicates an oversupply. A large volume of vacant units that are neither sold nor rented or for sale or rented, indicates a potential supply of housing that is uninhabitable or privately-held for seasonal employees, such as farmworkers. The majority (62%) of vacant housing units in Pinal County are seasonal units. In 2000, over one-half of the County’s seasonal units
were located in Apache Junction and another quarter were located in the unincorporated County. Seasonal units were least prevalent in Eloy (2%) and Superior (9%). The Eastern County communities of Kearny, Mammoth, Oracle and San Manuel all had fewer than one-quarter of vacant units as seasonal vacancies. Among non-seasonal vacancies in Pinal County, nearly four of ten (37%) vacant units were for rent, 27% for sale and 25% classified as other. The highest proportion of for rent vacant units was in Eloy (64%) and of for sale vacant units was in Kearny (45%). Vacant units defined as “other” accounted for the majority of vacancies in Coolidge, Oracle and Superior.
Occupancy and Vacancy by Geographic Area 2000
0%
20%
40%
60%
80%
100%
Uninc C
ounty
Apache
Junct
ionArizo
na City
Casa G
rande
Coolidg
e
EloyFlo
rence
Kearny
Mammoth
Marico
pa
Oracle
San M
anue
l
Source: Census 2000 Occupied No. Vacant No.
Vacancy Status by Geographic Area 2000
0%
20%
40%
60%
80%
100%
Uninc
Cou
nty
Apac
he Ju
nctio
nAr
izona
City
Casa
Gra
nde
Cool
idge
Eloy
Flor
ence
Kear
nyM
amm
oth
Mar
icop
a
Ora
cleSa
n M
anue
lSu
perio
r
Source: Census 2000 Seasonal For Rent For Sale Rented or Sold Other

Pinal County Housing Needs Assessment – March 2008 Final Draft
Kuehl Enterprises LLC PO Box 642 Humboldt, AZ 86329 Page 29
TABLE 13 - OCCUPANCY, TENURE AND VACANCY FOR ALL UNITS BY JURISDICTION 2000
Total Occupied Owner Occupied Renter Occupied Vacant Seasonal
No. % of
Jurisdiction No.
% of Occupied
Units No.
% of Occupied
Units No.
% of Jurisdictio
n No.
% of Vacant Units
Pinal County 81,154 61,364 75.6% 47,522 77.4% 13,842 22.6% 19,790 24.4% 12,230 61.8%
Unincorporated Pinal County 35,223 28,675 81.4% 23,593 82.3% 5,082 17.7% 6,548 18.6% 3,416 52.2%
Apache Junction (Pinal Co Part) 22,456 13,570 60.4% 11,249 82.9% 2,321 17.1% 8,886 39.6% 6,930 78.0%
Arizona City 2,169 1,742 80.4% 1,459 83.8% 283 16.2% 427 24.5% 254 59.5%
Casa Grande 10,936 8,905 81.4% 5,654 63.5% 3,251 36.5% 2,031 18.6% 823 40.5%
Coolidge 3,179 2,603 81.9% 1,734 66.6% 869 33.4% 576 18.1% 316 54.9%
Eloy 2,737 2,472 90.3% 1,590 64.3% 882 35.7% 265 9.7% 6 2.3%
Florence 3,255 2,233 68.6% 1,549 69.4% 684 30.6% 1,022 31.4% 671 65.7%
Kearny 871 789 90.6% 644 81.6% 145 18.4% 82 9.4% 17 20.7%
Mammoth 679 562 82.8% 430 76.5% 132 23.5% 117 17.2% 18 15.4%
Maricopa CDP 286 268 93.7% 139 51.9% 129 48.1% 18 6.3% 12 66.7%
Oracle 1,571 1,369 87.1% 1,022 74.7% 347 25.3% 202 12.9% 48 23.8%
Queen Creek (Pinal Co Part) 52 52 100.0% 46 88.5% 6 11.5% 0 0.0% 0 0.0%
San Manuel 1,832 1,458 79.6% 1,204 82.6% 254 17.4% 374 20.4% 85 22.7%
Superior 1,480 1,235 83.4% 894 72.4% 341 27.6% 245 16.6% 21 8.6%
Source: Census 2000
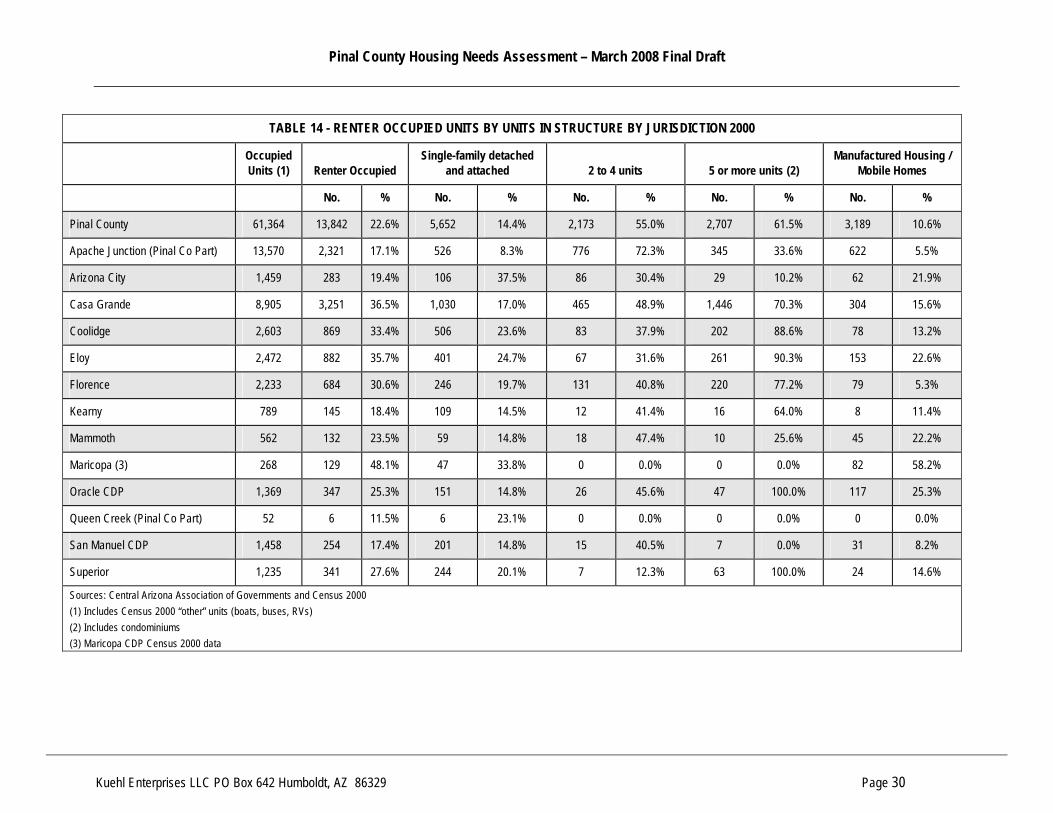
Pinal County Housing Needs Assessment – March 2008 Final Draft
Kuehl Enterprises LLC PO Box 642 Humboldt, AZ 86329 Page 30
TABLE 14 - RENTER OCCUPIED UNITS BY UNITS IN STRUCTURE BY JURISDICTION 2000
Occupied Units (1) Renter Occupied
Single-family detached and attached 2 to 4 units 5 or more units (2)
Manufactured Housing / Mobile Homes
No. % No. % No. % No. % No. %
Pinal County 61,364 13,842 22.6% 5,652 14.4% 2,173 55.0% 2,707 61.5% 3,189 10.6%
Apache Junction (Pinal Co Part) 13,570 2,321 17.1% 526 8.3% 776 72.3% 345 33.6% 622 5.5%
Arizona City 1,459 283 19.4% 106 37.5% 86 30.4% 29 10.2% 62 21.9%
Casa Grande 8,905 3,251 36.5% 1,030 17.0% 465 48.9% 1,446 70.3% 304 15.6%
Coolidge 2,603 869 33.4% 506 23.6% 83 37.9% 202 88.6% 78 13.2%
Eloy 2,472 882 35.7% 401 24.7% 67 31.6% 261 90.3% 153 22.6%
Florence 2,233 684 30.6% 246 19.7% 131 40.8% 220 77.2% 79 5.3%
Kearny 789 145 18.4% 109 14.5% 12 41.4% 16 64.0% 8 11.4%
Mammoth 562 132 23.5% 59 14.8% 18 47.4% 10 25.6% 45 22.2%
Maricopa (3) 268 129 48.1% 47 33.8% 0 0.0% 0 0.0% 82 58.2%
Oracle CDP 1,369 347 25.3% 151 14.8% 26 45.6% 47 100.0% 117 25.3%
Queen Creek (Pinal Co Part) 52 6 11.5% 6 23.1% 0 0.0% 0 0.0% 0 0.0%
San Manuel CDP 1,458 254 17.4% 201 14.8% 15 40.5% 7 0.0% 31 8.2%
Superior 1,235 341 27.6% 244 20.1% 7 12.3% 63 100.0% 24 14.6%
Sources: Central Arizona Association of Governments and Census 2000 (1) Includes Census 2000 “other” units (boats, buses, RVs) (2) Includes condominiums (3) Maricopa CDP Census 2000 data

Pinal County Housing Needs Assessment – March 2008 Final Draft
Kuehl Enterprises LLC PO Box 642 Humboldt, AZ 86329 Page 31
Tenure
The tenure (owner or renter) of occupied units is another indicator of demand that further defines the housing market. From the individual homeowner perspective, the focus of homeownership is on neighborhood stability and the increase or (at a minimum) maintenance of housing value. At the same time that existing owners seek to sustain or grow their housing wealth, a growing proportion of the population is on a fixed income, and employment opportunities are growing fastest in lower-wage occupations and industries, creating demand for lower-priced housing units both for rent and for sale. It is a widely-held belief that homeowners contribute to community stability through their financial investment and that they seek to maintain and grow that investment through greater participation in the community. Consequently, areas with high homeownership rates are less vulnerable to displacement from gentrification and rising housing prices. The national goal of increasing homeownership has resulted in a focus of resources on increasing the homeownership rate. The goal of most homeownership programs is to achieve a homeownership rate of 70%. In 2000, this goal had been achieved in most jurisdictions and for the County as a whole. Lower homeownership rates were found in Casa Grande (64%), Coolidge (67%), Eloy (64%) and Maricopa (52%). These communities also have a larger proportion of households headed by younger persons. During a housing boom, renters often seek to purchase a home before prices rise even more. The increased demand results in increased purchase prices. Still, the inter-relationship of the two markets (rental and owner) plays out over time. As more renters choose to buy and prices increase, rental vacancy rates also increase and rents go down. As landlords have difficulty renting units, they may choose to sell and selling prices go down as the supply of for-sale units increases. From a community standpoint, renting provides the opportunity for households to learn more about a neighborhood or community before making a homeownership investment, and provides for mobility among the workforce. Working households that own a home are more likely to seek local or nearby employment while renters are as likely to move closer to employment opportunities as they are to seek work close to home.
Tenure by Geographic Area 2000
0%
25%
50%
75%
100%
Uninc
Cou
ntyAp
ache
Junc
tion
Arizo
na C
ityCa
sa G
rande
Cooli
dge
Eloy
Floren
ceKe
arny
Mamm
othMa
ricop
a
Orac
leQu
een C
reek
San M
anue
lSu
perio
r
Source: Census 2000 Owner Renter

Pinal County Housing Needs Assessment – March 2008 Final Draft
Kuehl Enterprises LLC PO Box 642 Humboldt, AZ 86329 Page 32
From a household perspective, renting is chosen over homeownership for a variety of reasons: • Renting may be less expensive than owning, especially during the first five years; • Rental units are most often maintained and repaired by their owners, so unplanned and sometimes-costly repairs are not the renter’s
responsibility; • Less time spent on maintenance and repairs equals more free time; • Renting carries less financial risk, especially in volatile markets.
Tenure, Income and Family Type
Housing tenure varies with such demographic factors as income, age, occupation, and household type. The choice of whether to buy or rent depends in part on a household’s financial situation. In turn, a household’s financial situation depends on their employment. Inversely, the search for decent, safe and affordable housing impacts employment and the economy in general. Employment status, age, familial status, and income all affect the choice of housing tenure. The number of wage earners in a household also effects housing tenure as it means more household income. Not surprisingly, homeownership is linked to higher income. In 2000, the median income for Pinal County homeowners was $39,140 (110% of the County median), while the median income for renters was $24,416 (68% of the County median). There are community-to-community differences in tenure, which may be related to employment. This is because for the vast majority of households, homeownership is considered when stable employment is available. At the same time, high housing costs in one area might discourage workers from moving to that area and taking employment, even when employment is readily available, and low housing costs do not necessarily encourage workers to move.
Median Income by Tenure by Geographic Area 2000
0
15000
30000
45000
Pinal County
Apache Ju
nction
Arizona C
ityCasa
Grande
Coolidge
EloyFloren
ce
KearnyMammothMarico
pa
Oracle
San ManuelSuperio
r
Source: Census 2000 Owner Renter Median

Pinal County Housing Needs Assessment – March 2008 Final Draft
Kuehl Enterprises LLC PO Box 642 Humboldt, AZ 86329 Page 33
The rate of homeownership increases as age increases, and remains relatively high after the age of 35. This suggests that a proportion of the population will choose renting over owning, regardless of socio-economic factors such as age, income or family type. In general, younger households are more likely to rent, while older households are more likely to own. Older and retired households generally have pensions or other retirement income. These households are also less likely to have a mortgage or require financing than households with wages and salaries, primarily due to accumulated wealth. The homeownership rate decreases after the age of 75 years, when renting, including congregate and continuing care residences, assisted housing, and skilled nursing care becomes more attractive. Homeownership rates are also impacted by family type. Owned property is often considered more stable and is therefore likely more sought after by married couple families, with or without dependent children; this family type generally has a high homeownership rate. Couples in which both adults work and have no children have a higher income and are among the most likely to own. The household type that is least likely to own is the single-parent household with dependent children.
Homeownership Rate by Age 2000
0.0%20.0%40.0%60.0%80.0%
100.0%
15 to
24
25 to
34
35 to
44
45 to
54
55 to
64
65 to
74
75 &
Olde
r
Source: Census 2000 By Age Pinal County
Homeownership Rate by Family Type Pinal County 2000
0.0%
25.0%
50.0%
75.0%
100.0%
Single Persons Married couples withchildren <18 years
Married couples with nochildren <18 years
Single-parents withchildren <18years
Other families
Source: Census 2000 Family Type Pinal County
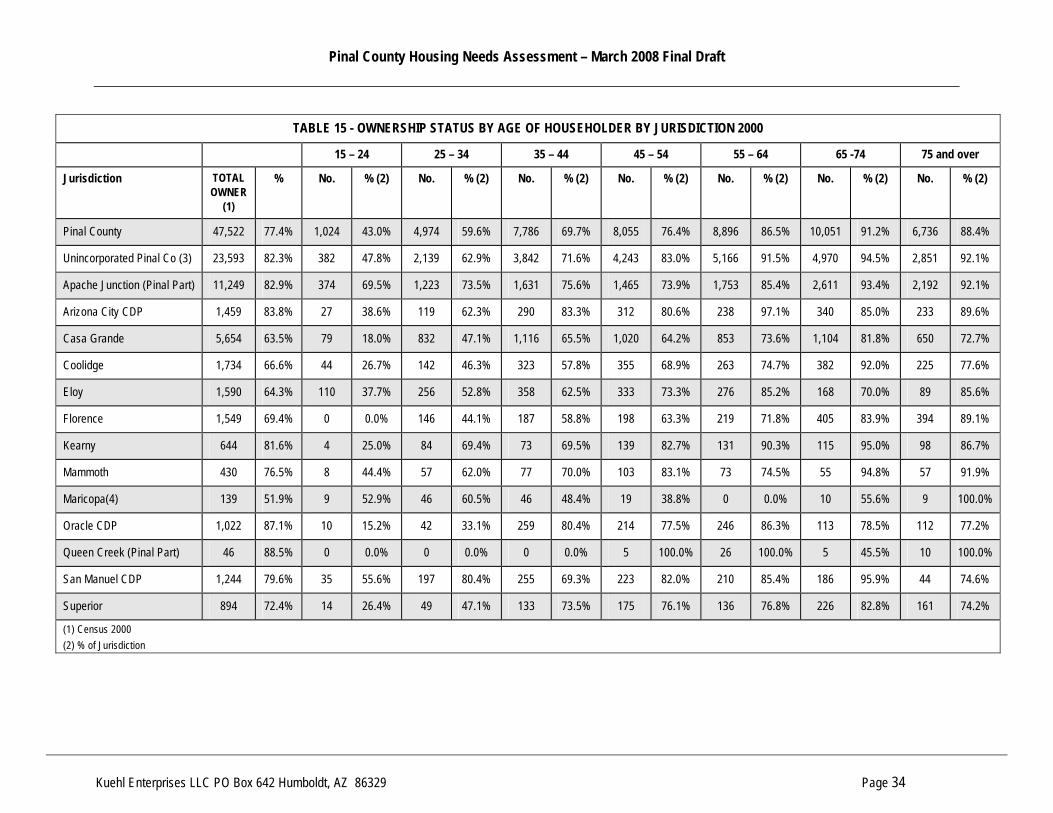
Pinal County Housing Needs Assessment – March 2008 Final Draft
Kuehl Enterprises LLC PO Box 642 Humboldt, AZ 86329 Page 34
TABLE 15 - OWNERSHIP STATUS BY AGE OF HOUSEHOLDER BY JURISDICTION 2000
15 – 24 25 – 34 35 – 44 45 – 54 55 – 64 65 -74 75 and over
Jurisdiction TOTAL OWNER
(1)
% No. % (2) No. % (2) No. % (2) No. % (2) No. % (2) No. % (2) No. % (2)
Pinal County 47,522 77.4% 1,024 43.0% 4,974 59.6% 7,786 69.7% 8,055 76.4% 8,896 86.5% 10,051 91.2% 6,736 88.4%
Unincorporated Pinal Co (3) 23,593 82.3% 382 47.8% 2,139 62.9% 3,842 71.6% 4,243 83.0% 5,166 91.5% 4,970 94.5% 2,851 92.1%
Apache Junction (Pinal Part) 11,249 82.9% 374 69.5% 1,223 73.5% 1,631 75.6% 1,465 73.9% 1,753 85.4% 2,611 93.4% 2,192 92.1%
Arizona City CDP 1,459 83.8% 27 38.6% 119 62.3% 290 83.3% 312 80.6% 238 97.1% 340 85.0% 233 89.6%
Casa Grande 5,654 63.5% 79 18.0% 832 47.1% 1,116 65.5% 1,020 64.2% 853 73.6% 1,104 81.8% 650 72.7%
Coolidge 1,734 66.6% 44 26.7% 142 46.3% 323 57.8% 355 68.9% 263 74.7% 382 92.0% 225 77.6%
Eloy 1,590 64.3% 110 37.7% 256 52.8% 358 62.5% 333 73.3% 276 85.2% 168 70.0% 89 85.6%
Florence 1,549 69.4% 0 0.0% 146 44.1% 187 58.8% 198 63.3% 219 71.8% 405 83.9% 394 89.1%
Kearny 644 81.6% 4 25.0% 84 69.4% 73 69.5% 139 82.7% 131 90.3% 115 95.0% 98 86.7%
Mammoth 430 76.5% 8 44.4% 57 62.0% 77 70.0% 103 83.1% 73 74.5% 55 94.8% 57 91.9%
Maricopa(4) 139 51.9% 9 52.9% 46 60.5% 46 48.4% 19 38.8% 0 0.0% 10 55.6% 9 100.0%
Oracle CDP 1,022 87.1% 10 15.2% 42 33.1% 259 80.4% 214 77.5% 246 86.3% 113 78.5% 112 77.2%
Queen Creek (Pinal Part) 46 88.5% 0 0.0% 0 0.0% 0 0.0% 5 100.0% 26 100.0% 5 45.5% 10 100.0%
San Manuel CDP 1,244 79.6% 35 55.6% 197 80.4% 255 69.3% 223 82.0% 210 85.4% 186 95.9% 44 74.6%
Superior 894 72.4% 14 26.4% 49 47.1% 133 73.5% 175 76.1% 136 76.8% 226 82.8% 161 74.2%
(1) Census 2000 (2) % of Jurisdiction

Pinal County Housing Needs Assessment – March 2008 Final Draft
Kuehl Enterprises LLC PO Box 642 Humboldt, AZ 86329 Page 35
TABLE 16 - HOMEOWNERSHIP BY FAMILY TYPE BY JURISDICTION 2000
Single-person Married couples with children <18
Married couples with no children <18
Single parents with children <18
All other families
Jurisdiction Total Owners % Owners
Total Owners % Owners
Total Owners % Owners
Total Owners % Owners
Total Owners % Owners
Pinal County 12,906 9,194 71.2% 12,352 9,058 73.3% 23,121 21,164 91.5% 6,313 3,248 51.4% 3,678 2,040 55.5%
Unincorporated Pinal County 5,078 3,930 77.4% 5,735 4,265 74.4% 12,607 11,716 92.9% 2,503 1,478 57.2% 1,524 968 63.5%
Apache Junction (Pinal Part) 3,634 2,946 81.1% 2,097 1,666 79.4% 4,997 4,632 92.7% 1,008 677 67.2% 769 709 92.2%
Arizona City CDP 320 241 75.3% 334 250 74.9% 843 761 90.3% 129 88 68.2% 151 119 78.8%
Casa Grande 1,944 982 50.5% 2,171 1,430 65.9% 2,573 2,216 86.1% 1,221 476 39.0% 516 162 31.4%
Coolidge 536 319 59.5% 547 409 74.8% 712 650 91.3% 437 141 32.3% 271 32 11.8%
Eloy 404 248 61.4% 817 547 67.0% 461 371 80.5% 504 224 44.4% 218 62 28.4%
Florence 614 346 56.4% 353 279 79.0% 842 755 89.7% 200 68 34.0% 139 41 29.5%
Kearny 167 129 77.2% 229 157 68.6% 299 265 88.6% 61 41 67.2% 47 15 31.9%
Mammoth 97 63 64.9% 145 121 83.4% 170 154 90.6% 90 44 48.9% 49 5 10.2%
Maricopa 65 0 0.0% 58 46 79.3% 25 10 40.0% 66 39 59.1% 45 20 44.4%
Oracle CDP 339 227 67.0% 305 266 87.2% 461 432 93.7% 144 45 31.3% 52 37 71.2%
Queen Creek (Pinal Co Part) 15 11 73.3% 4 4 100% 16 15 93.8% 0 0 0.0% 9 5 55.6%
San Manuel CDP 218 181 83.0% 506 390 77.1% 512 489 95.5% 129 80 62.0% 44 23 52.3%
Superior 352 220 62.5% 196 134 68.4% 419 380 90.7% 143 60 42.0% 91 21 23.1%
(1) Source: Census 2000 (2) % of Family Type Note: may not add to total owner households
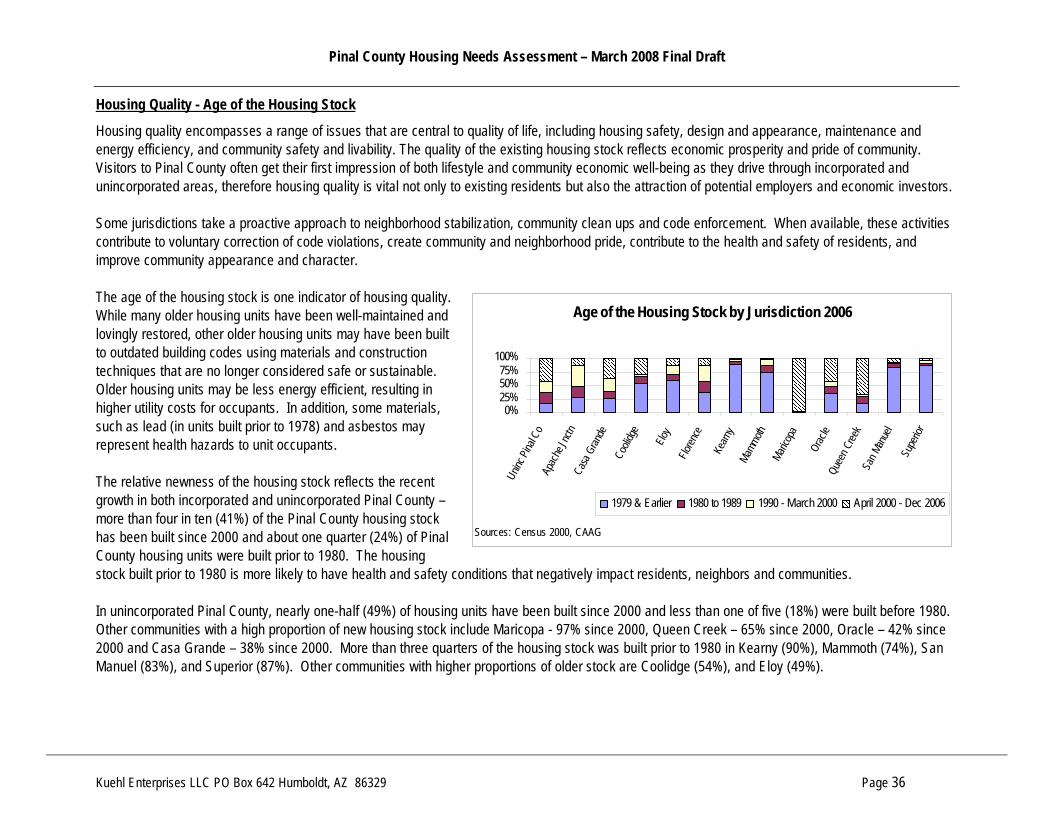
Pinal County Housing Needs Assessment – March 2008 Final Draft
Kuehl Enterprises LLC PO Box 642 Humboldt, AZ 86329 Page 36
Housing Quality - Age of the Housing Stock
Housing quality encompasses a range of issues that are central to quality of life, including housing safety, design and appearance, maintenance and energy efficiency, and community safety and livability. The quality of the existing housing stock reflects economic prosperity and pride of community. Visitors to Pinal County often get their first impression of both lifestyle and community economic well-being as they drive through incorporated and unincorporated areas, therefore housing quality is vital not only to existing residents but also the attraction of potential employers and economic investors. Some jurisdictions take a proactive approach to neighborhood stabilization, community clean ups and code enforcement. When available, these activities contribute to voluntary correction of code violations, create community and neighborhood pride, contribute to the health and safety of residents, and improve community appearance and character. The age of the housing stock is one indicator of housing quality. While many older housing units have been well-maintained and lovingly restored, other older housing units may have been built to outdated building codes using materials and construction techniques that are no longer considered safe or sustainable. Older housing units may be less energy efficient, resulting in higher utility costs for occupants. In addition, some materials, such as lead (in units built prior to 1978) and asbestos may represent health hazards to unit occupants. The relative newness of the housing stock reflects the recent growth in both incorporated and unincorporated Pinal County – more than four in ten (41%) of the Pinal County housing stock has been built since 2000 and about one quarter (24%) of Pinal County housing units were built prior to 1980. The housing stock built prior to 1980 is more likely to have health and safety conditions that negatively impact residents, neighbors and communities. In unincorporated Pinal County, nearly one-half (49%) of housing units have been built since 2000 and less than one of five (18%) were built before 1980. Other communities with a high proportion of new housing stock include Maricopa - 97% since 2000, Queen Creek – 65% since 2000, Oracle – 42% since 2000 and Casa Grande – 38% since 2000. More than three quarters of the housing stock was built prior to 1980 in Kearny (90%), Mammoth (74%), San Manuel (83%), and Superior (87%). Other communities with higher proportions of older stock are Coolidge (54%), and Eloy (49%).
Age of the Housing Stock by Jurisdiction 2006
0%25%50%75%
100%
Uninc
Pina
l Co
Apac
he Jn
ctnCa
sa G
rande
Cooli
dge
Eloy
Floren
ce
Kearn
yMam
mothMari
copa
Orac
leQu
een C
reek
San M
anue
lSu
perio
r
Sources: Census 2000, CAAG
1979 & Earlier 1980 to 1989 1990 - March 2000 April 2000 - Dec 2006

Pinal County Housing Needs Assessment – March 2008 Final Draft
Kuehl Enterprises LLC PO Box 642 Humboldt, AZ 86329 Page 37
TABLE 17 - AGE OF THE HOUSING STOCK BY JURISDICTION 2006
Apr 2000 - Dec 2006 (1) 1990 to March 2000 (2) 1980 to 1989 (2) 1960 to 1979 (2) 1959 or earlier (2)
Total No.
% of Jurisdiction No.
% of Jurisdiction No.
% of Jurisdiction No.
% of Jurisdiction No.
% of Jurisdiction
Pinal County 137,687 56,533 41.1% 31,327 22.8% 16,987 12.3% 23,707 17.2% 9,133 6.6%
Unincorporated Pinal County 69,009 33,786 49.0% 15,001 21.7% 7,540 10.9% 9,704 14.1% 2,978 4.3%
Apache Junction (Pinal Co Part) 25,860 3,404 13.2% 10,023 38.8% 5,389 20.8% 6,192 23.9% 852 3.3%
Casa Grande 17,601 6,665 37.9% 4,121 23.4% 2,162 12.3% 3,032 17.2% 1,621 9.2%
Coolidge 4,472 1,293 28.9% 239 5.3% 514 11.5% 1,329 29.7% 1,097 24.5%
Eloy 3,159 422 13.4% 530 16.8% 351 11.1% 1,252 39.6% 604 19.1%
Florence 3,761 506 13.5% 1,115 29.6% 764 20.3% 869 23.1% 507 13.5%
Kearny 882 11 1.2% 36 4.1% 51 5.8% 502 56.9% 282 32.0%
Mammoth 687 8 1.2% 83 12.1% 85 12.4% 312 45.4% 199 29.0%
Maricopa (3) 10,565 10,279 97.3% 76 0.7% 54 0.5% 130 1.2% 26 0.2%
Queen Creek (Pinal Co Part) 160 108 67.5% 5 3.1% 20 12.5% 27 16.9% 0 0.0%
Superior 1,531 51 3.3% 98 6.4% 57 3.7% 358 23.4% 967 63.2%
(1) Source: Central Arizona Association of Governments (2) Source: Census 2000 (3) Maricopa CDP Census 2000 data (4) Estimate based on estimated housing units less Census 2000 housing units data.

Pinal County Housing Needs Assessment – March 2008 Final Draft
Kuehl Enterprises LLC PO Box 642 Humboldt, AZ 86329 Page 38
Renters and Age of the Housing Stock
Owners of rental property are generally seeking financial benefit through current income generation, increased property value (appreciation), and depreciation (a tax benefit). All or some of these factors play a role in rental housing maintenance and older rental housing may offer fewer of these benefits to owners. Housing quality concerns can multiply when older housing stock is renter-occupied. Renters rely on owners to maintain properties, and owners of older housing stock may be challenged to do so as repairs mount and the cost of repairs does not increase the value of the property relative to the expected income that will be generated. In unincorporated Pinal County, renters are equally likely to occupy older housing as they are to occupy newer housing. With
the exception of Casa Grande, where newer multi-family housing units are more prevalent, renters are more likely to occupy housing built before 1980. In some communities such as Apache Junction, Coolidge, and Eloy the older housing stock is much more likely to be renter occupied than owner occupied. Countywide rental unit data provided by the Pinal County Assessor indicates that over four thousand new rental structures have been added to the market since 2000. This accounts for 61% of the registered rental structures. It is important to note however that other data, such as that available through the US Census Bureau suggests that many single-family rentals are not registered with the Assessor’s Office.
Registered Rental Units by Year Built
0500
100015002000
25003000
1979 & earlier 1980 to 1999 2000 to 2003 2004 to 2006
Source: Pinal County Assessor
Renters by Age of Housing Stock 2000
0%
25%50%
75%
100%
Uninc
Pina
l Co
Apac
he Ju
nctio
nAr
izona
City
Casa
Gran
deCo
olidg
e
Eloy
Floren
ceKe
arny
Mamm
othMa
ricop
aOr
acle
Quee
n Cree
kSa
n Man
uel
Supe
rior
Source: Census 2000 1980 & After 1979 & Before
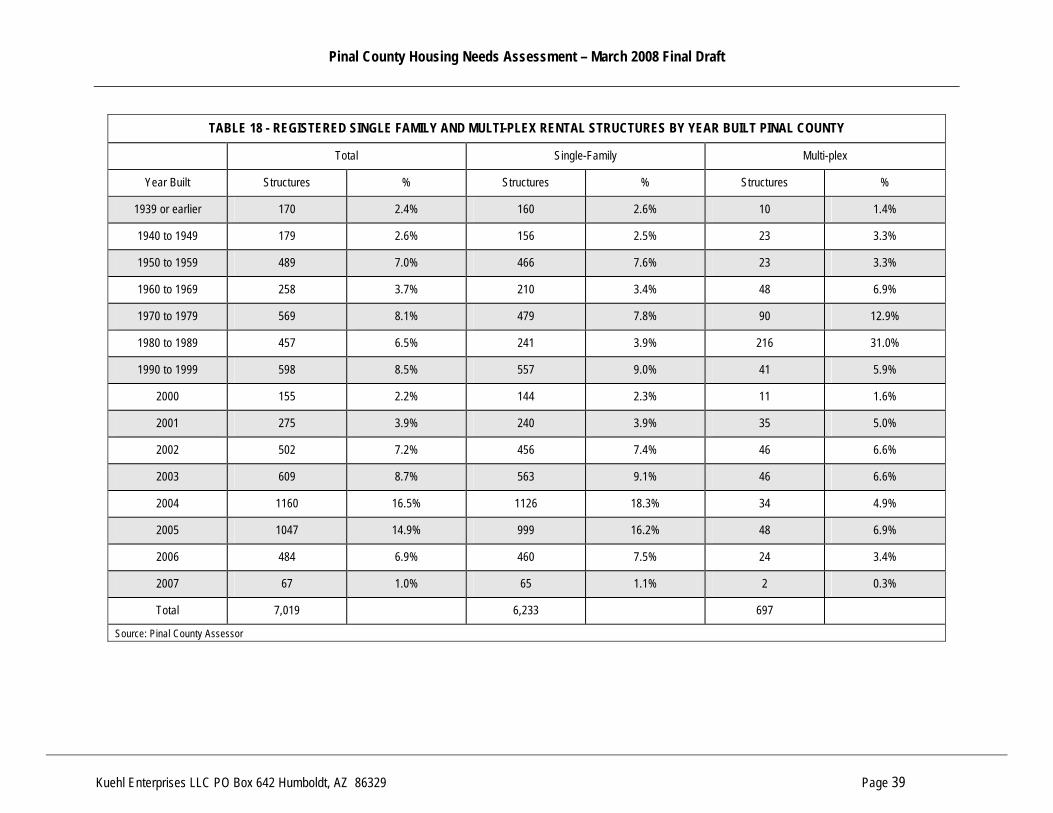
Pinal County Housing Needs Assessment – March 2008 Final Draft
Kuehl Enterprises LLC PO Box 642 Humboldt, AZ 86329 Page 39
TABLE 18 - REGISTERED SINGLE FAMILY AND MULTI-PLEX RENTAL STRUCTURES BY YEAR BUILT PINAL COUNTY
Total Single-Family Multi-plex
Year Built Structures % Structures % Structures %
1939 or earlier 170 2.4% 160 2.6% 10 1.4%
1940 to 1949 179 2.6% 156 2.5% 23 3.3%
1950 to 1959 489 7.0% 466 7.6% 23 3.3%
1960 to 1969 258 3.7% 210 3.4% 48 6.9%
1970 to 1979 569 8.1% 479 7.8% 90 12.9%
1980 to 1989 457 6.5% 241 3.9% 216 31.0%
1990 to 1999 598 8.5% 557 9.0% 41 5.9%
2000 155 2.2% 144 2.3% 11 1.6%
2001 275 3.9% 240 3.9% 35 5.0%
2002 502 7.2% 456 7.4% 46 6.6%
2003 609 8.7% 563 9.1% 46 6.6%
2004 1160 16.5% 1126 18.3% 34 4.9%
2005 1047 14.9% 999 16.2% 48 6.9%
2006 484 6.9% 460 7.5% 24 3.4%
2007 67 1.0% 65 1.1% 2 0.3%
Total 7,019 6,233 697
Source: Pinal County Assessor

Pinal County Housing Needs Assessment – March 2008 Final Draft
Kuehl Enterprises LLC PO Box 642 Humboldt, AZ 86329 Page 40
Housing Affordability
Housing affordability is a key measure of the economic health and viability of a community. A variety of economic and market factors contribute to housing affordability – income and employment, family size and type, age, housing variety and housing quality all play integral roles in the assessment. While government programs define affordability as paying not more than 30% of gross household income for total housing cost (rent or mortgage and utilities), this definition is more appropriate to lower and moderate income households than to higher income households. Both owners and renters may choose to occupy housing that is disproportionately costly to their income for any number of reasons - limited availability, specific locations or amenities are more attractive, income is anticipated to increase, affordable housing quality is poor, and work or family are nearby are only a few factors that impact housing choice. Therefore, a more accurate definition of housing affordability is adequate income to meet (local) housing costs with sufficient resources remaining for basic goods and services (purchased locally) and the generation of additional and/or future income. When housing is not affordable, individuals, businesses and communities feel the impact:
• Households with excessive housing costs have less disposable income for basic goods and services. • Households that work in one community but live in another community experience higher transportation costs and have both less disposable
income and time with family, impacting quality of life. • Employees that live in one community and work in another may purchase fewer basic goods and services in the community where they live,
negatively impacting local businesses and resulting in decreased sales tax revenue. • If housing costs are too high or the quality is poor, employers have difficulty attracting and retaining quality employees. For major employers,
housing affordability is often a key factor in location decisions. When housing prices increase due to a fundamental supply and demand equation, then both rental prices and ownership prices can be expected to increase comparably. During the housing boom of 2000 to 2006, the population increased 99%, rents increased an estimated 30%, and purchase prices increased an estimated 131%. Population growth early in the decade directly impacted housing prices as demand exceeded supply. Unit prices remained high even as the supply caught up with the demand. This suggests that the continued increase in housing costs during the housing boom had as much to do with a fundamental supply and demand imbalance as with other factors. These other factors, such as creative and liberal financing, and increased purchasing by retirees and investors had a significant impact on housing prices.
Estimated increase in Median Housing Cost by Tenure 2000 to 2006
30%
131%
0%
20%
40%
60%
80%
100%
120%
140%
Median Housing Price Median Rent

Pinal County Housing Needs Assessment – March 2008 Final Draft
Kuehl Enterprises LLC PO Box 642 Humboldt, AZ 86329 Page 41
Homeownership Affordability
Homeownership affordability and housing affordability in general are assessed considering both supply and demand factors. The supply side of the affordability equation is measured primarily through values and sales prices, existing and new home sales, and vacancy rates. The demand side of the equation is measured primarily through growth in employment and household wealth, population growth, and financing opportunities such as the types of financing available and the interest rate applied to the financing. Housing quality and variety influence both sides of the equation.
TABLE 19 - MEDIAN VALUE AND MEDIAN PRICE ASKED BY JURISDICTION 2000
Median Value Median Price Asked
$ $
Price asked as % of Value
Units in Sample
Pinal County 76,300 83,000 109% 1,240
Apache Junction (Pinal Co Part) 74,300 113,200 152% 254
Arizona City 85,000 80,500 95% 73
Casa Grande 79,900 80,000 100% 120
Coolidge 55,400 62,000 112% 22
Eloy 48,400 49,600 102% 27
Florence 71,600 75,600 106% 33
Kearny 56,600 52,100 92% 23
Mammoth 46,100 50,000 108% 14
Maricopa 75,500 0 n/a 0
Oracle 106,000 88,000 83% 8
Queen Creek (Pinal Co Part) 94,000 0 n/a 0
San Manuel 98,000 71,500 73% 60
Superior 45,400 37,500 83% 17
Source: Census 2000
Values and Sales Prices
When housing prices increase at a faster rate than incomes increase, then housing affordability declines. When housing prices remain stagnant or decline while household income increases, then affordability increases. Housing values directly impact the amount of funds that a buyer can borrow as well as the amount of taxes paid. Values are generally reflected in prices but during a time of high demand, prices can exceed values. Higher prices drive up values, as comparing prices is one method of determining value. Lenders provide financing up to a percentage of the value of a housing unit and this is one factor in determining whether a buyer is able to purchase a unit.
In 2000, the median value of a housing unit in Pinal County was $76,300 and the median price asked of for sale units was $83,000. Throughout the County, price asked in relationship to value ranged from a low of 73% in San Manuel to a high of 152% in Apache Junction. This difference may be explained by the volume and type of for-sale housing units.

Pinal County Housing Needs Assessment – March 2008 Final Draft
Kuehl Enterprises LLC PO Box 642 Humboldt, AZ 86329 Page 42
TABLE 20 - HOUSING VALUES BY VALUE RANGE – SELECTED SINGLE FAMILY UNITS 2000 BY JURISDICTION
$99,999 or less $100,000 to
$124,999 $125,000 to
$149,999 $150,000 to
$174,999 $175,000 to
$199,999 $200,000 to
$249,999 $250,000 to
$299,999 $300,000 or
more All Units
Pinal County 14,800 54.1% 3,653 13.4% 2,381 8.7% 1,912 7.0% 1,168 4.3% 1,484 5.4% 946 3.5% 996 3.6% 27,340
Apache Junction (Pinal Part) 2,520 52.0% 1,544 31.8% 488 10.1% 143 2.9% 46 0.9% 58 1.2% 33 0.7% 16 0.3% 4,848
Arizona City 712 64.6% 112 10.2% 137 12.4$ 115 10.4% 0 0.0% 10 0.9% 0 0.0% 0 0.0% 1,103
Casa Grande 2,830 64.6% 659 15.0% 339 7.7% 246 5.6% 139 3.2% 96 2.2% 51 1.2% 19 0.4% 4,379
Coolidge 1,342 92.4% 33 2.3% 28 1.9% 24 1.7% 11 0.8% 15 1.0% 0 0.0% 0 0.0% 1,453
Eloy 963 97.7% 6 0.6% 9 0.9% 8 0.8% 0 0.0% 0 0.0% 0 0.0% 0 0.0% 986
Florence 466 64.5% 173 24.0% 19 2.6% 27 3.7% 7 1.0% 22 3.0% 0 0.0% 8 1.1% 722
Kearny 548 94.0% 22 3.8% 9 1.5% 0 0.0% 0 0.0% 2 0.3% 0 0.0% 2 0.3% 583
Mammoth 284 97.3% 1 0.3% 0 0.0% 5 1.7% 0 0.0% 0 0.0% 0 0.0% 2 0.7% 292
Maricopa CDP 325 47.5% 0 0.0% 0 0.0% 117 17.1% 16 2.3% 7 1.0% 38 5.6% 0 0.0% 684
Oracle 312 45.6% 125 18.3% 69 10.1% 117 17.1% 16 2.3% 7 1.0% 38 5.6% 0 0.0% 684
Queen Creek (Pinal Co Part) 5 50.0% 0 0.0% 0 0.0% 5 50.0% 0 0.0% 0 0.0% 0 0.0% 0 0.0% 10
San Manuel 910 97.0% 14 1.5% 7 0.7% 7 0.7% 0 0.0% 0 0.0% 0 0.0% 0 0.0% 938
Superior 716 96.4% 18 2.4% 0 0.0% 0 0.0% 0 0.0% 0 0.0% 5 0.7% 4 0.5% 743
25,779 59.9% 6,248 14.5% 3,349 7.8% 2,494 5.8% 1,396 3.2% 1,684 3.9% 1,073 2.5% 1,047 2.4% 43,070
Source: Census 2000 Note: selected units do not include mobile homes, condominiums, or units on 10 or more acres
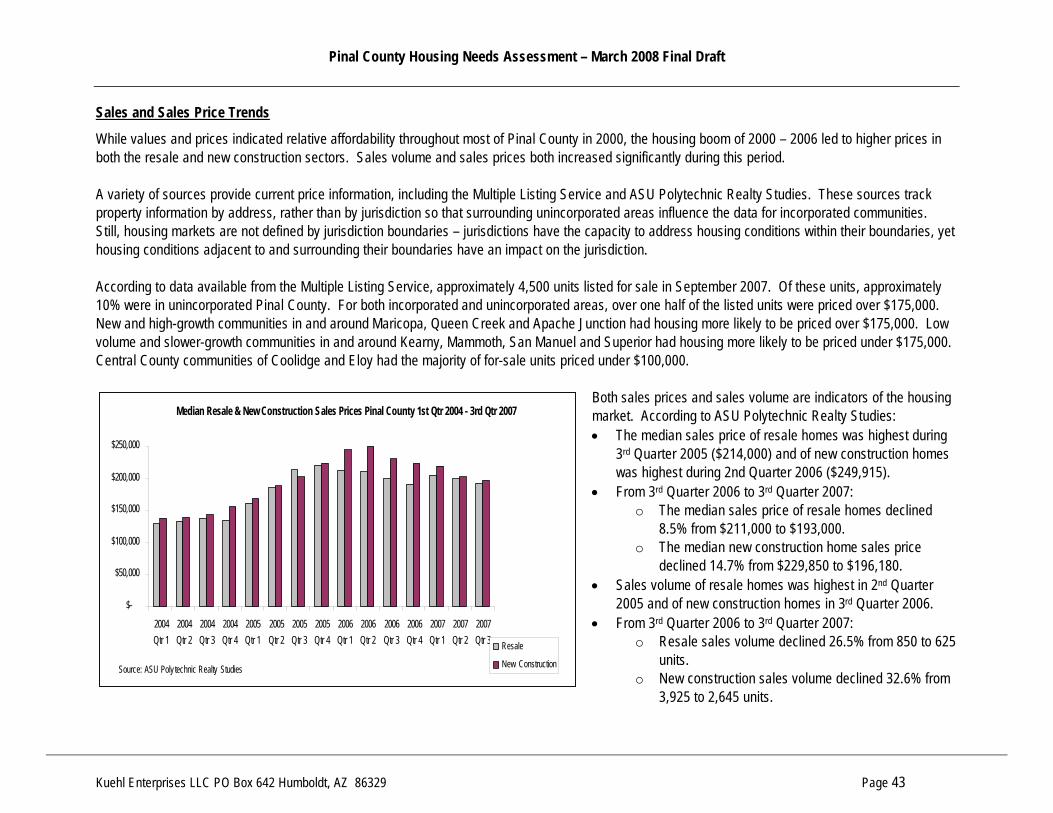
Pinal County Housing Needs Assessment – March 2008 Final Draft
Kuehl Enterprises LLC PO Box 642 Humboldt, AZ 86329 Page 43
Sales and Sales Price Trends
While values and prices indicated relative affordability throughout most of Pinal County in 2000, the housing boom of 2000 – 2006 led to higher prices in both the resale and new construction sectors. Sales volume and sales prices both increased significantly during this period. A variety of sources provide current price information, including the Multiple Listing Service and ASU Polytechnic Realty Studies. These sources track property information by address, rather than by jurisdiction so that surrounding unincorporated areas influence the data for incorporated communities. Still, housing markets are not defined by jurisdiction boundaries – jurisdictions have the capacity to address housing conditions within their boundaries, yet housing conditions adjacent to and surrounding their boundaries have an impact on the jurisdiction. According to data available from the Multiple Listing Service, approximately 4,500 units listed for sale in September 2007. Of these units, approximately 10% were in unincorporated Pinal County. For both incorporated and unincorporated areas, over one half of the listed units were priced over $175,000. New and high-growth communities in and around Maricopa, Queen Creek and Apache Junction had housing more likely to be priced over $175,000. Low volume and slower-growth communities in and around Kearny, Mammoth, San Manuel and Superior had housing more likely to be priced under $175,000. Central County communities of Coolidge and Eloy had the majority of for-sale units priced under $100,000.
Both sales prices and sales volume are indicators of the housing market. According to ASU Polytechnic Realty Studies: • The median sales price of resale homes was highest during
3rd Quarter 2005 ($214,000) and of new construction homes was highest during 2nd Quarter 2006 ($249,915).
• From 3rd Quarter 2006 to 3rd Quarter 2007: o The median sales price of resale homes declined
8.5% from $211,000 to $193,000. o The median new construction home sales price
declined 14.7% from $229,850 to $196,180. • Sales volume of resale homes was highest in 2nd Quarter
2005 and of new construction homes in 3rd Quarter 2006. • From 3rd Quarter 2006 to 3rd Quarter 2007:
o Resale sales volume declined 26.5% from 850 to 625 units.
o New construction sales volume declined 32.6% from 3,925 to 2,645 units.
Median Resale & New Construction Sales Prices Pinal County 1st Qtr 2004 - 3rd Qtr 2007
$-
$50,000
$100,000
$150,000
$200,000
$250,000
2004Qtr 1
2004Qtr 2
2004Qtr 3
2004Qtr 4
2005Qtr 1
2005Qtr 2
2005Qtr 3
2005Qtr 4
2006Qtr 1
2006Qtr 2
2006Qtr 3
2006Qtr 4
2007Qtr 1
2007Qtr 2
2007Qtr 3
Source: ASU Poly technic Realty Studies
Resale
New Construction

Pinal County Housing Needs Assessment – March 2008 Final Draft
Kuehl Enterprises LLC PO Box 642 Humboldt, AZ 86329 Page 44
TABLE 21 - UNITS BY PRICE RANGE – SAMPLING OF FOR SALE HOUSING UNITS SEPTEMBER 2007 BY GEOGRAPHIC AREA
$99,999 or less $100,000 to
$124,999 $125,000 to
$149,999 $150,000 to
$174,999 $175,000 to
$199,999 $200,000 to
$249,999 $250,000 to
$299,999 $300,000 or
more All Units
No. % No. % No. % No. % No. % No. % No. % No. %
Pinal County 28 5.9% 42 8.8% 132 27.6% 72 15.1% 51 10.7% 32 6.7% 37 7.7% 84 17.6% 478
Apache Junction (Pinal Part) 15 2.6% 14 2.4% 31 5.3% 48 8.2% 135 23.1% 168 28.7% 42 7.2% 132 22.6% 585
Arizona City 19 31.7% 14 23.3% 11 18.3% 3 5.0% 8 13.2% 1 1.7% 3 5.0% 1 1.7% 60
Casa Grande 59 7.2% 29 3.6% 76 9.3% 106 13.0% 119 14.6% 181 22.2% 80 9.8% 165 20.2% 815
Coolidge 227 53.0% 16 3.7% 37 8.6% 35 8.2% 46 10.7% 27 6.3% 13 3.0% 27 6.3% 428
Eloy 107 53.5% 23 11.5% 12 6.0% 12 6.0% 4 2.0% 8 4.0% 8 4.0% 26 13.0% 200
Florence 19 6.5% 19 6.5% 37 12.7% 42 14.4% 46 15.8% 70 24.1% 30 10.3% 28 9.6% 291
Kearny 0 0.0% 3 27.3% 5 45.5% 3 27.3% 0 0.0% 0 0.0% 0 0.0% 0 0.0% 11
Mammoth 1 100% 0 0.0% 0 0.0% 0 0.0% 0 0.0% 0 0.0% 0 0.0% 0 0.0% 1
Maricopa 2 0.2% 8 0.7% 39 3.4% 121 10.7% 249 22.0% 292 25.8% 204 18.0% 218 19.2% 1,133
Oracle 2 18.2% 1 9.1% 1 9.1% 0 0.0% 1 9.1% 1 9.1% 0 0.0% 5 45.5% 11
Queen Creek (Pinal Co Part) 1 0.2% 4 0.7% 39 6.6% 85 14.3% 139 23.4% 161 27.2% 104 17.5% 60 10.1% 593
San Manuel 6 50.0% 4 33.3% 1 8.3% 1 8.3% 0 0.0% 0 0.0% 0 0.0% 0 0.0% 12
Superior 9 39.1% 3 13.0% 4 17.4% 5 21.7% 0 0.0% 1 4.3% 1 4.3% 0 0.0% 23
Units in Sample 495 10.4% 180 3.6% 425 9.0% 533 11.6% 798 17.2% 942 20.5% 522 11.3% 746 16.3% 4641
Note: Units listed with MLS only; may include single-family, site-built, manufactured, and condominium type units. Units by address may not be located within jurisdiction boundaries.
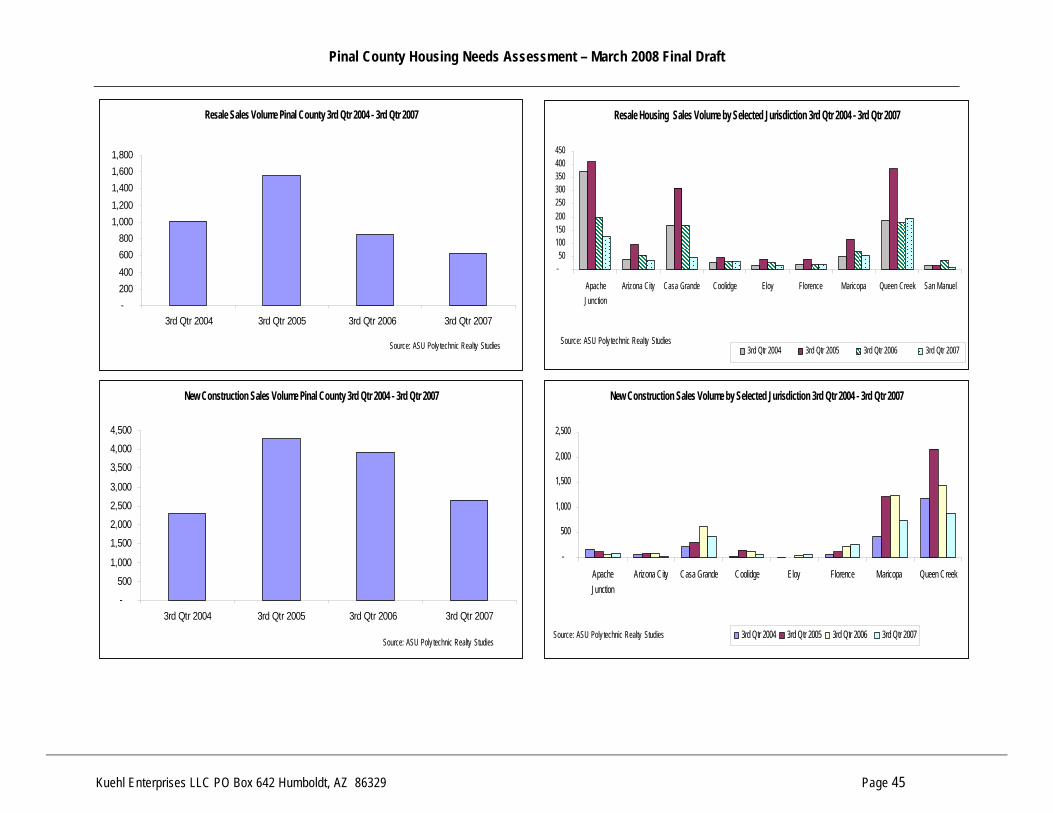
Pinal County Housing Needs Assessment – March 2008 Final Draft
Kuehl Enterprises LLC PO Box 642 Humboldt, AZ 86329 Page 45
Resale Sales Volume Pinal County 3rd Qtr 2004 - 3rd Qtr 2007
-200400600800
1,0001,2001,4001,6001,800
3rd Qtr 2004 3rd Qtr 2005 3rd Qtr 2006 3rd Qtr 2007
Source: ASU Poly technic Realty Studies
Resale Housing Sales Volume by Selected Jurisdiction 3rd Qtr 2004 - 3rd Qtr 2007
-50
100150200250300350400450
ApacheJunction
Arizona City Casa Grande Coolidge Eloy Florence Maricopa Queen Creek San Manuel
Source: ASU Poly technic Realty Studies3rd Qtr 2004 3rd Qtr 2005 3rd Qtr 2006 3rd Qtr 2007
New Construction Sales Volume Pinal County 3rd Qtr 2004 - 3rd Qtr 2007
-
500
1,000
1,500
2,000
2,500
3,000
3,500
4,000
4,500
3rd Qtr 2004 3rd Qtr 2005 3rd Qtr 2006 3rd Qtr 2007
Source: ASU Poly technic Realty Studies
New Construction Sales Volume by Selected Jurisdiction 3rd Qtr 2004 - 3rd Qtr 2007
-
500
1,000
1,500
2,000
2,500
ApacheJunction
Arizona City Casa Grande Coolidge Eloy Florence Maricopa Queen Creek
Source: ASU Poly technic Realty Studies 3rd Qtr 2004 3rd Qtr 2005 3rd Qtr 2006 3rd Qtr 2007
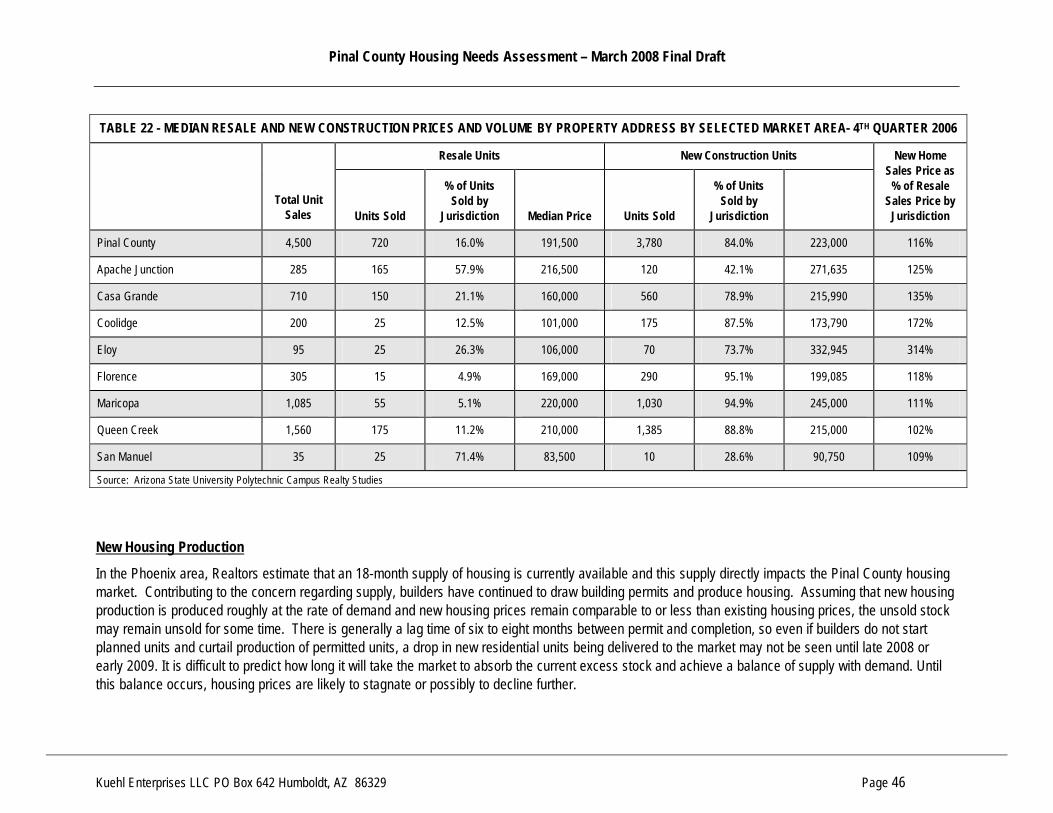
Pinal County Housing Needs Assessment – March 2008 Final Draft
Kuehl Enterprises LLC PO Box 642 Humboldt, AZ 86329 Page 46
TABLE 22 - MEDIAN RESALE AND NEW CONSTRUCTION PRICES AND VOLUME BY PROPERTY ADDRESS BY SELECTED MARKET AREA- 4TH QUARTER 2006
Resale Units New Construction Units
Total Unit Sales Units Sold
% of Units Sold by
Jurisdiction Median Price Units Sold
% of Units Sold by
Jurisdiction
New Home Sales Price as
% of Resale Sales Price by
Jurisdiction
Pinal County 4,500 720 16.0% 191,500 3,780 84.0% 223,000 116%
Apache Junction 285 165 57.9% 216,500 120 42.1% 271,635 125%
Casa Grande 710 150 21.1% 160,000 560 78.9% 215,990 135%
Coolidge 200 25 12.5% 101,000 175 87.5% 173,790 172%
Eloy 95 25 26.3% 106,000 70 73.7% 332,945 314%
Florence 305 15 4.9% 169,000 290 95.1% 199,085 118%
Maricopa 1,085 55 5.1% 220,000 1,030 94.9% 245,000 111%
Queen Creek 1,560 175 11.2% 210,000 1,385 88.8% 215,000 102%
San Manuel 35 25 71.4% 83,500 10 28.6% 90,750 109%
Source: Arizona State University Polytechnic Campus Realty Studies
New Housing Production
In the Phoenix area, Realtors estimate that an 18-month supply of housing is currently available and this supply directly impacts the Pinal County housing market. Contributing to the concern regarding supply, builders have continued to draw building permits and produce housing. Assuming that new housing production is produced roughly at the rate of demand and new housing prices remain comparable to or less than existing housing prices, the unsold stock may remain unsold for some time. There is generally a lag time of six to eight months between permit and completion, so even if builders do not start planned units and curtail production of permitted units, a drop in new residential units being delivered to the market may not be seen until late 2008 or early 2009. It is difficult to predict how long it will take the market to absorb the current excess stock and achieve a balance of supply with demand. Until this balance occurs, housing prices are likely to stagnate or possibly to decline further.

Pinal County Housing Needs Assessment – March 2008 Final Draft
Kuehl Enterprises LLC PO Box 642 Humboldt, AZ 86329 Page 47
New home builders are aggressively pursuing buyers for unsold and planned housing stock. This aggressive pursuit sometimes shows up as lower sales prices, which are also influenced by the size and location of new housing units. Most new home builders however attempt to maintain the underlying value of homes in the market by offering other incentives, such as free upgrades and gift cards that do not lower directly impact sales prices and thus values. According to data available from the US Department of Housing and Urban Development State of the Cities Data System, there were 6,030 building permits issued by Pinal County from January 2007 through November 2007. This volume is down approximately 25% from 2006 completions. The County reports that several developers drew permits for subdivisions prior to the implementation of new impact fees.
TABLE 23 - PERMITS ISSUED PINAL COUNTY 2000 - 2007
2000 2001 2002 2003 2004 2005 2006 2007 (1)
Single Family 2,183 3,259 4,317 6,516 10,041 18,199 11,023 5,948
Multi Family 71 266 160 386 326 208 82 82
Total 2,254 3,525 4,477 6,903 10,367 18,407 11,023 6,030 Source: US Department of Housing and Urban Development State of the Cities Data System (1) through November 2007
Cost Burdened Owners
According to 2006 American Community Survey data from the US Census Bureau, nearly two-thirds (65.7%) of owner-occupied units in Pinal County have mortgages. Of these households, six of ten pay more than 30% of income towards that mortgage, including insurance and taxes. This percentage of household income towards housing costs is expected, given mortgage qualifying ratios that range from 28% to as much as 40% of gross income for housing costs. Still, the rate of cost burdened households with mortgages increased 58.9% since 2000. Less expected is the percentage of owners both with and without mortgages that are paying more than 50% of their income towards housing costs. These households are considered severely cost burdened. From 2000 to 2006, severely cost burdened households with a mortgage increased 80% and those without a mortgage increased 187%.
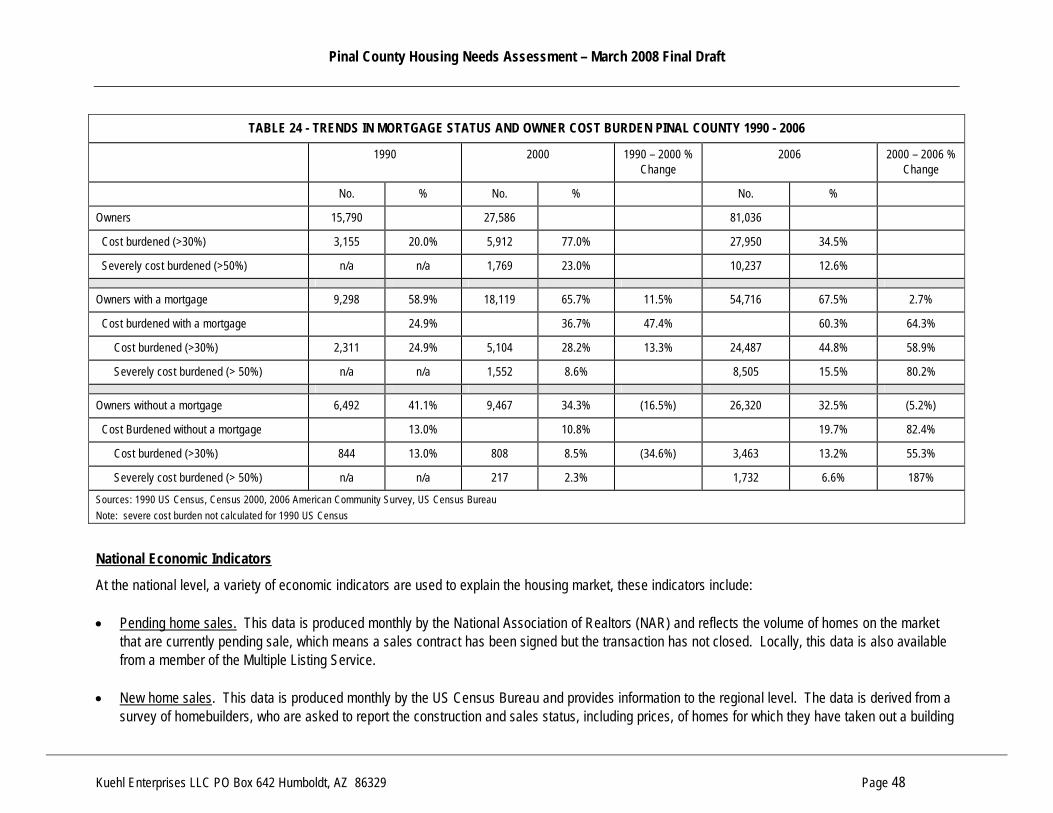
Pinal County Housing Needs Assessment – March 2008 Final Draft
Kuehl Enterprises LLC PO Box 642 Humboldt, AZ 86329 Page 48
TABLE 24 - TRENDS IN MORTGAGE STATUS AND OWNER COST BURDEN PINAL COUNTY 1990 - 2006
1990 2000 1990 – 2000 % Change
2006 2000 – 2006 % Change
No. % No. % No. %
Owners 15,790 27,586 81,036
Cost burdened (>30%) 3,155 20.0% 5,912 77.0% 27,950 34.5%
Severely cost burdened (>50%) n/a n/a 1,769 23.0% 10,237 12.6%
Owners with a mortgage 9,298 58.9% 18,119 65.7% 11.5% 54,716 67.5% 2.7%
Cost burdened with a mortgage 24.9% 36.7% 47.4% 60.3% 64.3%
Cost burdened (>30%) 2,311 24.9% 5,104 28.2% 13.3% 24,487 44.8% 58.9%
Severely cost burdened (> 50%) n/a n/a 1,552 8.6% 8,505 15.5% 80.2%
Owners without a mortgage 6,492 41.1% 9,467 34.3% (16.5%) 26,320 32.5% (5.2%)
Cost Burdened without a mortgage 13.0% 10.8% 19.7% 82.4%
Cost burdened (>30%) 844 13.0% 808 8.5% (34.6%) 3,463 13.2% 55.3%
Severely cost burdened (> 50%) n/a n/a 217 2.3% 1,732 6.6% 187%
Sources: 1990 US Census, Census 2000, 2006 American Community Survey, US Census Bureau Note: severe cost burden not calculated for 1990 US Census
National Economic Indicators
At the national level, a variety of economic indicators are used to explain the housing market, these indicators include: • Pending home sales. This data is produced monthly by the National Association of Realtors (NAR) and reflects the volume of homes on the market
that are currently pending sale, which means a sales contract has been signed but the transaction has not closed. Locally, this data is also available from a member of the Multiple Listing Service.
• New home sales. This data is produced monthly by the US Census Bureau and provides information to the regional level. The data is derived from a
survey of homebuilders, who are asked to report the construction and sales status, including prices, of homes for which they have taken out a building
Pinal County Housing Needs Assessment – March 2008 Final Draft
Kuehl Enterprises LLC PO Box 642 Humboldt, AZ 86329 Page 49
permit. The data is useful but highly erratic as it reports only that month’s activity. The data does not reflect cancellations, so if the cancellation rate is high, the indicator might still reflect strong sales. Recent trends indicate that new home sales dropped 25% from 2005 to 2006. Average sales for the 1st three quarters are down 28% from the same period in 2006. The market in Pinal County has lagged the rest of the West, with a peak occurring in 2006. Consequently, new home sales in Pinal can be expected to drop a similar amount for 2007.
• House Price Index. This index is produced by the Office of Federal Housing Enterprise Oversight. This price index measures resales of the same
houses and produces information at the metropolitan area and state levels, providing a more detailed view of the housing market. The data also includes refinancing of the same unit. The measurement of change in the price of the same housing unit is useful as it doesn’t reflect a shift to more or less expensive units being produced. The index excludes non-conforming loans (those that exceed Fannie Mae & Freddie Mac limits) so may be less reliable in areas with very high housing prices. For Arizona, the HPI declined nearly 1% from 2nd quarter 2007 to 3rd quarter 2007.
• Vacancy Rates. This data is produced quarterly by the US Census Bureau down to the regional level. The data is derived from the monthly Current
Population Survey and released about a month after the quarter ends. The data is reported separately for ownership and rental and can provide some useful information regarding overbuilding. At the regional level, rental vacancy rates have remained relatively stable for several decades, generally ranging from 5% to 8%. Homeownership vacancy rates are however at their highest since the mid 1980s, at 2.5% for the third quarter of 2007.
• Housing Starts. This data is produced monthly by the US Census Bureau and reflects the number of housing units under construction for which
building permits have been issued. The data is broken down regionally and by the number of units in a project. The information is useful in that it demonstrates the supply-side of the housing market, and shows the difference between the single-family and multi-family markets. In the west, housing starts declined 32% from 2005 to 2006.
• The Consumer Price Index (CPI) is the most widely used measure of inflation, and inflation directly impacts interest rates. The CPI includes prices in
major groups of consumer expenditures: food and beverages, housing, apparel, transportation, medical care, recreation, education and communications, and other goods and services. Some data is available at the local level but the most detailed data is available regionally and nationally. The index represents changes in purchase prices paid by employed urban households in 87 urban areas, including Phoenix. A survey of 50,000 landlords measures rents, which are included in the housing index.
• Mortgage Applications. This data is produced weekly by the Mortgage Bankers Association and reported on the national level. It is useful because it
provides up-to-date information on the overall state of the housing market. The information is based on a survey of mortgage bankers, commercial banks, and thrift institutions. The survey shows the mix between fixed- and adjustable-rate mortgages.
• Interest Rates. Borrowers often watch the prime rate or the federal funds rate and expect to see a change in mortgage interest rates. The prime rate
and federal funds rate track each other closely, so short-term mortgages or those with short-term adjustable rates, such as one year, will also track the prime and federal funds rates. But mortgage lenders do not generally look to these short-term rates when setting long-term and fixed-rate mortgage
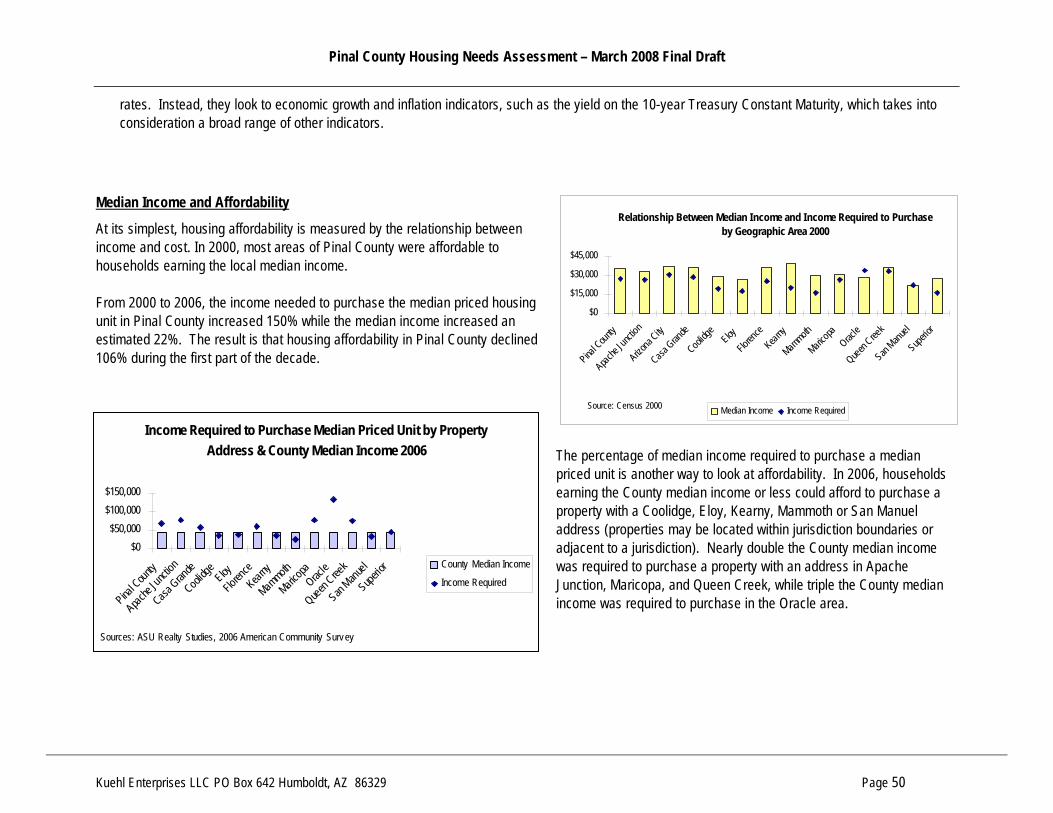
Pinal County Housing Needs Assessment – March 2008 Final Draft
Kuehl Enterprises LLC PO Box 642 Humboldt, AZ 86329 Page 50
rates. Instead, they look to economic growth and inflation indicators, such as the yield on the 10-year Treasury Constant Maturity, which takes into consideration a broad range of other indicators.
Median Income and Affordability
At its simplest, housing affordability is measured by the relationship between income and cost. In 2000, most areas of Pinal County were affordable to households earning the local median income. From 2000 to 2006, the income needed to purchase the median priced housing unit in Pinal County increased 150% while the median income increased an estimated 22%. The result is that housing affordability in Pinal County declined 106% during the first part of the decade.
The percentage of median income required to purchase a median priced unit is another way to look at affordability. In 2006, households earning the County median income or less could afford to purchase a property with a Coolidge, Eloy, Kearny, Mammoth or San Manuel address (properties may be located within jurisdiction boundaries or adjacent to a jurisdiction). Nearly double the County median income was required to purchase a property with an address in Apache Junction, Maricopa, and Queen Creek, while triple the County median income was required to purchase in the Oracle area.
Relationship Between Median Income and Income Required to Purchase by Geographic Area 2000
$0
$15,000
$30,000
$45,000
Pinal C
ounty
Apache
Junctio
nArizo
na City
Casa Gran
deCool
idge
EloyFlo
rence
Kearny
Mammoth
Maricopa
Oracle
Queen C
reek
San Manu
elSupe
rior
Source: Census 2000 Median Income Income Required
Income Required to Purchase Median Priced Unit by Property Address & County Median Income 2006
$0$50,000
$100,000$150,000
Pinal C
ounty
Apache
Junctio
nCasa
Grande
Coolidg
eEloy
Floren
ceKear
nyMam
mothMaric
opaOrac
leQuee
n Cree
kSan
Manuel
Superior
Sources: ASU Realty Studies, 2006 American Community Survey
County Median Income
Income Required

Pinal County Housing Needs Assessment – March 2008 Final Draft
Kuehl Enterprises LLC PO Box 642 Humboldt, AZ 86329 Page 51
TABLE 25 - HOMEOWNERSHIP AFFORDABILITY BY JURISDICTION – 2000 TABLE 26 - HOMEOWNERSHIP AFFORDABILITY BY PROPERTY ADDRESS -
2006
Value (1)
Income Required
(2)
Median County
Income (1)
Affordable to Households at or above % of local median Price
Income Required (1)
Estimated Median County
Income (2)
Affordable to Households at or above % of
County median
Pinal County $ 76,300 $ 27,250 $ 35,856 76% Pinal County $ 191,500 (3) $ 68,393 $ 43,637 157%
Apache Junction $ 74,300 $ 26,536 $ 35,856 74% Apache Junction $ 216,500 (3) $ 77,321 $ 43,637 177%
Arizona City $80,500 $28,750 $ 35,856 80% Arizona City $145,000 (3) $51.786 $43,637 119%
Casa Grande $ 79,900 $ 28,536 $ 35,856 80% Casa Grande $ 160,000 (3) $ 57,143 $ 43,637 131%
Coolidge $ 55,400 $ 19,786 $ 35,856 55% Coolidge $ 101,000 (3) $ 36,071 $ 43,637 83%
Eloy $ 48,400 $ 17,286 $ 35,856 48% Eloy $ 106,000 (3) $ 37,857 $ 43,637 87%
Florence $ 71,600 $ 25,571 $ 35,856 71% Florence $ 169,000 (3) $ 60,357 $ 43,637 138%
Kearny $ 56,600 $ 20,214 $ 35,856 56% Kearny $ 96,000 (4) $ 34,286 $ 43,637 79%
Mammoth $ 46,100 $ 16,464 $ 35,856 46% Mammoth $ 72,000 (4) $ 25,714 $ 43,637 59%
Maricopa $ 75,500 $ 26,964 $ 35,856 75% Maricopa $ 220,000 (3) $ 78,571 $ 43,637 180%
Oracle $95,600 $34,143 $ 35,856 95% Oracle $370,350 (4) $132,368 $ 43,637 303%
Queen Creek $ 94,000 $ 33,571 $ 35,856 94% Queen Creek $ 210,000 (3) $ 75,000 $ 43,637 172%
San Manuel $62,100 $22,179 $ 35,856 62% San Manuel $90,750 (4) $32,411 $ 43,637 74%
Superior $ 45,400 $ 16,214 $ 35,856 45% Superior $ 128,000 (4) $ 45,714 $ 43,637 105%
(1) Census 2000 (2) 2.8 x income
(1) 2.8x income (2) 2006 American Community Survey US Census Bureau (3) Arizona State University Polytechnic Campus Realty Studies, includes Maricopa County (4)Trulia.com price data 2006Note: property addressed may not be inside jurisdiction boundaries
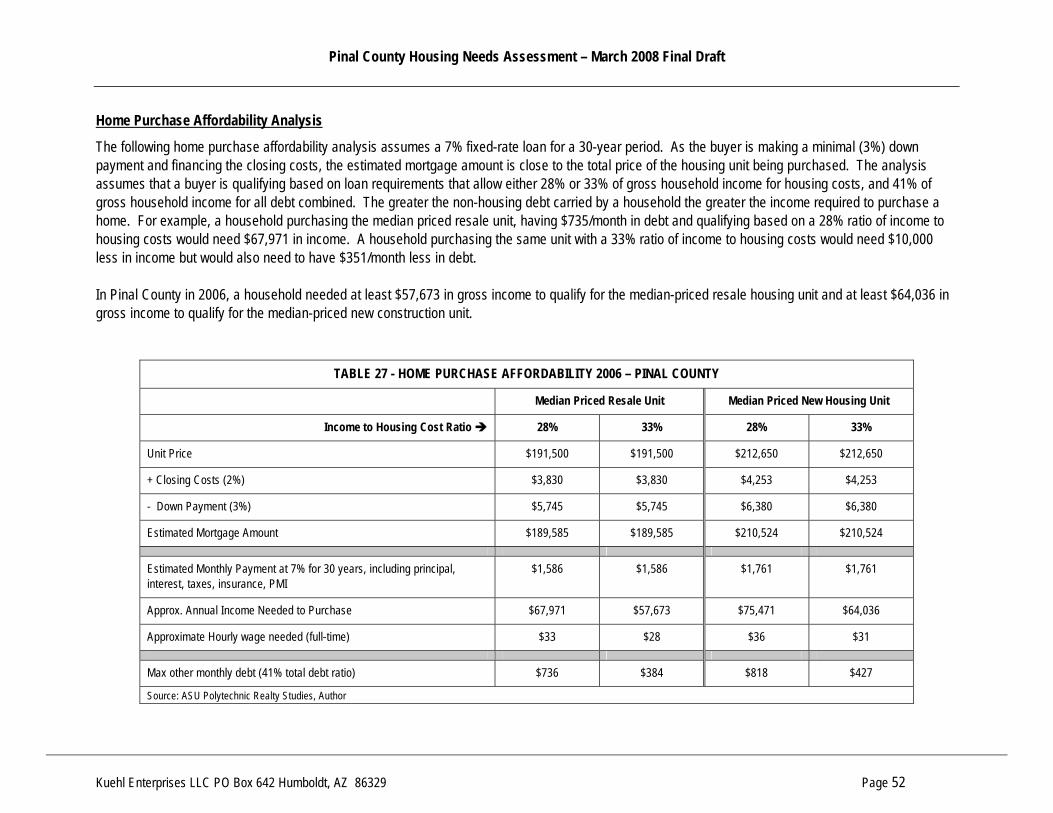
Pinal County Housing Needs Assessment – March 2008 Final Draft
Kuehl Enterprises LLC PO Box 642 Humboldt, AZ 86329 Page 52
Home Purchase Affordability Analysis
The following home purchase affordability analysis assumes a 7% fixed-rate loan for a 30-year period. As the buyer is making a minimal (3%) down payment and financing the closing costs, the estimated mortgage amount is close to the total price of the housing unit being purchased. The analysis assumes that a buyer is qualifying based on loan requirements that allow either 28% or 33% of gross household income for housing costs, and 41% of gross household income for all debt combined. The greater the non-housing debt carried by a household the greater the income required to purchase a home. For example, a household purchasing the median priced resale unit, having $735/month in debt and qualifying based on a 28% ratio of income to housing costs would need $67,971 in income. A household purchasing the same unit with a 33% ratio of income to housing costs would need $10,000 less in income but would also need to have $351/month less in debt. In Pinal County in 2006, a household needed at least $57,673 in gross income to qualify for the median-priced resale housing unit and at least $64,036 in gross income to qualify for the median-priced new construction unit.
TABLE 27 - HOME PURCHASE AFFORDABILITY 2006 – PINAL COUNTY
Median Priced Resale Unit Median Priced New Housing Unit
Income to Housing Cost Ratio 28% 33% 28% 33%
Unit Price $191,500 $191,500 $212,650 $212,650
+ Closing Costs (2%) $3,830 $3,830 $4,253 $4,253
- Down Payment (3%) $5,745 $5,745 $6,380 $6,380
Estimated Mortgage Amount $189,585 $189,585 $210,524 $210,524
Estimated Monthly Payment at 7% for 30 years, including principal, interest, taxes, insurance, PMI
$1,586 $1,586 $1,761 $1,761
Approx. Annual Income Needed to Purchase $67,971 $57,673 $75,471 $64,036
Approximate Hourly wage needed (full-time) $33 $28 $36 $31
Max other monthly debt (41% total debt ratio) $736 $384 $818 $427
Source: ASU Polytechnic Realty Studies, Author

Pinal County Housing Needs Assessment – March 2008 Final Draft
Kuehl Enterprises LLC PO Box 642 Humboldt, AZ 86329 Page 53
Financing Types and Interest Rates
Much attention is given to the supply side of the housing market equation. But supply is not generated without demand, and in recent years the demand side of the equation has greatly influenced the overall market. New homebuyers and investors flocked to the County to take advantage of more affordable housing. Factors such as economic expansion in Maricopa and Pima Counties and the resulting population growth, and liberal financing all contributed to the housing boom. All loans carry a mix of risks associated with the buyer and the market. Buyer risk is associated with capacity, which may be defined as sufficient income to make payments over the period of the loan. Market risk is associated with collateral, which may be defined as sufficient value to support the amount of funds borrowed against the housing unit. Combined, these risk categories define buyers’ ability to purchase. During the housing boom, when housing prices increased rapidly, buyer risk was treated very liberally - buyers were given loans despite little or no down payment, no documentation of adequate income, and poor credit. Many buyers used exotic and hybrid financing, including adjustable rate mortgages to qualify for housing that would have otherwise been beyond their financial reach. At the same time, existing homeowners used similar financing products to cash out the increased home equity that resulted from increased housing values. The most common types of real estate loans, generally referred to as mortgages, are fixed-rate, adjustable rate, interest-only, 80/20, and minimum payment/negative amortization. • Fixed-rate loans have an interest rate and payment that stays the same for the term of the loan – usually 15, 20 or 30 years. Interest rates are often
higher with fixed-rate loans than with other loans, so buyers may not qualify for as large of a mortgage as with other types of loan products. Shorter-term amortization periods usually have lower interest rates than longer term periods but have higher payments as they are amortized over less time. The shorter the term of the loan the more quickly principal is paid off and the less interest paid over the life of the loan. For example, the monthly payment on a $165,000, 7%, 30-year fixed-rate loan would be $1,098, on a 7%, 20-year fixed-rate loan would be $1,279 and on a 7%, 15-year fixed-rate loan would be $1,483.
Fixed-rate loans are attractive to buyers who want predictable payments and plan to own their homes for five or more years. These are the least risky types of loans because buyers must qualify for the full payment at the time of purchase. The greatest risks are therefore associated with unit value and with uncontrollable family situations such as job loss or medical bills that impact ability to pay.
• Adjustable-rate loans like fixed-rate loans are usually for 15, 20 or 30 years. Unlike fixed-rate loans, adjustable-rate loans carry an initial interest rate
for a period of time – usually from 1 year to 10 years – and thereafter adjust, usually annually but sometimes more frequently, based on an indexed rate. The indexed rate is often the yield on a Treasury note. The interest rate and therefore monthly principal and interest payment change within the limits set by the loan. Separate limits are usually set for annual adjustments and for the life of the loan. A longer initial fixed-rate period usually
Pinal County Housing Needs Assessment – March 2008 Final Draft
Kuehl Enterprises LLC PO Box 642 Humboldt, AZ 86329 Page 54
equates to a higher initial interest rate. For example, the initial monthly payment on a $165,000 1-year ARM would be $696, on a 3-year ARM would be $788, and on a 10-year ARM would be $990.
This type of loan is attractive to buyers with less than perfect credit, buyers who expect to earn a lot more in a few years, and buyers who do not expect to own the property for longer than the initial rate period. The low introductory interest rates associated with adjustable rate mortgages allow for higher purchase prices at lower initial monthly payment amounts – buyers can afford to purchase because they are qualified at the introductory rate. When used by buyers with less than perfect credit, adjustable rate mortgages are often sold as “bridge” loans - the buyer is told that if they make all their payments on time and improve their credit during the initial period, they might then qualify for a fixed-rate loan at a better interest rate. The idea is that this will happen before the interest rate resets, and the new mortgage payment is no longer affordable. The greatest risks are that buyer income will not increase to cover increased mortgage costs, buyer credit will not improve to the point that affordable refinancing is possible, and that property values will remain stable or increase sufficiently to allow for refinancing at the time of the rate reset. The greatest risk with short-term investors or buyers is that the unit will not retain or increase in value, or they will otherwise be unable to sell before the initial rate adjusts. Freddie Mac conducts a Primary Mortgage Market Survey®, and the 2006 survey states that “since 1995, the first year that Freddie Mac collected ARM share data, the ARM share has fluctuated between an annul low of 11 percent in 1998 and a high of 33 percent in 2004”. That same survey states that “over the last several years, annually adjusting ARMs with an initial “fixed-rate” period of more than one year, known as “hybrid” ARMs, have grown in popularity. Within that product type, ARMs with an initial fixed-rate period of five years, known as “5/1” ARMs, have been the dominant choice of consumers. In 2006, two-in-five ARMs were 5/1 hybrids.” One reason that the proportion of ARMs changes over time is the relationship between short-term and longer-term interest rates in the overall market. The greater the difference between short-term rates and long-term rates the more attractive adjustable rate mortgages.
• Interest-only loans are those in which none of the payments go toward retiring principal – usually for a fixed period ranging from 3 years to 10 years. Thereafter, the loan begins amortizing, with payments going toward both principal and interest. The longer the interest-only period, the shorter the amortization period and the larger the payment when the interest-only period ends. Interest-only loans may have fixed rates or adjustable rates. Interest only loans are attractive to borrowers who do not plan to stay in their home longer than the interest-only period or expect to earn a lot more in a few years and who want to maximize the amount of house they purchase now. They are also attractive to borrowers who are confident they can invest and therefore earn money on the difference between the interest-only payment and an amortizing payment. These loans carry the same risks as adjustable-rate mortgages.

Pinal County Housing Needs Assessment – March 2008 Final Draft
Kuehl Enterprises LLC PO Box 642 Humboldt, AZ 86329 Page 55
• 80/20 loans split 80% to a first mortgage and 20% to a second mortgage, allowing the borrower to finance 100% of the home’s value and avoid standard down payment and private mortgage insurance requirements. The first mortgage may be of any period and be fixed-rate or adjustable-rate. The second mortgage is usually a home equity loan or line of credit with an adjustable interest rate.
80/20 loans are typically taken by buyers with strong credit but limited funds to commit to a down payment. The greatest risk with 80/20 loans is collateral risk as 100% of the unit value is borrowed. A decline in the value of the housing unit puts the borrower in a negative-equity position. A negative-equity position combined with an upward adjustment in the second mortgage results in payments that may be too high on a unit that is not worth what is owed.
• Minimum payment or negative amortization loans are adjustable-rate loans that also add the flexibility of several possible payment options each
month. Payment options generally include minimum payment, interest-only or fully amortized. With the minimum payment option, the borrower pays a specified amount which may not fully cover the monthly interest due. If the minimum payment does not cover the monthly interest due, the interest is deferred and added to the amount of the loan. Fully-amortized payment options usually include either a 15-year or 30-year amortization period. The higher each monthly payment, the faster the loan is paid off.
Minimum payment or negative amortization loans are attractive to buyers who plan to own the property for a short period of time and want or need flexibility in making payments. Low introductory interest rates allow for higher purchase prices at lower initial monthly payment amounts. The risks associated with minimum payment loans are the same as for all adjustable-rate loans. In addition, if the minimum payment is selected frequently, particularly in the early years of the loan, the increasing loan amount over time means the collateral risk increases.
The Subprime Market
Loans of any type may be considered prime or subprime. Generally, subprime mortgages are for borrowers with credit scores under 620. Credit scores range from about 300 to about 900, with most consumer scores in the 600s and 700s. Someone who is habitually late in paying bills, and especially someone who falls behind on debts by 90 days or more, will suffer from a plummeting credit score. Unlike prime mortgages where rates and other terms and conditions don’t vary much from lender to lender, subprime mortgages often have widely differing terms and conditions. These widely differing terms and conditions are the result of how the lender computes risk and who originates the loan. Generally, subprime loans have higher rates than equivalent prime loans. How much higher depends upon the lender’s risk analysis, which includes such factors as credit score, down payment amount, and the types of credit issues the buyer has had in the recent past. Subprime loans are more likely to have prepayment penalties and balloon payments. Prepayment penalties are assessed against the borrower for paying off the loan early; balloon payments require the borrower to pay off the entire lump sum owed at a specified time.
Pinal County Housing Needs Assessment – March 2008 Final Draft
Kuehl Enterprises LLC PO Box 642 Humboldt, AZ 86329 Page 56
Subprime lenders are often considered predatory lenders but it is important to note that not all subprime lenders are predatory. The subprime market has played and will continue to play an important role in helping households with less-than-perfect credit to purchase housing. Subprime borrowers however are often preyed upon by predatory lenders. Typical tactics of predatory lenders include outrageous fees and sky-high interest rates, and pressuring the homeowner to refinance the mortgage frequently, each time charging high fees and closing costs that are rolled into a new higher mortgage amount. Predatory lenders also tend to issue loans regardless of the borrower's ability to repay.
Delinquency and Foreclosure
Most experts predict that Arizona will be one of the top states for foreclosures. In making this prediction, experts cite two market conditions: 1) a higher proportion of subprime and ARM loans in recent years, which equates to foreclosure vulnerability when initial interest rates reset, and 2) a significant imbalance of supply and demand that is making it difficult to sell properties at prices sufficient to cover outstanding mortgages. Many recent homebuyers are faced with declining property values, inadequate income to pay higher housing costs associated with interest rate resets, and fewer borrowing options as lenders tighten underwriting standards. These buyers are in a negative equity position – they owe more than their property is worth – and therefore can’t refinance or sell at a price sufficient to cover what they owe. A review of foreclosures listed on foreclosures.com reveals that of 405 housing units that will be auctioned in Pinal County from January through March 2008, 127 or 31.5% have negative equity. A June 20, 2007 ACORN publication entitled Home Insecurity: Foreclosures in Phoenix, Mesa, Glendale, & Tucson Neighborhoods, indicates that subprime lending activity is particularly high in central city neighborhoods and outlying newer development areas where investor activity, flipping, and aggressive lending activities occurred over the past several years. In Maricopa County, the highest rates of foreclosure are in areas that are on the outskirts of the Phoenix metropolitan area. The outlying high growth areas are one of the primary foreclosure concerns going forward and Pinal County falls in this category. Pinal County’s “drive until you qualify” housing market makes it extremely vulnerable to shifts in the metropolitan economy and housing market. In the second quarter of 2007, the foreclosure rate in Maricopa County was 3.44% and this equates to nearly 80,000 foreclosed units. This volume of foreclosures has added to an already-slowing housing market and lower housing prices. Households that may have purchased in Pinal County when prices in Maricopa County were higher may look closer to their employment. And for those current Pinal County owners whose units are foreclosed, the option of possibly renting a home closer to employment may be sufficient incentive to move. In short, while the housing market in metropolitan Phoenix fueled the growth of adjacent areas of Pinal County, so too could it fuel the decline of the same markets. According to data available at foreclosures.com, from January 2006 through September 2007, 5,854 single-family properties were foreclosed or in pre-foreclosure in Pinal County. Over two thirds (69% or 4,047) were recorded from January through September 2007. This number includes filings by lenders to initiate the foreclosure process and single family properties owned by lenders from foreclosures and deeds in lieu of foreclosure. About one-half of pre-foreclosures do not end up as actual foreclosures because borrowers are able to workout the existing loan with the lender, refinance, or sell the home.

Pinal County Housing Needs Assessment – March 2008 Final Draft
Kuehl Enterprises LLC PO Box 642 Humboldt, AZ 86329 Page 57
As of September 2007, 6.99% of Pinal County single-family housing units were in pre-foreclosure and an additional 2.55% were already foreclosed. This equates to 9.54% of the housing stock in pre-foreclosure or foreclosure as of September 2007. This rate of pre-foreclosure and foreclosure is second only to Mohave County (10.37%) and is 2.5 times higher than most other Arizona counties. Although foreclosures occur among all types of mortgages, including prime fixed-rate mortgages, the delinquency and foreclosure rates are higher among subprime and adjustable rate loans, and highest among subprime ARMs. According to the Mortgage Banker’s Association second quarter 2007 survey, the rate of foreclosure for subprime ARMs was five times the rate for all loans (6.42% v. 1.27%), and the rate of delinquency was three times that of all loans (11.24% v. 3.55%). While subprime ARMs are by far the greatest concern, prime mortgages with adjustable rates are an increasing concern. Subprime mortgages and ARMs remain the predominant share of loans going into foreclosure. The primary concern in Pinal County is the volume of subprime and adjustable rate mortgages issued during the 2000 – 2006 housing boom, when these types of loans were common. Historical conventional home purchase and refinancing data available through the Home Mortgage Disclosure Act (HMDA) shows that during the five year period from 2000 to 2004:
• Nationwide 11.7% of were originated by subprime lenders; • In Arizona 12.1% of loans were originated by subprime
lenders; and • In Pinal County 15.8% of loans were originated by subprime
lenders. • The rate of subprime lending in Pinal County was greatest
for refinancing loans (17.9%);
US Mortgages in Foreclosure by Loan Type - 2nd Qtr 2007
Prime ARM17%
Prime Fixed16%
FHA11%
VA2%
Subprime ARM36%
Subprime Fixed18%
Source: Mortgage Bankers Association

Pinal County Housing Needs Assessment – March 2008 Final Draft
Kuehl Enterprises LLC PO Box 642 Humboldt, AZ 86329 Page 58
TABLE 28 - CONVENTIONAL HOME PURCHASE AND REFINANCING LOANS BY SUBPRIME LENDERS BY PROPERTY ADDRESS 2000 – 2004
Jurisdiction Home Purchase
Loans
By Subprime Lenders Refinance Loans
By Subprime Lenders Total Loans
By Subprime Lenders
No. % No. % No. %
Pinal County 24,896 3,508 14.1% 20,993 3,759 17.9% 45,889 7,267 15.8%
Apache Junction 4,181 794 19.0% 4,420 885 20.0% 8,601 1,679 19.5%
Arizona City 605 89 14.7% 404 72 17.8% 1,009 161 16.0%
Casa Grande 3,017 378 12.5% 2,939 588 20.0% 5,955 966 16.2%
Coolidge 320 92 28.7% 555 239 43.0% 875 331 37.8%
Eloy 352 58 16.5% 535 163 30.5% 887 221 24.9%
Florence 739 97 13.1% 779 196 25.1% 1,518 293 19.3%
Kearny 51 10 19.6% 126 37 29.4% 177 47 26.5%
Oracle 750 32 4.3% 1,191 137 11.5% 1,941 169 8.7%
Queen Creek (*) 6,987 600 8.6% 4,463 453 10.2% 11,450 1,053 9.2%
San Manuel 145 29 20.0% 317 98 30.9% 462 127 27.5%
Superior 108 18 16.7% 187 66 35.3% 295 84 28.5%
Source: Home Mortgage Disclosure Act * includes Maricopa County
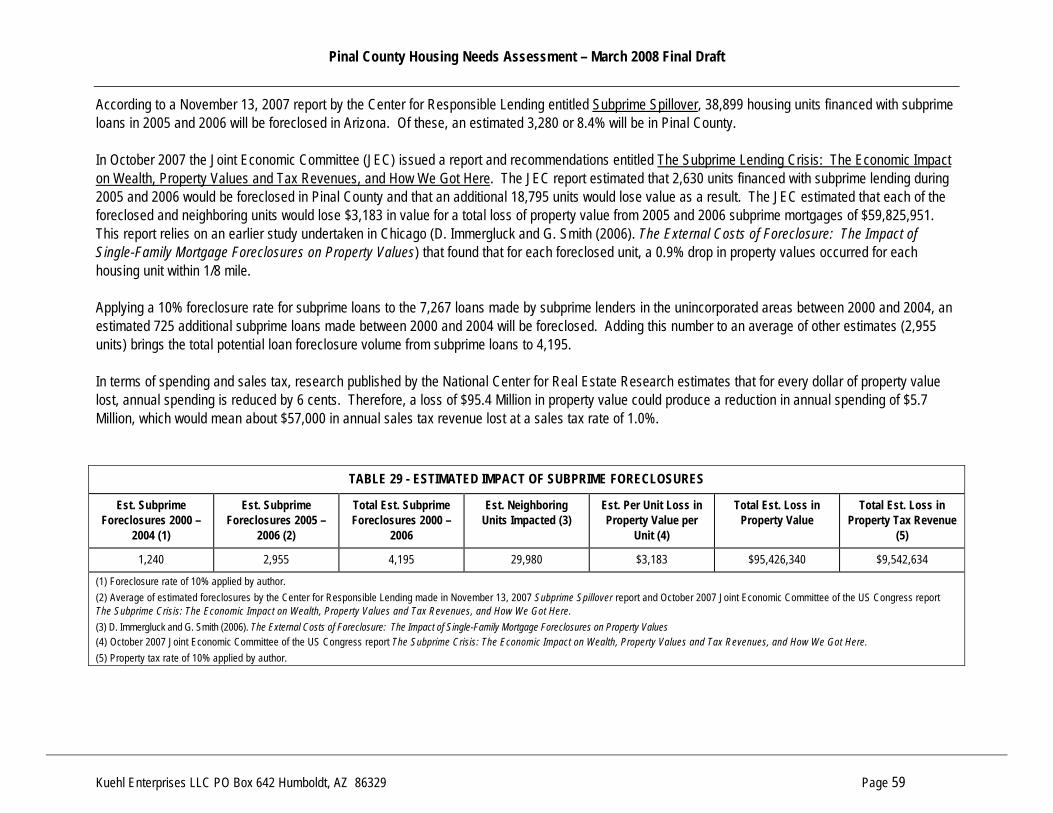
Pinal County Housing Needs Assessment – March 2008 Final Draft
Kuehl Enterprises LLC PO Box 642 Humboldt, AZ 86329 Page 59
According to a November 13, 2007 report by the Center for Responsible Lending entitled Subprime Spillover, 38,899 housing units financed with subprime loans in 2005 and 2006 will be foreclosed in Arizona. Of these, an estimated 3,280 or 8.4% will be in Pinal County. In October 2007 the Joint Economic Committee (JEC) issued a report and recommendations entitled The Subprime Lending Crisis: The Economic Impact on Wealth, Property Values and Tax Revenues, and How We Got Here. The JEC report estimated that 2,630 units financed with subprime lending during 2005 and 2006 would be foreclosed in Pinal County and that an additional 18,795 units would lose value as a result. The JEC estimated that each of the foreclosed and neighboring units would lose $3,183 in value for a total loss of property value from 2005 and 2006 subprime mortgages of $59,825,951. This report relies on an earlier study undertaken in Chicago (D. Immergluck and G. Smith (2006). The External Costs of Foreclosure: The Impact of Single-Family Mortgage Foreclosures on Property Values) that found that for each foreclosed unit, a 0.9% drop in property values occurred for each housing unit within 1/8 mile. Applying a 10% foreclosure rate for subprime loans to the 7,267 loans made by subprime lenders in the unincorporated areas between 2000 and 2004, an estimated 725 additional subprime loans made between 2000 and 2004 will be foreclosed. Adding this number to an average of other estimates (2,955 units) brings the total potential loan foreclosure volume from subprime loans to 4,195. In terms of spending and sales tax, research published by the National Center for Real Estate Research estimates that for every dollar of property value lost, annual spending is reduced by 6 cents. Therefore, a loss of $95.4 Million in property value could produce a reduction in annual spending of $5.7 Million, which would mean about $57,000 in annual sales tax revenue lost at a sales tax rate of 1.0%.
TABLE 29 - ESTIMATED IMPACT OF SUBPRIME FORECLOSURES
Est. Subprime Foreclosures 2000 –
2004 (1)
Est. Subprime Foreclosures 2005 –
2006 (2)
Total Est. Subprime Foreclosures 2000 –
2006
Est. Neighboring Units Impacted (3)
Est. Per Unit Loss in Property Value per
Unit (4)
Total Est. Loss in Property Value
Total Est. Loss in Property Tax Revenue
(5)
1,240 2,955 4,195 29,980 $3,183 $95,426,340 $9,542,634
(1) Foreclosure rate of 10% applied by author. (2) Average of estimated foreclosures by the Center for Responsible Lending made in November 13, 2007 Subprime Spillover report and October 2007 Joint Economic Committee of the US Congress report The Subprime Crisis: The Economic Impact on Wealth, Property Values and Tax Revenues, and How We Got Here. (3) D. Immergluck and G. Smith (2006). The External Costs of Foreclosure: The Impact of Single-Family Mortgage Foreclosures on Property Values (4) October 2007 Joint Economic Committee of the US Congress report The Subprime Crisis: The Economic Impact on Wealth, Property Values and Tax Revenues, and How We Got Here. (5) Property tax rate of 10% applied by author.
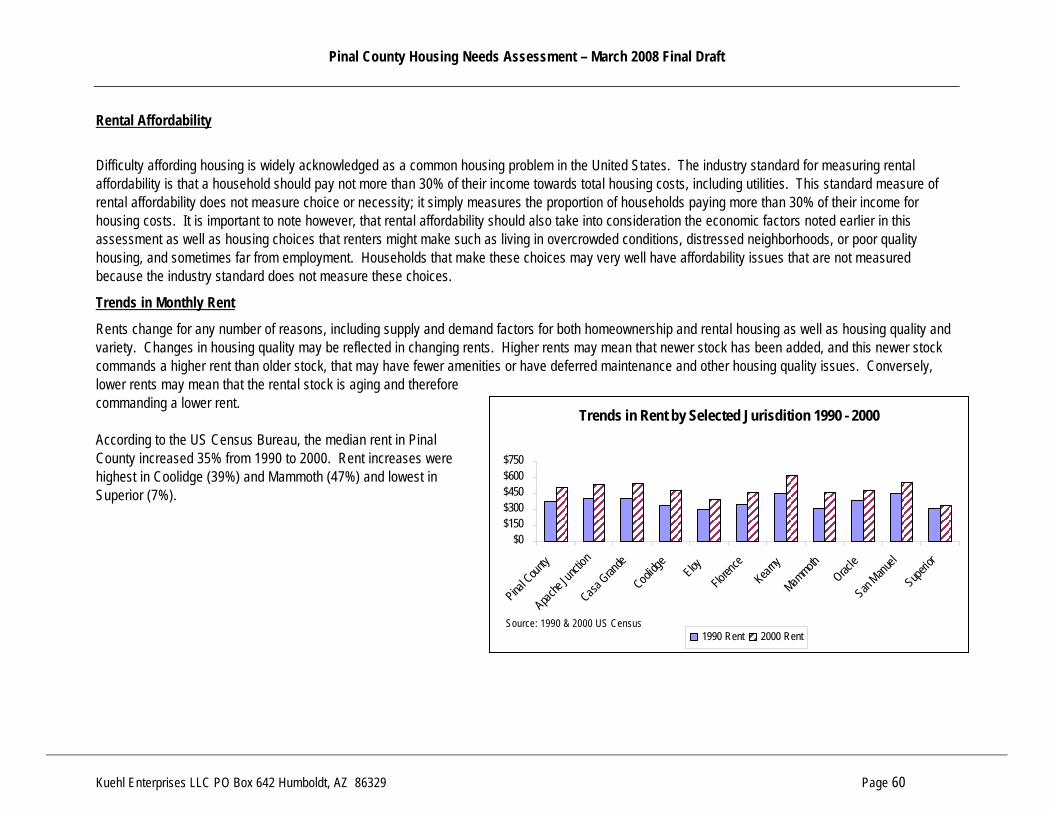
Pinal County Housing Needs Assessment – March 2008 Final Draft
Kuehl Enterprises LLC PO Box 642 Humboldt, AZ 86329 Page 60
Rental Affordability
Difficulty affording housing is widely acknowledged as a common housing problem in the United States. The industry standard for measuring rental affordability is that a household should pay not more than 30% of their income towards total housing costs, including utilities. This standard measure of rental affordability does not measure choice or necessity; it simply measures the proportion of households paying more than 30% of their income for housing costs. It is important to note however, that rental affordability should also take into consideration the economic factors noted earlier in this assessment as well as housing choices that renters might make such as living in overcrowded conditions, distressed neighborhoods, or poor quality housing, and sometimes far from employment. Households that make these choices may very well have affordability issues that are not measured because the industry standard does not measure these choices.
Trends in Monthly Rent
Rents change for any number of reasons, including supply and demand factors for both homeownership and rental housing as well as housing quality and variety. Changes in housing quality may be reflected in changing rents. Higher rents may mean that newer stock has been added, and this newer stock commands a higher rent than older stock, that may have fewer amenities or have deferred maintenance and other housing quality issues. Conversely, lower rents may mean that the rental stock is aging and therefore commanding a lower rent. According to the US Census Bureau, the median rent in Pinal County increased 35% from 1990 to 2000. Rent increases were highest in Coolidge (39%) and Mammoth (47%) and lowest in Superior (7%).
Trends in Rent by Selected Jurisdition 1990 - 2000
$0$150$300$450$600$750
Pinal C
ounty
Apache
Junctio
nCasa
Grande
Coolidg
e
EloyFlo
rence
Kearny
Mammoth
Oracle
San Manu
elSupe
rior
1990 Rent 2000 RentSource: 1990 & 2000 US Census

Pinal County Housing Needs Assessment – March 2008 Final Draft
Kuehl Enterprises LLC PO Box 642 Humboldt, AZ 86329 Page 61
Trends in Rental Affordability 1990 - 2000
From 1990 to 2000, rental affordability increased in most of Pinal County, with an overall increase in affordability of 14%. Rental affordability remained relatively stable during this period in Casa Grande but decreased in Kearny, Mammoth and Oracle.
TABLE 30 - TRENDS IN MONTHLY GROSS RENT AND INCOME REQUIRED TO AFFORD THE MEDIAN RENT BY JURISDICTION 1990 TO 2000
1990 2000
Median Monthly Gross Rent in $
Annual Gross Income Needed
Affordable to HH at or above % of
median
Median Monthly Gross Rent in $
Annual Gross Income Needed
Affordable to HH at or above %
median
Pinal County $ 376 $ 15,040 71% $ 509 $ 20,360 57%
Apache Junction $ 400 $ 16,000 81% $ 538 $ 21,520 64%
Arizona City $ 503 $ 20,120 79% $ 588 $ 23,520 63%
Casa Grande $ 402 $ 16,080 62% $ 541 $ 21,640 60%
Coolidge $ 340 $ 13,600 78% $ 474 $ 18,960 65%
Eloy $ 298 $ 11,920 66% $ 396 $ 15,840 60%
Florence $ 343 $ 13,720 66% $ 461 $ 18,440 51%
Kearny $ 450 $ 18,000 57% $ 618 $ 24,720 62%
Mammoth $ 311 $ 12,440 50% $ 459 $ 18,360 61%
Maricopa (1) $ - $ - n/a $ 349 $ 13,960 36%
Oracle $ 382 $ 15,280 55% $ 475 $ 19,000 62%
Queen Creek (1) $ - $ - n/a $ 475 $ 19,000 52%
San Manuel $ 454 $ 18,160 62% $ 556 $ 22,240 56%
Superior $ 314 $ 12,560 78% $ 336 $ 13,440 50%
Sources: 1990 US Census, Census 2000 (1) 1990 US Census data not available for Maricopa or Queen Creek
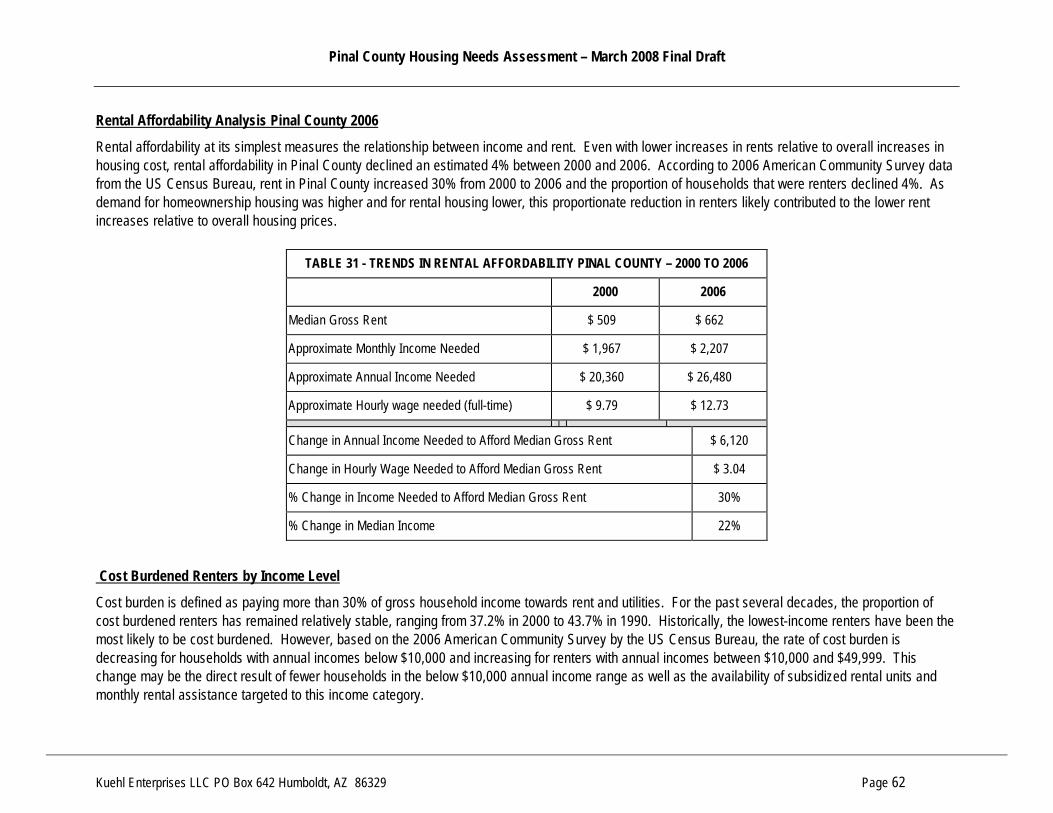
Pinal County Housing Needs Assessment – March 2008 Final Draft
Kuehl Enterprises LLC PO Box 642 Humboldt, AZ 86329 Page 62
Rental Affordability Analysis Pinal County 2006
Rental affordability at its simplest measures the relationship between income and rent. Even with lower increases in rents relative to overall increases in housing cost, rental affordability in Pinal County declined an estimated 4% between 2000 and 2006. According to 2006 American Community Survey data from the US Census Bureau, rent in Pinal County increased 30% from 2000 to 2006 and the proportion of households that were renters declined 4%. As demand for homeownership housing was higher and for rental housing lower, this proportionate reduction in renters likely contributed to the lower rent increases relative to overall housing prices.
TABLE 31 - TRENDS IN RENTAL AFFORDABILITY PINAL COUNTY – 2000 TO 2006
2000 2006
Median Gross Rent $ 509 $ 662
Approximate Monthly Income Needed $ 1,967 $ 2,207
Approximate Annual Income Needed $ 20,360 $ 26,480
Approximate Hourly wage needed (full-time) $ 9.79 $ 12.73
Change in Annual Income Needed to Afford Median Gross Rent $ 6,120
Change in Hourly Wage Needed to Afford Median Gross Rent $ 3.04
% Change in Income Needed to Afford Median Gross Rent 30%
% Change in Median Income 22%
Cost Burdened Renters by Income Level
Cost burden is defined as paying more than 30% of gross household income towards rent and utilities. For the past several decades, the proportion of cost burdened renters has remained relatively stable, ranging from 37.2% in 2000 to 43.7% in 1990. Historically, the lowest-income renters have been the most likely to be cost burdened. However, based on the 2006 American Community Survey by the US Census Bureau, the rate of cost burden is decreasing for households with annual incomes below $10,000 and increasing for renters with annual incomes between $10,000 and $49,999. This change may be the direct result of fewer households in the below $10,000 annual income range as well as the availability of subsidized rental units and monthly rental assistance targeted to this income category.

Pinal County Housing Needs Assessment – March 2008 Final Draft
Kuehl Enterprises LLC PO Box 642 Humboldt, AZ 86329 Page 63
TABLE 32 - TRENDS IN PERCENTAGE OF RENTERS COST BURDENED BY INCOME LEVEL PINAL COUNTY 1990 - 2006
1990 (1) 2000 (2) 1990 – 2000 % Change
2006 (3) 2000 – 2006 % Change
Less than $10,000 84.1% 85.4% 1.3% 62.1% (23.3%)
$10,000 to $19,999 50.8% 44.9% (6.0%) 69.5% 24.6%
$20,000 to $34,999 8.6% 25.4% 16.8% 47.6% 22.2%
$35,000 to $49,999 1.5% 4.8% 3.3% 22.6% 17.8%
$75,000 or more 0.0% 1.3% 1.3% 1.3% 0.0%
Total cost burdened renters 43.7% 37.2% (6.5%) 39.3% 1.9%
(1) 1990 US Census (2) Census 2000 (3) 2006 American Community Survey, US Census Bureau
Assistance to Low Income Renters
The Pinal County Housing Authority currently assists 584 households and an additional 1,000 are on the waiting list for Section 8 assistance. The waiting list is not open to new applicants as the wait for assistance is approximately three years. In addition, the Housing Authority owns and operates 169 rental units.
Trends in Renter Cost Burden by Income Category Pinal County 1990 to 2006
0%20%40%60%80%
100%
Less
than
$10,0
00
$10,0
00 to
$19,9
99
$20,0
00 to
$34,9
99
$35,0
00 to
$49,9
99
$75,0
00 or
more
Source: US Census Bureau 1990 2000 2006
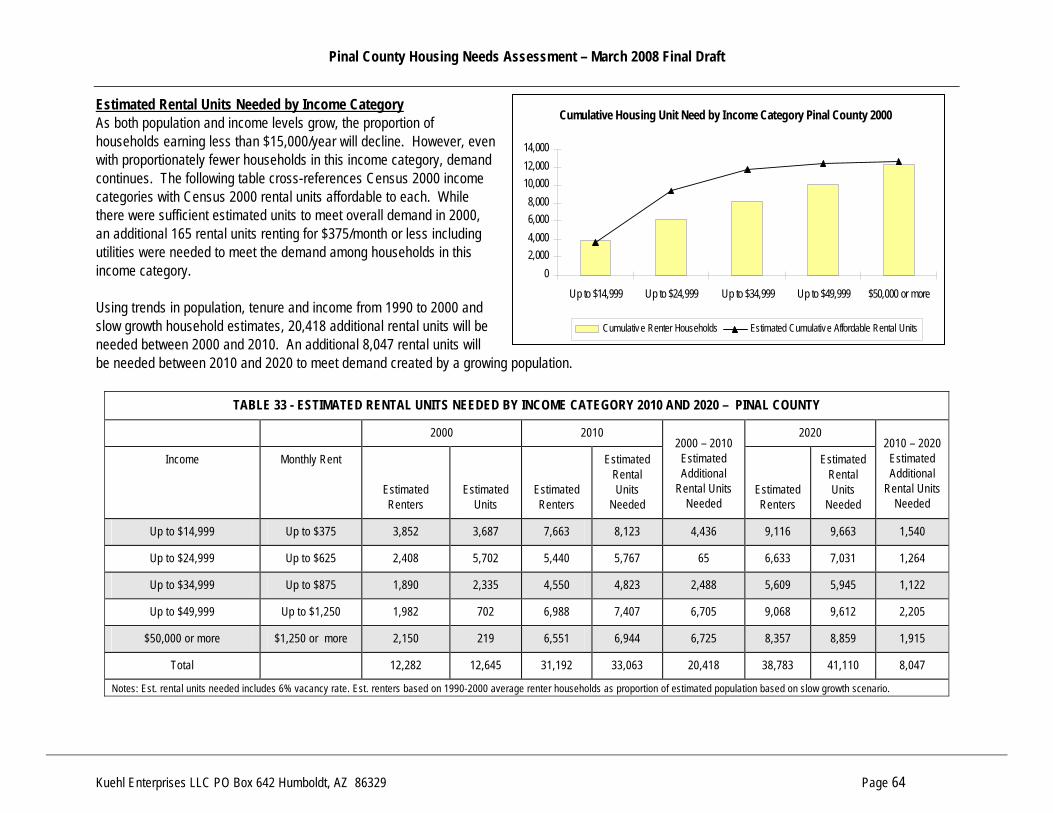
Pinal County Housing Needs Assessment – March 2008 Final Draft
Kuehl Enterprises LLC PO Box 642 Humboldt, AZ 86329 Page 64
Estimated Rental Units Needed by Income Category As both population and income levels grow, the proportion of households earning less than $15,000/year will decline. However, even with proportionately fewer households in this income category, demand continues. The following table cross-references Census 2000 income categories with Census 2000 rental units affordable to each. While there were sufficient estimated units to meet overall demand in 2000, an additional 165 rental units renting for $375/month or less including utilities were needed to meet the demand among households in this income category. Using trends in population, tenure and income from 1990 to 2000 and slow growth household estimates, 20,418 additional rental units will be needed between 2000 and 2010. An additional 8,047 rental units will be needed between 2010 and 2020 to meet demand created by a growing population.
TABLE 33 - ESTIMATED RENTAL UNITS NEEDED BY INCOME CATEGORY 2010 AND 2020 – PINAL COUNTY
2000 2010 2020
Income Monthly Rent
Estimated Renters
Estimated Units
Estimated Renters
Estimated Rental Units
Needed
2000 – 2010 Estimated Additional
Rental Units Needed
Estimated Renters
Estimated Rental Units
Needed
2010 – 2020 Estimated Additional
Rental Units Needed
Up to $14,999 Up to $375 3,852 3,687 7,663 8,123 4,436 9,116 9,663 1,540
Up to $24,999 Up to $625 2,408 5,702 5,440 5,767 65 6,633 7,031 1,264
Up to $34,999 Up to $875 1,890 2,335 4,550 4,823 2,488 5,609 5,945 1,122
Up to $49,999 Up to $1,250 1,982 702 6,988 7,407 6,705 9,068 9,612 2,205
$50,000 or more $1,250 or more 2,150 219 6,551 6,944 6,725 8,357 8,859 1,915
Total 12,282 12,645 31,192 33,063 20,418 38,783 41,110 8,047
Notes: Est. rental units needed includes 6% vacancy rate. Est. renters based on 1990-2000 average renter households as proportion of estimated population based on slow growth scenario.
Cumulative Housing Unit Need by Income Category Pinal County 2000
02,0004,0006,0008,000
10,00012,00014,000
Up to $14,999 Up to $24,999 Up to $34,999 Up to $49,999 $50,000 or more
Cumulative Renter Households Estimated Cumulative Affordable Rental Units
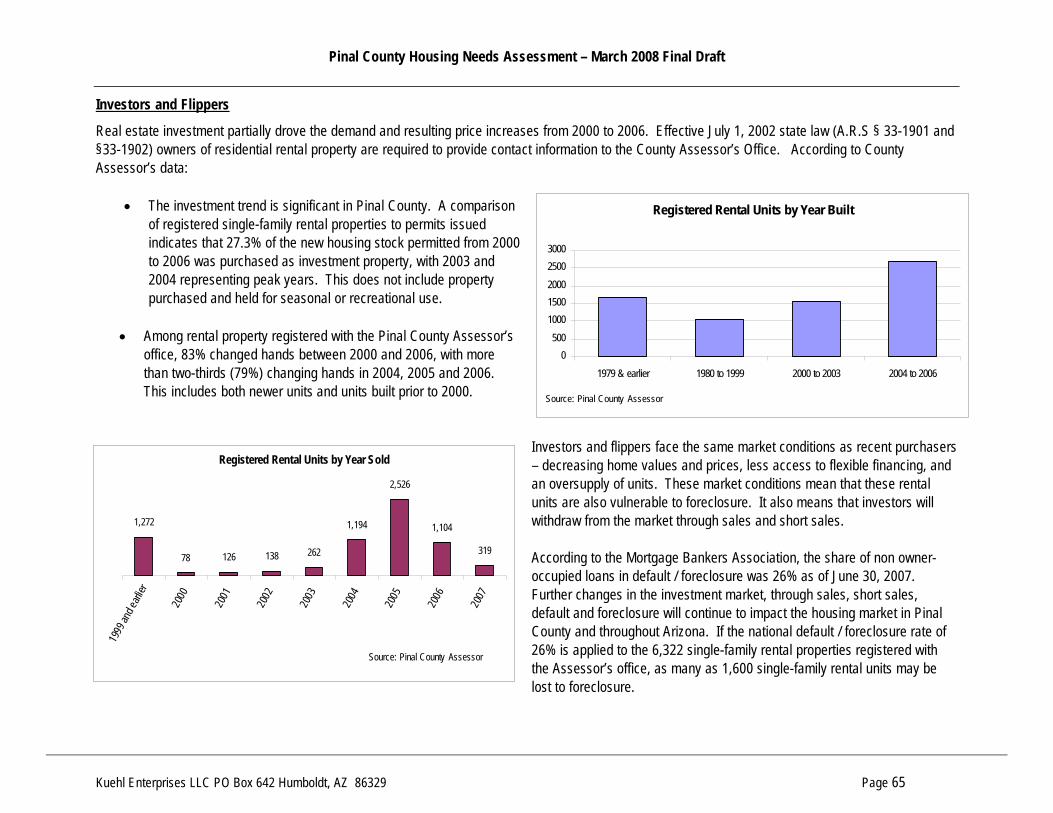
Pinal County Housing Needs Assessment – March 2008 Final Draft
Kuehl Enterprises LLC PO Box 642 Humboldt, AZ 86329 Page 65
Investors and Flippers
Real estate investment partially drove the demand and resulting price increases from 2000 to 2006. Effective July 1, 2002 state law (A.R.S § 33-1901 and §33-1902) owners of residential rental property are required to provide contact information to the County Assessor’s Office. According to County Assessor’s data:
• The investment trend is significant in Pinal County. A comparison of registered single-family rental properties to permits issued indicates that 27.3% of the new housing stock permitted from 2000 to 2006 was purchased as investment property, with 2003 and 2004 representing peak years. This does not include property purchased and held for seasonal or recreational use.
• Among rental property registered with the Pinal County Assessor’s
office, 83% changed hands between 2000 and 2006, with more than two-thirds (79%) changing hands in 2004, 2005 and 2006. This includes both newer units and units built prior to 2000.
Investors and flippers face the same market conditions as recent purchasers – decreasing home values and prices, less access to flexible financing, and an oversupply of units. These market conditions mean that these rental units are also vulnerable to foreclosure. It also means that investors will withdraw from the market through sales and short sales. According to the Mortgage Bankers Association, the share of non owner-occupied loans in default / foreclosure was 26% as of June 30, 2007. Further changes in the investment market, through sales, short sales, default and foreclosure will continue to impact the housing market in Pinal County and throughout Arizona. If the national default / foreclosure rate of 26% is applied to the 6,322 single-family rental properties registered with the Assessor’s office, as many as 1,600 single-family rental units may be lost to foreclosure.
Registered Rental Units by Year Sold
1,272
78 126 138 262
1,194
2,526
1,104
319
1999
and e
arlier
2000
2001
2002
2003
2004
2005
2006
2007
Source: Pinal County Assessor
Registered Rental Units by Year Built
0500
100015002000
25003000
1979 & earlier 1980 to 1999 2000 to 2003 2004 to 2006
Source: Pinal County Assessor
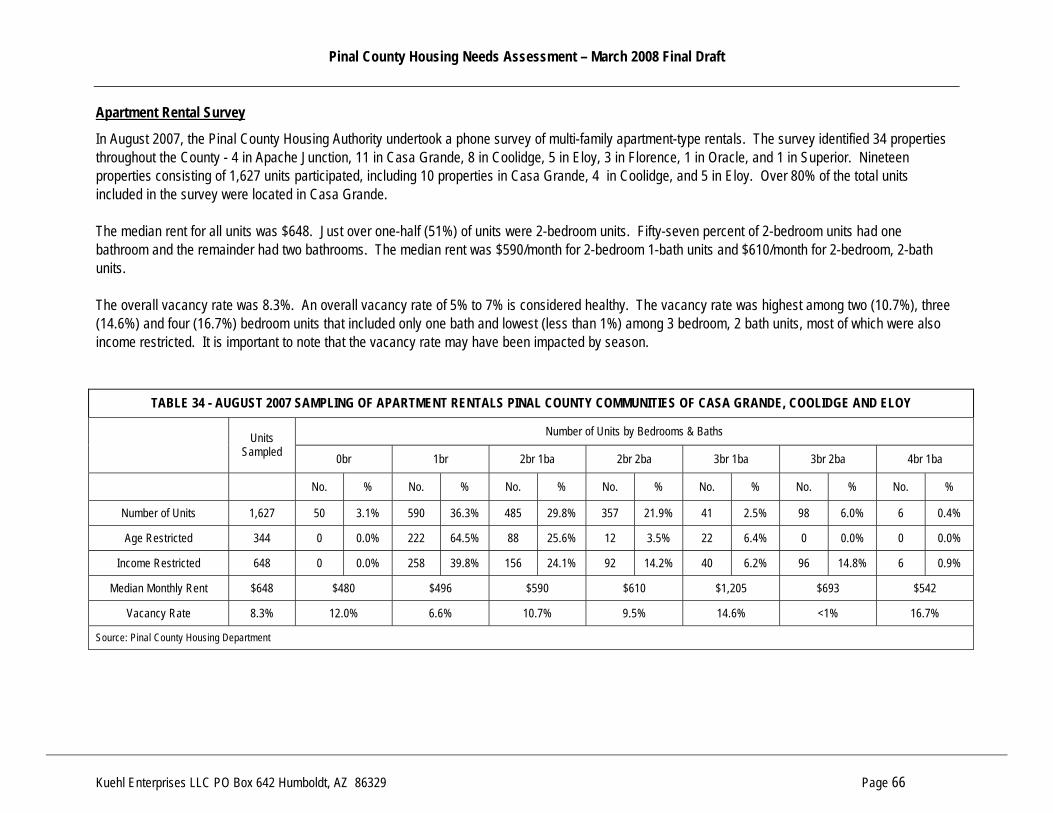
Pinal County Housing Needs Assessment – March 2008 Final Draft
Kuehl Enterprises LLC PO Box 642 Humboldt, AZ 86329 Page 66
Apartment Rental Survey
In August 2007, the Pinal County Housing Authority undertook a phone survey of multi-family apartment-type rentals. The survey identified 34 properties throughout the County - 4 in Apache Junction, 11 in Casa Grande, 8 in Coolidge, 5 in Eloy, 3 in Florence, 1 in Oracle, and 1 in Superior. Nineteen properties consisting of 1,627 units participated, including 10 properties in Casa Grande, 4 in Coolidge, and 5 in Eloy. Over 80% of the total units included in the survey were located in Casa Grande. The median rent for all units was $648. Just over one-half (51%) of units were 2-bedroom units. Fifty-seven percent of 2-bedroom units had one bathroom and the remainder had two bathrooms. The median rent was $590/month for 2-bedroom 1-bath units and $610/month for 2-bedroom, 2-bath units. The overall vacancy rate was 8.3%. An overall vacancy rate of 5% to 7% is considered healthy. The vacancy rate was highest among two (10.7%), three (14.6%) and four (16.7%) bedroom units that included only one bath and lowest (less than 1%) among 3 bedroom, 2 bath units, most of which were also income restricted. It is important to note that the vacancy rate may have been impacted by season.
TABLE 34 - AUGUST 2007 SAMPLING OF APARTMENT RENTALS PINAL COUNTY COMMUNITIES OF CASA GRANDE, COOLIDGE AND ELOY
Number of Units by Bedrooms & Baths Units
Sampled 0br 1br 2br 1ba 2br 2ba 3br 1ba 3br 2ba 4br 1ba
No. % No. % No. % No. % No. % No. % No. %
Number of Units 1,627 50 3.1% 590 36.3% 485 29.8% 357 21.9% 41 2.5% 98 6.0% 6 0.4%
Age Restricted 344 0 0.0% 222 64.5% 88 25.6% 12 3.5% 22 6.4% 0 0.0% 0 0.0%
Income Restricted 648 0 0.0% 258 39.8% 156 24.1% 92 14.2% 40 6.2% 96 14.8% 6 0.9%
Median Monthly Rent $648 $480 $496 $590 $610 $1,205 $693 $542
Vacancy Rate 8.3% 12.0% 6.6% 10.7% 9.5% 14.6% <1% 16.7%
Source: Pinal County Housing Department
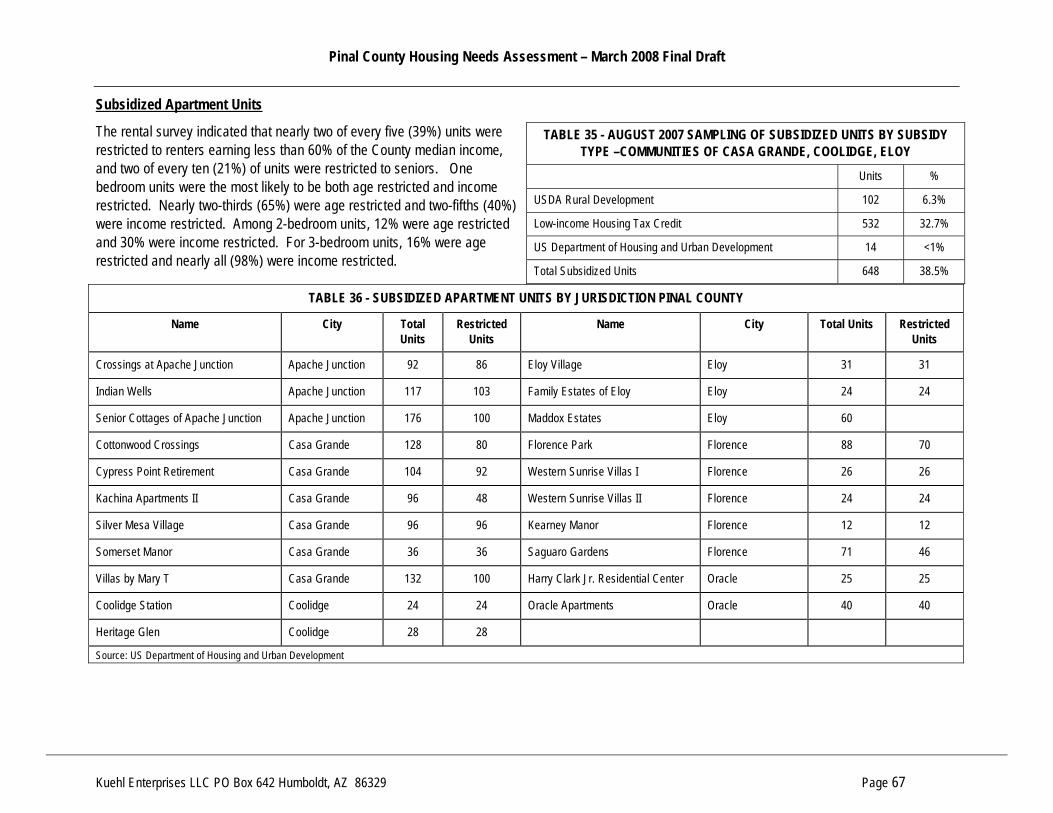
Pinal County Housing Needs Assessment – March 2008 Final Draft
Kuehl Enterprises LLC PO Box 642 Humboldt, AZ 86329 Page 67
Subsidized Apartment Units
TABLE 35 - AUGUST 2007 SAMPLING OF SUBSIDIZED UNITS BY SUBSIDY TYPE –COMMUNITIES OF CASA GRANDE, COOLIDGE, ELOY
Units %
USDA Rural Development 102 6.3%
Low-income Housing Tax Credit 532 32.7%
US Department of Housing and Urban Development 14 <1%
The rental survey indicated that nearly two of every five (39%) units were restricted to renters earning less than 60% of the County median income, and two of every ten (21%) of units were restricted to seniors. One bedroom units were the most likely to be both age restricted and income restricted. Nearly two-thirds (65%) were age restricted and two-fifths (40%) were income restricted. Among 2-bedroom units, 12% were age restricted and 30% were income restricted. For 3-bedroom units, 16% were age restricted and nearly all (98%) were income restricted.
Total Subsidized Units 648 38.5%
TABLE 36 - SUBSIDIZED APARTMENT UNITS BY JURISDICTION PINAL COUNTY
Name City Total Units
Restricted Units
Name City Total Units Restricted Units
Crossings at Apache Junction Apache Junction 92 86 Eloy Village Eloy 31 31
Indian Wells Apache Junction 117 103 Family Estates of Eloy Eloy 24 24
Senior Cottages of Apache Junction Apache Junction 176 100 Maddox Estates Eloy 60
Cottonwood Crossings Casa Grande 128 80 Florence Park Florence 88 70
Cypress Point Retirement Casa Grande 104 92 Western Sunrise Villas I Florence 26 26
Kachina Apartments II Casa Grande 96 48 Western Sunrise Villas II Florence 24 24
Silver Mesa Village Casa Grande 96 96 Kearney Manor Florence 12 12
Somerset Manor Casa Grande 36 36 Saguaro Gardens Florence 71 46
Villas by Mary T Casa Grande 132 100 Harry Clark Jr. Residential Center Oracle 25 25
Coolidge Station Coolidge 24 24 Oracle Apartments Oracle 40 40
Heritage Glen Coolidge 28 28
Source: US Department of Housing and Urban Development
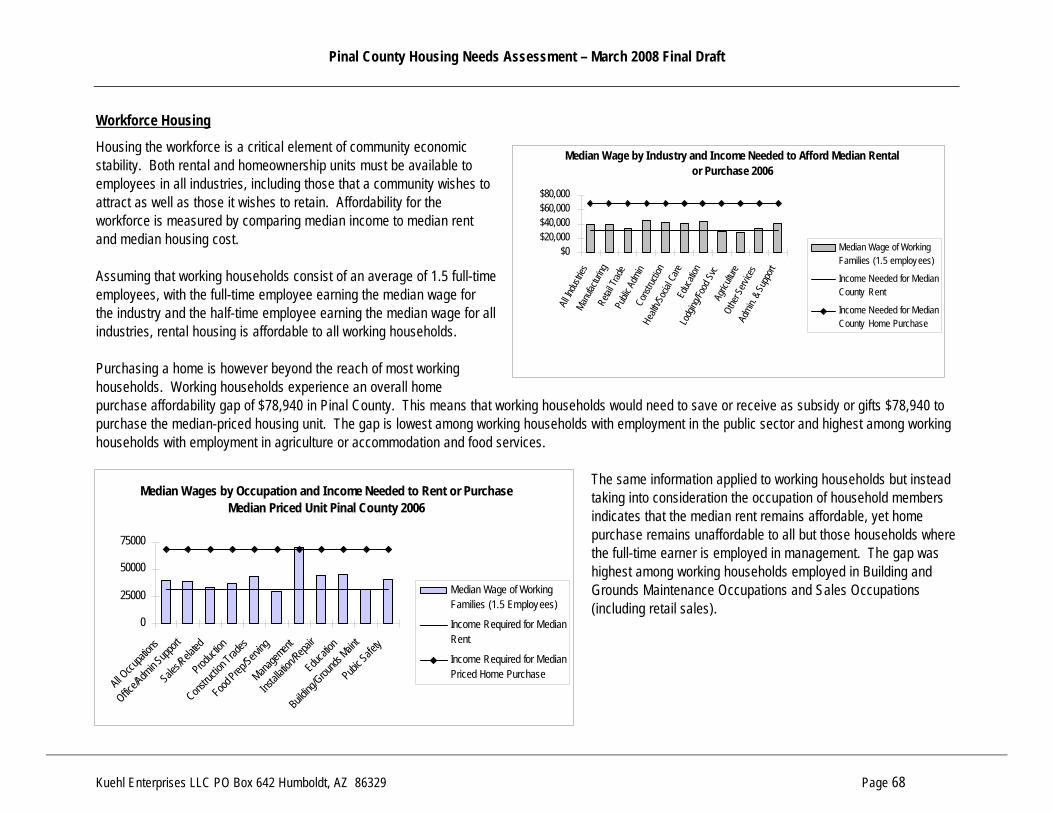
Pinal County Housing Needs Assessment – March 2008 Final Draft
Kuehl Enterprises LLC PO Box 642 Humboldt, AZ 86329 Page 68
Workforce Housing
Housing the workforce is a critical element of community economic stability. Both rental and homeownership units must be available to employees in all industries, including those that a community wishes to attract as well as those it wishes to retain. Affordability for the workforce is measured by comparing median income to median rent and median housing cost. Assuming that working households consist of an average of 1.5 full-time employees, with the full-time employee earning the median wage for the industry and the half-time employee earning the median wage for all industries, rental housing is affordable to all working households. Purchasing a home is however beyond the reach of most working households. Working households experience an overall home purchase affordability gap of $78,940 in Pinal County. This means that working households would need to save or receive as subsidy or gifts $78,940 to purchase the median-priced housing unit. The gap is lowest among working households with employment in the public sector and highest among working households with employment in agriculture or accommodation and food services.
The same information applied to working households but instead taking into consideration the occupation of household members indicates that the median rent remains affordable, yet home purchase remains unaffordable to all but those households where the full-time earner is employed in management. The gap was highest among working households employed in Building and Grounds Maintenance Occupations and Sales Occupations (including retail sales).
Median Wages by Occupation and Income Needed to Rent or Purchase Median Priced Unit Pinal County 2006
0
25000
50000
75000
All Occu
pation
s
Office/A
dmin S
upport
Sales/R
elated
Product
ion
Constru
ction T
rades
Food Prep
/Serving
Managem
ent
Install
ation/R
epair
Educatio
n
Building
/Grounds
Maint
Pubic S
afety
Median Wage of WorkingFamilies (1.5 Employees)
Income Required for MedianRent
Income Required for MedianPriced Home Purchase
Median Wage by Industry and Income Needed to Afford Median Rental or Purchase 2006
$0$20,000$40,000$60,000$80,000
All In
dustr
iesMan
ufactu
ring
Retai
l Trad
ePu
blic A
dmin
Cons
tructi
onHe
alth/S
ocial
Care
Educ
ation
Lodg
ing/Fo
od S
vcAg
ricult
ureOt
her S
ervice
sAd
min. &
Supp
ort
Median Wage of WorkingFamilies (1.5 employees)
Income Needed for MedianCounty Rent
Income Needed for MedianCounty Home Purchase

Pinal County Housing Needs Assessment – March 2008 Final Draft
Kuehl Enterprises LLC PO Box 642 Humboldt, AZ 86329 Page 69
TABLE 37 - HOUSING AFFORDABILITY BY INDUSTRY FOR PRIMARY INDUSTRIES PINAL COUNTY 2006
% of Employed Residents (1999)
(1)
Median FTE Annual Wage 2006
(2)
Affordable Monthly Rent (3)
Monthly Rent Gap (4)
Affordable Ownership (5)
Ownership Affordability Gap
(6)
All Industries $ 26,800 $ 1,005 n/a $ 112,560 $ 78,940
Manufacturing 12.7% $ 26,847 $ 1,006 n/a $ 112,692 $ 78,808
Retail Trade 11.5% $ 20,291 $ 842 n/a $ 94,335 $ 97,165
Public Administration 10.5% $ 31,750 $ 1,129 n/a $ 126,420 $ 65,080
Construction 9.8% $ 29,080 $ 1,062 n/a $ 118,944 $ 72,556
Health Care & Social Assistance 9.3% $ 27,572 $ 1,024 n/a $ 114,722 $ 76,778
Educational Services 7.9% $ 30,191 $ 1,090 n/a $ 122,055 $ 69,445
Accommodation & Food Services 7.8% $ 16,371 $ 744 n/a $ 83,359 $ 108,141
Agriculture, Forestry, Fishing & Hunting 4.5% $ 15,602 $ 725 n/a $ 81,206 $ 110,294
Other Services (except Public Administration) 4.5% $ 20,674 $ 852 n/a $ 95,407 $ 96,093
(1) Census 2000 (2) Arizona Workforce Informer 4th quarter 2006. (3) Rent not exceeding 30% of gross income. 1.5 employees per household. FTE at industry wage; 1/2-time employee at 50% of median earnings for all industries. (4) Median Gross Rent of $662/month. US Census Bureau 2006 American Community Survey. (5) Ownership affordability factor of 2.8x gross income. 1.5 employees per household. FTE at industry wage; 1/2-time employee at 50% of median earnings for all industries. (6) County median housing price 4th quarter 2006. Arizona State University Morrison School of Management and Agribusiness.

Pinal County Housing Needs Assessment – March 2008 Final Draft
Kuehl Enterprises LLC PO Box 642 Humboldt, AZ 86329 Page 70
TABLE 38 - HOUSING AFFORDABILITY FOR PRIMARY OCCUPATIONS FOR PINAL COUNTY 2006
% of Employed Residents (1999)
(1)
Median FTE Annual Wage 2006
(2)
Affordable Monthly Rent (3)
Rent Gap (4) Affordable Ownership (5)
Ownership Affordability Gap
(6)
All Occupations $ 26,800 $ 1,005 n/a $ 112,560 $ 78,940
Office and administrative support 14.9% $ 26,358 $ 994 n/a $ 111,322 $ 80,178
Sales and related 9.5% $ 20,371 $ 844 n/a $ 94,559 $ 96,941
Production 8.2% $ 24,479 $ 947 n/a $ 106,061 $ 85,439
Construction trades workers 6.6% $ 30,185 $ 1,090 n/a $ 122,038 $ 69,462
Food preparation and serving related 6.3% $ 16,349 $ 744 n/a $ 83,297 $ 108,203
Management occupations 5.7% $ 56,920 $ 1,758 n/a $ 196,896 $ 0
Installation, maintenance, and repair 5.6% $ 31,093 $ 1,112 n/a $ 124,580 $ 66,920
Education, training, and library 4.6% $ 32,091 $ 1,137 n/a $ 127,375 $ 64,125
Building and grounds cleaning and maintenance 4.4% $ 18,391 $ 795 n/a $ 89,015 $ 102,485
Fire fighting, prevention, and law enforcement 4.3% $ 27,918 $ 1,033 n/a $ 115,689 $ 75,811
(1) Census 2000 (2) Arizona Workforce Informer 4th quarter 2006. (3) Rent not exceeding 30% of gross income. 1.5 employees per household. FTE at industry wage; 1/2-time employee at 50% of median earnings for all industries. (4) Gross Median Rent of $662; US Census Bureau 2006 American Community Survey (5) Ownership affordability factor of 2.8x gross income. 1.5 employees per household – one FTE at industry wage plus one 1/2-time employee at 50% of median earnings for all occupations. (6) County median housing price $191,500 2nd quarter 2006. Arizona State University Morrison School of Management and Agribusiness.
Pinal County Housing Needs Assessment – March 2008 Final Draft
Kuehl Enterprises LLC PO Box 642 Humboldt, AZ 86329 Page 71
BARRIERS TO AFFORDABLE HOUSING DEVELOPMENT
Sound planning considers, integrates, and balances a host of public objectives including a clean environment, adequate public infrastructure, schools, quality of life, and fiscal concerns, as well as housing needs and future growth accommodation. All communities have regulations that govern housing development and occupancy. Zoning and planning laws guide how communities develop while building codes define safe construction. These regulations are implemented through policies, rules and processes. A policy, rule or process is considered a barrier to affordable housing development or housing affordability when it prohibits, discourages or significantly increases the cost of housing without a corresponding public benefit. Most policies and regulations that ultimately restrict housing affordability or housing development are initially developed and implemented with a positive outcome in mind. Whether that positive outcome is achieved is the measure of whether the policy or regulation is of public benefit. As part of the housing needs assessment, local jurisdictions completed an assessment of barriers to affordable housing development. The assessment of barriers is intended to identify ways that local government might positively impact housing affordability through a review of existing plans, codes, zoning, ordinances, policies and practices. Most communities have at least one “barrier” to affordable housing development and some have many. Strategies to reduce local government barriers are often the most effective tools local government can use to contribute to ensuring adequate quality and affordable housing is available to support a broad range of households. Pinal County is fortunate to have an abundant supply of housing but it lacks the employment necessary to support the households occupying that housing. With much of the growth in Pinal County dependent upon metropolitan Phoenix, the housing boom may in part be attributed to regulatory barriers in the Phoenix metropolitan area. When considering new regulation and the implementation of new regulation, it is important for Pinal County to ensure that it does not enact those very same processes and regulations. Some indicators that local regulations are contributing to the housing affordability problem: • Housing variety is limited, with few multi-family or manufactured housing units. Large homes and homes on large lots are the predominant residential
building type. • Housing at various price ranges is not produced. • Developers indicate that the local process in unpredictable and often lengthy. City council or planning and zoning commission meetings are
backlogged with development decisions. • The density, size and amenities are dictated by the jurisdiction rather than by the market. Developers indicate that a market exists for a variety of
housing at various price points yet zoning or policies don’t allow it. • Middle-income families are unable to enter the homeownership market. • Residentially-zoned land or buildable land served by infrastructure (water, sewer, roads) is in short supply. • Local building codes are not based on updated, nationally recognized model codes.

Pinal County Housing Needs Assessment – March 2008 Final Draft
Kuehl Enterprises LLC PO Box 642 Humboldt, AZ 86329 Page 72
TABLE 39 - BARRIERS TO AFFORDABLE HOUSING DEVELOPMENT, VARIETY AND AFFORDABILITY
Yes No
1. The jurisdiction’s comprehensive plan includes a housing element?
Note: Arizona Law requires local units of government with a population of 50,000 or more to include a housing element in the general or comprehensive plan. The purpose of most housing elements is to consider housing quality, variety and affordability and to define policies and strategies to positively impact housing conditions.
Apache Junction Casa Grande Coolidge Eloy Florence Pinal County
Maricopa Superior
2. If the jurisdiction’s plan includes a housing element, the plan provides estimates of current and anticipated housing needs for existing and future residents, including low-, moderate-, and middle-income families, for at least the next 5 years?
Casa Grande Coolidge Florence Pinal County
Apache Junction Eloy Maricopa Superior
3. The jurisdiction’s zoning ordinance and map, development and subdivision regulations, or other land use controls provide a broad range of land use and density categories (multifamily housing, duplexes, small lot homes, and other similar elements) to promote housing variety.
Apache Junction Casa Grande Coolidge Eloy Florence Maricopa Superior
Pinal County
4. The jurisdiction’s zoning ordinance and map, development and subdivision regulations, or other land use controls provide land zoned “as of right” for a range of density categories(multifamily housing, duplexes, small lot homes, and other similar elements).
Note: HUD defines “as-of-right,” as uses and development standards that are determined in advance and that are specifically authorized by the zoning ordinance. The ordinance is largely self-enforcing because little or no discretion occurs in its administration.
Apache Junction Casa Grande Coolidge Eloy Florence Maricopa Superior
Pinal County
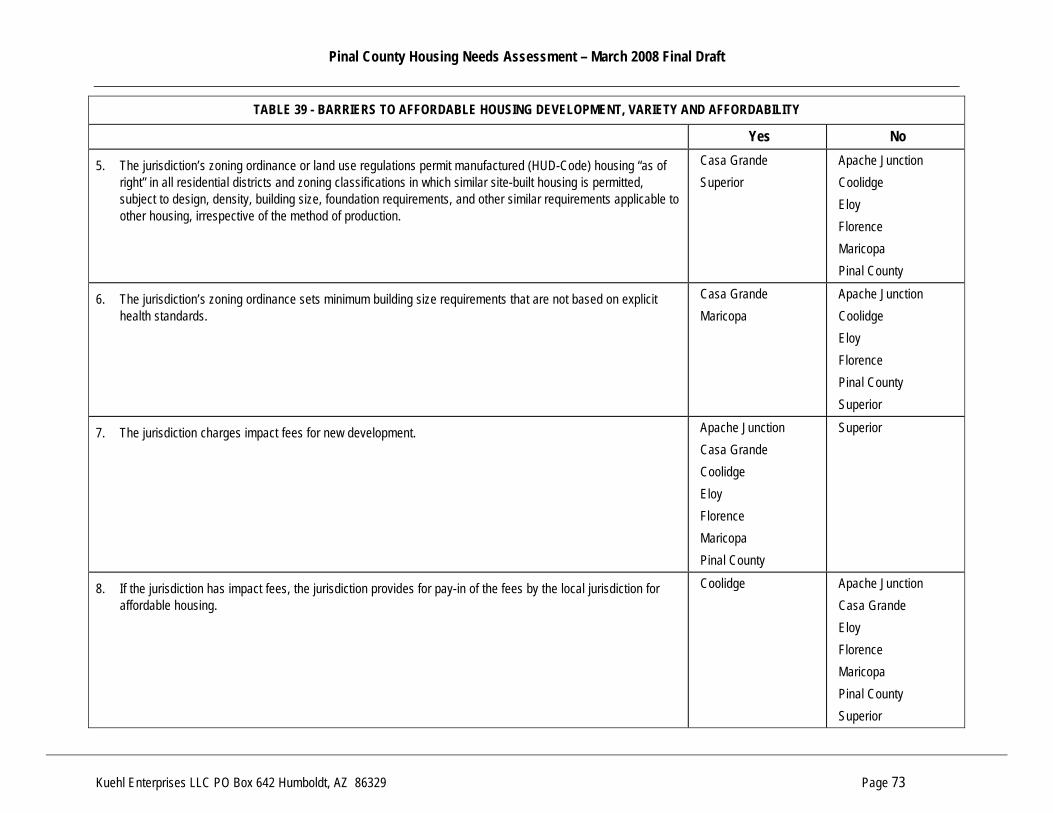
Pinal County Housing Needs Assessment – March 2008 Final Draft
Kuehl Enterprises LLC PO Box 642 Humboldt, AZ 86329 Page 73
TABLE 39 - BARRIERS TO AFFORDABLE HOUSING DEVELOPMENT, VARIETY AND AFFORDABILITY
Yes No
5. The jurisdiction’s zoning ordinance or land use regulations permit manufactured (HUD-Code) housing “as of right” in all residential districts and zoning classifications in which similar site-built housing is permitted, subject to design, density, building size, foundation requirements, and other similar requirements applicable to other housing, irrespective of the method of production.
Casa Grande Superior
Apache Junction Coolidge Eloy Florence Maricopa Pinal County
6. The jurisdiction’s zoning ordinance sets minimum building size requirements that are not based on explicit health standards.
Casa Grande Maricopa
Apache Junction Coolidge Eloy Florence Pinal County Superior
7. The jurisdiction charges impact fees for new development. Apache Junction Casa Grande Coolidge Eloy Florence Maricopa Pinal County
Superior
8. If the jurisdiction has impact fees, the jurisdiction provides for pay-in of the fees by the local jurisdiction for affordable housing.
Coolidge Apache Junction Casa Grande Eloy Florence Maricopa Pinal County Superior

Pinal County Housing Needs Assessment – March 2008 Final Draft
Kuehl Enterprises LLC PO Box 642 Humboldt, AZ 86329 Page 74
TABLE 39 - BARRIERS TO AFFORDABLE HOUSING DEVELOPMENT, VARIETY AND AFFORDABILITY
Yes No
9. The jurisdiction has adopted specific building code language regarding housing rehabilitation that encourages such rehabilitation through gradated regulatory requirements based on the different levels of work that are performed in existing buildings.
Coolidge Apache Junction Casa Grande Eloy Florence Maricopa Pinal County Superior
10. The jurisdiction uses the most recent version of one of the nationally recognized model building codes without significant technical amendment or modification.
Apache Junction Coolidge Eloy Florence Pinal County
Casa Grande Maricopa Superior
11. Within the past 5 years, the jurisdiction has convened or funded comprehensive studies, commissions, hearings, or established a formal ongoing process to review the rules, regulations, development standards, and processes of the jurisdiction to assess their impact on the supply of affordable housing.
Coolidge Florence Maricopa
Casa Grande Eloy Pinal County Superior
12. Within the past 5 years, the jurisdiction modified infrastructure standards and/or authorized the use of new infrastructure technologies (for example, water, sewer, street width) to significantly reduce the cost of housing.
Apache Junction Casa Grande Coolidge Eloy Florence Maricopa Pinal County Superior
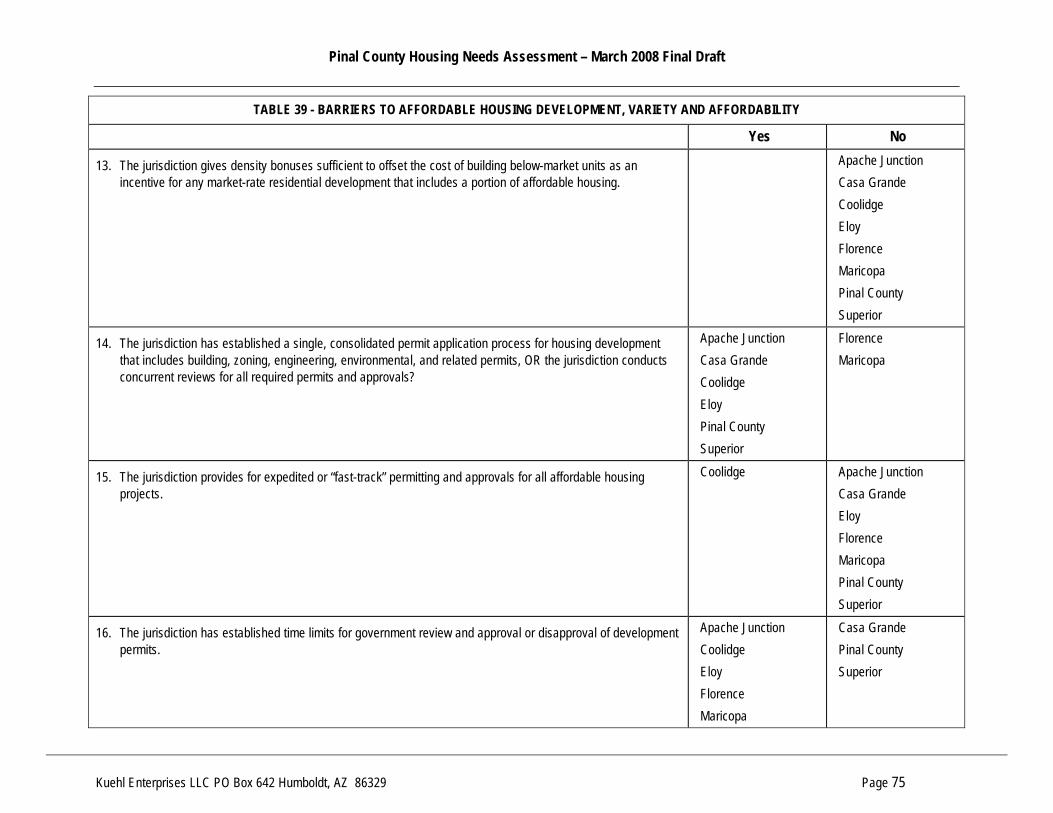
Pinal County Housing Needs Assessment – March 2008 Final Draft
Kuehl Enterprises LLC PO Box 642 Humboldt, AZ 86329 Page 75
TABLE 39 - BARRIERS TO AFFORDABLE HOUSING DEVELOPMENT, VARIETY AND AFFORDABILITY
Yes No
13. The jurisdiction gives density bonuses sufficient to offset the cost of building below-market units as an incentive for any market-rate residential development that includes a portion of affordable housing.
Apache Junction Casa Grande Coolidge Eloy Florence Maricopa Pinal County Superior
14. The jurisdiction has established a single, consolidated permit application process for housing development that includes building, zoning, engineering, environmental, and related permits, OR the jurisdiction conducts concurrent reviews for all required permits and approvals?
Apache Junction Casa Grande Coolidge Eloy Pinal County Superior
Florence Maricopa
15. The jurisdiction provides for expedited or “fast-track” permitting and approvals for all affordable housing projects.
Coolidge Apache Junction Casa Grande Eloy Florence Maricopa Pinal County Superior
16. The jurisdiction has established time limits for government review and approval or disapproval of development permits.
Apache Junction Coolidge Eloy Florence Maricopa
Casa Grande Pinal County Superior

Pinal County Housing Needs Assessment – March 2008 Final Draft
Kuehl Enterprises LLC PO Box 642 Humboldt, AZ 86329 Page 76
TABLE 39 - BARRIERS TO AFFORDABLE HOUSING DEVELOPMENT, VARIETY AND AFFORDABILITY
Yes No
17. The jurisdiction allows “accessory dwelling units” either as (a) a special exception or conditional use in all single-family residential zones, or (b) “as of right” in most residential districts otherwise zoned for single-family housing.
Apache Junction Coolidge Maricopa
Casa Grande Eloy Florence Pinal County Superior
18. The jurisdiction has an explicit policy that adjusts or waives existing parking requirements for affordable housing developments.
Coolidge Apache Junction Casa Grande Eloy Florence Maricopa Pinal County Superior
19. The jurisdiction requires affordable housing projects to undergo public review or special hearings when the project is otherwise in full compliance with the zoning ordinance and other development regulations.
Apache Junction Coolidge Maricopa
Casa Grande Eloy Florence Pinal County Superior

Pinal County Housing Needs Assessment – March 2008 Final Draft
Kuehl Enterprises LLC PO Box 642 Humboldt, AZ 86329 Page 77
RESOURCES AND DELIVERY SYSTEM
There is little question that the success of any housing program is the direct result of political will and leadership. When political will exists then direction is set and action can take place. But political will and the resulting direction are not enough to ensure the action will be taken to successfully impact housing needs – leadership that stems from commitment and builds capacity must also be in place. Using available resources and building new resources – both human and financial – stem from the commitment and capacity. Historically, most housing programs have focused on low-income households. This focus is the direct result of the limited choices low-income households often have in a housing market. By increasing the supply of housing affordable to low-income households, housing programs have provided an opportunity for more households to make positive social and economic contributions to the community. Many times the conventional housing market is not willing to or cannot deliver housing affordable to low-income households. This is particularly true during times of economic expansion, such as the housing boom that occurred earlier in the decade. During the housing boom, the housing industry focused their attention on meeting the demand for market-rate housing. During the past decade, housing programs have become focused on the workforce and on households earning from the median income up to as much as 1.5 times the median income. Traditional affordable housing programs are often prohibited from assisting these households and the conventional housing market may find it difficult to profitably produce housing affordable to households in this income range. Employer-based programs as well as local incentives and programs may need to be targeted to this income range in order to create socially and economically vibrant communities. The housing and related socio-economic needs of Pinal County’s residents are broad and deep enough to support many organizations assuming a variety of roles. Through the development of a housing strategy, Pinal County is taking steps towards directly addressing housing quality, variety and affordability through policies and actions. Building on existing resources and supporting the existing delivery system helps to ensure successful implementation of policies and actions. From the local government perspective, jurisdictions can generally implement policies and actions that use resources and directly impact residents within their respective jurisdictions. From the County perspective, policies and actions are focused on unincorporated areas and on bringing local jurisdictions and nonprofit organizations together to discuss the needs and issues. The Pinal County Housing Department is providing leadership by acting as a coordinating body for planning and discussion, and this is an important first step in building commitment and capacity to a County-wide effort.
The Private Sector
The private sector is the primary producer of housing. Adequate capacity among both the private and public sectors is necessary to positively impact housing conditions. The private sector has focused its attention primarily on providing market-rate housing, some of which is also affordable to households earning less than median income. Further, a segment of the private sector has built capacity around specific types of housing – primarily rental housing developed using Low Income Housing Tax Credits.
Pinal County Housing Needs Assessment – March 2008 Final Draft
Kuehl Enterprises LLC PO Box 642 Humboldt, AZ 86329 Page 78
In addition to developers, other segments of the private sector play key roles in the development of affordable housing. Banks and other financial institutions, real estate brokers and agents, Title companies, and construction contractors are all key players in market-rate housing, and are often overlooked as partners in affordable housing. As the role of the private sector is to profitably fill demand for housing, appropriate incentives to participate in affordable housing development and finance are needed if that role is to expand. These incentives are typically offered by local, state and federal government. Including the private sector in the housing affordability and other housing market discussions is essential to successful planning and coordination of effort.
The Nonprofit Sector
There are few nonprofit organizations active in the housing market in Pinal County. Projects that are developed are done so primarily by private and nonprofit developers from Maricopa and Pima Counties and elsewhere in the country. Programs are delivered by local jurisdictions, with a few County-wide efforts. Community Action Human Resources Agency (CAHRA) is the primary nonprofit organization that assists local jurisdictions and the County with program and project planning and implementation. The agency provides direct services and home improvements/emergency home repair to relieve the effects of poverty and homelessness and to assist households in becoming self-sufficient and non-reliant on government or community programs. CAHRA has successfully administered programs in the areas of case management including homeless case management, utility assistance, emergency assistance, transitional housing, homeless assistance, weatherization, self-help housing, emergency home repair, housing rehabilitation, replacement of roofs, information and referral, technical assistance to food banks and distribution of gleaned produce.
Federal and State Government
While the provision of housing is predominantly a private sector, market-driven activity, all levels of government – federal, state and local – have a role to play in facilitating the production and preservation of affordable housing. The primary role of local government is planning and process, while the primary role of state and local government in Arizona is to provide financial resources. A variety of housing resources are available for specific populations and geographic areas from both Federal and State governments. In general, there is little coordination among levels of government. Federal Government. USDA Rural Development, FHA, and the Veterans Administration offer homebuyer programs that often include lower down payment requirements and purchase subsidies. Other opportunities, such as preferred acquisition of foreclosure units and low cost leases are available to nonprofit organizations. To increase rental affordability, the federal government offers financing guarantees to developers and monthly rental subsidies to projects, yet these resources are increasingly limited to projects that house special needs populations. For individuals, the federal government offers monthly rental subsidies and supports public housing, with both resources available through local public housing authorities. There are two local housing authorities in Pinal County – the Pinal County Housing Department and the City of Eloy Housing Authority.
Pinal County Housing Needs Assessment – March 2008 Final Draft
Kuehl Enterprises LLC PO Box 642 Humboldt, AZ 86329 Page 79
The State of Arizona. Several state agencies make available financial and human resources to address housing conditions. These agencies include the Arizona Departments of Housing, Economic Security, and the Behavioral Health Services. • Arizona Department of Housing. Offers a variety of financing programs to nonprofit and local government organizations, as well as to private
developers. Financing includes bonds, loans, and grants for programs and projects as diverse as the applicants and their projects. Most resources are directed towards households earning less than 80% of the County median income, with some restricted to households earning less than 60% of the County median income. Available resources come from both federal and state sources and include the Community Development Block Grant program, the HOME program, the Low Income Housing Tax Credit Program, and the State Housing Trust Fund. This department also coordinates planning and funding for special needs housing throughout rural Arizona.
• Arizona Department of Economic Security. Offers financial resources for the operation of homeless and transitional housing shelters, homeless prevention resources, and provides services directly to special populations.
• Arizona Department of Behavioral Health Services. Offers financial resources in support of housing and services to persons with mental illness. Most of the resources are administered in cooperation with the Arizona Dept. of Housing.
Approximately $200 million/year in State and Federal Resources are available for affordable housing in Arizona. The majority of resources, including federal resources, are available from the Arizona Department of Housing. he following table illustrates State resources available to the Town, its partners in affordable housing, and residents.

Pinal County Housing Needs Assessment – March 2008 Final Draft
Kuehl Enterprises LLC PO Box 642 Humboldt, AZ 86329 Page 80
State Housing Fund
(Housing Trust Fund + Federal HOME funds)
Arizona Housing Finance Authority
(AzHFA)
Community Development Block
Grant (CDBG)
Low Income Housing Tax Credit
Financial Literacy and Home-Buyer Education
Required and funded only as part of assistance to develop or rehabilitate affordable housing
Required for beneficiaries of assistance Network of agencies provides
Eligible public service activity subject to statewide cap
Not eligible
Down Payment and Closing Cost Assistance
Variable amount based on cost of unit and buyer income
Variable amount based on cost of unit and buyer income
Eligible activity Not eligible
Mortgage Guarantees or Other Special Mortgage Provisions
Not available Mortgage Revenue Bonds (MRB) and Mortgage Credit Certificates (MCC) programs
Eligible activity Not eligible
Rehabilitation assistance for owner occupants
Eligible activity Not eligible Eligible activity Not eligible
Rehabilitation assistance for rental property owners
Eligible activity Not eligible Eligible activity Eligible activity
New Construction of Rental or Homeownership Units
Eligible activity Multi-family mortgage revenue bond
Eligible activity through community-based development organizations
Eligible activity
Neighborhood Revitalization
Through other eligible activities
Through other eligible activities
Multiple eligible economic, social and housing activities
Through other eligible activities
Pinal County Housing Needs Assessment – March 2008 Final Draft
Kuehl Enterprises LLC PO Box 642 Humboldt, AZ 86329 Page 81
County and Local Government
Several departments within County government have authority and responsibility for tasks and activities that directly impact housing quality, variety and affordability. These departments include the Housing Department, and Planning and Development Services. Housing Department. The mission of the Pinal County Housing Department is to provide and maintain temporary safe, decent, and sanitary standardized housing for qualified low-income people; to assist individuals in becoming independent by giving opportunities for education, training, counseling and support; to help residents remain independent and maintain their personal dignity for as long as possible, and to assist people in locating affordable housing through referrals and information. This mission is achieved through a variety of program resources including Section 8, Public Housing, and Community Development Block Grants. The Housing Department also operates a housing rehabilitation program to assist households with housing conditions. Planning and Development Services Department. The Planning & Development Services Department administers land use regulations, including zoning, subdivisions, minor land divisions, planned area developments, comprehensive plans and amendments, specific plans and amendments, variances, addressing, zoning ordinance enforcement and floodplain management. The department provides clearance of all building and mobile home placement permits, including flood elevation certificates, maps and permits. In addition, the department provides special project support, such as mapping and brochure development to other County departments. The Planning & Development Services Department provides administrative oversight, support, and coordination of Development Services provided by five divisions within the department. These divisions include: 1) Public Works, 2) Air Quality, 3) Environmental Health, 4) Building Safety, and 5) Planning & Development. • The Public Works division primary responsibilities include planning, constructing and maintaining roads and bridges, commercial and residential plan
review and inspections, countywide recycling program, airport economic development, investigations of illegal dumping, and maintaining and establishing storm water drainage systems and flood control.
• The Air Qualify division constitutes a regulatory agency, generally charged with protecting the public's interest in assuring that the air remains safe to breathe. The division maintains an on-going planning and rule development effort as most air quality standards originate from federal and State laws and regulations.
• The Environment health division provides education, consultation, plan review, permitting and inspection services including for public and semipublic swimming pools, public accommodations such as hotels and motels, on-site septic tank systems, food establishments such as restaurants, bars, grocery stores, school cafeterias, day care kitchens and mobile/temporary food vendors. The Division also investigates citizen's complaints and nuisance situations.
• The Building Safety division has adopted the International Building Codes in order to create a safe environment. The division provides inspection, plan review and investigative services to the unincorporated areas of the County and also to those cities that have entered into intergovernmental
Pinal County Housing Needs Assessment – March 2008 Final Draft
Kuehl Enterprises LLC PO Box 642 Humboldt, AZ 86329 Page 82
agreements (IGA) with the County to provide building code services. The division also provides plan review and inspection services for County construction projects.
• The Planning division includes among its primary activities comprehensive planning. The comprehensive plan is a tool a County uses to determine development needs and sets the goals and objectives that direct future land use development. The comprehensive plan is a general and flexible guide that reflects the shared attitudes and values of a community around the way a community believes it should develop. The County’s Comprehensive Plan is currently being updated.
Local government. All local jurisdictions facilitate the development of housing through land-use planning, zoning ordinances and subdivision regulations. Many local jurisdictions choose to play an additional role by providing financial incentives and regulatory relief, participating in state and regional housing programs and supporting either local or countywide programs and projects. Local governments are also responsible for ensuring the health and safety of local residents and the structural soundness and livability of the local housing stock via building permits and inspections. Some local jurisdictions recognize housing quality, variety and affordability as key to individual and community economic and social well being. These jurisdictions further facilitate housing production and preservation by applying for funding from applicable grant and loan programs, working with developers and local residents to blend affordable housing into new and existing neighborhoods, and expediting review processes. Specific activities of local jurisdictions are described elsewhere in this document.

Pinal County Housing Needs Assessment – March 2008 Final Draft
Kuehl Enterprises LLC PO Box 642 Humboldt, AZ 86329 Page 83
HOUSING NEEDS AND THE HOUSING MARKET CONCLUSIONS
This needs assessment describes and defines socio-economic and housing conditions on a County-wide basis, and by jurisdiction or market area, when appropriate data is available. This information is critical to informing policy that will positively impact housing conditions. It is also critical to taking the concept of need and translating it to a quantification of demand. When choosing policies and actions to meet the identified needs of households, it is important to give equal weight to the impact of those decisions on both the individuals and on the overall housing market. Each policy or action will have both intended and unintended outcomes, some of which will be positive and others that may be negative. Housing choice and housing markets are comprised of three components – quality, variety and affordability. The following key conclusions are further categorized into two separate yet inter-related submarkets – homeownership and rental. Socio-economic factors further define the housing market within each of these components and categories.
Housing Variety
In general, the trend during the 2000 to 2006 housing boom was to build more single-family housing units and add fewer multi-family and manufactured housing units. While this trend was largely driven by demand, single-family housing is generally more expensive than other types of housing. In terms of housing variety, three submarkets exist in Pinal County:
1. Primarily single-family with limited multi-family. More than 70% of residential structures are single-family structures and 10% or fewer are multi-family structures. This includes unincorporated Pinal County, Coolidge, Kearny, Maricopa, Oracle, Queen Creek, San Manuel and Superior.
2. Mixed single-family and manufactured housing. More than 30% of the housing stock is manufactured housing. This includes Apache Junction, Florence and Mammoth.
3. Mixed variety. This includes Casa Grande and Eloy.
Housing Quality
The age of the housing stock is one indicator of housing quality. Four trends are evident in Pinal County: 1. Housing boom. Fifty percent or more of the housing stock has been built since April 2000. This includes unincorporated Pinal County, Maricopa
and Queen Creek. 2. Newer. Fifty percent or more of the housing stock has been built since 1990. This includes Apache Junction, Casa Grande, and Oracle. 3. Consistent. The age of the housing stock is distributed fairly evenly in Florence. 4. Aging. Fifty percent or more of the housing stock was built prior to 1980. This includes Coolidge, Eloy, Kearny, Mammoth, San Manuel and
Superior.
Pinal County Housing Needs Assessment – March 2008 Final Draft
Kuehl Enterprises LLC PO Box 642 Humboldt, AZ 86329 Page 84
Homeownership and Home Purchase Affordability
Older householders and married couple families are more likely to own than rent. Homeownership becomes more prevalent as householders age and continues at a steady rate until after the age of 75 years. Married couple families are more likely to be homeowners than are other family types. Married couples with dependent children and single people are equally likely to own a home. Single parents with dependent children are the least likely to be homeowners. Housing values and prices increased in most areas of the country during the housing boom. Housing values and prices in Pinal County during the boom fall into three categories based on market area (the defined jurisdiction and properties addressed):
1. More than doubled –unincorporated Pinal County, Casa Grande, Eloy, Florence, Maricopa, Oracle, Queen Creek and Superior. 2. Fifty percent to ninety percent increase - Apache Junction, Coolidge and Kearny. 3. Less than fifty percent increase - Mammoth and San Manuel.
Slowing market. Since the housing market has slowed, existing sales prices are dropping - in some communities by as much as 12%. Sales volume in the resale market dropped 36% from 4th quarter 2006 to 3rd quarter 2007 and sales volume of new units dropped 12% during the same period. Continued slowing in the market may mean values and prices decline further. Cost burdened owners. From 2000 to 2006, the percentage of owners paying more than 50% of household income for housing costs increased 80% among owners with a mortgage and 187% among owners without a mortgage. Housing affordability is defined by the relationship of income to housing prices. Housing affordability in 2006 falls into three categories based on local estimated median income:
1. Direct Metropolitan Link. Purchasing in these areas requires more than 1.5 times the estimated median income, including unincorporated Pinal County, Apache Junction, Maricopa, Oracle, and Queen Creek.
2. Localized. Purchasing in these areas requires 1 to 1.5 times the estimated median income, including Casa Grande, Coolidge, Eloy, Florence, and Superior.
3. Affordable. Purchasing in these areas requires less than estimated median income to purchase, including Kearny, Mammoth and San Manuel.
Rentals, Rental Affordability and Rental Units Needed
Lower median income. Pinal County renters had a median income that was 68% of the County median income in 2000. Older housing stock. Renters are more likely to occupy housing built before 1980 than housing built between 1980 and March 2000. Newer single-family rentals. Single-family units represent a large proportion of the overall growth in the housing stock and in the rental stock. Sixty-one percent of registered rental structures have been built since 2000. Rents charged on new single-family units are not readily available yet directly influence overall rental affordability. A large volume of rental units, both old and new, were purchased during the housing boom. These units are at higher risk of foreclosure due to the higher likelihood that investors utilized creative financing.

Pinal County Housing Needs Assessment – March 2008 Final Draft
Kuehl Enterprises LLC PO Box 642 Humboldt, AZ 86329 Page 85
Cost burdened Renters. Overall, nearly four of ten renters paid more than 30% of household income for rent and utilities in 2006. Cost burden was more prevalent for lower income renters, with six of ten renters earning less than $19,999 paying more than 30% of household income for rent and utilities in 2006. Nearly one-half (47.6%) of renters earning between $20,000 and $34,999 paid more than 30% of household income for housing. Estimated Rental Units Needed. In 2000, an estimated 165 rental units renting for $375/month or less, including utilities, were needed in Pinal County. With increased rents and the larger volume of single-family rentals added since 2000, this estimate is likely somewhat low even with increased incomes. Housing Choice. Among rental units with 2 or more bedrooms, the vacancy rate is high among those with 1 bathroom.
Other Market Factors
Seasonal Occupancy. In 2000, Pinal County had a relatively high vacancy rate. The overall vacancy rate was 24.4%. Over sixty percent (61.8%) of vacant housing units were seasonal units. Seasonal occupancy in Pinal County presents unique challenges for many communities. Those communities with seasonal vacancies accounting for more than 50% of overall vacancy in 2000 include: unincorporated Pinal County, Apache Junction, Coolidge, Florence, and Maricopa. Tenure. The overall homeownership rate in Pinal County was relatively high at 70% in 2000. Lower homeownership rates at that time were identified in Casa Grande, Coolidge, Eloy and Maricopa. Creative / Liberal Financing and Subprime Lending played a key role in the 2000 to 2006 housing boom. If the boom were purely a function of supply and demand, both sales prices and rents would have increased in relative proportion. Instead, housing prices more than doubled (up 131%) while rents increased 30%. Lenders are tightening underwriting standards and subprime lenders are going out of business. The combination of fewer loan products with higher underwriting standards means that owners’ options for refinancing are becoming increasingly limited. Many loans are becoming more expensive and the creative financing that originally stretched buyer qualifications is simply no longer available. Foreclosure Risk. The estimated risk of foreclosure in Pinal County is 3,680 units financed or refinanced using subprime loans between 2000 and 2006. This may be the most significant current market condition in Pinal County. The volume of subprime and adjustable rate loans in Pinal County is high, with at least 7,267 loans made by subprime lenders between 2000 and 2004. In the 2nd quarter of 2007, subprime loans accounted for 54% of loans in foreclosure in the United States, so the rate of foreclosure among these loans is also high. Drive Until You Qualify. The relationship of Pinal County’s housing market to Maricopa County leaves it vulnerable to market shifts in the metropolitan area economy. The high volume of units and the resulting lower prices available closer to employment centers in Maricopa County means that more households may choose housing located closer to work.

Pinal County Housing Needs Assessment – March 2008 Final Draft
Kuehl Enterprises LLC PO Box 642 Humboldt, AZ 86329 Page 86
Excess Supply and Continued Production. An estimated 18-month supply of housing is available in the Phoenix metropolitan housing market, which includes many parts of Pinal County. Builders have continued to draw permits and produce housing. If new housing is produced at a rate to meet new demand, then the excess supply will remain for some time. Housing prices are likely to continue to decline as the supply remains high. Converging market trends place homeowners as well as investors, particularly those who purchased recently or have adjustable rate or subprime loans, in a position where their choices are limited. Declining home prices, competition from new home builders, and mortgage rate resets on adjustable rate loans are all contributing to a market slowdown and an abundant supply of property for sale. Any owner with less than 5% to 10% equity is vulnerable.
The Delivery System and Regulatory Barriers
Perhaps the greatest factor influencing housing patterns in Pinal County is the diversity of jurisdictions, building codes and requirements, and processes for working with developers. This diversity means that Pinal County has a diverse social and economic climate. This diversity is the goal of many less diverse areas of the country. Still, the diversity means that developers of affordable housing are challenged to identify how to best provide suitable units throughout the County. The delivery of affordable units is at best coordinated within a local jurisdiction, and at worst delivered in local jurisdictions or areas of the County where it may not be accessible to employment and services. Prior to the 2000 to 2006 housing boom, the private sector was able to provide housing affordable to most households earning the median income or more. Since then, housing affordability has declined and the private sector is more likely to address the housing market for households earning more than 1.5 times the area median income. Without a coordinated approach to the development of housing affordable to households at a variety of income levels, developers that may otherwise be willing to develop affordable housing are challenged. The focus of housing policies and actions are to meet identified needs through strategies and activities that have positive impacts on housing markets. Housing markets are however not defined by jurisdiction boundaries. They are instead defined by social, economic and physical boundaries. So, within Pinal County and its local jurisdictions, many markets exist. The key to successful implementation of strategies is to have a broad framework or menu of activities that could positively impact conditions in a variety of markets. Doing so recognizes that while markets are not defined by jurisdiction, the ability to implement strategies may be jurisdiction oriented.
Pinal County Housing Needs Assessment – March 2008 Final Draft
Kuehl Enterprises LLC PO Box 642 Humboldt, AZ 86329 Page 87
OVERVIEW AND CONDITIONS BY JURISDICTION
Pinal County and Unincorporated Areas
The unincorporated County consists of many areas of population concentration both small and large. The largest unincorporated areas are near the major metropolitan areas and around other local jurisdictions. The unincorporated areas generally have limited economic and social services so residents must travel for basic goods and services or to employment. Three unincorporated areas are included in this assessment – Arizona City, Oracle, and San Manuel. Other unincorporated areas, including Santan, Queen Valley and Gold Canyon were relatively small in population in 2000 but grew rapidly from 2000 to 2006. Little data is available to draw specific conclusions, and for these areas the County must examine policies and strategies similar to those examined by other high growth communities, such as Maricopa and Queen Creek.
Arizona City
While Arizona City is not an incorporated community, it is one of the larger unincorporated areas in central Pinal County. The US Census Bureau provides data for Arizona City as a Census Defined Place. Significant housing conditions in Arizona City include:
• Two-thirds of housing units were single family units and another one in five were manufactured housing or mobile home units. • In 2000, 20% of units were vacant, and the majority (59%) of these vacancies were seasonal and recreational. • A homeownership rate of 84% in 2000, with the highest homeownership rate among householders age 65 and older and married couple families
with no dependent children, which were also the most common age ranges and family types. • The greatest proportion (51%) of the housing stock built between 1990 and March 2000, with a steady rate of development in the 1980s and
1990s. • The median price asked for a housing unit in 2000 was $80,500 and in 2006 was $139,900. • 15.9% of home purchase and refinance loans made between 2000 and 2004 were made by subprime lenders.
Oracle
While Oracle is not an incorporated community, it is one of the larger unincorporated areas in southern Pinal County. The US Census Bureau provides data for Oracle as it is a Census Defined Place. Significant housing conditions in Oracle include:
• Nearly three quarters of housing units are single-family housing units and one in five are manufactured housing units or mobile homes. • The community doubled in size from 2000 to 2006. The majority of that growth was single-family housing units. • 13% of units were vacant in 2000, and the majority of vacancies were for rent. • A homeownership rate of 87% in 2000. Homeownership rates were highest among householders age 35 to 64, and married couples with no
dependent children. These were also the most common age ranges and family types. • Four in ten housing units have been built since 2000. Another quarter were built between 1960 and 1979.

Pinal County Housing Needs Assessment – March 2008 Final Draft
Kuehl Enterprises LLC PO Box 642 Humboldt, AZ 86329 Page 88
• The median price asked for a housing unit in 2000 was $88,000 and in 2006 was $370,350. • Home purchase affordability declined an estimated 140% from 2000 to 2006. • 8.7% of home purchase and refinance loans made between 2000 and 2004 were made by subprime lenders.
San Manuel
Like Arizona City and Oracle, San Manuel is not an incorporated community, but it is one of the larger unincorporated areas in southern Pinal County. The US Census Bureau provides data for San Manuel as it is a Census Defined Place. Significant housing conditions in San Manuel include:
• Nearly three quarters of housing units are single-family housing units and one in five are manufactured housing units or mobile homes. • The community has experienced little growth since 2000, with 133 units permitted between 2000 and 2006. • 20% of units were vacant in 2000, and the majority of vacancies were for rent. • A homeownership rate of 80% in 2000. Homeownership rates were highest among householders age 45 and older, and married couples with no
dependent children. The most prevalent age group was age 35 to 44, and the most prevalent family types were married couples, both with dependent children and without dependent children.
• Nearly one half of housing units were built before 1958 and another three in five were built between 1960 and 1979. • The median price asked for a housing unit in 2000 was $71,500 and in 2006 was $90,750. • Home purchase affordability increased an estimated 33% from 2000 to 2006. • 27.5% of home purchase and refinance loans made between 2000 and 2004 were made by subprime lenders.
Unincorporated Pinal County
The County is the primary unit of government that would have housing policies and programs that positively impact the housing-related needs of residents. At the same time, many factors impact their ability to do so. Infrastructure, planning and zoning, economic opportunity, and changing demographics all impact, either positively or negatively, a jurisdicition’s ability to address housing-related needs. The County is in the process of developing a Comprehensive Plan that will incorporate a vision and new land use, economic development and other elements that will impact upon housing quality, variety and affordability. In the unincorporated County, these factors include the following:
• In 2006, single family units accounted for nearly three-quarters (72.5%) of the housing stock, and manufactured housing accounted for approximately one-quarter (24.2%) of the housing stock.
• Nearly all (90%) of the housing stock added between 2000 and 2006 were single-family units and manufactured housing represented the other 10% of additional units.
• Eighty percent of units are occupied. Among vacancies, one-half (52.1%) are seasonal vacancies. Vacancy rates are much lower in the cooler winter months and higher in the hotter summer months.

Pinal County Housing Needs Assessment – March 2008 Final Draft
Kuehl Enterprises LLC PO Box 642 Humboldt, AZ 86329 Page 89
• A homeownership rate of 82% in 2000, with the highest homeownership rates among householders age 65 and older and married couples with no dependent children. Married couples with no dependent children are the most prevalent family type; however householders are more likely to be under the age of 65 years old.
• Nearly one-half (49.1%) of the housing stock was build between 2000 and 2006. • The median price asked for a housing unit in 2000 was $83,000 and in 2006 was $191,500 - an increase of 131%. During the same period
median income increased from $35,856 to $43,637 – an increase of 18%. • In 2000, a household earning 78% or more of the county median income could afford to purchase a median-valued unit. In 2000, a household
earning 157% of the county median income could afford to purchase a median-priced resale unit. • 15.8% of home purchase and refinance loans made between 2000 and 2004 were made by subprime lenders.
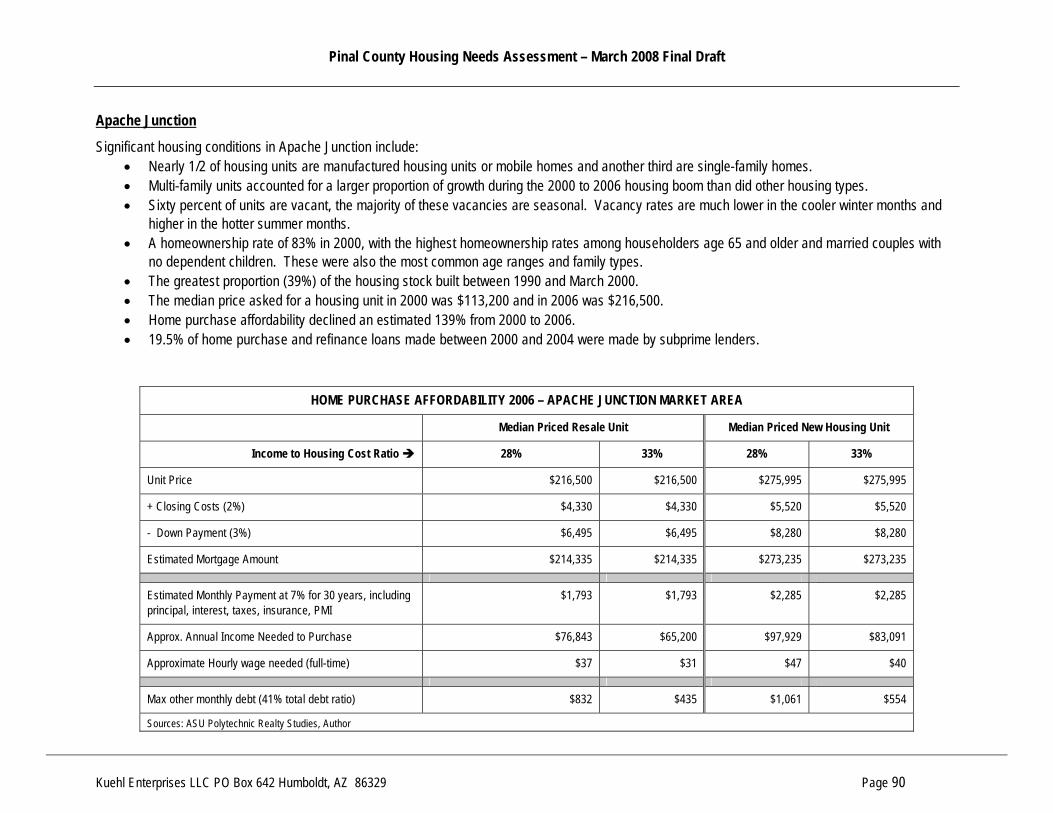
Pinal County Housing Needs Assessment – March 2008 Final Draft
Kuehl Enterprises LLC PO Box 642 Humboldt, AZ 86329 Page 90
Apache Junction
Significant housing conditions in Apache Junction include: • Nearly 1/2 of housing units are manufactured housing units or mobile homes and another third are single-family homes. • Multi-family units accounted for a larger proportion of growth during the 2000 to 2006 housing boom than did other housing types. • Sixty percent of units are vacant, the majority of these vacancies are seasonal. Vacancy rates are much lower in the cooler winter months and
higher in the hotter summer months. • A homeownership rate of 83% in 2000, with the highest homeownership rates among householders age 65 and older and married couples with
no dependent children. These were also the most common age ranges and family types. • The greatest proportion (39%) of the housing stock built between 1990 and March 2000. • The median price asked for a housing unit in 2000 was $113,200 and in 2006 was $216,500. • Home purchase affordability declined an estimated 139% from 2000 to 2006. • 19.5% of home purchase and refinance loans made between 2000 and 2004 were made by subprime lenders.
HOME PURCHASE AFFORDABILITY 2006 – APACHE JUNCTION MARKET AREA
Median Priced Resale Unit Median Priced New Housing Unit
Income to Housing Cost Ratio 28% 33% 28% 33%
Unit Price $216,500 $216,500 $275,995 $275,995
+ Closing Costs (2%) $4,330 $4,330 $5,520 $5,520
- Down Payment (3%) $6,495 $6,495 $8,280 $8,280
Estimated Mortgage Amount $214,335 $214,335 $273,235 $273,235
Estimated Monthly Payment at 7% for 30 years, including principal, interest, taxes, insurance, PMI
$1,793 $1,793 $2,285 $2,285
Approx. Annual Income Needed to Purchase $76,843 $65,200 $97,929 $83,091
Approximate Hourly wage needed (full-time) $37 $31 $47 $40
Max other monthly debt (41% total debt ratio) $832 $435 $1,061 $554
Sources: ASU Polytechnic Realty Studies, Author
Pinal County Housing Needs Assessment – March 2008 Final Draft
Kuehl Enterprises LLC PO Box 642 Humboldt, AZ 86329 Page 91
Communities often wish to have housing policies and programs that positively impact the housing-related needs of residents. At the same time, many factors impact their ability to do so. Infrastructure, planning and zoning, economic opportunity, and changing demographics all impact, either positively or negatively, a community’s ability to address housing-related needs. In Apache Junction, these factors include the following: The City does not own or operate water and sewer services. Without City ownership and operation, planning and coordination is made more difficult, particularly for new development.
• There are dual water providers – one water district and one private. The water district created a master plan in 2001 and an update of that plan is underway. The private water company has a map but no plan; a 5-year plan is currently underway.
• There is one sewer district with no requirement to hook up unless the household is within a specific distance. • To permit development, the Superstition Community Facilities District developed a master plan.
A variety of plans have been developed to support the community:
• Small area transportation study. • Stormwater master plan. • Drainage plan. • Transportation master plan. • An Infill Incentive Plan to encourage commercial and retail development in the downtown by offering a package of incentives.
The Code Compliance Division works to preserve and enhance the safety and appearance of the community by administering a program that emphasize voluntary compliance with City codes such as property maintenance, zoning and building safety codes. The condition of buildings and properties is monitored so that efforts can be undertaken to abate dangerous building and property conditions. Specific to housing, Apache Junction offers a housing rehabilitation program to help address housing quality conditions. An annual paint-a-thon, assistance with upgrades to meet medical needs, and marketing and coordination of classes for first-time homebuyers interested in Habitat for Humanity housing and the State of Arizona homeownership assistance program. Housing programs are organized by the Development Services Division and some are managed by organizations with whom the City contracts or coordinates to provide services. The City has adopted the 2006 International Building Code. The City has graduated permit fees based on valuation. There are few areas designated for higher-density housing types. Higher-density housing is generally more affordable than lower density housing.

Pinal County Housing Needs Assessment – March 2008 Final Draft
Kuehl Enterprises LLC PO Box 642 Humboldt, AZ 86329 Page 92
Casa Grande
Significant housing conditions in Casa Grande include: • Nearly 2/3 of housing units are single-family housing units and another quarter are manufactured housing units or mobile homes. • Single-family units accounted for a larger proportion of growth during the 2000 to 2006 housing boom than did other housing types. • Nineteen percent of units are vacant, and over half of these vacancies are seasonal. Vacancy rates are much lower in the cooler winter months
and higher in the hotter summer months. • A homeownership rate of 64% in 2000 was among the lowest in the County. Homeownership rates were highest among householders age 65
and older, and married couples with no dependent children. The most prevalent age group was aged 35 to 44 and the most prevalent family type was married couples with no dependent children.
• The greatest proportion (38%) of the housing stock built between 2000 and 2006. • The median price asked for a housing unit in 2000 was $80,000 and in 2006 was $160,000. • Home purchase affordability declined an estimated 65% from 2000 to 2006. • 16.2% of home purchase and refinance loans made between 2000 and 2004 were made by subprime lenders.
HOME PURCHASE AFFORDABILITY 2006 – CASA GRANDE MARKET AREA
Median Priced Resale Unit Median Priced New Housing Unit
Income to Housing Cost Ratio 28% 33% 28% 33%
Unit Price $160,000 $160,000 $236,990 $236,990
+ Closing Costs (2%) $3,200 $3,200 $4,740 $4,740
- Down Payment (3%) $4,800 $4,800 $7,110 $7,110
Estimated Mortgage Amount $158,400 $158,400 $234,620 $234,620
Estimated Monthly Payment at 7% for 30 years, including principal, interest, taxes, insurance, PMI
$1,325 $1,325 $1,962 $1,962
Approx. Annual Income Needed to Purchase $56,786 $48,182 $84,086 $71,345
Approximate Hourly wage needed (full-time) $27 $23 $40 $34
Max other monthly debt (41% total debt ratio) $615 $321 $911 $476
Sources: ASU Polytechnic Realty Studies, Author
Pinal County Housing Needs Assessment – March 2008 Final Draft
Kuehl Enterprises LLC PO Box 642 Humboldt, AZ 86329 Page 93
Communities often wish to have housing policies and programs that positively impact the housing-related needs of residents. At the same time, many factors impact their ability to do so. Infrastructure, planning and zoning, economic opportunity, and changing demographics all impact, either positively or negatively, a community’s ability to address housing-related needs. In Casa Grande, these factors include the following: Specific to Housing, the City has five employees and two contracted field staff, all of whom are grant funded. The City has a Housing & Neighborhood Revitalization Division implements housing programs and other revitalization efforts. These efforts include infrastructure such as sewer and streets, leisure services such as parks, and playground equipment, and beautification programs, such as clean-ups, to improve the socio-economic environment in older neighborhoods. Housing programs are part of the Neighborhood Revitalization Division and Housing operates: • A USDA, Rural development funded “Mutual self-Help Housing Program” to provide Homeownership opportunities to families at or below 80% of
median income. The program has been in existence since 1987 and faces extinction due to population increases. • A Housing Rehabilitation Program that typically assists owners of housing located in older neighborhoods where neighborhood studies (from the mid-
90’s) showed 75% of the units were in need of repair. The program can assist families earning up to 80% of County median income, yet funds typically assist families that are very low income or earn less than 50% of the County median income. Twelve to fifteen families are helped each year; the waiting list is from 2 to 3 years.
• Housing counseling and education services are provided to all participants in City programs. The City has development impact fees for water, sewer, community services (parks and library), police, transportation, general government and fire/ems. Fees are flat for residential development, which is categorized as single-family, multi-family or other housing. Multi-family and other housing pay a lower fee than single-family housing. Over one-third (34.4%) of zoned land is zoned for low-density residential use. Comparatively 1.7% is zoned for high-density residential use and less than 1% is zoned for manufactured housing communities. Higher-density residential and manufactured housing are typically the most affordable and providing sufficient land for development of these opportunities will heavily influence housing variety. The City’s General Plan 2010 includes goals and objectives specific to housing affordability. These goals and objectives also consider housing variety and quality. By incorporating affordable housing into its general plan, the City ensures that the full range of housing conditions is considered as it grows and changes demographically and economically. Housing-specific goals and objectives in the City’s General Plan include:
• Ensuring opportunities for fair housing, as well as decent, safe and affordable housing choices. • Maintaining and improving the existing affordable housing stock. • Preserving the quality and appearance of the housing stock and overall appearance of the community. • Continuing to provide housing rehabilitation and improvement programs for owner-occupied properties. • Increasing the supply of affordable housing for low- and moderate-income families through a variety of sources that support and finance
development.
Pinal County Housing Needs Assessment – March 2008 Final Draft
Kuehl Enterprises LLC PO Box 642 Humboldt, AZ 86329 Page 94
Coolidge
Significant housing conditions in Coolidge include: • Three quarters of housing units are single-family housing units and the remaining units are fairly evenly distributed among multi-family units and
manufactured housing units or mobile homes. • Single-family units accounted for a larger proportion of growth during the 2000 to 2006 housing boom than did other housing types. Still, other
housing types were also frequently built. • Eighteen percent of units were vacant in 2000, and over half of these vacancies are seasonal. Vacancy rates are much lower in the cooler winter
months and higher in the hotter summer months. • A homeownership rate of 67% in 2000 was among the lowest in the County. Homeownership rates were highest among householders age 65
and older, and married couples with no dependent children. The most prevalent age group was aged 35 to 44 and the most prevalent family type was married couples with no dependent children.
• The age of the housing stock is fairly evenly distributed, with nearly one quarter of housing units built prior to 1960, one quarter built between 1960 and 1979, and one quarter built since 2000. Fewer units were built between 1980 and 2000.
• The median price asked for a housing unit in 2000 was $62,000 and in 2006 was $101,000. • Home purchase affordability declined an estimated 50% from 2000 to 2006. • 37.8% of home purchase and refinance loans made between 2000 and 2004 were made by subprime lenders.
Communities often wish to have housing policies and programs that positively impact the housing-related needs of residents. At the same time, many factors impact their ability to do so. Infrastructure, planning and zoning, economic opportunity, and changing demographics all impact, either positively or negatively, a community’s ability to address housing-related needs. In Coolidge, these factors include the following: Codes currently in place in Coolidge are:
• 2000 International Building Code • 2000 International Residential Code • 2000 Uniform Mechanical Code • 2000 International Fire Code • 2002 National Electrical Code • 1994 Uniform Plumbing Code/Arizona State Plumbing Code
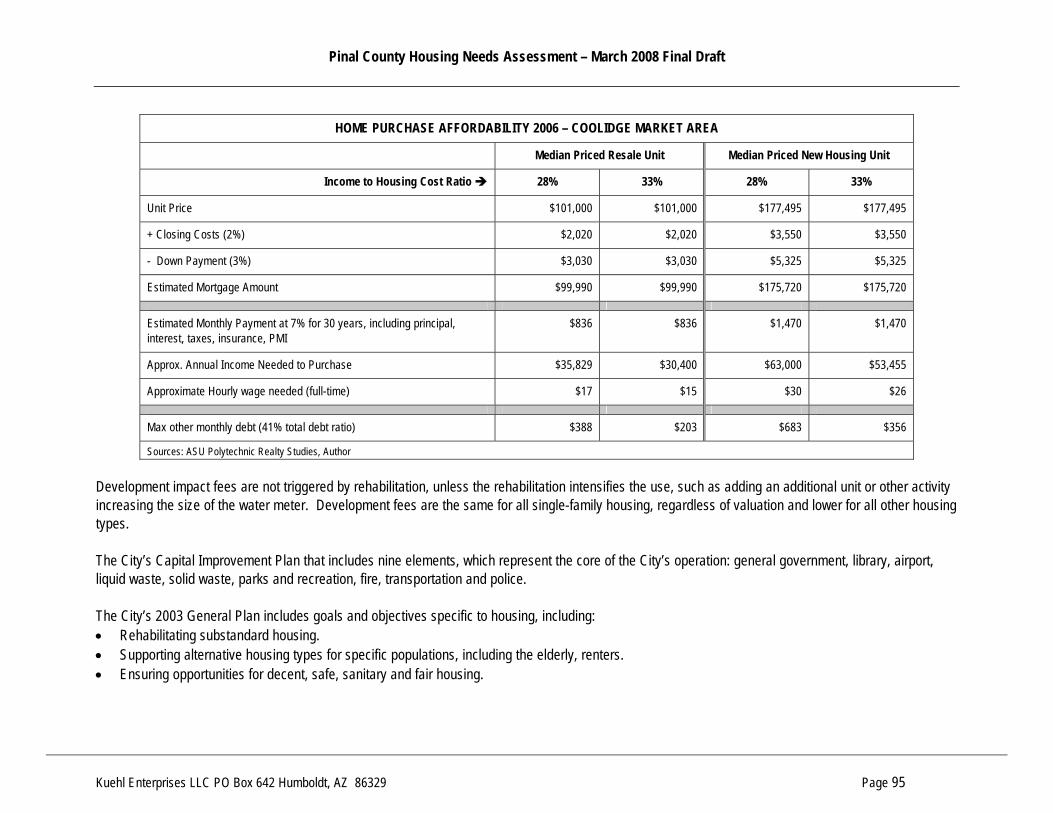
Pinal County Housing Needs Assessment – March 2008 Final Draft
Kuehl Enterprises LLC PO Box 642 Humboldt, AZ 86329 Page 95
HOME PURCHASE AFFORDABILITY 2006 – COOLIDGE MARKET AREA
Median Priced Resale Unit Median Priced New Housing Unit
Income to Housing Cost Ratio 28% 33% 28% 33%
Unit Price $101,000 $101,000 $177,495 $177,495
+ Closing Costs (2%) $2,020 $2,020 $3,550 $3,550
- Down Payment (3%) $3,030 $3,030 $5,325 $5,325
Estimated Mortgage Amount $99,990 $99,990 $175,720 $175,720
Estimated Monthly Payment at 7% for 30 years, including principal, interest, taxes, insurance, PMI
$836 $836 $1,470 $1,470
Approx. Annual Income Needed to Purchase $35,829 $30,400 $63,000 $53,455
Approximate Hourly wage needed (full-time) $17 $15 $30 $26
Max other monthly debt (41% total debt ratio) $388 $203 $683 $356
Sources: ASU Polytechnic Realty Studies, Author Development impact fees are not triggered by rehabilitation, unless the rehabilitation intensifies the use, such as adding an additional unit or other activity increasing the size of the water meter. Development fees are the same for all single-family housing, regardless of valuation and lower for all other housing types. The City’s Capital Improvement Plan that includes nine elements, which represent the core of the City’s operation: general government, library, airport, liquid waste, solid waste, parks and recreation, fire, transportation and police. The City’s 2003 General Plan includes goals and objectives specific to housing, including: • Rehabilitating substandard housing. • Supporting alternative housing types for specific populations, including the elderly, renters. • Ensuring opportunities for decent, safe, sanitary and fair housing.
Pinal County Housing Needs Assessment – March 2008 Final Draft
Kuehl Enterprises LLC PO Box 642 Humboldt, AZ 86329 Page 96
• Maintaining and improving the existing affordable housing stock and the overall environment of the community through continuing housing rehabilitation programs, code enforcement activities, referral services, voluntary demolition, and neighborhood improvement programs that support community and historic character.
• Increasing the supply of affordable housing for low- and moderate-income families through a variety of sources that support and finance development. This includes applying for available government resources, using the Capital Improvement Program to improve deficient infrastructure in mature neighborhoods, developing standards for a density bonus program to promote affordable housing in large projects, coordinating with nonprofit and other government organizations, examining ways to incent developers to reduce costs when long-term affordability is assured, and using affordable housing as a tool for stimulating job opportunities for residents.
• Providing a manufactured home zone to promote affordable housing development at medium densities.

Pinal County Housing Needs Assessment – March 2008 Final Draft
Kuehl Enterprises LLC PO Box 642 Humboldt, AZ 86329 Page 97
Eloy
Significant housing conditions in Eloy include: • Six in ten housing units are single-family housing units and one quarter are manufactured housing units or mobile homes. • Manufactured housing units accounted for a larger proportion of growth during the 2000 to 2006 housing boom than did other housing types. • Only ten percent of units were vacant in 2000, and the majority of these were rental vacancies. • A homeownership rate of 64% in 2000 was among the lowest in the County. Homeownership rates were highest among householders age 55
and older, and married couples with no dependent children. The most prevalent age group was aged 35 to 44 and the most prevalent family type was married couples with dependent children. This indicates that the most prevalent family types and age groups were having difficulty or otherwise do not wish to purchase housing in Eloy.
• The age of the housing stock is older than in most other central County communities, with four in ten units built between 1960 and 1979 and another two in ten built before 1959.
• The median price asked for a housing unit in 2000 was $49,600 and in 2006 was $106,000. • Home purchase affordability declined an estimated 80% from 2000 to 2006. • 24.9% of home purchase and refinance loans made between 2000 and 2004 were made by subprime lenders.
Communities often wish to have housing policies and programs that positively impact the housing-related needs of residents. At the same time, many factors impact their ability to do so. Infrastructure, planning and zoning, economic opportunity, and changing demographics all impact, either positively or negatively, a community’s ability to address housing-related needs. In Eloy, these factors include the following: The City is in the process of updating its general plan. The following codes are in place in Eloy:
• 1997 Uniform Administrative Code • 2003 International Building Code • 2003 International Residential Code
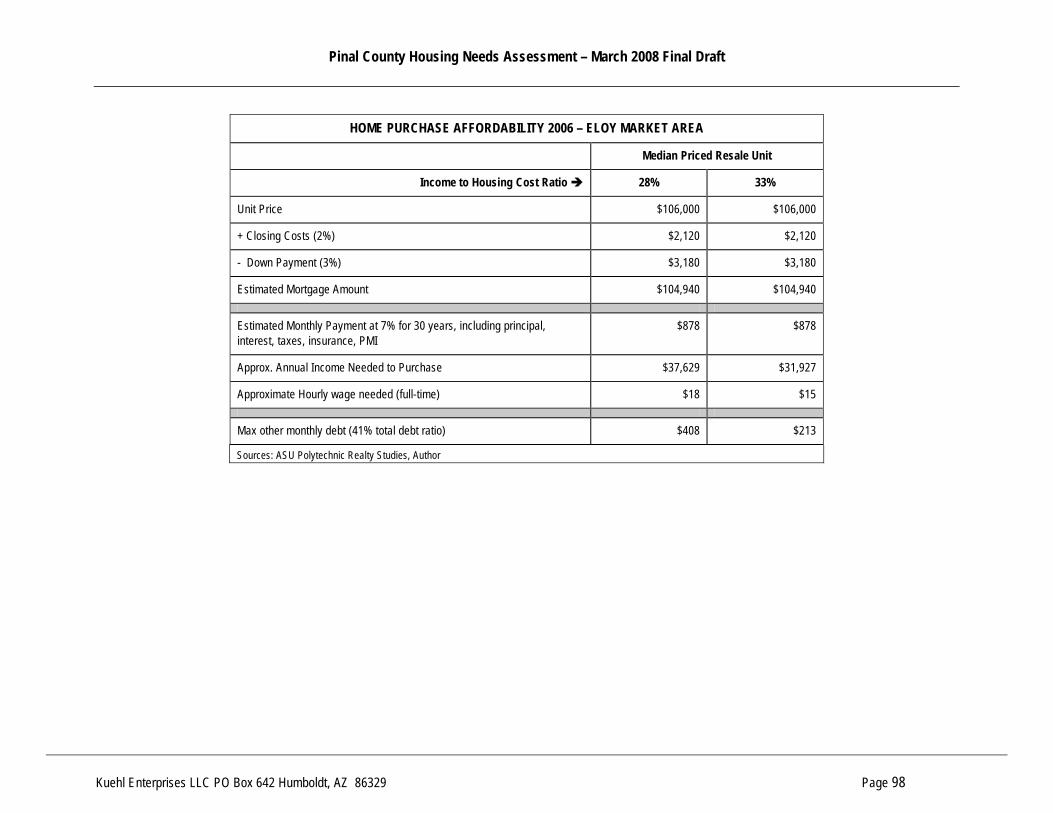
Pinal County Housing Needs Assessment – March 2008 Final Draft
Kuehl Enterprises LLC PO Box 642 Humboldt, AZ 86329 Page 98
HOME PURCHASE AFFORDABILITY 2006 – ELOY MARKET AREA
Median Priced Resale Unit
Income to Housing Cost Ratio 28% 33%
Unit Price $106,000 $106,000
+ Closing Costs (2%) $2,120 $2,120
- Down Payment (3%) $3,180 $3,180
Estimated Mortgage Amount $104,940 $104,940
Estimated Monthly Payment at 7% for 30 years, including principal, interest, taxes, insurance, PMI
$878 $878
Approx. Annual Income Needed to Purchase $37,629 $31,927
Approximate Hourly wage needed (full-time) $18 $15
Max other monthly debt (41% total debt ratio) $408 $213
Sources: ASU Polytechnic Realty Studies, Author
Pinal County Housing Needs Assessment – March 2008 Final Draft
Kuehl Enterprises LLC PO Box 642 Humboldt, AZ 86329 Page 99
Florence
Significant housing conditions in Florence include: • Four in ten housing units are single-family housing units and four in ten are manufactured housing units or mobile homes. • Single-family housing units accounted for a larger proportion of growth during the 2000 to 2006 housing boom than did other housing types. • Thirty-one percent of units were vacant in 2000, and the majority (66%) of vacancies were seasonal. Vacancy rates are lower in the cooler
winter months and higher in the hotter summer months. • A homeownership rate of 69% in 2000. Homeownership rates were highest among householders age 65 and older, and married couples with no
dependent children. These were also the most common age ranges and family types. • The age of the housing stock is fairly evenly distributed with 30% built between 1990 and March 200, 20% built between 1980 and 1989.
Housing built before 1959 is as prevalent as housing built since 2000, with each representing 13.5% of the housing stock. • The median price asked for a housing unit in 2000 was $75,600 and in 2006 was $169,000. • Home purchase affordability declined an estimated 94% from 2000 to 2006. • 19.3% of home purchase and refinance loans made between 2000 and 2004 were made by subprime lenders.
Communities often wish to have housing policies and programs that positively impact the housing-related needs of residents. At the same time, many factors impact their ability to do so. Infrastructure, planning and zoning, economic opportunity, and changing demographics all impact, either positively or negatively, a community’s ability to address housing-related needs. In Florence, these factors include the following: The Town of Florence adopted a development code in 2006. The development code includes the following housing-specific options: Minimum lot area coverage to encourage affordability or create housing for specific populations such as active retirees. Building permit fees are based on valuation and graduated so that less costly housing pays a lower fee. Development impact fees are in place for transportation, general government, public works, police, fire/ems, parks and community facilities, library and sanitation. These fees are flat for single-family residential and other types of residential units. The Town partners with the school district to build one home annually for a local family. The Town does not implement or sponsor other housing programs.

Pinal County Housing Needs Assessment – March 2008 Final Draft
Kuehl Enterprises LLC PO Box 642 Humboldt, AZ 86329 Page 100
HOME PURCHASE AFFORDABILITY 2006 – FLORENCE MARKET AREA
Median Priced Resale Unit Median Priced New Housing Unit
Income to Housing Cost Ratio 28% 33% 28% 33%
Unit Price $169,000 $169,000 $193,495 $193,495
+ Closing Costs (2%) $3,380 $3,380 $3,870 $3,870
- Down Payment (3%) $5,070 $5,070 $5,805 $5,805
Estimated Mortgage Amount $167,310 $167,310 $191,560 $191,560
Estimated Monthly Payment at 7% for 30 years, including principal, interest, taxes, insurance, PMI
$1,399 $1,399 $1,602 $1,602
Approx. Annual Income Needed to Purchase $59,957 $50,873 $68,657 $58,255
Approximate Hourly wage needed (full-time) $29 $24 $33 $28
Max other monthly debt (41% total debt ratio) $650 $339 $744 $388
Sources: ASU Polytechnic Realty Studies, Author

Pinal County Housing Needs Assessment – March 2008 Final Draft
Kuehl Enterprises LLC PO Box 642 Humboldt, AZ 86329 Page 101
Kearny
Significant housing conditions in Kearny include: • Nearly nine in ten housing units are single-family housing units. • There was very little growth in housing since 2000. • Only 10% of units were vacant in 2000, and the majority of vacancies were for rent. • A homeownership rate of 82% in 2000. Homeownership rates were highest among householders age 65 and older, and married couples with no
dependent children. These were also the most common age ranges and family types. • Nine in ten housing units was built before 1979. • The median price asked for a housing unit in 2000 was $56,600 and in 2006 was $96,000. • Home purchase affordability declined an estimated 39% from 2000 to 2006. • 26.5% of home purchase and refinance loans made between 2000 and 2004 were made by subprime lenders.
HOME PURCHASE AFFORDABILITY 2006 – KEARNY MARKET AREA
Median Priced Resale Unit
Income to Housing Cost Ratio 28% 33%
Unit Price $96,000 $96,000
+ Closing Costs (2%) $1,920 $1,920
- Down Payment (3%) $2,880 $2,880
Estimated Mortgage Amount $95,040 $95,040
Estimated Monthly Payment at 7% for 30 years, including principal, interest, taxes, insurance, PMI
$795 $795
Approx. Annual Income Needed to Purchase $34,071 $28,909
Approximate Hourly wage needed (full-time) $16 $14
Max other monthly debt (41% total debt ratio) $369 $193
Communities often wish to have housing policies and programs that positively impact the housing-related needs of residents. At the same time, many factors impact their ability to do so. Infrastructure, planning and zoning, economic opportunity, and changing demographics all impact, either positively or negatively, a community’s ability to address housing-related needs. Smaller communities such as Kearny may occasionally utilize community development resources for housing purposes, yet the majority of government resources are usually focused on providing infrastructure and basic community services and amenities. The Town administration consists of public works including water, sewer, garbage and streets, recreation including a swimming pool, park and teen center, library, airport, and volunteer fire, full-time ambulance services, and police services.
Sources: ASU Polytechnic Realty Studies, Author
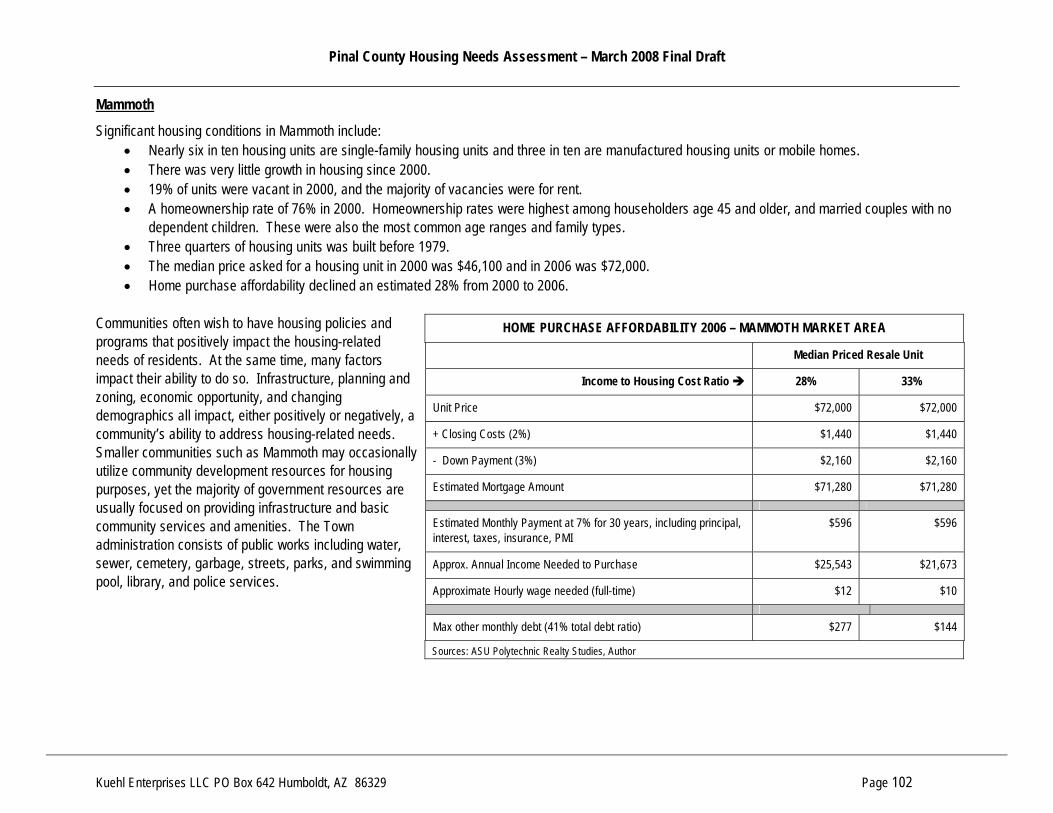
Pinal County Housing Needs Assessment – March 2008 Final Draft
Kuehl Enterprises LLC PO Box 642 Humboldt, AZ 86329 Page 102
Mammoth
Significant housing conditions in Mammoth include: • Nearly six in ten housing units are single-family housing units and three in ten are manufactured housing units or mobile homes. • There was very little growth in housing since 2000. • 19% of units were vacant in 2000, and the majority of vacancies were for rent. • A homeownership rate of 76% in 2000. Homeownership rates were highest among householders age 45 and older, and married couples with no
dependent children. These were also the most common age ranges and family types. • Three quarters of housing units was built before 1979. • The median price asked for a housing unit in 2000 was $46,100 and in 2006 was $72,000. • Home purchase affordability declined an estimated 28% from 2000 to 2006.
HOME PURCHASE AFFORDABILITY 2006 – MAMMOTH MARKET AREA
Median Priced Resale Unit
Income to Housing Cost Ratio 28% 33%
Unit Price $72,000 $72,000
+ Closing Costs (2%) $1,440 $1,440
- Down Payment (3%) $2,160 $2,160
Estimated Mortgage Amount $71,280 $71,280
Estimated Monthly Payment at 7% for 30 years, including principal, interest, taxes, insurance, PMI
$596 $596
Approx. Annual Income Needed to Purchase $25,543 $21,673
Approximate Hourly wage needed (full-time) $12 $10
Max other monthly debt (41% total debt ratio) $277 $144
Communities often wish to have housing policies and programs that positively impact the housing-related needs of residents. At the same time, many factors impact their ability to do so. Infrastructure, planning and zoning, economic opportunity, and changing demographics all impact, either positively or negatively, a community’s ability to address housing-related needs. Smaller communities such as Mammoth may occasionally utilize community development resources for housing purposes, yet the majority of government resources are usually focused on providing infrastructure and basic community services and amenities. The Town administration consists of public works including water, sewer, cemetery, garbage, streets, parks, and swimming pool, library, and police services.
Sources: ASU Polytechnic Realty Studies, Author

Pinal County Housing Needs Assessment – March 2008 Final Draft
Kuehl Enterprises LLC PO Box 642 Humboldt, AZ 86329 Page 103
Maricopa
Significant housing conditions in Maricopa include: • Nearly all (98.6%) of housing units are single-family housing units. • There was explosive growth in population and housing units from 2000 to 2006. Ninety-seven percent of housing units have been built since
2000. Nearly all of this growth was single-family housing units. • There were few housing units in 2000. At that time, most (94%) were occupied. • A low homeownership rate of 52% in 2000. The homeownership rate is now likely much higher. • The median value of a housing unit in 2000 was $75,500 and in 2006 the median sales price was $220,000. • Home purchase affordability declined an estimated 139% from 2000 to 2006.
HOME PURCHASE AFFORDABILITY 2006 – MARICOPA MARKET AREA
Median Priced Resale Unit Median Priced New Housing Unit
Income to Housing Cost Ratio 28% 33% 28% 33%
$219,500 $219,500 $198,000 $198,000
+ Closing Costs (2%) $4,390 $4,390 $3,960 $3,960
- Down Payment (3%) $6,585 $6,585 $5,940 $5,940
Estimated Mortgage Amount $217,305 $217,305 $196,020 $196,020
Estimated Monthly Payment at 7% for 30 years, including principal, interest, taxes, insurance, PMI
$1,817 $1,817 $1,639 $1,639
Approx. Annual Income Needed to Purchase $77,871 $66,073 $70,243 $59,600
Approximate Hourly wage needed (full-time) $37 $32 $34 $29
Max other monthly debt (41% total debt ratio) $844 $440 $761 $397
Sources: ASU Polytechnic Realty Studies, Author Communities often wish to have housing policies and programs that positively impact the housing-related needs of residents. At the same time, many factors impact their ability to do so. Infrastructure, planning and zoning, economic opportunity, and changing demographics all impact, either positively or negatively, a community’s ability to address housing-related needs. In Maricopa, these factors include the following:
Pinal County Housing Needs Assessment – March 2008 Final Draft
Kuehl Enterprises LLC PO Box 642 Humboldt, AZ 86329 Page 104
− The City adopted its general plan in 2006. The City has focused much of its resources on the public facilities and services needed in response to sharp increases in demand generated by rapid growth. Residential areas are almost exclusively single-family detached homes. Still, duplex, multi-family and other common wall dwellings are presumed to be included in future development. Maricopa citizens support a high rate of growth with the promise of the creation of a full-service community, including housing development that offers a variety of living options. The City’s vision statement includes a balance of employment and housing, and specific goals and objectives towards this vision include: • Supporting land use requests that improve the balance between housing and employment. • Establishing disbursed employment areas and mixed-use activity centers. • Allowing flexibility for mixed commercial and residential uses. • Preparing a housing element for the general plan to address community needs, diversity, design variety, and affordability. • Using zoning and subdivision standards to promote housing diversity.
− The City has very limited land identified for future high density development. However, the ability of high density residential to be included in planned
development and mixed-use zones may encourage this type of housing. − The City’s general plan includes population projections based on the explosive growth that occurred since 2000, and these growth projections differ
significantly from those included in this needs assessment. Regardless of the actual population growth that occurs, the City will have significant ongoing planning and development activity. Supporting that activity and providing appropriate infrastructure and services will continue to be the focus of the City’s efforts.
− The City has published fee schedules for both building and permits and development impact fees. Building and permit fees are graduated and based
on valuation. Development impact fees are imposed for parks and recreation, library, public safety, general government and transportation on all single-family and non-residential development. Development impact fees are used to support activities identified in the City’s Capital Improvement Plan.
According to City staff, from July 2004 to December 2007, the City of Maricopa issued a total of 16,393 new single family residential building permits. The 2007 calendar year single family permits issued actually exceeded the 2006 total: 2,535 and 2,471, respectively. Fueled by explosive growth, the population of Maricopa is expected to reach nearly 100,000 residents by 2015, offering tremendous opportunities for business and commerce in terms of population to be served. Further, City staff added that a significant driver of this population growth is due to housing affordability in Maricopa as compared to other cities in the Phoenix Metro area coupled with comparable accessibility and commute rates. The City of Maricopa has consistently retained the most affordable median home price of compared cities and the Phoenix Metro area. The local population, however, is highly educated - over 46% of residents surveyed in 2007 report a Bachelor's Degree or higher, and nearly 86% have some post-high school training.

Pinal County Housing Needs Assessment – March 2008 Final Draft
Kuehl Enterprises LLC PO Box 642 Humboldt, AZ 86329 Page 105
Queen Creek
The majority of the Town of Queen Creek is located in Maricopa County, and this needs assessment considers only that part located in Pinal County. Overall, Queen Creek has experienced growth in population and housing very similar to that described in Maricopa. Significant housing conditions in Queen Creek as defined in this Pinal County assessment include:
• There were very few housing units located in Pinal County. Of those located in Pinal County, more than eight in ten were single-family units. • Nearly all growth was single-family housing units from 2000 to 2006. • All units were occupied in 2000, and the majority (88%) by homeowners. • The median value of a housing unit 2000 was $94,000 and the median price of a housing unit 2006 was $210,000. • Home purchase affordability declined an estimated 84% from 2000 to 2006. • 9.2% of home purchase and refinance loans made between 2000 and 2004 were made by subprime lenders. This percentage includes loans in
Maricopa County.
HOME PURCHASE AFFORDABILITY 2006 – QUEEN CREEK MARKET AREA
Median Priced Resale Unit Median Priced New Housing Unit
Income to Housing Cost Ratio 28% 33% 28% 33%
Unit Price $198,000 $198,000 $233,450 $233,450
+ Closing Costs (2%) $3,960 $3,960 $4,669 $4,669
- Down Payment (3%) $5,940 $5,940 $7,004 $7,004
Estimated Mortgage Amount $196,020 $196,020 $231,116 $231,116
Estimated Monthly Payment at 7% for 30 years, including principal, interest, taxes, insurance, PMI
$1,639 $1,639 $1,933 $1,933
Approx. Annual Income Needed to Purchase $70,243 $59,600 $82,843 $70,291
Approximate Hourly wage needed (full-time) $34 $29 $40 $34
Max other monthly debt (41% total debt ratio) $761 $397 $897 $469
Sources: ASU Polytechnic Realty Studies, Author
Pinal County Housing Needs Assessment – March 2008 Final Draft
Kuehl Enterprises LLC PO Box 642 Humboldt, AZ 86329 Page 106
Communities often wish to have housing policies and programs that positively impact the housing-related needs of residents. At the same time, many factors impact their ability to do so. Infrastructure, planning and zoning, economic opportunity, and changing demographics all impact, either positively or negatively, a community’s ability to address housing-related needs. In Queen Creek, these factors include the following: As part of Maricopa County, the Town has access to housing and community development resources that are not as readily or directly available as in Pinal County. The Town has adopted the following codes
• 2003 International Building & Associated Codes. o 2003 International Building Code o 2003 International Residential Code o 2003 International Mechanical Code o 2003 International Fire Code o 2003 International Electrical Code-Administrative
Provisions
• 2002 National Electrical Code • 1994 Uniform Plumbing Code • 2003 International Property Maintenance Code • 2003 Existing Building Code • 2003 Code Requirements for Housing Accessibility • 1982 Adobe Amendment to the Uniform Building Code (revised
July 1988) The Town collects development impact fees for wastewater, parks and recreation, fire, library, town facilities, and transportation. Development impact fees are highest for mobile homes and lowest for multi-family housing. The Town’s Neighborhood Preservation Division enforces Town codes and ordinances related to property maintenance through a proactive approach. They provide programs and opportunities for residents to participate in neighborhood and community beautification. The Town of Queen Creek adopted its current general plan in 2002. The general plan includes the following housing related goals:
• Monitoring absorption rates to ensure that land is not rezoned when ample properly-zoned land already exists. • Encouraging master-planned communities that provide a mixture of housing types. • Encouraging residential development that provides housing attainable to an expanded local and regional employment base. • Tracking net employment growth or loss, jobs-to-population and housing ratios, and average commute times.
There are no high-density zones in Queen Creek. The Town has an economic development strategic plan. This plan includes housing related goals primarily related to increasing the image of Queen Creek as an upscale move-up community.
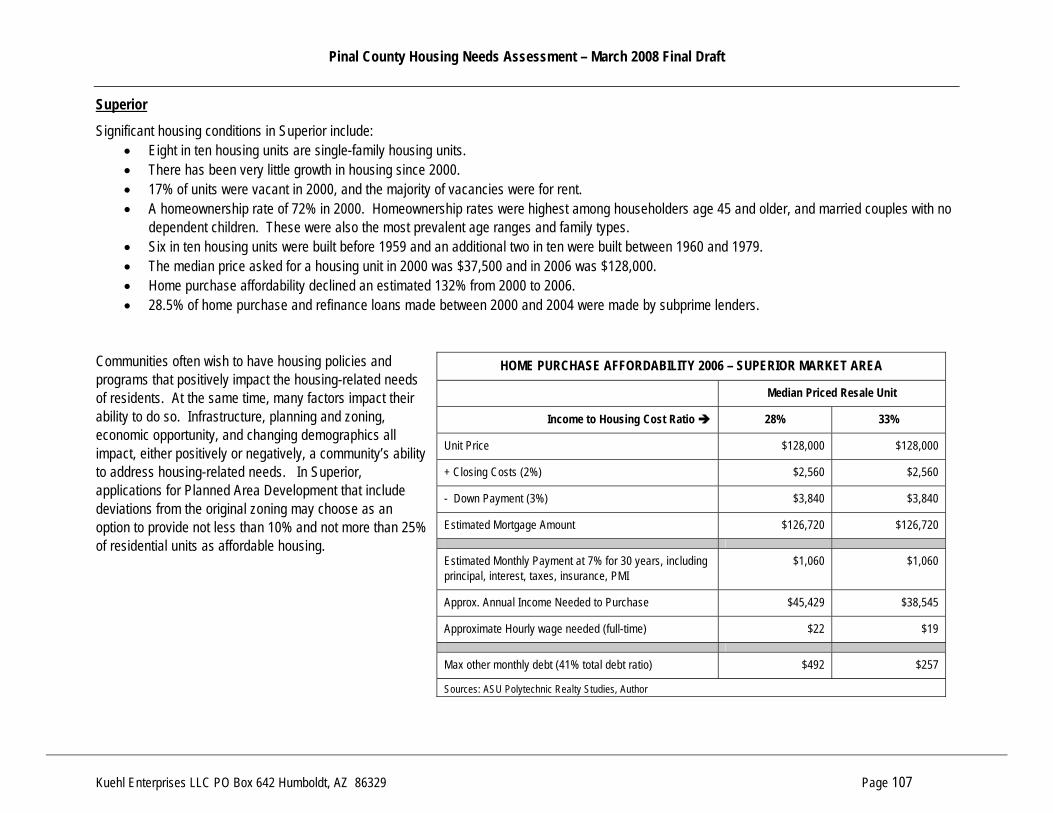
Pinal County Housing Needs Assessment – March 2008 Final Draft
Kuehl Enterprises LLC PO Box 642 Humboldt, AZ 86329 Page 107
Superior
Significant housing conditions in Superior include: • Eight in ten housing units are single-family housing units. • There has been very little growth in housing since 2000. • 17% of units were vacant in 2000, and the majority of vacancies were for rent. • A homeownership rate of 72% in 2000. Homeownership rates were highest among householders age 45 and older, and married couples with no
dependent children. These were also the most prevalent age ranges and family types. • Six in ten housing units were built before 1959 and an additional two in ten were built between 1960 and 1979. • The median price asked for a housing unit in 2000 was $37,500 and in 2006 was $128,000. • Home purchase affordability declined an estimated 132% from 2000 to 2006. • 28.5% of home purchase and refinance loans made between 2000 and 2004 were made by subprime lenders.
HOME PURCHASE AFFORDABILITY 2006 – SUPERIOR MARKET AREA
Median Priced Resale Unit
Income to Housing Cost Ratio 28% 33%
Unit Price $128,000 $128,000
+ Closing Costs (2%) $2,560 $2,560
- Down Payment (3%) $3,840 $3,840
Estimated Mortgage Amount $126,720 $126,720
Estimated Monthly Payment at 7% for 30 years, including principal, interest, taxes, insurance, PMI
$1,060 $1,060
Approx. Annual Income Needed to Purchase $45,429 $38,545
Approximate Hourly wage needed (full-time) $22 $19
Max other monthly debt (41% total debt ratio) $492 $257
Communities often wish to have housing policies and programs that positively impact the housing-related needs of residents. At the same time, many factors impact their ability to do so. Infrastructure, planning and zoning, economic opportunity, and changing demographics all impact, either positively or negatively, a community’s ability to address housing-related needs. In Superior, applications for Planned Area Development that include deviations from the original zoning may choose as an option to provide not less than 10% and not more than 25% of residential units as affordable housing.
Sources: ASU Polytechnic Realty Studies, Author

Pinal County Housing Strategy – March 2008 Final Draft
Kuehl Enterprises LLC PO Box 642 Humboldt, AZ 86329 Page 1
POLICY AND STRATEGY MENU
The following tables demonstrate policies and actions that may be undertaken by Pinal County as well as local jurisdictions and nonprofit and private organizations to positively impact conditions. These conditions focus on six primary goals:
1. Increase capacity for and coordination of affordable housing programs and projects. 2. Increase the availability of and access to a variety of funding resources. 3. Increase the dedication of land for future affordable housing production. 4. Incorporate affordable housing and housing affordability into planning and zoning processes and decisions. 5. Encourage private investment in affordable housing. 6. Develop and deliver community-based programs.
Policies and strategies are intended for implementation with equal provision for the housing needs of all segments of the community regardless of race, color, creed or economic level.
How to Use the Menu
All of the goals, objectives and actions are suited to exploration and/or implementation by Pinal County during the next ten years. The one-year, short-term (2-5 yrs) and long-term (6-10 yrs) columns apply to a suggested time frame for exploration and/or implementation by Pinal County only. Those strategies that are suitable for most jurisdictions are shaded in the “most jurisdictions” column. Local jurisdictions should consider policies and strategies only after a complete assessment of local conditions. Some local conditions are identified in this county-wide strategy; however, such conditions generally merit further exploration prior to adopting policy and implementing strategies.

Pinal County Housing Strategy – March 2008 Final Draft
Kuehl Enterprises LLC PO Box 642 Humboldt, AZ 86329 Page 2
GOAL 1: INCREASE CAPACITY FOR AND COORDINATION OF AFFORDABLE HOUSING PROGRAMS AND PROJECTS
Policy or Action
One-
year
Shor
t-ter
m
(2-
5 yrs
) Lo
ng-te
rm
(6-1
0 yrs
) Mo
st
Juris
dict
ions
Objective A: Evaluate and Establish Processes 1.A.1 Establish a process for continually tracking key housing market conditions, including variety and affordability. 1.A.2 Ensure that housing programs, policies and actions incorporate an analysis of current and projected economic, social and
political forces, the potential for displacement or loss of existing affordable units, resident input, permanency of affordability mechanisms, balance of variety and affordability, and impact on neighboring jurisdictions or county-wide efforts.
1.A.3 At least annually, update housing sales volume and median price data to ensure that current policies, programs and projects are targeted appropriately.
1.A.4 At least annually, update apartment rental information including median rent and vacancy rates by bedroom size to ensure that current policies, programs and projects are appropriately targeted.
Objective B: Create Formal and Informal Organizational Structures to Support Housing Policies and Activities 1.B.1 Expand the role and authority of the Housing Advisory Board:
o Identify and map government-owned land throughout the County and by jurisdiction; o Identify and map land zoned for manufactured, multi-family or mixed-use development; o Educate staff, appointed and elected officials regarding practices that increase the supply of affordable housing and
housing affordability; o Act as a coordinating body for all possible affordable housing projects and programs by providing information regarding
suitable sites and resources; o Serve as a review committee for proposed plans to ensure that housing variety and affordability are addressed.
1.B.2. Evaluate the creation of a County or local Housing Commission or staff function charged with quantifying local market conditions, creating key relationships, researching and suggesting policies and strategies, establishing and managing programs and resources and reviewing planned development agreements.
1.B.3. Identify a primary role for the Housing Advisory Board or successor organization. Consider regulation, advocacy, facilitation/intermediary, lender or equity investor, and developer.

Pinal County Housing Strategy – March 2008 Final Draft
Kuehl Enterprises LLC PO Box 642 Humboldt, AZ 86329 Page 3
GOAL 1: INCREASE CAPACITY FOR AND COORDINATION OF AFFORDABLE HOUSING PROGRAMS AND PROJECTS
Policy or Action
One-
year
Shor
t-ter
m
(2-
5 yrs
) Lo
ng-te
rm
(6-1
0 yrs
) Mo
st
Juris
dict
ions
1.B.4. Identify and involve other agencies and organizations, including government, nonprofit and private, essential to moving forward with affordable housing policies and strategies.
1.B.5 Empower a regional affordable housing policy and strategy decision-making body. 1.B.6 Establish a Housing Task Force comprised of local government, nonprofit and private interests to research, evaluate and recommend
appropriate policies and strategies to elected and appointed officials.
1.B.7 Evaluate the effectiveness of various organizational structures to finance, construct or manage housing for households earning less than the area median income or for other target populations as may from time-to-time be identified. At a minimum evaluate: a. An expanded role for existing housing authorities; b. A community development corporation (CDC) or similar nonprofit organization.
1.B.8 When developing and implementing programs and projects, ensure that all roles, relationships and lines of authority are clear. Designate one or more positions to ensure compliance.
Objective C: Develop Education Materials and Outreach Activities to Support Housing Policies and Actions 1.C.1 Set specific community education goals and educate the public, key staff and elected and appointed officials regarding housing
variety and affordability. Repeat selected themes often. Include: a. Factual information on specific information such as density, crime, design, traffic, and parking; b. How moderate and higher-income owners benefit from federal tax policy and private sector underwriting standards; c. The range of employment and income opportunities and how these relate to the cost of renting or owning.
1.C.2 Develop a portfolio of projects and programs. Include photos; describe appearance, design, and impact on individuals, neighbors and neighboring properties, employers, sales tax revenues, traffic reduction, and other visual/statistical data.
1.C.3 Ensure that a public input process is utilized for all key programs, projects and policies.
Objective D: Support Processes, Organizational Structure and Education Efforts through Continued Evaluation of Housing Conditions 1.D.1 Examine the financial impact of increased property taxes on existing residents, primarily those of low- and moderate-incomes. 1.D.2 Map the location of Section 8 voucher holders and identify common characteristics of selected geographic areas.
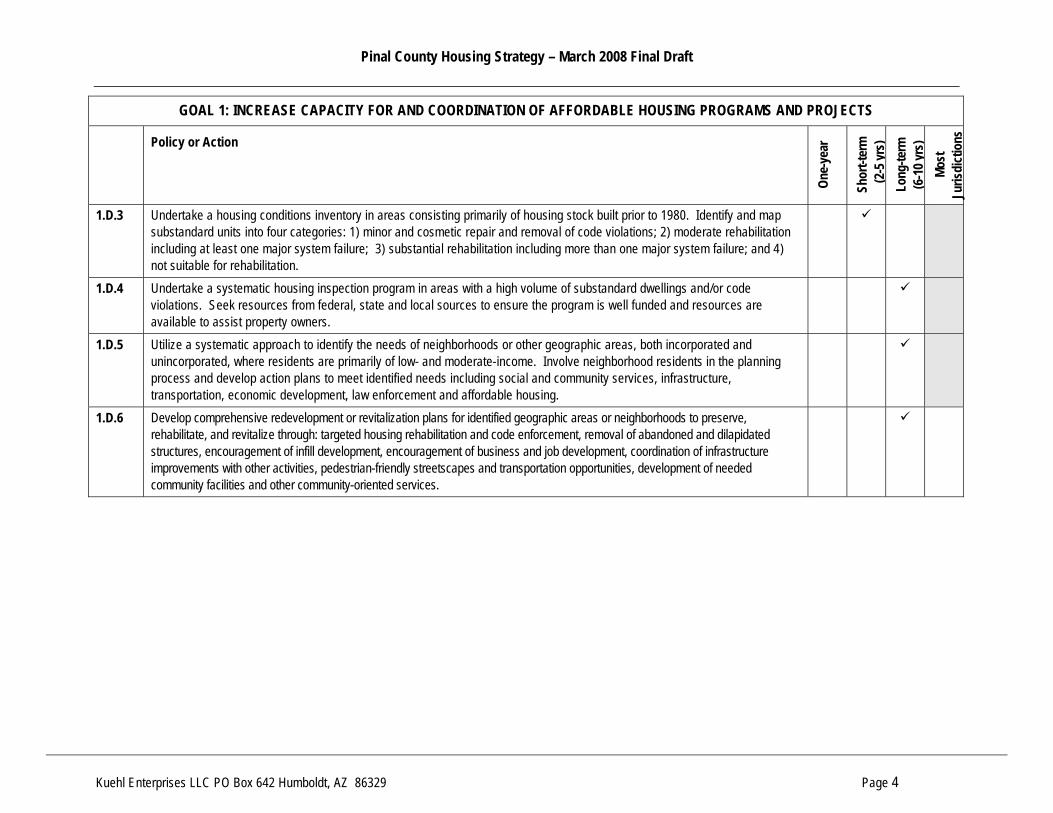
Pinal County Housing Strategy – March 2008 Final Draft
Kuehl Enterprises LLC PO Box 642 Humboldt, AZ 86329 Page 4
GOAL 1: INCREASE CAPACITY FOR AND COORDINATION OF AFFORDABLE HOUSING PROGRAMS AND PROJECTS
Policy or Action
One-
year
Shor
t-ter
m
(2-
5 yrs
) Lo
ng-te
rm
(6-1
0 yrs
) Mo
st
Juris
dict
ions
1.D.3 Undertake a housing conditions inventory in areas consisting primarily of housing stock built prior to 1980. Identify and map substandard units into four categories: 1) minor and cosmetic repair and removal of code violations; 2) moderate rehabilitation including at least one major system failure; 3) substantial rehabilitation including more than one major system failure; and 4) not suitable for rehabilitation.
1.D.4 Undertake a systematic housing inspection program in areas with a high volume of substandard dwellings and/or code violations. Seek resources from federal, state and local sources to ensure the program is well funded and resources are available to assist property owners.
1.D.5 Utilize a systematic approach to identify the needs of neighborhoods or other geographic areas, both incorporated and unincorporated, where residents are primarily of low- and moderate-income. Involve neighborhood residents in the planning process and develop action plans to meet identified needs including social and community services, infrastructure, transportation, economic development, law enforcement and affordable housing.
1.D.6 Develop comprehensive redevelopment or revitalization plans for identified geographic areas or neighborhoods to preserve, rehabilitate, and revitalize through: targeted housing rehabilitation and code enforcement, removal of abandoned and dilapidated structures, encouragement of infill development, encouragement of business and job development, coordination of infrastructure improvements with other activities, pedestrian-friendly streetscapes and transportation opportunities, development of needed community facilities and other community-oriented services.

Pinal County Housing Strategy – March 2008 Final Draft
Kuehl Enterprises LLC PO Box 642 Humboldt, AZ 86329 Page 5
GOAL 2: INCREASE THE AVAILABILITY OF AND ACCESS TO A VARIETY OF FUNDING RESOURCES
Policy or Action
One-
year
Shor
t-ter
m
(2-
5 yrs
) Lo
ng-te
rm
(6-1
0 yrs
) Mo
st
Juris
dict
ions
Objective A: Increase the Amount of Non-local Funding Sources invested in Housing 2.A.1 Support projects and programs that meet County and local goals and objectives and are applying for funding sources from
governmental and private sources.
2.A.2 Pursue federal and state funding to expand the supply of financial resources and funding available for affordable housing programs and projects, including designation and application for HUD resources as entitlement jurisdiction or urban county.
Objective B: Reduce Reliance on Non-local Funding Sources by Establishing Local Funding Sources and Mechanisms 2.B.1 Explore the creation of a Dedicated Revenue Fund or Housing Trust Fund. Examine political will to dedicate revenue, capacity
to oversee and administer, and possible sources of capitalization. Define parameters of Fund use, including interest and repayment options, types of housing, intended residents, affordable rent or purchase prices, potential for displacement or loss of existing affordable units, permanency of affordability mechanisms, balance of variety and affordability, and impact on neighboring jurisdictions or county-wide efforts.
2.B.2 Create a Dedicated Housing Fund or Housing Trust Fund. Establish an oversight body and long-term capital plan. Ensure the Fund has the ability to accept resources from multiple sources. Continually examine new sources of revenue for Dedicated Revenue and/or Housing Trust Funds. Include: a. Sale of government-owned property; b. Real estate transfer taxes; c. Developer fees; d. Private and public foundations; e. Lodging tax.
2.B.3 Explore the creation of a linkage program that would require developers to assist in the development of affordable housing if they are developing real estate that could increase the demand for affordable housing, such as hotels, offices or retail centers.
2.B.4 Explore the waiver of permit fees and paying or deferring impact fees as incentives to encourage affordable residential development or neighborhood revitalization. Ensure that specific guidelines regarding income, rent or purchase prices and occupancy requirements are developed and met.
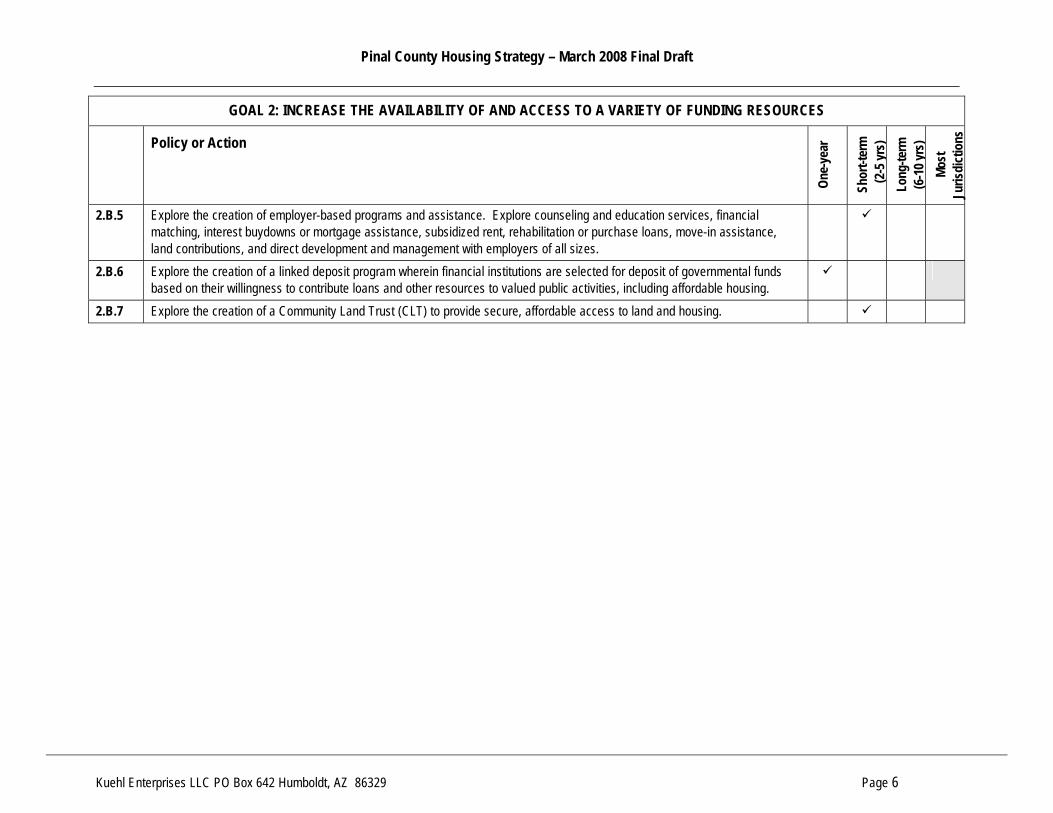
Pinal County Housing Strategy – March 2008 Final Draft
Kuehl Enterprises LLC PO Box 642 Humboldt, AZ 86329 Page 6
GOAL 2: INCREASE THE AVAILABILITY OF AND ACCESS TO A VARIETY OF FUNDING RESOURCES
Policy or Action
One-
year
Shor
t-ter
m
(2-
5 yrs
) Lo
ng-te
rm
(6-1
0 yrs
) Mo
st
Juris
dict
ions
2.B.5 Explore the creation of employer-based programs and assistance. Explore counseling and education services, financial matching, interest buydowns or mortgage assistance, subsidized rent, rehabilitation or purchase loans, move-in assistance, land contributions, and direct development and management with employers of all sizes.
2.B.6 Explore the creation of a linked deposit program wherein financial institutions are selected for deposit of governmental funds based on their willingness to contribute loans and other resources to valued public activities, including affordable housing.
2.B.7 Explore the creation of a Community Land Trust (CLT) to provide secure, affordable access to land and housing.
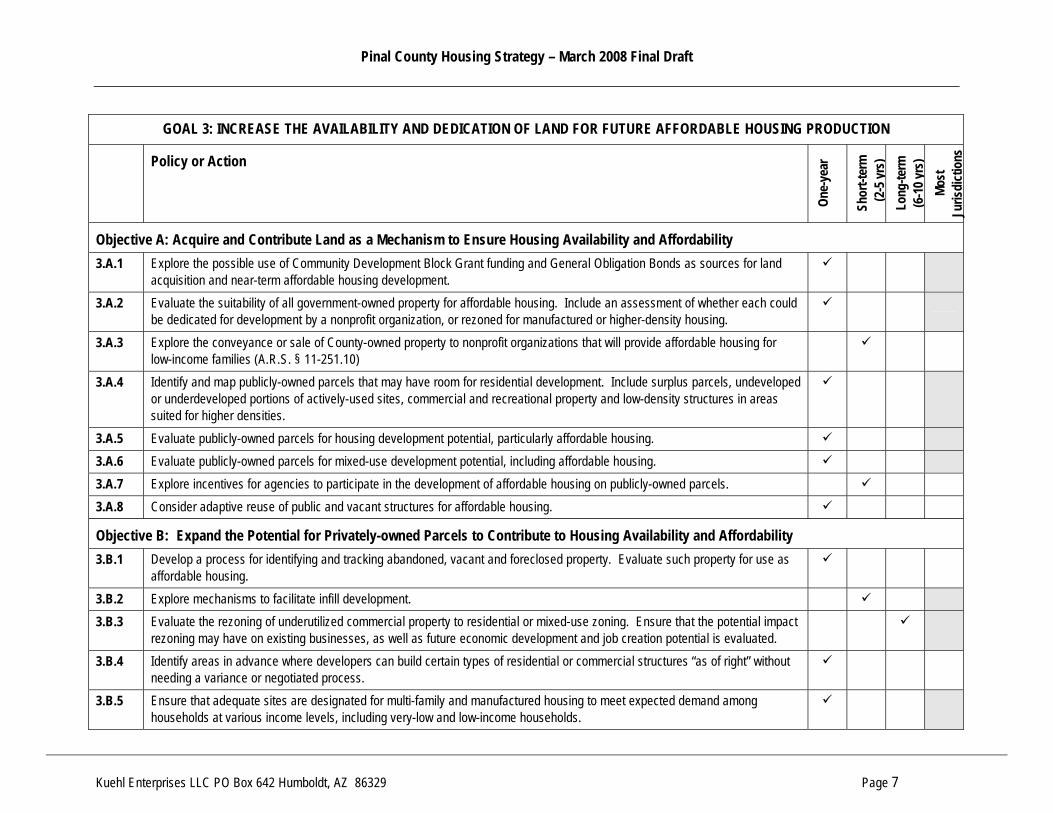
Pinal County Housing Strategy – March 2008 Final Draft
Kuehl Enterprises LLC PO Box 642 Humboldt, AZ 86329 Page 7
GOAL 3: INCREASE THE AVAILABILITY AND DEDICATION OF LAND FOR FUTURE AFFORDABLE HOUSING PRODUCTION
Policy or Action
One-
year
Shor
t-ter
m
(2-
5 yrs
) Lo
ng-te
rm
(6-1
0 yrs
) Mo
st
Juris
dict
ions
Objective A: Acquire and Contribute Land as a Mechanism to Ensure Housing Availability and Affordability 3.A.1 Explore the possible use of Community Development Block Grant funding and General Obligation Bonds as sources for land
acquisition and near-term affordable housing development.
3.A.2 Evaluate the suitability of all government-owned property for affordable housing. Include an assessment of whether each could be dedicated for development by a nonprofit organization, or rezoned for manufactured or higher-density housing.
3.A.3 Explore the conveyance or sale of County-owned property to nonprofit organizations that will provide affordable housing for low-income families (A.R.S. § 11-251.10)
3.A.4 Identify and map publicly-owned parcels that may have room for residential development. Include surplus parcels, undeveloped or underdeveloped portions of actively-used sites, commercial and recreational property and low-density structures in areas suited for higher densities.
3.A.5 Evaluate publicly-owned parcels for housing development potential, particularly affordable housing. 3.A.6 Evaluate publicly-owned parcels for mixed-use development potential, including affordable housing. 3.A.7 Explore incentives for agencies to participate in the development of affordable housing on publicly-owned parcels. 3.A.8 Consider adaptive reuse of public and vacant structures for affordable housing.
Objective B: Expand the Potential for Privately-owned Parcels to Contribute to Housing Availability and Affordability 3.B.1 Develop a process for identifying and tracking abandoned, vacant and foreclosed property. Evaluate such property for use as
affordable housing.
3.B.2 Explore mechanisms to facilitate infill development. 3.B.3 Evaluate the rezoning of underutilized commercial property to residential or mixed-use zoning. Ensure that the potential impact
rezoning may have on existing businesses, as well as future economic development and job creation potential is evaluated.
3.B.4 Identify areas in advance where developers can build certain types of residential or commercial structures “as of right” without needing a variance or negotiated process.
3.B.5 Ensure that adequate sites are designated for multi-family and manufactured housing to meet expected demand among households at various income levels, including very-low and low-income households.
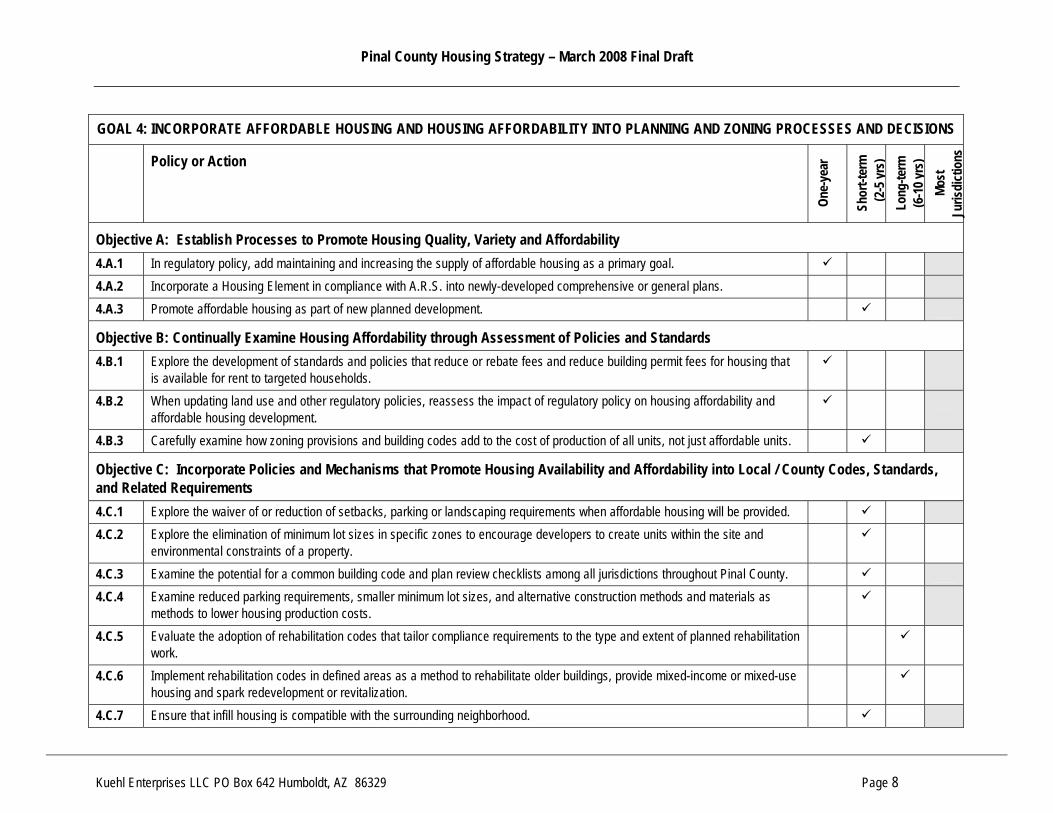
Pinal County Housing Strategy – March 2008 Final Draft
Kuehl Enterprises LLC PO Box 642 Humboldt, AZ 86329 Page 8
GOAL 4: INCORPORATE AFFORDABLE HOUSING AND HOUSING AFFORDABILITY INTO PLANNING AND ZONING PROCESSES AND DECISIONS
Policy or Action
One-
year
Shor
t-ter
m
(2-
5 yrs
) Lo
ng-te
rm
(6-1
0 yrs
) Mo
st
Juris
dict
ions
Objective A: Establish Processes to Promote Housing Quality, Variety and Affordability 4.A.1 In regulatory policy, add maintaining and increasing the supply of affordable housing as a primary goal. 4.A.2 Incorporate a Housing Element in compliance with A.R.S. into newly-developed comprehensive or general plans. 4.A.3 Promote affordable housing as part of new planned development.
Objective B: Continually Examine Housing Affordability through Assessment of Policies and Standards 4.B.1 Explore the development of standards and policies that reduce or rebate fees and reduce building permit fees for housing that
is available for rent to targeted households.
4.B.2 When updating land use and other regulatory policies, reassess the impact of regulatory policy on housing affordability and affordable housing development.
4.B.3 Carefully examine how zoning provisions and building codes add to the cost of production of all units, not just affordable units.
Objective C: Incorporate Policies and Mechanisms that Promote Housing Availability and Affordability into Local / County Codes, Standards, and Related Requirements 4.C.1 Explore the waiver of or reduction of setbacks, parking or landscaping requirements when affordable housing will be provided. 4.C.2 Explore the elimination of minimum lot sizes in specific zones to encourage developers to create units within the site and
environmental constraints of a property.
4.C.3 Examine the potential for a common building code and plan review checklists among all jurisdictions throughout Pinal County. 4.C.4 Examine reduced parking requirements, smaller minimum lot sizes, and alternative construction methods and materials as
methods to lower housing production costs.
4.C.5 Evaluate the adoption of rehabilitation codes that tailor compliance requirements to the type and extent of planned rehabilitation work.
4.C.6 Implement rehabilitation codes in defined areas as a method to rehabilitate older buildings, provide mixed-income or mixed-use housing and spark redevelopment or revitalization.
4.C.7 Ensure that infill housing is compatible with the surrounding neighborhood.
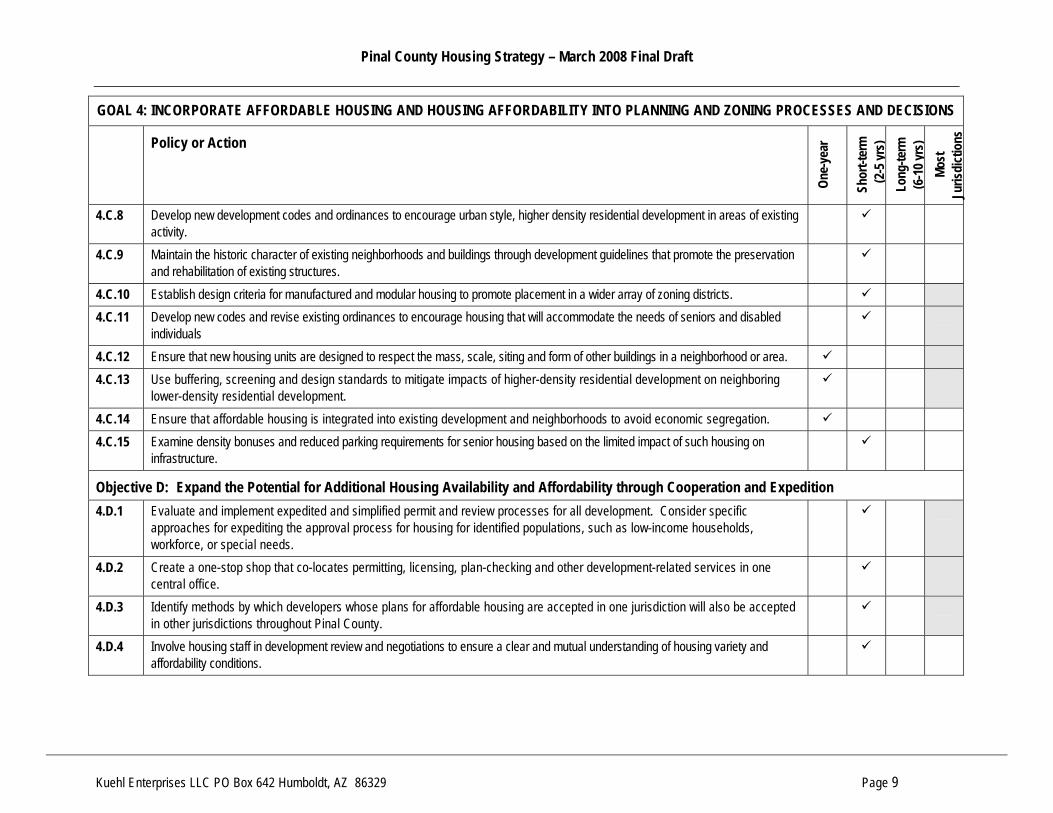
Pinal County Housing Strategy – March 2008 Final Draft
Kuehl Enterprises LLC PO Box 642 Humboldt, AZ 86329 Page 9
GOAL 4: INCORPORATE AFFORDABLE HOUSING AND HOUSING AFFORDABILITY INTO PLANNING AND ZONING PROCESSES AND DECISIONS
Policy or Action
One-
year
Shor
t-ter
m
(2-
5 yrs
) Lo
ng-te
rm
(6-1
0 yrs
) Mo
st
Juris
dict
ions
4.C.8 Develop new development codes and ordinances to encourage urban style, higher density residential development in areas of existing activity.
4.C.9 Maintain the historic character of existing neighborhoods and buildings through development guidelines that promote the preservation and rehabilitation of existing structures.
4.C.10 Establish design criteria for manufactured and modular housing to promote placement in a wider array of zoning districts. 4.C.11 Develop new codes and revise existing ordinances to encourage housing that will accommodate the needs of seniors and disabled
individuals
4.C.12 Ensure that new housing units are designed to respect the mass, scale, siting and form of other buildings in a neighborhood or area. 4.C.13 Use buffering, screening and design standards to mitigate impacts of higher-density residential development on neighboring
lower-density residential development.
4.C.14 Ensure that affordable housing is integrated into existing development and neighborhoods to avoid economic segregation. 4.C.15 Examine density bonuses and reduced parking requirements for senior housing based on the limited impact of such housing on
infrastructure.
Objective D: Expand the Potential for Additional Housing Availability and Affordability through Cooperation and Expedition 4.D.1 Evaluate and implement expedited and simplified permit and review processes for all development. Consider specific
approaches for expediting the approval process for housing for identified populations, such as low-income households, workforce, or special needs.
4.D.2 Create a one-stop shop that co-locates permitting, licensing, plan-checking and other development-related services in one central office.
4.D.3 Identify methods by which developers whose plans for affordable housing are accepted in one jurisdiction will also be accepted in other jurisdictions throughout Pinal County.
4.D.4 Involve housing staff in development review and negotiations to ensure a clear and mutual understanding of housing variety and affordability conditions.
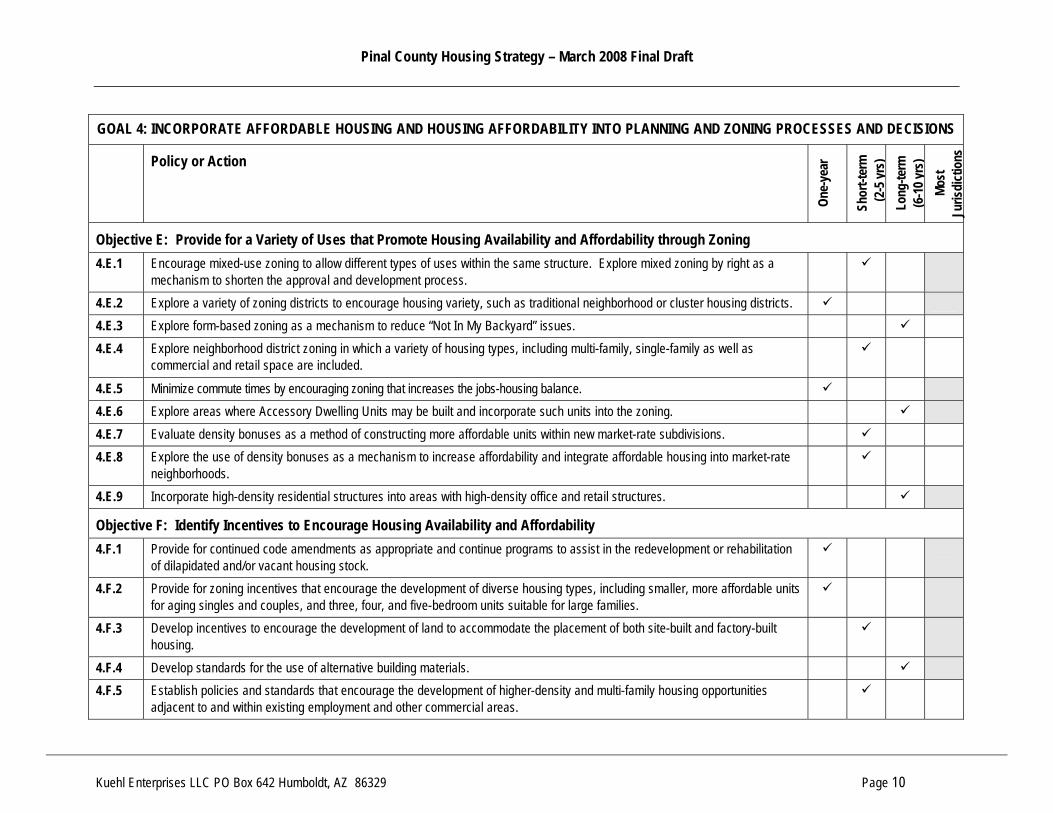
Pinal County Housing Strategy – March 2008 Final Draft
Kuehl Enterprises LLC PO Box 642 Humboldt, AZ 86329 Page 10
GOAL 4: INCORPORATE AFFORDABLE HOUSING AND HOUSING AFFORDABILITY INTO PLANNING AND ZONING PROCESSES AND DECISIONS
Policy or Action
One-
year
Shor
t-ter
m
(2-
5 yrs
) Lo
ng-te
rm
(6-1
0 yrs
) Mo
st
Juris
dict
ions
Objective E: Provide for a Variety of Uses that Promote Housing Availability and Affordability through Zoning 4.E.1 Encourage mixed-use zoning to allow different types of uses within the same structure. Explore mixed zoning by right as a
mechanism to shorten the approval and development process.
4.E.2 Explore a variety of zoning districts to encourage housing variety, such as traditional neighborhood or cluster housing districts. 4.E.3 Explore form-based zoning as a mechanism to reduce “Not In My Backyard” issues. 4.E.4 Explore neighborhood district zoning in which a variety of housing types, including multi-family, single-family as well as
commercial and retail space are included.
4.E.5 Minimize commute times by encouraging zoning that increases the jobs-housing balance. 4.E.6 Explore areas where Accessory Dwelling Units may be built and incorporate such units into the zoning. 4.E.7 Evaluate density bonuses as a method of constructing more affordable units within new market-rate subdivisions. 4.E.8 Explore the use of density bonuses as a mechanism to increase affordability and integrate affordable housing into market-rate
neighborhoods.
4.E.9 Incorporate high-density residential structures into areas with high-density office and retail structures.
Objective F: Identify Incentives to Encourage Housing Availability and Affordability 4.F.1 Provide for continued code amendments as appropriate and continue programs to assist in the redevelopment or rehabilitation
of dilapidated and/or vacant housing stock.
4.F.2 Provide for zoning incentives that encourage the development of diverse housing types, including smaller, more affordable units for aging singles and couples, and three, four, and five-bedroom units suitable for large families.
4.F.3 Develop incentives to encourage the development of land to accommodate the placement of both site-built and factory-built housing.
4.F.4 Develop standards for the use of alternative building materials. 4.F.5 Establish policies and standards that encourage the development of higher-density and multi-family housing opportunities
adjacent to and within existing employment and other commercial areas.
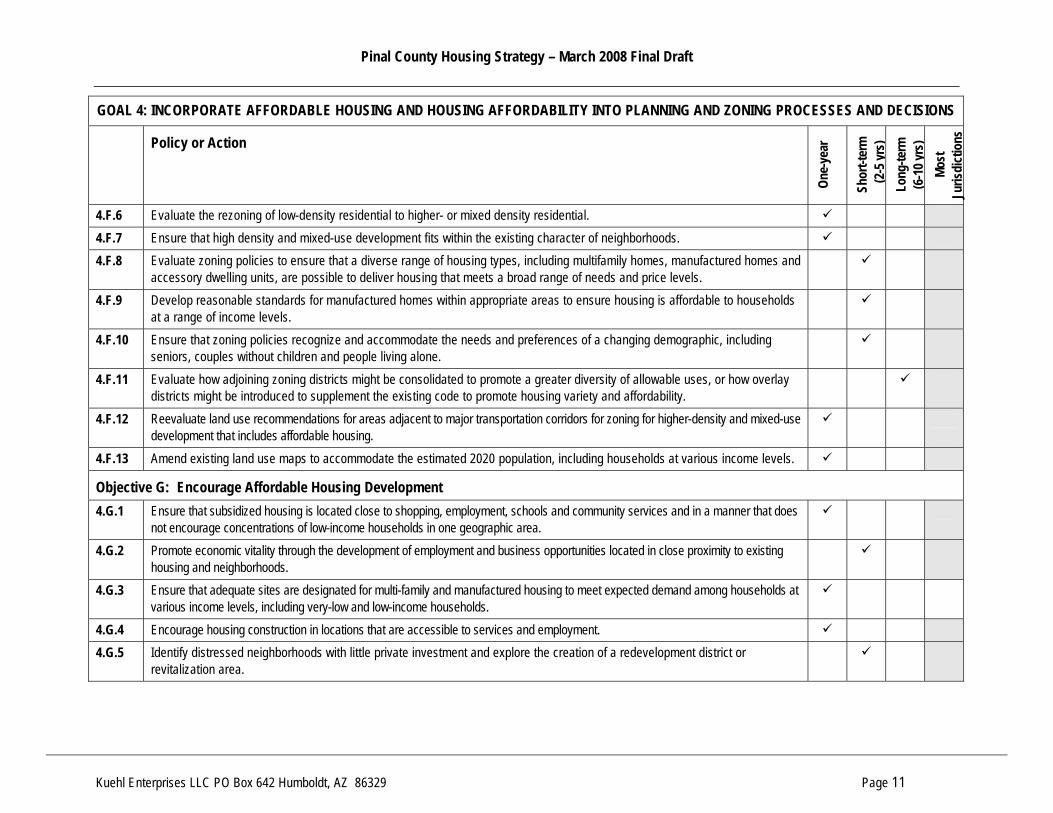
Pinal County Housing Strategy – March 2008 Final Draft
Kuehl Enterprises LLC PO Box 642 Humboldt, AZ 86329 Page 11
GOAL 4: INCORPORATE AFFORDABLE HOUSING AND HOUSING AFFORDABILITY INTO PLANNING AND ZONING PROCESSES AND DECISIONS
Policy or Action
One-
year
Shor
t-ter
m
(2-
5 yrs
) Lo
ng-te
rm
(6-1
0 yrs
) Mo
st
Juris
dict
ions
4.F.6 Evaluate the rezoning of low-density residential to higher- or mixed density residential. 4.F.7 Ensure that high density and mixed-use development fits within the existing character of neighborhoods. 4.F.8 Evaluate zoning policies to ensure that a diverse range of housing types, including multifamily homes, manufactured homes and
accessory dwelling units, are possible to deliver housing that meets a broad range of needs and price levels.
4.F.9 Develop reasonable standards for manufactured homes within appropriate areas to ensure housing is affordable to households at a range of income levels.
4.F.10 Ensure that zoning policies recognize and accommodate the needs and preferences of a changing demographic, including seniors, couples without children and people living alone.
4.F.11 Evaluate how adjoining zoning districts might be consolidated to promote a greater diversity of allowable uses, or how overlay districts might be introduced to supplement the existing code to promote housing variety and affordability.
4.F.12 Reevaluate land use recommendations for areas adjacent to major transportation corridors for zoning for higher-density and mixed-use development that includes affordable housing.
4.F.13 Amend existing land use maps to accommodate the estimated 2020 population, including households at various income levels.
Objective G: Encourage Affordable Housing Development 4.G.1 Ensure that subsidized housing is located close to shopping, employment, schools and community services and in a manner that does
not encourage concentrations of low-income households in one geographic area.
4.G.2 Promote economic vitality through the development of employment and business opportunities located in close proximity to existing housing and neighborhoods.
4.G.3 Ensure that adequate sites are designated for multi-family and manufactured housing to meet expected demand among households at various income levels, including very-low and low-income households.
4.G.4 Encourage housing construction in locations that are accessible to services and employment. 4.G.5 Identify distressed neighborhoods with little private investment and explore the creation of a redevelopment district or
revitalization area.

Pinal County Housing Strategy – March 2008 Final Draft
Kuehl Enterprises LLC PO Box 642 Humboldt, AZ 86329 Page 12
GOAL 5: ENCOURAGE PRIVATE INVESTMENT IN AFFORDABLE HOUSING
Policy or Action
One-
year
Shor
t-ter
m
(2-
5 yrs
) Lo
ng-te
rm
(6-1
0 yrs
) Mo
st
Juris
dict
ions
Objective A: Encourage Partnerships that will lead to additional Affordable Housing Development and Investment 5.A.1 Encourage neighborhood leadership in both aging and new neighborhoods.
5.A.2 Encourage partnerships among planned developments, the unit of government and nonprofit organizations to develop housing for rent or sale to households earning less than the area median income and compatible with the planned development.
5.A.3 Encourage partnerships among property owners and private or nonprofit developers to encourage investment in the development, redevelopment, rehabilitation and adaptive reuse of land and buildings for housing for households earning less than the area median income.
Objective B: Create Incentives for Private-sector Investment in Affordable Housing 5.B.1 Explore infill incentives as a method to promote the production or rehabilitation of affordable housing close to existing
infrastructure, shopping and services. Consider financial incentives, density and zoning incentives, fee waivers, and donated or reduced cost land.
5.B.2 Identify areas where upgrading infrastructure and community amenities (parks, libraries, streets) could improve neighborhood involvement in and encourage private investment in housing production and/or rehabilitation.
5.B.3 Explore a variety of methods to reduce up-front costs and minimize developer risk in affordable housing by: a. Improving government-owned land prior to sale to a developer. b. Identifying potential sites and projects and undertaking land assembly and other pre-development activities. c. Deferring fees and exactions until occupancy or sale. d. Developing neighborhood or specific-area plans that provide for a variety of overlay zoning.
5.B.4 Provide incentives that reduce the impact of fees assessed for development that sets aside at least twenty percent of units exclusively for long-term occupancy by households earning less than the area median income.
5.B.5 Explore the fiscal and organizational impacts of a tiered fee reduction program for housing development targeted to households earning less than the area median income. Ensure that the greatest fee reductions are available for housing made available to the lowest income households.

Pinal County Housing Strategy – March 2008 Final Draft
Kuehl Enterprises LLC PO Box 642 Humboldt, AZ 86329 Page 13
GOAL 5: ENCOURAGE PRIVATE INVESTMENT IN AFFORDABLE HOUSING
Policy or Action
One-
year
Shor
t-ter
m
(2-
5 yrs
) Lo
ng-te
rm
(6-1
0 yrs
) Mo
st
Juris
dict
ions
5.B.6 Provide incentives to developers such as reimbursement of fees or density increases for sale of infill housing to households earning less than the area median income.
5.B.7 Provide incentives that reduce impact of fees assessed for acquisition and/or rehabilitation of existing substandard housing units in identified neighborhoods. Offer additional incentives when rehabilitated units will be sold or leased to households earning less than the area median income.
5.B.8 Provide incentives that reduce impact of fees assessed for development that sets aside at least twenty percent of units exclusively for long-term occupancy by targeted households.
5.B.9 Support developers making application for state and federal housing resources when such applications are compatible with this strategy.
Objective C: Provide Opportunities for Private-sector Investment and Development 5.C.1 Identify areas along commercial corridors that would benefit from a mix of commercial and residential uses. Include areas with
infill opportunities, as well as rehabilitation and new planned development.
5.C.2 Examine residential uses over commercial uses as an opportunity to expand housing choice while providing additional and alternative income to property owners.
5.C.3 Explore density bonuses as a method for increasing the supply of affordable housing, with greater densities provided for units set aside for the lowest-income households.

Pinal County Housing Strategy – March 2008 Final Draft
Kuehl Enterprises LLC PO Box 642 Humboldt, AZ 86329 Page 14
GOAL 6: DEVELOP AND DELIVER COMMUNITY-BASED PROGRAMS
Policy or Action
One-
year
Shor
t-ter
m
(2-
5 yrs
) Lo
ng-te
rm
(6-1
0 yrs
) Mo
st
Juris
dict
ions
Objective A: Create Administrative Structures that Support and Encourage Housing Variety, Quality and Affordability 6.A.1 Explore the creation of a one-stop shop for developers and other organizations interested in affordable housing production,
rehabilitation or related services.
6.A.2 Explore the creation of shared administration and expertise across units of government wherein each jurisdiction expands the capacity to deliver specific types of programs or projects and through inter-governmental cooperation assists other units of government.
6.A.3 Based on the availability of resources, utilize existing organizations or create additional capacity to implement a homeownership assistance program for households earning less than the area median income.
6.A.4 Provide support to one or more nonprofit organizations to develop a mechanism to acquire and rehabilitate property, including housing intended for demolition or that is not structurally-sound, for sale or lease to households earning less than the area median income.
6.A.5 Develop a cooperative code enforcement agreement among local jurisdictions and the County. 6.A.6 Link economic development incentives with housing for employees. 6.A.7 Ensure that when needs are shared by multiple jurisdictions, regional or joint solutions are implemented to ensure greater
efficiency and reduced costs.
6.A.8 Secure all resources through legal mechanisms that provide for a return of investment in the event that property is sold or transferred or guidelines are not otherwise met. Reinvest returned resources into additional affordable housing projects and programs.
6.A.9 Prior to developing new or expanding existing programs or resources, assess organizational capacity to successfully deliver each.
6.A.10 Implement legal methods by which program and project resources may be secured to ensure affordability and preservation of affordable units. Include rights of first refusal, shared equity provisions, and deed or land use restrictions.
Objective B: Develop and Implement Programs to Serve Households in Need of Quality Affordable Housing 6.B.1 Contact organizations and agencies that currently provide financial and other resources and sponsor workshops and other
educational opportunities for homeowners, investors, and renters.
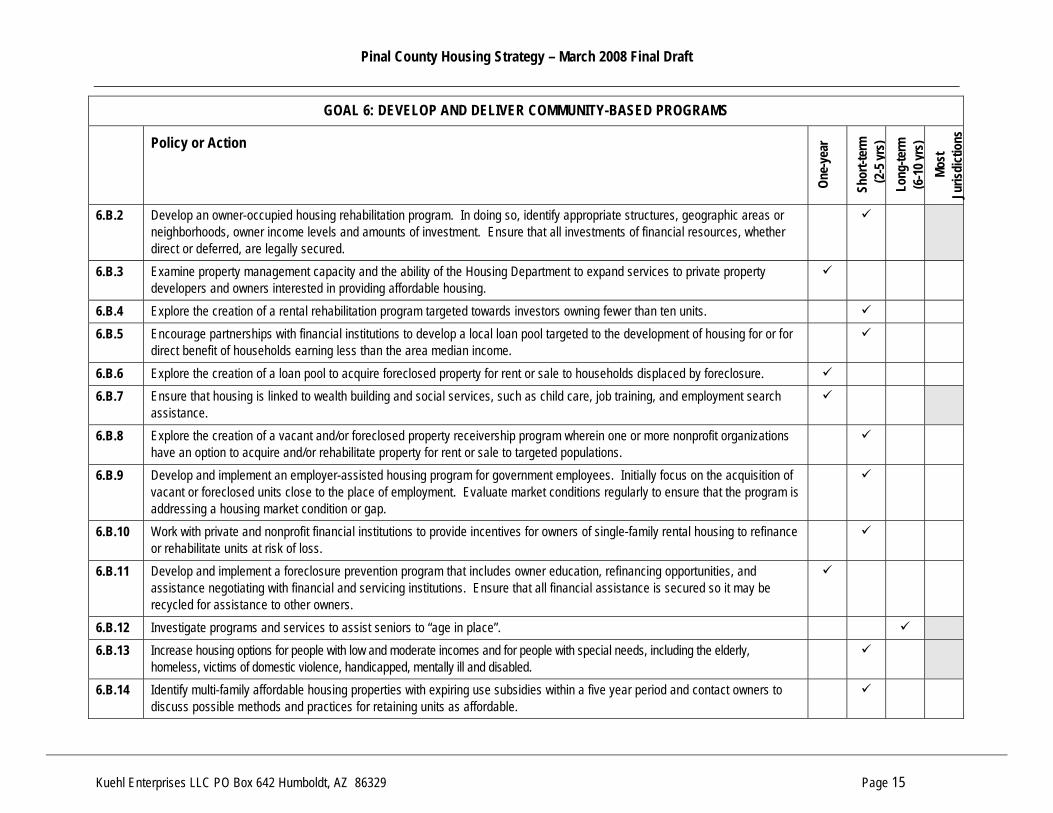
Pinal County Housing Strategy – March 2008 Final Draft
Kuehl Enterprises LLC PO Box 642 Humboldt, AZ 86329 Page 15
GOAL 6: DEVELOP AND DELIVER COMMUNITY-BASED PROGRAMS
Policy or Action
One-
year
Shor
t-ter
m
(2-
5 yrs
) Lo
ng-te
rm
(6-1
0 yrs
) Mo
st
Juris
dict
ions
6.B.2 Develop an owner-occupied housing rehabilitation program. In doing so, identify appropriate structures, geographic areas or neighborhoods, owner income levels and amounts of investment. Ensure that all investments of financial resources, whether direct or deferred, are legally secured.
6.B.3 Examine property management capacity and the ability of the Housing Department to expand services to private property developers and owners interested in providing affordable housing.
6.B.4 Explore the creation of a rental rehabilitation program targeted towards investors owning fewer than ten units. 6.B.5 Encourage partnerships with financial institutions to develop a local loan pool targeted to the development of housing for or for
direct benefit of households earning less than the area median income.
6.B.6 Explore the creation of a loan pool to acquire foreclosed property for rent or sale to households displaced by foreclosure. 6.B.7 Ensure that housing is linked to wealth building and social services, such as child care, job training, and employment search
assistance.
6.B.8 Explore the creation of a vacant and/or foreclosed property receivership program wherein one or more nonprofit organizations have an option to acquire and/or rehabilitate property for rent or sale to targeted populations.
6.B.9 Develop and implement an employer-assisted housing program for government employees. Initially focus on the acquisition of vacant or foreclosed units close to the place of employment. Evaluate market conditions regularly to ensure that the program is addressing a housing market condition or gap.
6.B.10 Work with private and nonprofit financial institutions to provide incentives for owners of single-family rental housing to refinance or rehabilitate units at risk of loss.
6.B.11 Develop and implement a foreclosure prevention program that includes owner education, refinancing opportunities, and assistance negotiating with financial and servicing institutions. Ensure that all financial assistance is secured so it may be recycled for assistance to other owners.
6.B.12 Investigate programs and services to assist seniors to “age in place”. 6.B.13 Increase housing options for people with low and moderate incomes and for people with special needs, including the elderly,
homeless, victims of domestic violence, handicapped, mentally ill and disabled.
6.B.14 Identify multi-family affordable housing properties with expiring use subsidies within a five year period and contact owners to discuss possible methods and practices for retaining units as affordable.

Pinal County Housing Strategy – March 2008 Final Draft
Kuehl Enterprises LLC PO Box 642 Humboldt, AZ 86329 Page 16
GOAL 6: DEVELOP AND DELIVER COMMUNITY-BASED PROGRAMS
Policy or Action
One-
year
Shor
t-ter
m
(2-
5 yrs
) Lo
ng-te
rm
(6-1
0 yrs
) Mo
st
Juris
dict
ions
6.B.15 Explore the creation of short-term assistance to all households that may be displaced as a result of foreclosure. 6.B.16 Support equal housing opportunities for all persons. 6.B.17 Create a process for employer input into housing programs and projects as a method to facilitate employee attraction and
retention.
6.B.18 Tie economic and social services that focus on individual wealth creation or building to affordable housing programs or projects. Consider job search and training assistance, transportation, and child care.
6.B.19 Increase workforce housing opportunities using incentives, public/private partnerships, and other sources of capital investment. 6.B.20 Ensure that policies and standards are in place to ensure that affordable housing is not lost through redevelopment,
rehabilitation or expiring use agreements and subsidies.
Objective C: Support and Sponsor Activities that Expand Household Capacity to Become Self-sufficient 6.C.1 Ensure that residents have access to financial and housing counseling to support housing decisions and investments. 6.C.2 Encourage programs that offer counseling throughout the County on the responsibility of homeownership and debt
management, and provide technical assistance to potential homeowners.
6.C.3 Encourage home-based business to participate in neighborhood watch and neighborhood organization activities. Utilize neighborhood watch to organize and facilitate clean-ups.
6.C.4 Sponsor tenant and landlord training on rights and responsibilities of each party and fair housing laws. 6.C.5 Sponsor foreclosure education seminars. 6.C.6 Promote home ownership initiatives as a means to build community support, pride, and expand housing choices for individuals. 6.C.7 Sponsor home maintenance and repair clinics and counseling to assist property owners in making their own repairs.
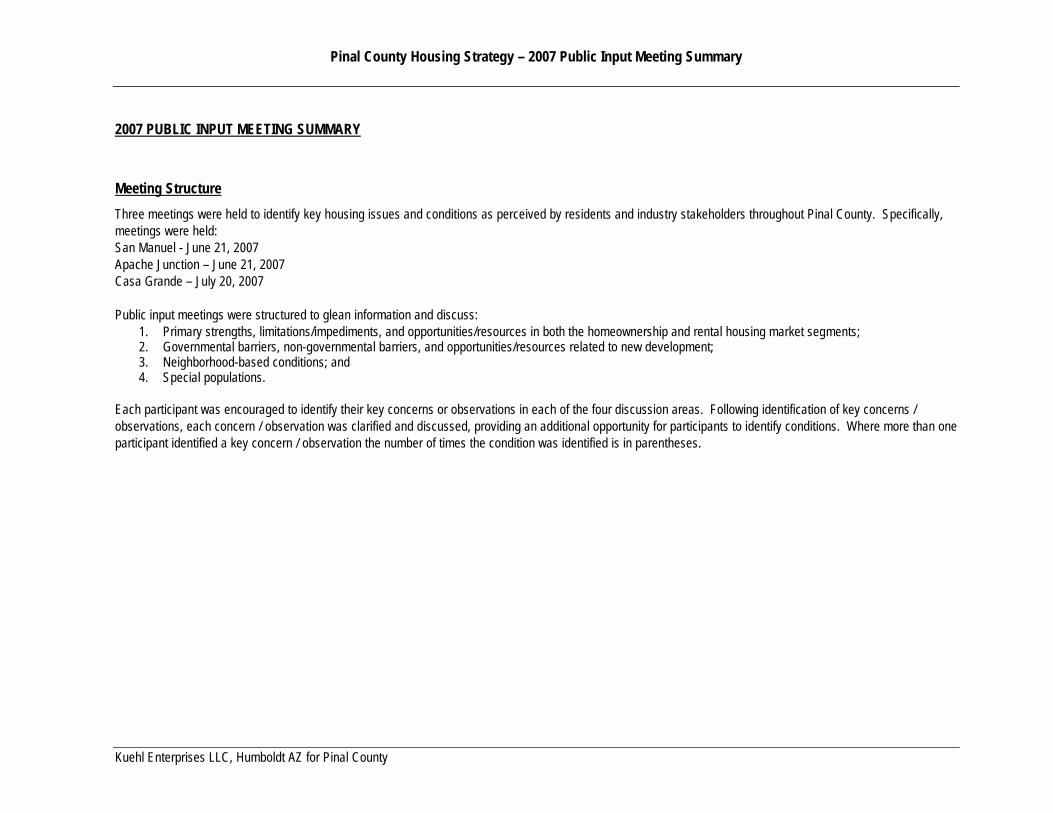
Pinal County Housing Strategy – 2007 Public Input Meeting Summary
Kuehl Enterprises LLC, Humboldt AZ for Pinal County
2007 PUBLIC INPUT MEETING SUMMARY
Meeting Structure Three meetings were held to identify key housing issues and conditions as perceived by residents and industry stakeholders throughout Pinal County. Specifically, meetings were held: San Manuel - June 21, 2007 Apache Junction – June 21, 2007 Casa Grande – July 20, 2007 Public input meetings were structured to glean information and discuss:
1. Primary strengths, limitations/impediments, and opportunities/resources in both the homeownership and rental housing market segments; 2. Governmental barriers, non-governmental barriers, and opportunities/resources related to new development; 3. Neighborhood-based conditions; and 4. Special populations.
Each participant was encouraged to identify their key concerns or observations in each of the four discussion areas. Following identification of key concerns / observations, each concern / observation was clarified and discussed, providing an additional opportunity for participants to identify conditions. Where more than one participant identified a key concern / observation the number of times the condition was identified is in parentheses.
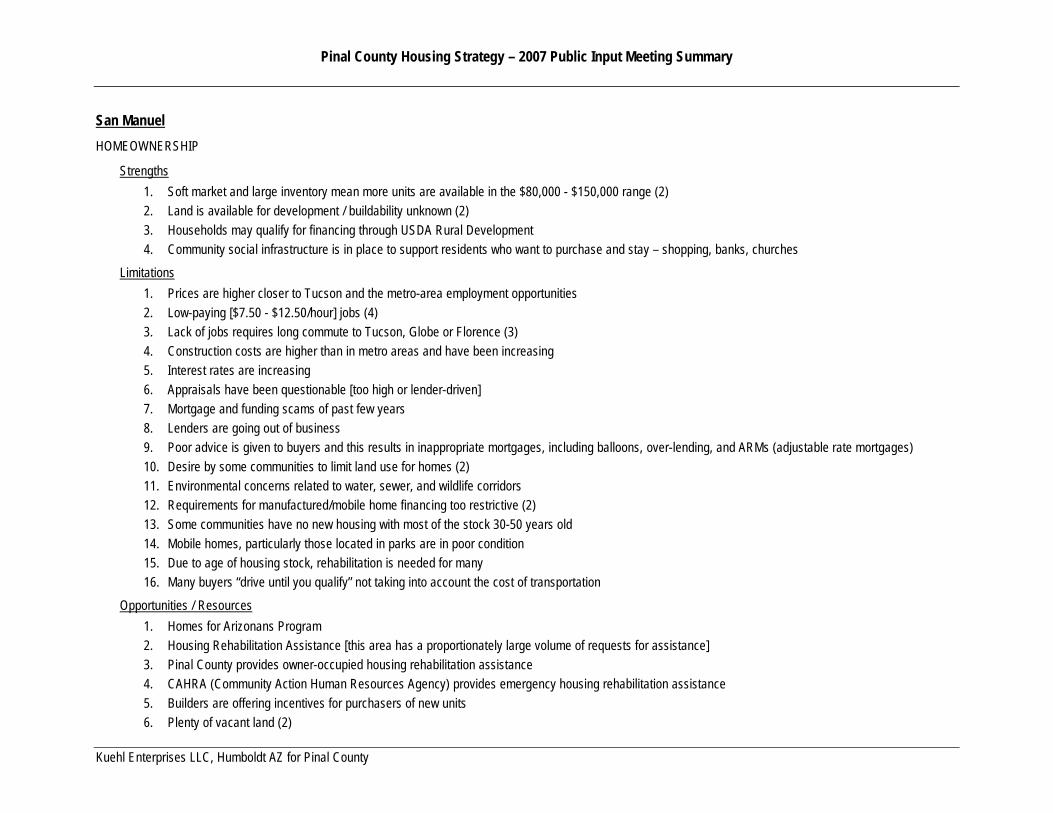
Pinal County Housing Strategy – 2007 Public Input Meeting Summary
Kuehl Enterprises LLC, Humboldt AZ for Pinal County
San Manuel HOMEOWNERSHIP
Strengths 1. Soft market and large inventory mean more units are available in the $80,000 - $150,000 range (2) 2. Land is available for development / buildability unknown (2) 3. Households may qualify for financing through USDA Rural Development 4. Community social infrastructure is in place to support residents who want to purchase and stay – shopping, banks, churches
Limitations 1. Prices are higher closer to Tucson and the metro-area employment opportunities 2. Low-paying [$7.50 - $12.50/hour] jobs (4) 3. Lack of jobs requires long commute to Tucson, Globe or Florence (3) 4. Construction costs are higher than in metro areas and have been increasing 5. Interest rates are increasing 6. Appraisals have been questionable [too high or lender-driven] 7. Mortgage and funding scams of past few years 8. Lenders are going out of business 9. Poor advice is given to buyers and this results in inappropriate mortgages, including balloons, over-lending, and ARMs (adjustable rate mortgages) 10. Desire by some communities to limit land use for homes (2) 11. Environmental concerns related to water, sewer, and wildlife corridors 12. Requirements for manufactured/mobile home financing too restrictive (2) 13. Some communities have no new housing with most of the stock 30-50 years old 14. Mobile homes, particularly those located in parks are in poor condition 15. Due to age of housing stock, rehabilitation is needed for many 16. Many buyers “drive until you qualify” not taking into account the cost of transportation
Opportunities / Resources 1. Homes for Arizonans Program 2. Housing Rehabilitation Assistance [this area has a proportionately large volume of requests for assistance] 3. Pinal County provides owner-occupied housing rehabilitation assistance 4. CAHRA (Community Action Human Resources Agency) provides emergency housing rehabilitation assistance 5. Builders are offering incentives for purchasers of new units 6. Plenty of vacant land (2)
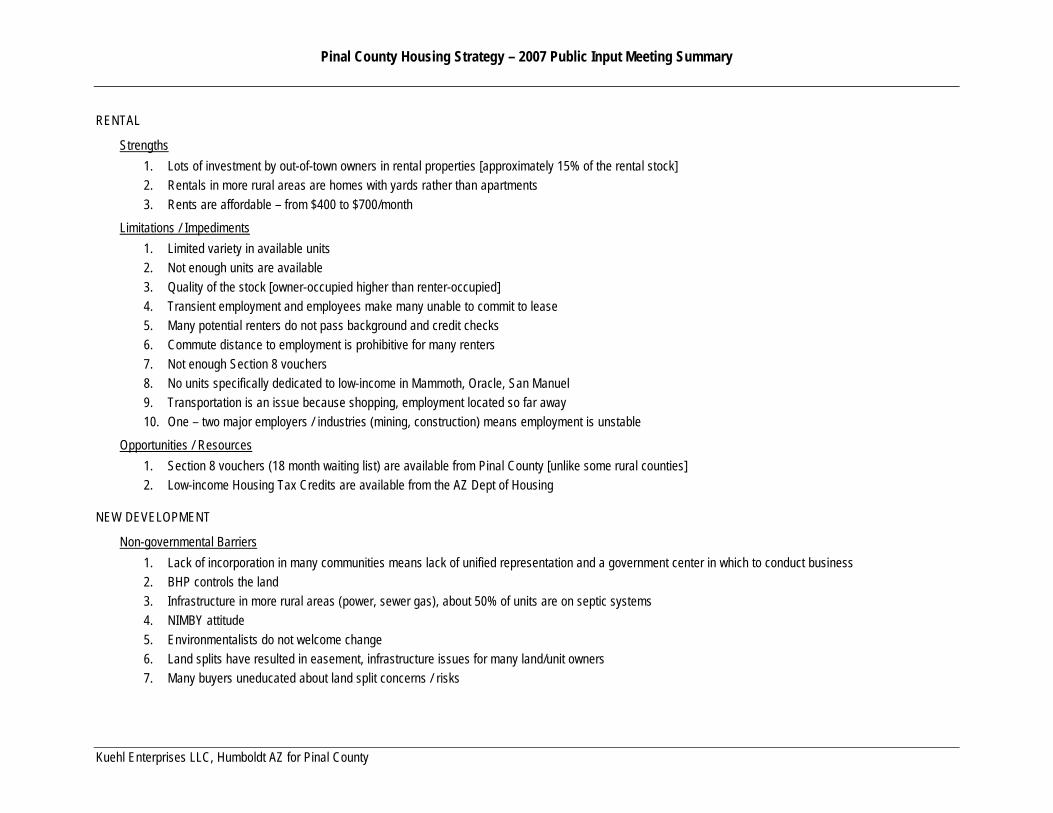
Pinal County Housing Strategy – 2007 Public Input Meeting Summary
Kuehl Enterprises LLC, Humboldt AZ for Pinal County
RENTAL
Strengths 1. Lots of investment by out-of-town owners in rental properties [approximately 15% of the rental stock] 2. Rentals in more rural areas are homes with yards rather than apartments 3. Rents are affordable – from $400 to $700/month
Limitations / Impediments 1. Limited variety in available units 2. Not enough units are available 3. Quality of the stock [owner-occupied higher than renter-occupied] 4. Transient employment and employees make many unable to commit to lease 5. Many potential renters do not pass background and credit checks 6. Commute distance to employment is prohibitive for many renters 7. Not enough Section 8 vouchers 8. No units specifically dedicated to low-income in Mammoth, Oracle, San Manuel 9. Transportation is an issue because shopping, employment located so far away 10. One – two major employers / industries (mining, construction) means employment is unstable
Opportunities / Resources 1. Section 8 vouchers (18 month waiting list) are available from Pinal County [unlike some rural counties] 2. Low-income Housing Tax Credits are available from the AZ Dept of Housing
NEW DEVELOPMENT
Non-governmental Barriers 1. Lack of incorporation in many communities means lack of unified representation and a government center in which to conduct business 2. BHP controls the land 3. Infrastructure in more rural areas (power, sewer gas), about 50% of units are on septic systems 4. NIMBY attitude 5. Environmentalists do not welcome change 6. Land splits have resulted in easement, infrastructure issues for many land/unit owners 7. Many buyers uneducated about land split concerns / risks
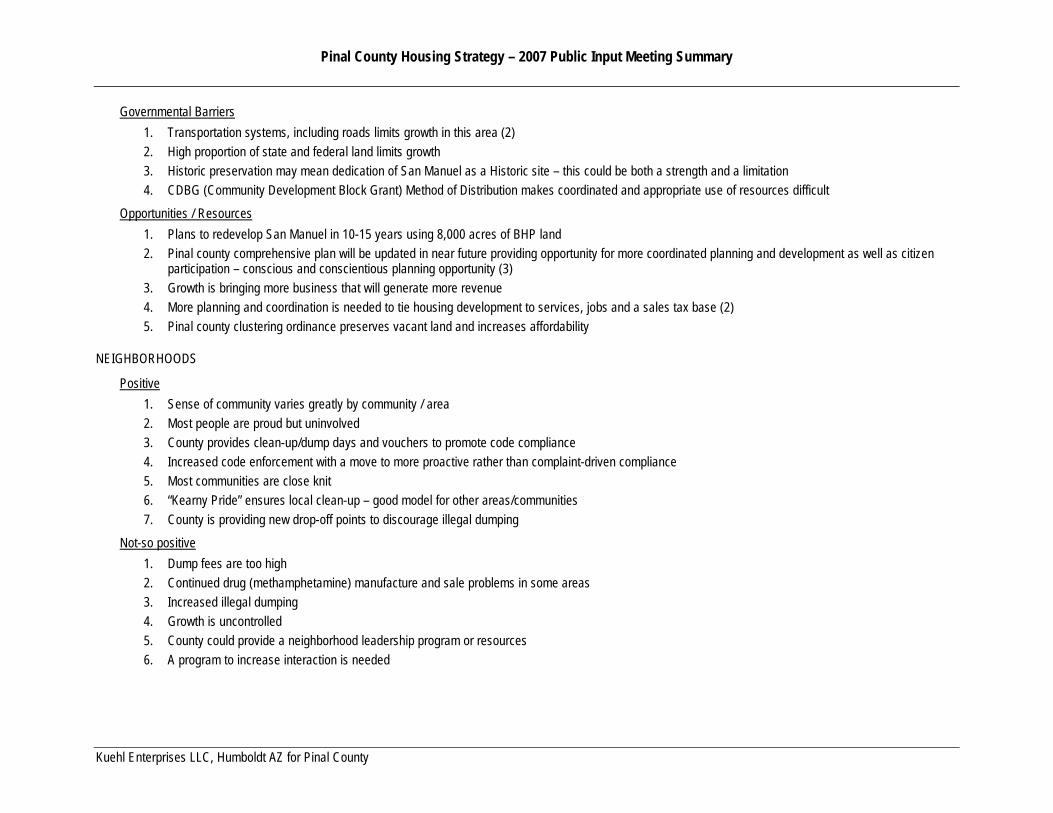
Pinal County Housing Strategy – 2007 Public Input Meeting Summary
Kuehl Enterprises LLC, Humboldt AZ for Pinal County
Governmental Barriers 1. Transportation systems, including roads limits growth in this area (2) 2. High proportion of state and federal land limits growth 3. Historic preservation may mean dedication of San Manuel as a Historic site – this could be both a strength and a limitation 4. CDBG (Community Development Block Grant) Method of Distribution makes coordinated and appropriate use of resources difficult
Opportunities / Resources 1. Plans to redevelop San Manuel in 10-15 years using 8,000 acres of BHP land 2. Pinal county comprehensive plan will be updated in near future providing opportunity for more coordinated planning and development as well as citizen
participation – conscious and conscientious planning opportunity (3) 3. Growth is bringing more business that will generate more revenue 4. More planning and coordination is needed to tie housing development to services, jobs and a sales tax base (2) 5. Pinal county clustering ordinance preserves vacant land and increases affordability
NEIGHBORHOODS
Positive 1. Sense of community varies greatly by community / area 2. Most people are proud but uninvolved 3. County provides clean-up/dump days and vouchers to promote code compliance 4. Increased code enforcement with a move to more proactive rather than complaint-driven compliance 5. Most communities are close knit 6. “Kearny Pride” ensures local clean-up – good model for other areas/communities 7. County is providing new drop-off points to discourage illegal dumping
Not-so positive 1. Dump fees are too high 2. Continued drug (methamphetamine) manufacture and sale problems in some areas 3. Increased illegal dumping 4. Growth is uncontrolled 5. County could provide a neighborhood leadership program or resources 6. A program to increase interaction is needed
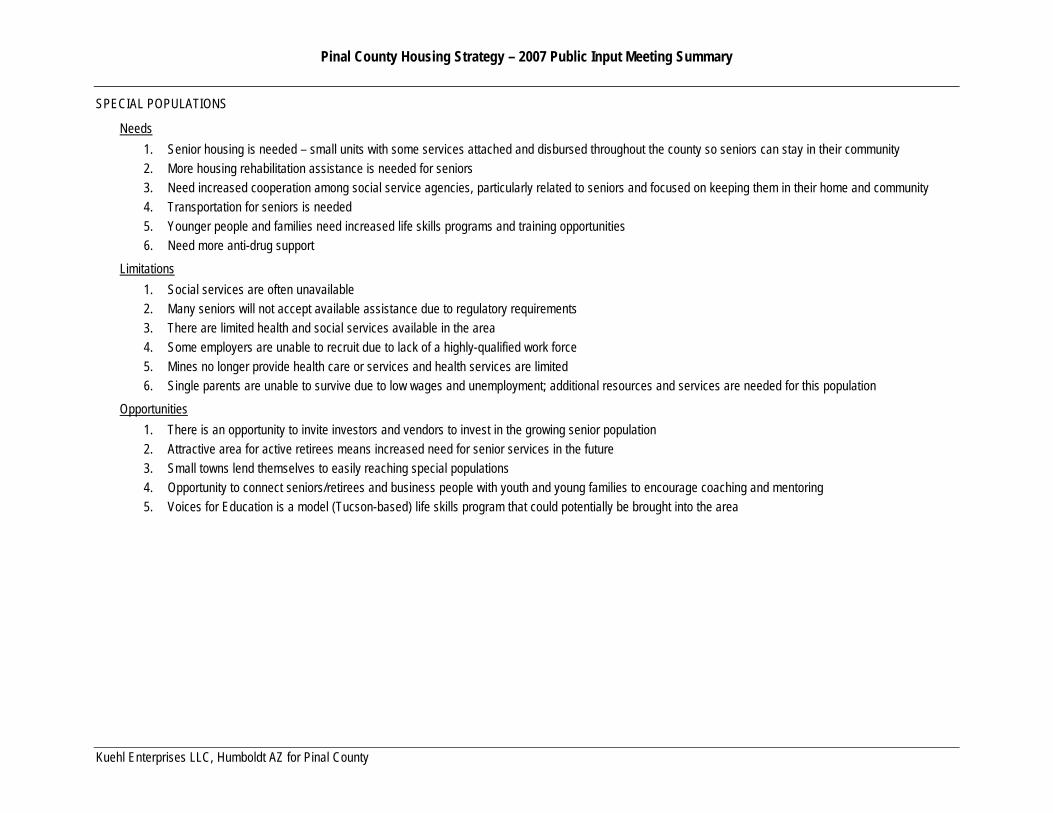
Pinal County Housing Strategy – 2007 Public Input Meeting Summary
Kuehl Enterprises LLC, Humboldt AZ for Pinal County
SPECIAL POPULATIONS
Needs 1. Senior housing is needed – small units with some services attached and disbursed throughout the county so seniors can stay in their community 2. More housing rehabilitation assistance is needed for seniors 3. Need increased cooperation among social service agencies, particularly related to seniors and focused on keeping them in their home and community 4. Transportation for seniors is needed 5. Younger people and families need increased life skills programs and training opportunities 6. Need more anti-drug support
Limitations 1. Social services are often unavailable 2. Many seniors will not accept available assistance due to regulatory requirements 3. There are limited health and social services available in the area 4. Some employers are unable to recruit due to lack of a highly-qualified work force 5. Mines no longer provide health care or services and health services are limited 6. Single parents are unable to survive due to low wages and unemployment; additional resources and services are needed for this population
Opportunities 1. There is an opportunity to invite investors and vendors to invest in the growing senior population 2. Attractive area for active retirees means increased need for senior services in the future 3. Small towns lend themselves to easily reaching special populations 4. Opportunity to connect seniors/retirees and business people with youth and young families to encourage coaching and mentoring 5. Voices for Education is a model (Tucson-based) life skills program that could potentially be brought into the area
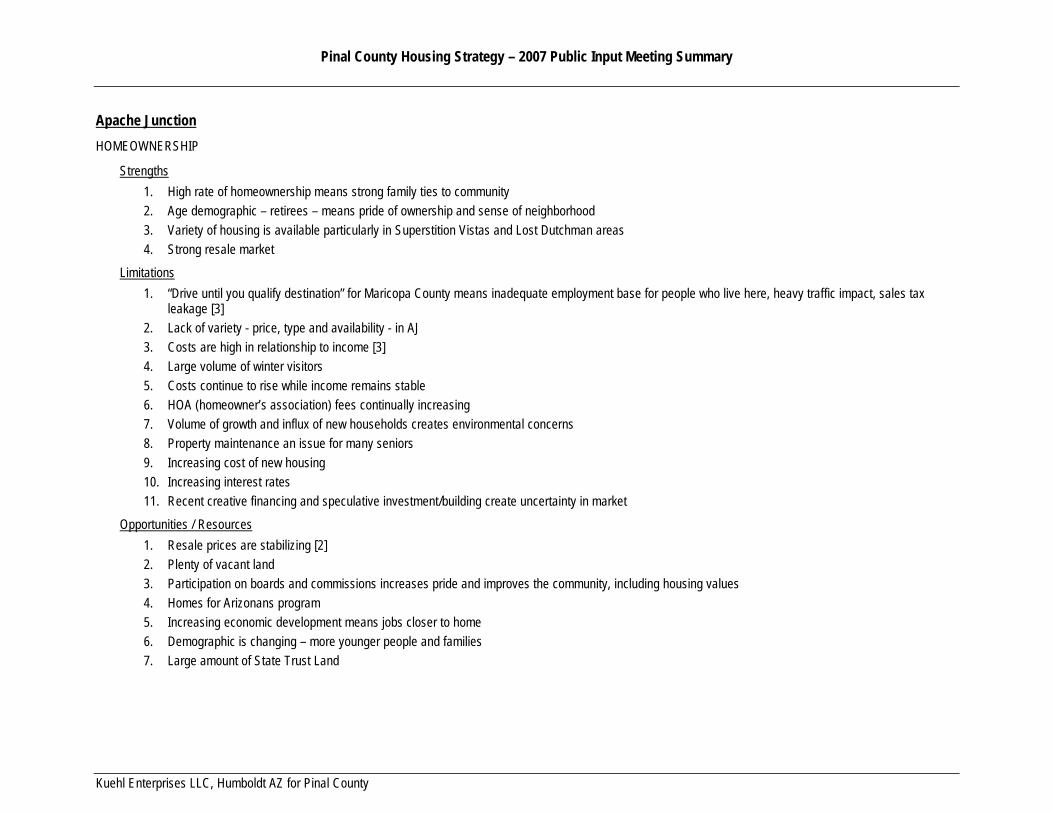
Pinal County Housing Strategy – 2007 Public Input Meeting Summary
Kuehl Enterprises LLC, Humboldt AZ for Pinal County
Apache Junction HOMEOWNERSHIP
Strengths 1. High rate of homeownership means strong family ties to community 2. Age demographic – retirees – means pride of ownership and sense of neighborhood 3. Variety of housing is available particularly in Superstition Vistas and Lost Dutchman areas 4. Strong resale market
Limitations 1. “Drive until you qualify destination” for Maricopa County means inadequate employment base for people who live here, heavy traffic impact, sales tax
leakage [3] 2. Lack of variety - price, type and availability - in AJ 3. Costs are high in relationship to income [3] 4. Large volume of winter visitors 5. Costs continue to rise while income remains stable 6. HOA (homeowner’s association) fees continually increasing 7. Volume of growth and influx of new households creates environmental concerns 8. Property maintenance an issue for many seniors 9. Increasing cost of new housing 10. Increasing interest rates 11. Recent creative financing and speculative investment/building create uncertainty in market
Opportunities / Resources 1. Resale prices are stabilizing [2] 2. Plenty of vacant land 3. Participation on boards and commissions increases pride and improves the community, including housing values 4. Homes for Arizonans program 5. Increasing economic development means jobs closer to home 6. Demographic is changing – more younger people and families 7. Large amount of State Trust Land
Pinal County Housing Strategy – 2007 Public Input Meeting Summary
Kuehl Enterprises LLC, Humboldt AZ for Pinal County
RENTAL
Strengths 1. Individuals on fixed incomes can rely on someone else for big-ticket repairs 2. New housing is available for rent 3. Good time for investment in rental property 4. County works to keep seniors in their homes so not so much needed 5. High demand for affordable, accessible, subsidized units
Limitations / Impediments 1. Long waiting list for Section 8 housing 2. Small supply of affordable and accessible units [2 3. Not enough subsidized units [2 4. More affordable units are located in undesirable areas 5. Renters do not have same incentive to maintain their units as do homeowners 6. Limited choices and variety [2 7. Many rental units are substandard [2 8. Focus of the market is on seasonal/snowbirds; not enough units that will take children and/or pets [3 9. Too many absentee landlords 10. Government resources have too many requirements for the seasonal nature of the market 11. Abundance of mobile homes – residents own the structure (depreciating) while landlords own the land (appreciating)
Opportunities / Resources 1. Downtown area of AJ zoned for condos and multiple uses 2. Rental assistance is available through Pinal County 3. Low income Housing Tax Credits are available through the AZ Dept of Housing
NEW DEVELOPMENT
Non-governmental Barriers 1. Land splits have resulted in easement, infrastructure issues for many land/unit owners 2. Under-qualified workforce + age of residents makes business attraction difficult (2) 3. Lack of good jobs near housing [7] 4. Lack of universal design, visitability and rehabilitation/modification ready units 5. Large volume of mobile homes means community (AJ) has a stigma 6. Land costs are high 7. Land is available but not ready to build

Pinal County Housing Strategy – 2007 Public Input Meeting Summary
Kuehl Enterprises LLC, Humboldt AZ for Pinal County
8. Investment portfolio concerns 9. Lack of 4-year college 10. Lack of medical, health, and hospital services
Governmental Barriers 1. Water resource requirements don’t demonstrate real numbers – how much water is there and how much will be available 20 years from now 2. Too many restrictions on improvements that can be made to your own home – cost and process is also prohibitive 3. Property taxes are high compared to California 4. Increased property assessment and taxes a challenge for those on fixed incomes 5. Government resources have too many requirements for the seasonal nature of the market 6. State Land Department disposition requirements/process impedes coordination and sound investment [2 7. Inadequate transportation, including roads, corridors, and transit [8] 8. Good connectively and easy access from Mesa, Florence, etc. 9. Appropriate zoning for light industry is limited 10. Not enough law enforcement presence in Queen Valley; long response times 11. County islands impact residents (law enforcement, code enforcement) and surrounding incorporated communities 12. Development impact fees are high
Opportunities / Resources 1. More business incentives to encourage economic development (2) 2. Increased business retention and education services to aide seasonal and marginal businesses and create year-round employment (2) 3. Development impact fees are low in relation to other areas (2) 4. Permitting process is relatively streamlined and simple in comparison to other counties 5. As comprehensive and general plans are updated there is an opportunity for well-planned growth, particularly to keep the rural feel while addressing the
tax base 6. State Trust Lands are under a single, comprehensive plan and this makes Pinal county one of the most desirable areas for investment and real estate
ventures in the country 7. Programs to enhance the community image 8. Balance of zoning to encourage a mix of retail, commercial and industrial development 9. Seek revision of State Land Department requirements so developers will engage with communities in well-planned ventures 10. Committees are being formed and working together around key issues 11. Demographic data is now available through CAAG 12. Professionalism of the Pinal County Housing Authority 13. Horse owners have a strong voice in the consultation process

Pinal County Housing Strategy – 2007 Public Input Meeting Summary
Kuehl Enterprises LLC, Humboldt AZ for Pinal County
NEIGHBORHOODS
Positive 1. Quite a bit of unity in most areas 2. Nice mix of neighborhood types from urban through rural 3. CDC is pulling together the downtown residents of AJ 4. Time to embrace the image and promote greater diversity 5. County considering “neighborhood zoning” v “subdivision zoning” 6. Many areas have dark skies (2)
Not-so positive
1. Water, sewer, roads and other infrastructure are not always available in some areas (2) 2. No sense of neighborhoods – people live in subdivisions and are therefore subdivided 3. High crime in the more affordable areas of AJ 4. Concentration of substandard housing
SPECIAL POPULATIONS
Needs 1. Adequate services, particularly health services 2. Neighborhood retail 3. Transportation/transit 4. More information and easier access to information regarding programs 5. Increased coordination and education among agencies and jurisdictions 6. Safe housing for single parents and students 7. More affordable, accessible units
Pinal County Housing Strategy – 2007 Public Input Meeting Summary
Kuehl Enterprises LLC, Humboldt AZ for Pinal County
Casa Grande HOMEOWNERSHIP
Strengths
1. A lot of available units in Casa Grande (2
2. Wide variety of housing types and price ranges in Casa Grande (2
3. A expanding number of locations where homes can be purchased in Casa Grande.
4. Casa Grande is affordable relative to the region.
5. In Coolidge, a couple of builders are pursing relatively affordable housing (under $119,000)
6. Price point is a major factor in the Pinal County housing market.
7. Condos are being built.
8. Coolidge has a variety of housing and lots available for infill.
9. A variety of housing prices ($110,000 - $200,000) in Coolidge.
10. Builders have dropped their price points and value engineered homes to reduce prices. (2
11. Some builders with reductions and incentives have lowered prices 40% in past year; increasing affordability for new buyers.
12. Prices are lower than two years ago.
13. Plenty of available land throughout the County.
14. Elected officials at municipal and County levels are mostly open to discussion on increasing affordable housing opportunities.
15. Housing prices are holding up better in Casa Grande than elsewhere in the County.
Limitations
1. New housing is all the same and most is not affordable to local residents.
2. Lower income and poor credit households are not able to purchase a home.
3. Negative equity situations will result in increased foreclosure (first investors, then top of market purchasers, then commuters) (3
4. Buyers who are “upside down” don’t seek help fast enough and end up in foreclosure.
5. Predatory lending continues (2
6. Lots of households are financially overextended.
7. Road construction is poorly planned and will negatively impact residents of Maricopa.
Pinal County Housing Strategy – 2007 Public Input Meeting Summary
Kuehl Enterprises LLC, Humboldt AZ for Pinal County
8. The railroad does not move quickly to make changes needed for community.
9. Lack of jobs near new housing and neighborhoods results in massive commuting problems. Drive until you qualify (3
10. Buyers with “creative” financing such as interest only, ARMs, 80/20s and balloons are not protected from market changes. Another segment of the market at risk of foreclosure.
11. There are no organizations to assist potential homebuyers or to help when they get delinquent with mortgage payments (2
12. Many communities are too large for USDA RD funding and too small for HUD funding (2
13. Homeownership opportunities throughout the County are not varied. Majority of units are single family. Condos, townhouses, patio homes, etc. are needed.
14. Raw land prices range from $30,000 to $50,000/acre and up. Combined with infrastructure costs, this leads to developed lots that are priced from $30,000 up. Hard to get affordable housing with those prices unless the lots are very small or the density is very high; both are politically unpopular.
15. Existing home prices are extremely high compared to new construction.
16. Wages are not high enough to afford current prices of both new construction and existing units.
17. Market prices are inflated.
18. Newer housing developments are not close to shopping and other services.
19. No public transportation, although whether it would be used is questionable.
20. Higher density housing that has been built is not attractive or affordable and doesn’t fit well with the community.
21. Casa Grande and neighboring jurisdictions have a large surplus of single family homes, declining housing markets, and existing homeowners competing with developers through incentives and price cuts.
Opportunities / Resources
1. Cluster housing to create more affordable units for locals.
2. More local employment opportunities.
3. Self-help housing in Casa Grande and through CAHRA (in Eloy, Coolidge and Arizona City)
4. Community and housing character maintained.
5. Section 8 homeownership programs through Public Housing Authorities.
6. Some areas still eligible for USDA RD funding.
7. Inventory of USDA RD units.
8. Some rental assistance and mortgage foreclosure assistance is available.
9. Many cities and the County operate owner-occupied housing rehabilitation programs.
10. ADOH Homes for Arizonans program.
Pinal County Housing Strategy – 2007 Public Input Meeting Summary
Kuehl Enterprises LLC, Humboldt AZ for Pinal County
11. CAHRA is a HUD-approved housing counseling agency.
12. Investors seeking long-term investment can accumulate inventory.
RENTAL
Strengths
1. Can rent a new single family home for around $750 in Casa Grande.
2. Many rentals are more affordable than in urban areas.
3. Most renters want single family units and these are available.
Limitations / Impediments
1. Vacancy rates are increasing in older and low income units, especially 2 bedroom units and those in Casa Grande and Maricopa. These units can’t compete with new units.
2. In Coolidge rental rates are high at around $1,000/month even for dilapidated units.
3. Older stock of apartments with no luxury apartments in Casa Grande.
4. Limited supply and types of rental housing in Casa Grande.
5. Rental prices are too high across the County and in relation to income.
6. Rental properties are aging and in need of repair/rehab; owners cannot afford the repair/rehab.
7. Older apartment units have not been maintained.
8. Older rental units in good Casa Grande neighborhoods at risk of being boarded up due to competition from new housing.
9. Wait for Section 8 voucher is 12-18 months. Pinal County housing has 662 vouchers and about 800 on waiting list. Public housing wait is 3 to 6 months.
Opportunities / Resources
1. Section 8 rental assistance is available through Pinal county.
2. Section 8 units are better maintained.
3. CAHRA has some resources for move-in and rental assistance.
4. Those who can afford to purchase could now rent the same unit for less than they can purchase it. This is an opportunity to save for future purchase.
NEW DEVELOPMENT
Non-governmental Barriers
1. Excess inventory driving market values down and putting a ceiling on resale values.
2. Developers and the railroad are not keeping to their agreements. There is no recourse if they don’t follow through.

Pinal County Housing Strategy – 2007 Public Input Meeting Summary
Kuehl Enterprises LLC, Humboldt AZ for Pinal County
3. Land prices have increased 200% in two years for infill lots in Casa Grande.
4. Lack of contractors for smaller projects.
Governmental Barriers
1. No County landfills result in increased litter in rural areas.
2. Water retention basin maintenance costs are passed onto homeowners and this impacts affordability.
3. Municipalities create minimum standards that create minimum standards communities.
4. Infrastructure hasn’t kept pace with residential development, especially roads (3
5. Municipalities have been reacting to growth with limited capacity to be proactive.
6. Questionable road improvements, engineering and inspections.
7. Many lots in County were grandfathered and will not bear impact fees, which will change sales patterns in the future.
8. Small water retention basins are called open space (note that Casa Grande no longer allows this in Parks plan).
9. Zoning follows same model that encourages bedroom community setting.
10. Cultural values and ideas about what constitutes community and acceptability differ greatly between new residents and those that have been in communities for a long time.
11. Poor customer service among contractors.
12. School districts are having a hard time keeping up with growth and in some cases must pay impact fees on new development.
13. State School Facilities Board is a barrier.
14. Limited development potential due to traffic congestion in commute to metro Phoenix.
15. Lack of sidewalks.
16. Impact fees are complicated and do not generate enough revenue to support infrastructure needs.
17. In Maricopa, too many building permits were issued without prior planning.
18. Utility blackouts in Maricopa and fluctuating water pressure in Coolidge.
Opportunities / Resources
1. Good variety of densities and reasonable design standards in Casa Grande.
2. Developers are being more creative in developing “community”.
3. Incorporate more walking paths into new development.
4. Subdivisions will begin selling lots instead of units with lots. Opportunity for small builders to do infill.
5. More suppliers due to growth.

Pinal County Housing Strategy – 2007 Public Input Meeting Summary
Kuehl Enterprises LLC, Humboldt AZ for Pinal County
6. Growth has funded expanded services through impact fees.
7. Grandfather developers will have a financial advantage for new home construction. This is where the next “boom” will take place.
NEIGHBORHOODS
Positive
1. Some are very strong and a resource to residents.
2. Home repair programs can help improve housing in concentrated areas for low income homeowners.
3. Schools (especially elementary) provide a neighborhood identity.
4. Schools have kept pace with development in Casa Grande.
Not-so positive
1. Older neighborhoods need technical assistance to take ownership and responsibility of neighborhood issues. Planning and implementation of neighborhood projects (physical and social) through block watches, etc. are needed.
2. Value differences between new residents and existing residents often come out in neighborhood settings and on community changes such as street renaming.
3. Older neighborhoods in Casa Grande do not have a school identity.
4. Lack of unified school district in Casa Grande – legislative roadblocks hamper the effort.
SPECIAL POPULATIONS
Needs
1. Walking paths and connectivity to services.
2. Subsidized senior housing (3).
3. SMI, substance abusers and Iraq war vets.
4. Homeless shelter for singles and families
Opportunities
1. AZ Training Center is mostly vacant and provide a real opportunity for reuse as a special needs residential facility.
2. What is the demand for 55+ housing?
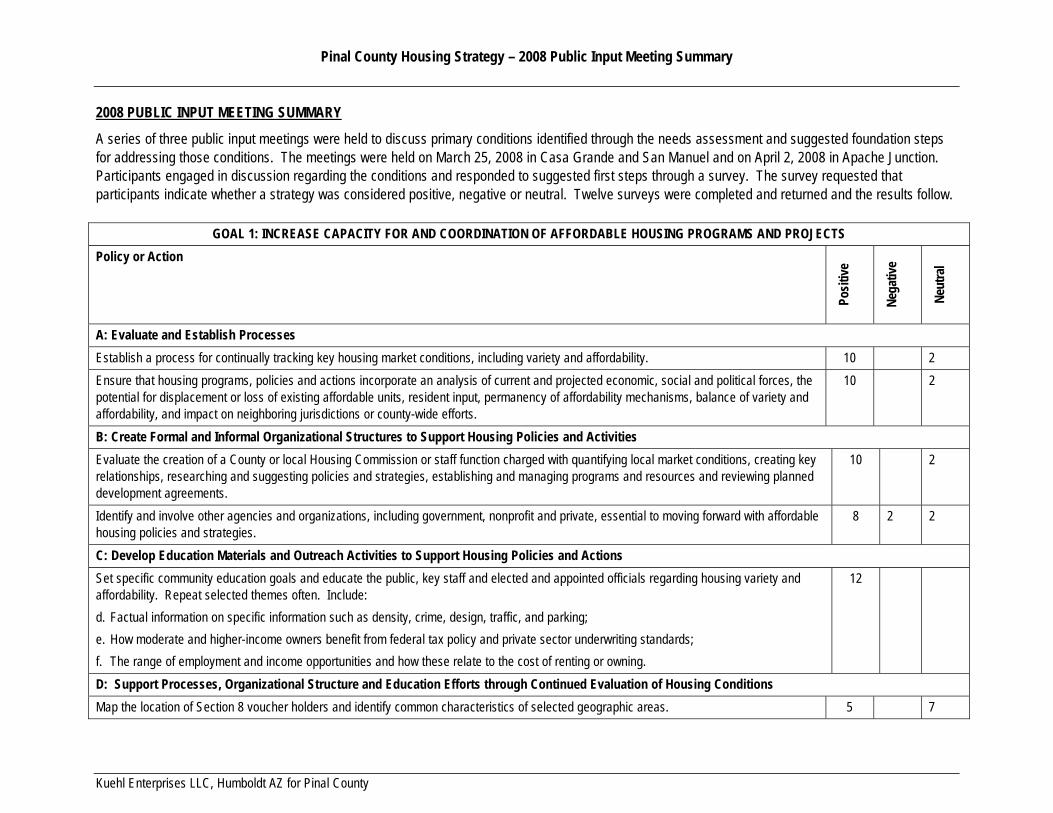
Pinal County Housing Strategy – 2008 Public Input Meeting Summary
Kuehl Enterprises LLC, Humboldt AZ for Pinal County
2008 PUBLIC INPUT MEETING SUMMARY
A series of three public input meetings were held to discuss primary conditions identified through the needs assessment and suggested foundation steps for addressing those conditions. The meetings were held on March 25, 2008 in Casa Grande and San Manuel and on April 2, 2008 in Apache Junction. Participants engaged in discussion regarding the conditions and responded to suggested first steps through a survey. The survey requested that participants indicate whether a strategy was considered positive, negative or neutral. Twelve surveys were completed and returned and the results follow.
GOAL 1: INCREASE CAPACITY FOR AND COORDINATION OF AFFORDABLE HOUSING PROGRAMS AND PROJECTS Policy or Action
Posit
ive
Nega
tive
Neut
ral
A: Evaluate and Establish Processes Establish a process for continually tracking key housing market conditions, including variety and affordability. 10 2 Ensure that housing programs, policies and actions incorporate an analysis of current and projected economic, social and political forces, the potential for displacement or loss of existing affordable units, resident input, permanency of affordability mechanisms, balance of variety and affordability, and impact on neighboring jurisdictions or county-wide efforts.
10 2
B: Create Formal and Informal Organizational Structures to Support Housing Policies and Activities Evaluate the creation of a County or local Housing Commission or staff function charged with quantifying local market conditions, creating key relationships, researching and suggesting policies and strategies, establishing and managing programs and resources and reviewing planned development agreements.
10 2
Identify and involve other agencies and organizations, including government, nonprofit and private, essential to moving forward with affordable housing policies and strategies.
8 2 2
C: Develop Education Materials and Outreach Activities to Support Housing Policies and Actions Set specific community education goals and educate the public, key staff and elected and appointed officials regarding housing variety and affordability. Repeat selected themes often. Include: d. Factual information on specific information such as density, crime, design, traffic, and parking; e. How moderate and higher-income owners benefit from federal tax policy and private sector underwriting standards; f. The range of employment and income opportunities and how these relate to the cost of renting or owning.
12
D: Support Processes, Organizational Structure and Education Efforts through Continued Evaluation of Housing Conditions Map the location of Section 8 voucher holders and identify common characteristics of selected geographic areas. 5 7

Pinal County Housing Strategy – 2008 Public Input Meeting Summary
Kuehl Enterprises LLC, Humboldt AZ for Pinal County
GOAL 2: INCREASE THE AVAILABILITY OF AND ACCESS TO A VARIETY OF FUNDING RESOURCES
Policy or Action
Posit
ive
Nega
tive
Neut
ral
A: Increase the Amount of Non-local Funding Sources invested in Housing Support projects and programs that meet County and local goals and objectives and are applying for funding sources from governmental and private sources.
10 2
B: Reduce Reliance on Non-local Funding Sources by Establishing Local Funding Sources and Mechanisms Explore the creation of a linked deposit program wherein financial institutions are selected for deposit of governmental funds based on their willingness to contribute loans and other resources to valued public activities, including affordable housing.
7 2 3
GOAL 3: INCREASE THE AVAILABILITY AND DEDICATION OF LAND FOR FUTURE AFFORDABLE HOUSING PRODUCTION
Policy or Action
Posit
ive
Nega
tive
Neut
ral
A: Acquire and Contribute Land as a Mechanism to Ensure Housing Availability and Affordability Explore the possible use of Community Development Block Grant funding and General Obligation Bonds as sources for land acquisition and near-term affordable housing development.
6 3 3
Evaluate the suitability of all government-owned property for affordable housing. Include an assessment of whether each could be dedicated for development by a nonprofit organization, or rezoned for manufactured or higher-density housing.
8 2 2
Identify and map publicly-owned parcels that may have room for residential development. Include surplus parcels, undeveloped or underdeveloped portions of actively-used sites, commercial and recreational property and low-density structures in areas suited for higher densities.
8 1 3
B: Expand the Potential for Privately-owned Parcels to Contribute to Housing Availability and Affordability Develop a process for identifying and tracking abandoned, vacant and foreclosed property. Evaluate such property for use as affordable housing.
12
Identify areas in advance where developers can build certain types of residential or commercial structures “as of right” without needing a variance or negotiated process.
6 1 5

Pinal County Housing Strategy – 2008 Public Input Meeting Summary
Kuehl Enterprises LLC, Humboldt AZ for Pinal County
GOAL 3: INCREASE THE AVAILABILITY AND DEDICATION OF LAND FOR FUTURE AFFORDABLE HOUSING PRODUCTION
Policy or Action
Posit
ive
Nega
tive
Neut
ral
Ensure that adequate sites are designated for multi-family and manufactured housing to meet expected demand among households at various income levels, including very-low and low-income households.
10 2
GOAL 4: INCORPORATE AFFORDABLE HOUSING AND HOUSING AFFORDABILITY INTO PLANNING AND ZONING PROCESSES AND DECISIONS
Policy or Action
Posit
ive
Nega
tive
Neut
ral
A: Establish Processes to Promote Housing Quality, Variety and Affordability In regulatory policy, add maintaining and increasing the supply of affordable housing as a primary goal. 9 3
B: Continually Examine Housing Affordability through Assessment of Policies and Standards Explore the development of standards and policies that reduce or rebate fees and reduce building permit fees for housing that is available for rent to targeted households.
6 3 3
C: Incorporate Policies and Mechanisms that Promote Housing Availability and Affordability into Local / County Codes, Standards, and Related Requirements Ensure that new housing units are designed to respect the mass, scale, siting and form of other buildings in a neighborhood or area. 9 3 Use buffering, screening and design standards to mitigate impacts of higher-density residential development on neighboring lower-density residential development.
9 3
Ensure that affordable housing is integrated into existing development and neighborhoods to avoid economic segregation. 10 1 1
E: Provide for a Variety of Uses that Promote Housing Availability and Affordability through Zoning Explore a variety of zoning districts to encourage housing variety, such as traditional neighborhood or cluster housing districts. 9 3 Minimize commute times by encouraging zoning that increases the jobs-housing balance. 12
F: Identify Incentives to Encourage Housing Availability and Affordability Provide for continued code amendments as appropriate and continue programs to assist in the redevelopment or rehabilitation of dilapidated 9 3
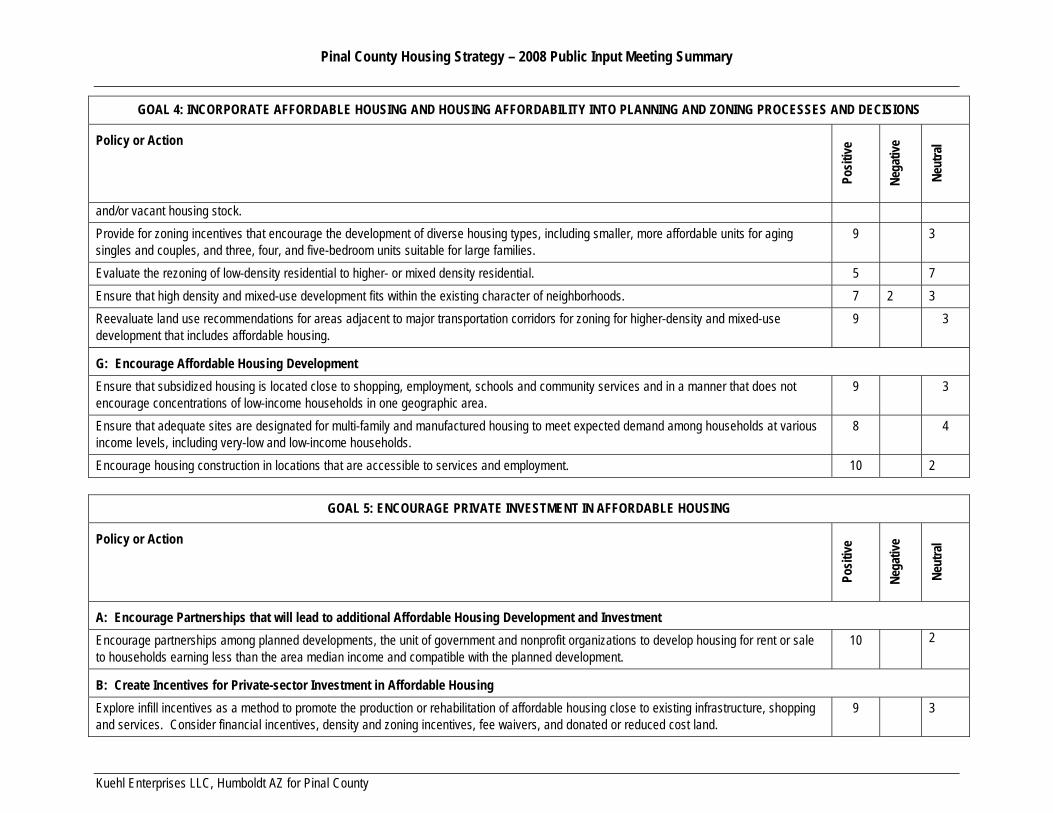
Pinal County Housing Strategy – 2008 Public Input Meeting Summary
Kuehl Enterprises LLC, Humboldt AZ for Pinal County
GOAL 4: INCORPORATE AFFORDABLE HOUSING AND HOUSING AFFORDABILITY INTO PLANNING AND ZONING PROCESSES AND DECISIONS
Policy or Action
Posit
ive
Nega
tive
Neut
ral
and/or vacant housing stock. Provide for zoning incentives that encourage the development of diverse housing types, including smaller, more affordable units for aging singles and couples, and three, four, and five-bedroom units suitable for large families.
9 3
Evaluate the rezoning of low-density residential to higher- or mixed density residential. 5 7 Ensure that high density and mixed-use development fits within the existing character of neighborhoods. 7 2 3 Reevaluate land use recommendations for areas adjacent to major transportation corridors for zoning for higher-density and mixed-use development that includes affordable housing.
9 3
G: Encourage Affordable Housing Development Ensure that subsidized housing is located close to shopping, employment, schools and community services and in a manner that does not encourage concentrations of low-income households in one geographic area.
9 3
Ensure that adequate sites are designated for multi-family and manufactured housing to meet expected demand among households at various income levels, including very-low and low-income households.
8 4
Encourage housing construction in locations that are accessible to services and employment. 10 2
GOAL 5: ENCOURAGE PRIVATE INVESTMENT IN AFFORDABLE HOUSING
Policy or Action
Posit
ive
Nega
tive
Neut
ral
A: Encourage Partnerships that will lead to additional Affordable Housing Development and Investment Encourage partnerships among planned developments, the unit of government and nonprofit organizations to develop housing for rent or sale to households earning less than the area median income and compatible with the planned development.
10 2
B: Create Incentives for Private-sector Investment in Affordable Housing Explore infill incentives as a method to promote the production or rehabilitation of affordable housing close to existing infrastructure, shopping and services. Consider financial incentives, density and zoning incentives, fee waivers, and donated or reduced cost land.
9 3
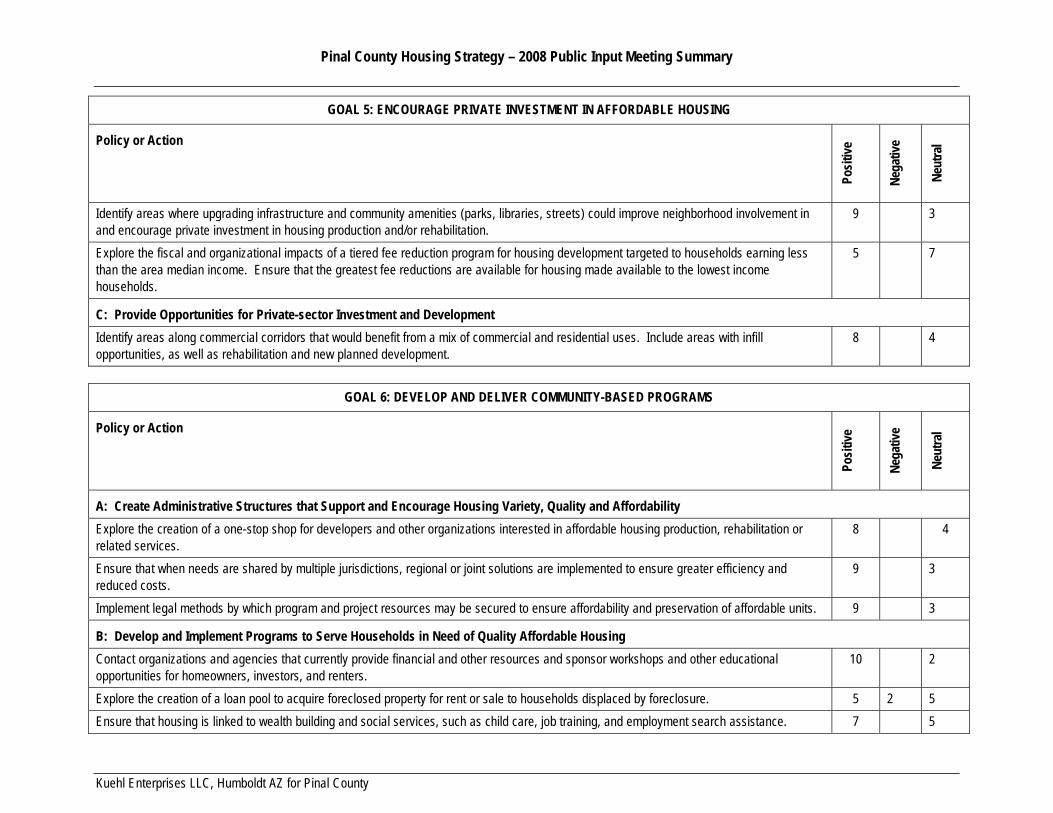
Pinal County Housing Strategy – 2008 Public Input Meeting Summary
Kuehl Enterprises LLC, Humboldt AZ for Pinal County
GOAL 5: ENCOURAGE PRIVATE INVESTMENT IN AFFORDABLE HOUSING
Policy or Action
Posit
ive
Nega
tive
Neut
ral
Identify areas where upgrading infrastructure and community amenities (parks, libraries, streets) could improve neighborhood involvement in and encourage private investment in housing production and/or rehabilitation.
9 3
Explore the fiscal and organizational impacts of a tiered fee reduction program for housing development targeted to households earning less than the area median income. Ensure that the greatest fee reductions are available for housing made available to the lowest income households.
5 7
C: Provide Opportunities for Private-sector Investment and Development Identify areas along commercial corridors that would benefit from a mix of commercial and residential uses. Include areas with infill opportunities, as well as rehabilitation and new planned development.
8 4
GOAL 6: DEVELOP AND DELIVER COMMUNITY-BASED PROGRAMS
Policy or Action
Posit
ive
Nega
tive
Neut
ral
A: Create Administrative Structures that Support and Encourage Housing Variety, Quality and Affordability Explore the creation of a one-stop shop for developers and other organizations interested in affordable housing production, rehabilitation or related services.
8 4
Ensure that when needs are shared by multiple jurisdictions, regional or joint solutions are implemented to ensure greater efficiency and reduced costs.
9 3
Implement legal methods by which program and project resources may be secured to ensure affordability and preservation of affordable units. 9 3
B: Develop and Implement Programs to Serve Households in Need of Quality Affordable Housing Contact organizations and agencies that currently provide financial and other resources and sponsor workshops and other educational opportunities for homeowners, investors, and renters.
10 2
Explore the creation of a loan pool to acquire foreclosed property for rent or sale to households displaced by foreclosure. 5 2 5 Ensure that housing is linked to wealth building and social services, such as child care, job training, and employment search assistance. 7 5
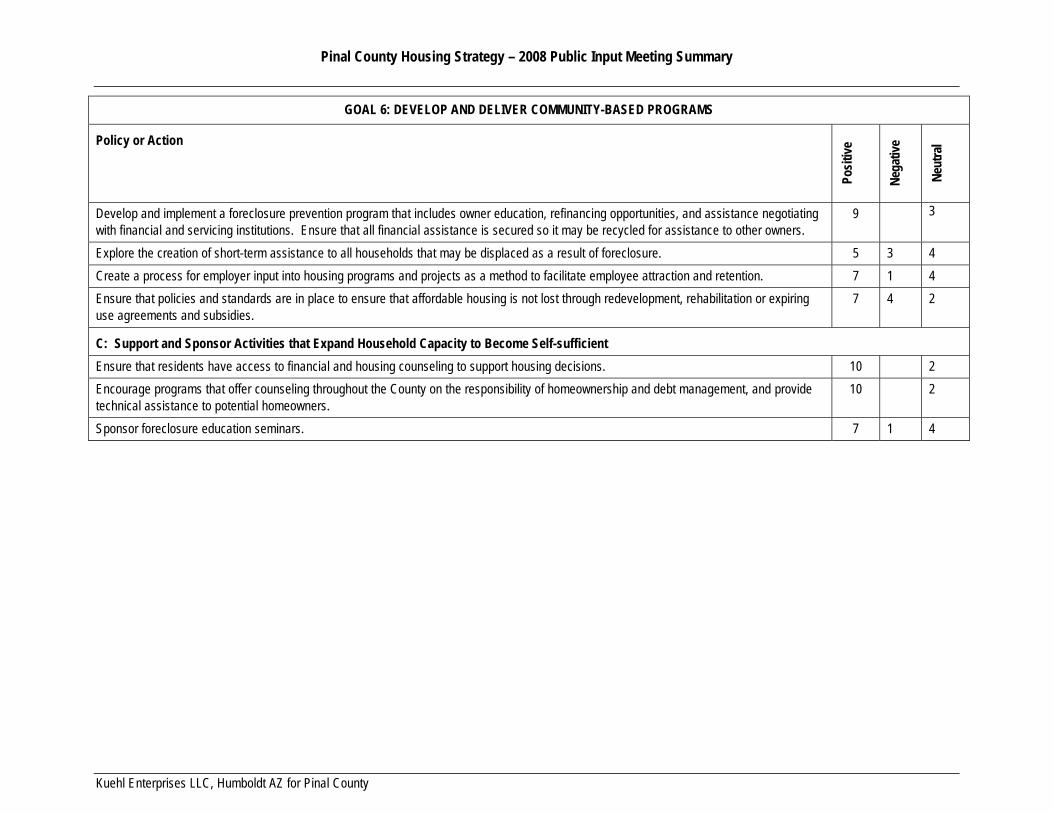
Pinal County Housing Strategy – 2008 Public Input Meeting Summary
Kuehl Enterprises LLC, Humboldt AZ for Pinal County
GOAL 6: DEVELOP AND DELIVER COMMUNITY-BASED PROGRAMS
Policy or Action
Posit
ive
Nega
tive
Neut
ral
Develop and implement a foreclosure prevention program that includes owner education, refinancing opportunities, and assistance negotiating with financial and servicing institutions. Ensure that all financial assistance is secured so it may be recycled for assistance to other owners.
9 3
Explore the creation of short-term assistance to all households that may be displaced as a result of foreclosure. 5 3 4 Create a process for employer input into housing programs and projects as a method to facilitate employee attraction and retention. 7 1 4 Ensure that policies and standards are in place to ensure that affordable housing is not lost through redevelopment, rehabilitation or expiring use agreements and subsidies.
7 4 2
C: Support and Sponsor Activities that Expand Household Capacity to Become Self-sufficient Ensure that residents have access to financial and housing counseling to support housing decisions. 10 2 Encourage programs that offer counseling throughout the County on the responsibility of homeownership and debt management, and provide technical assistance to potential homeowners.
10 2
Sponsor foreclosure education seminars. 7 1 4