pl tech4nical sl.79-15 - apps.dtic.mil · penco2d computer code. the analysis includes free-surface...
TRANSCRIPT
u-rBvst Availab~e Co '
NLEVETECH4NICAL REPORT SL.79-15PL
0 PROJECTILE PENETRATION IN SOIL AND ROCK:ANALYSIS FOR NON-NORMAL IMPACT
Ro ~ ~ ebert S.BrarDnilCCriho
Final Report *LDL-ýU L
Prs~are for Defense Nuclear AgencyJ Washington, D. C- 20305
Under DNA Subtask Y99QAXSB21 1, Work Unit 20
8P 2 20 01Best Available Copy
Best Availabic) CopyUnclassified
SECURITY CL.ASSIFICATION OF THIS PAGE (Who et D nfe.4)
4 &q.~LH PAGEBFR OPEIGFR1. 0ER NUMIIUE ý WF5/71 2. GOVT ACCESSION No. 3. ACSLPENT'S CATALOG H4UMBER
Technical Repor L-7915 r.02!.4. TITLE (sail S..bile S l O 44OI aPEF0acoe
rdTPROJECTILE gENETRATION IN SOIL AND ROCK: ANALYSIS Final re .#TbR NON-NORYAL MC- A J A
Daniel C./Creighton
S. PERFORMING4 ORGANIZATION NAME ANO ADDRESS 10. PROGRAM ELEMENT. PROJECT. TASKC
U. S. Army Engineer Waterways Experiment StationStruactures Laboratory SeBok1P. 0. Box 631, Vicksburg, Miss. 39180_____________
11. CONTROLLING OFFVICE NAME ANO ADONIS$Defense Nuclear Agency // Decm ~r 1979Washington, D. C. 20305 -_
14. MNo t RIN aGENCY NAME & AOORCSS(it alfffoui ft...t Couttrollg Office) IS. SECURITY CLASS. (01 this trofot)
1S.. OECLAS31FICATION/OOUINGRAOINGSCH4EDULE
Approved for public release; distribution unlimited.
17. OISTRIVIUTION STATEMENT (of the .hetroat ontm lot Block ". It Mff..w~t from. Rspo*i)
I*- SUPPLEMENTARY NOTES
..'This earch was sponsored by the Defense Nuclear Agency under Subtask/,Y99Q.AX!23 Work2 1 .Ui 20jŽ"P etrat ion Support."
It. KCEY WORDS (C-..~U .Idi nec...r OW IdontifVP by block 0,webw)
Ballistics PenetrationComputer analysis ProjectilesImpact Rock penetrationNumerical analysis Soil penetration
-An empirical rigid-projectile anal~ysis has been developed for non-normalimpact and penetration into soil and rock. The soil penetration analysis usesYoung's S-number as the penetrability index. The rock penetration analysis
calclats rsisanc-topentraionusing density, strength, and Rock QualityDesignation. Expressions for compressive normal stress are integrated numneri-cally over the projectile surface using the differential area force law in the
(Continued)
00 143 KOPTIO4 or INOV so Is 0953LETE UnclassifiedSECUPITY CLAMS1FICATION OP THIS PAGE (VI... D.es Entered)
S1CUISItY CLAWFIPCATIWU OF h PAGS(wo" Does ~an-
20. ABSTRACT (Continued).
PENCO2D computer code. The analysis includes free-surface and vake separation-reattachment effects.
The PENCO"D code is used to make comparison calculations for Sandia/DNA
reverse ballistic tests and several full-scale tests conducted by Sandia
Laboratories. A parameter study shows effects of soil penetrability, impact
velocity. initial attack and obliquity angeles, and projectile geometry onunderground trajectories.
Best Avai11able CopY/
Unclassi fliedISCUMIITY CL ASSIFPIC ATION Ofr THIS P AGW("ý Viot I•tstmlr
PREFACE
This investigation was sponsored by the Defense Nuclear Agency
under Subtask Y99QAXSB211, "Penetration," Work Unit 20, "Penetration
Support." This study was conducted by personnel of the Structures
Laboratory (SL), U. S. Army Engineer Waterways Experiment Station (WES),
during October 1978 through May 1979, under the general supervision of
Mr. Bryant Mather, acting Chief, SL, and Dr. J. G. Jackson, Jr., Chief,
Geomechanics Division (GD), SL. Mr. R. S. Bernard formulated the
theory, and Mr. D. C. Creighton developed and implemented the computer
analysis, both under the technical guidance and direction of Dr. B. Rohani,
GD. Messrs. Bernard and Creighton prepared this report.
COL John L. Cannon, CE, and COL Nelson P. Conover, CE, were Command-
ers and Directors of WES during the period of research and report prepara-
tion. Mr. F. R. Brown was Technical Director.
KciessionFo
---- S±•• For
Wis GAýkDZLo TAB
Juý.tif icat iov
Be st Available Goy ) y
L,- Lin~a -It I d/, I
Dist \sPCC! ]
iii
CONTENTS
PREFACE . . . . . . . . . . . . . . . . . . . . . . . . . . . . . I
CONVERSION FACTORS, U. S. CUSTOMARY TO METRIC (SI)UNITS OF MFASUR1F4EMNT . 6
CHAPTER I INTRODUCTION ..................... 7
1.1 Background ............ . . . . ... 71.2 Purpose and Scope ............... 7
CHAPTER 2 PENETRATION ANALYSIS FOR MOTION IN TWO DIMENSIONS • • 9
2.1 Projectile Motion in Two Dimensions .... ........... 92.2 Stress Distribution for Rock and Concrete ........ . 112.3 Stress Distribution for Soil ..... ............... .... 122.4 Wake Separation and Reattachment .... ............. . .. 132.5 Free-Surface Effect ........... ................... ... 16
CHAPTER 3 CALCULATIONS AND EXPERIMENTAL DATA ...... ......... 23
3.1 Background ..... ........................ 233.2 Reverse Ballistic Tests in Sandstone. ........... 233.3 Full-Scale Penetration Tests in Soil .... ........... ... 26
CHAPTER 4 PARAMETER STUDY FOR SOIL PENETRATION ............... 46
4.1 Background .............. ........... ................ 464.2 Baseline Conditions ................. .................. 464.3 Variation of Target Penetrability and
Impact Conditions ................ .. . .4.4 Independent Variation or Projectile
Parameters for Straight Aftbody ..... ............. .... 484.5 Variation of Aftbody Flare ........ ................ .4.6 Variation of Coupled Projectile Parameters ........... . .. 4a
CHAPTER 5 CONCLUSIONS ..................... qo
REFERENCFS ................. .............................. 61
APPENDIX A PENETRATION THEORY FOR ROCK AND CONCRETE ...... 65
A.1 Empirical Theory for Normal Impact ..... ............ 6rA.2 Extrapolation to Non-Normal Impact ....... ............ 07
APPENDIX B PENETRATION THEORY FOR SOTI ....... .............. 73
B.1 Fnpirical Theory for Normal Impact ........... ............ 7(B.2 Extrapolation to Non-Normal Impact ....... ............ 77
APPENVIX C NOTATION ................ ........................ .II
Best Available Copy
LIST OF TABLES
Table Page
3.1 Soil penetration data for non-normal impact .... ....... 28
3.2 S-number profile for TTR Antelope Dry Lake site. . . . .. .. 9A.1 Penetration data for rock and concrete ......... 6)A.2 Projectile and target parameters .... ............ 70B.1 Typical S-numbers for natural earth materials ........ 70
LIST OF FIGURES
Figure
2.1 Projectile motion in two dimensions ... ........... ... 192.2 Three-dimensional view of projectile ... .......... . 10
2.3 Projectile surface geometry and velocity components . . . 202.h Wake separation for purely axial motion ........... .. 202.5 Separation and reattachnent on a rotating projectile . 12.6 Rear axial view of projectile cross scetion .... ....... 212.7 Projectile orientation with respect to free surface . . 223.1 Scale drawing of RBT penetrator ......... ............. 303.2 Comparison of calculated and measured lateral accelera-
tions for Sandia/DNA RBT, 3-degree attack angle . .. 313.3 Comparison of calculated and measured axial decelera-
tions for Sandia/DNA RBT, 3-degree attack angle ..... .. 313.4 Comparison of calculated and measured strains for
Sandia/DNA RBT, 3-degree attack angle ..... .......... 323.5 Comparison of calculated and measured lateral accelera-
tions for Sandia/DNA RBT, 20-degree obliquity .... ...... 323.6 Comparison of calculated and measured axial decelera-
tions for Sandia/DNA RBT, 20-degree obliquity ........ 333.7 Comparison of calculated and measured strains for
Sandia/DNA RBT, 20-degree obliquity ..... ........... 31N3.8 Calculated lateral force for different values of free-
surface parameter, Sandia/DNA RBT, 20-degreeobliquity ..... ........................
3.9 Calculated pitch moment for different values of If-ee-surface parameter, Sandia/MNA HBT, 20-degreeobliquity ................... ........................ ., ,*
3.10 Calculated lateral force for different values of wakeseparation angle, Sandia/DNA RBT, 20-dejret"obliquity ................................ 3
3.13 Calculated pitch moment for different values of wakeseparation angle, Sandia/DNA RBT, 20-degreeobliquity ..................... ........................ 35
3.12 Calculated lateral force for different values of wakeseparation angle for Sandia/DNA RBT, 3-degreeattack angle . . . . . . . . . . . . . . . . . . . . . .
Best Available Copy
Figure Page
3.13 Calculated pitch moment for different values of wakeseparation angle for Sandia/DNA RBT, 3-degreeattack angle ..... .... ...................... 36
3.14 Calculated lateral force for different values ofobliquity, Sandia/DNA RBT .......... ................. 37
3.15 Calculated lateral force for different values ofattack angle, Sandia/DNA RBT ......... ................ 3T
3.16 Calculated pitch moment for different values ofobliquity, Sandia/DNA RBT ............ ................. 38
3.17 Calculated pitch moment for different values ofattack angle, Sandia/DNA RBT ....... ............... ... 38
3.18 Variation of maximum calculated lateral load withattack angle and obliquity, Sandia/DNA RBT . ........ 39
3.19 Variation of maximum calculated pitch moment withattack angle and obliquity, Sandia/DNA RBT ..... ........ 39
3.20 Calculated lateral force for different values of targetstrength, Sandia/DNA RBT, 3-degree attack angle ......... 40
3.21 Calculated pitch moment for different values of targetstrength, Sandia/DNA RBT, 3-degree attack 4angle. ....... 20
3.22 Calculated lateral force distribution for differentvalues of target strength, Sandia/DNA RBT, 3-degreeattack angle ............. ....................... .... 41
3.23 Effect of wake separation angle 0min on calculatedtrajectories, Sandia Test R800915 .... ............. ....41
3.24 Effect of wake separation angle *min on calculatedtrajectories, Sandia Test R800916 ...... ............. 214
3.25 Effect of free-surface parameter k on calculatedtrajectories, Sandia Test R454025-23 ....... ........... 42
3.26 Effect of wake separation angle Omin on calculated trn--jectories, Sandia Test R454025-23 ................. 43
3.27 Effect of wake separation angle on calculated tra-jectories, Sandia Test R454025-22. ......... ........... 43
3.28 Comparison of calculated trajectories for Sandia pene-trators, ýmin = 1 degree ......... ................. .... 44
3.29 Comparison of calculated trajectories for Sandia pene-trators, *min = 2 degrees .......... ................. .44
3.30 Comparison of calculated trajectories for Sandia pene-trators, Omjn - 4 degrees .......... ................. 45
3.31 Comparison of calculated trajectories for Sandia pene-trators, $min = 8 degrees ......... ................. ..... c,
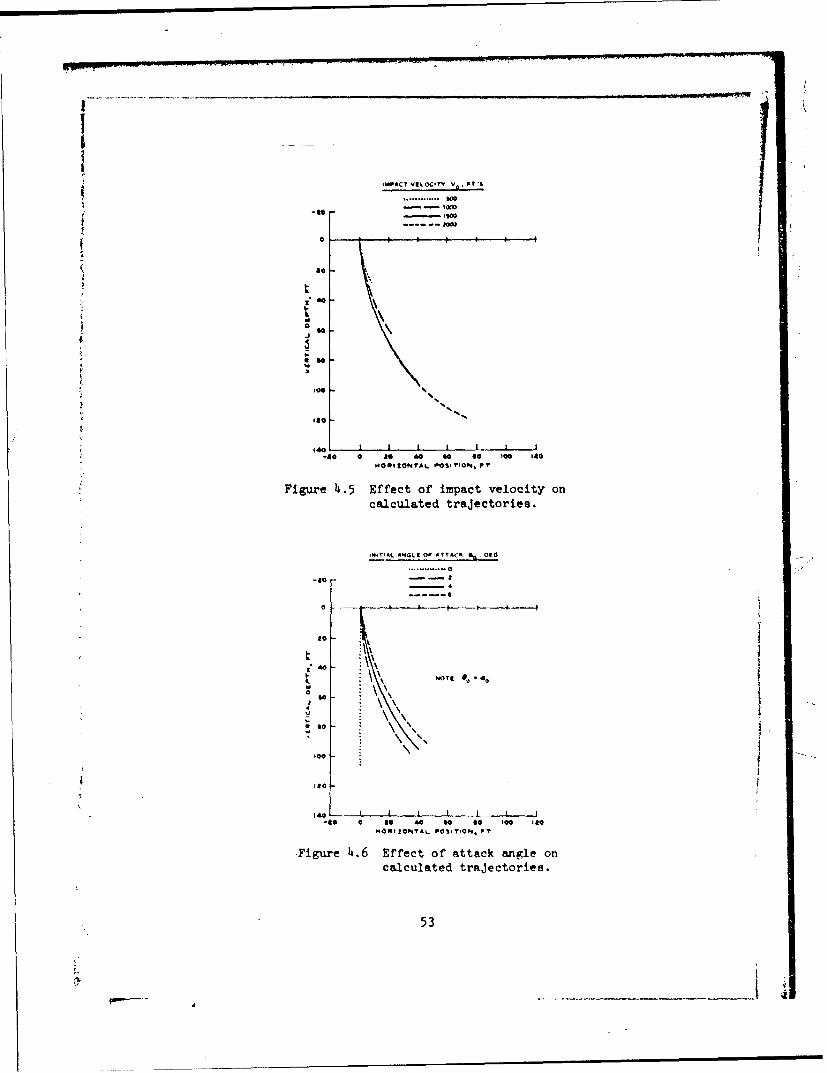
4.1 Calculated trajectory for baseline conditions .......... 514.2 Calculated external forces for baseline conditions . . . .4.3 Calculated pitch moment for baseline conditions ........ 24.4 Effect of soil penetrability on calculated trajectories . . 24.5 Effect of impact velocity on calculated trajectories . 5 534.6 Effect of attack angle on calculated trajectories ..... 534.7 Effect of obliquity on calculated trajectories ........ ... 944.8 Effect of projectile weight on calculated trajectories . •;44.9 Effect of projectile diameter on calculated
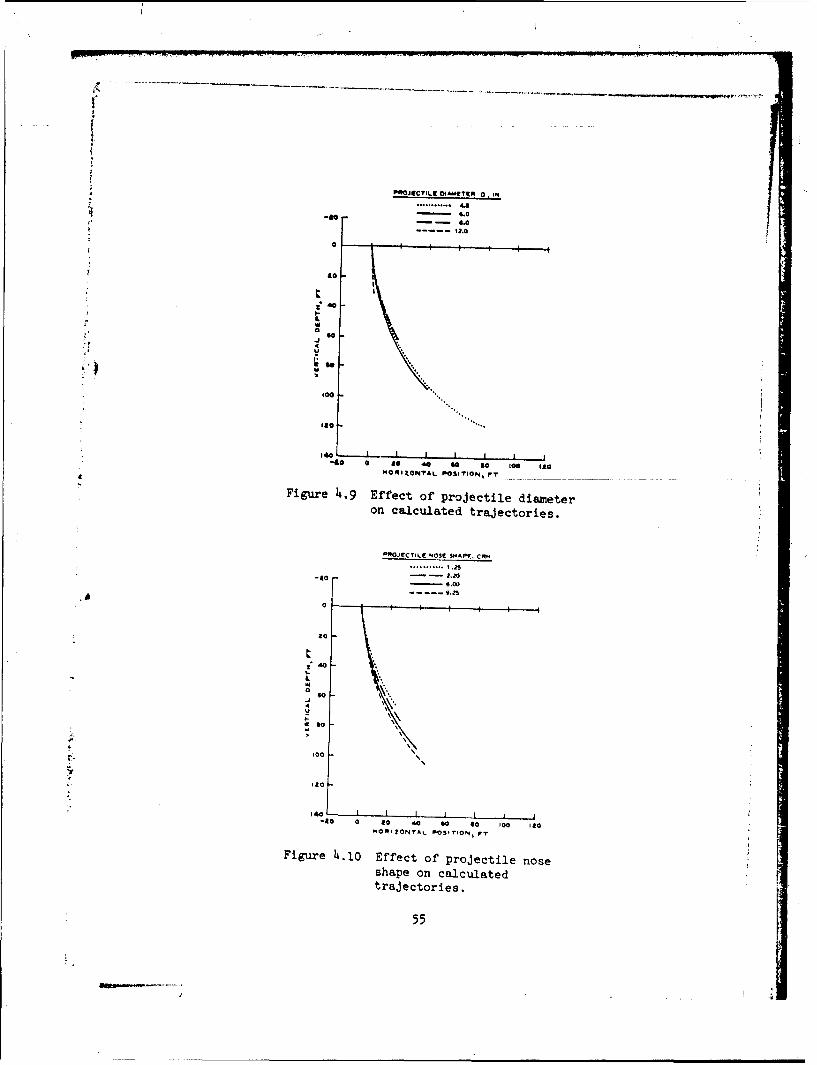
trajectories . . . . . . . . . . . . . . . . . . . . . . . 55
4
Best Available Copy
Figure Page
4.10 Effect of projectile nose shape on calculatedtrajectories ... .................... 55
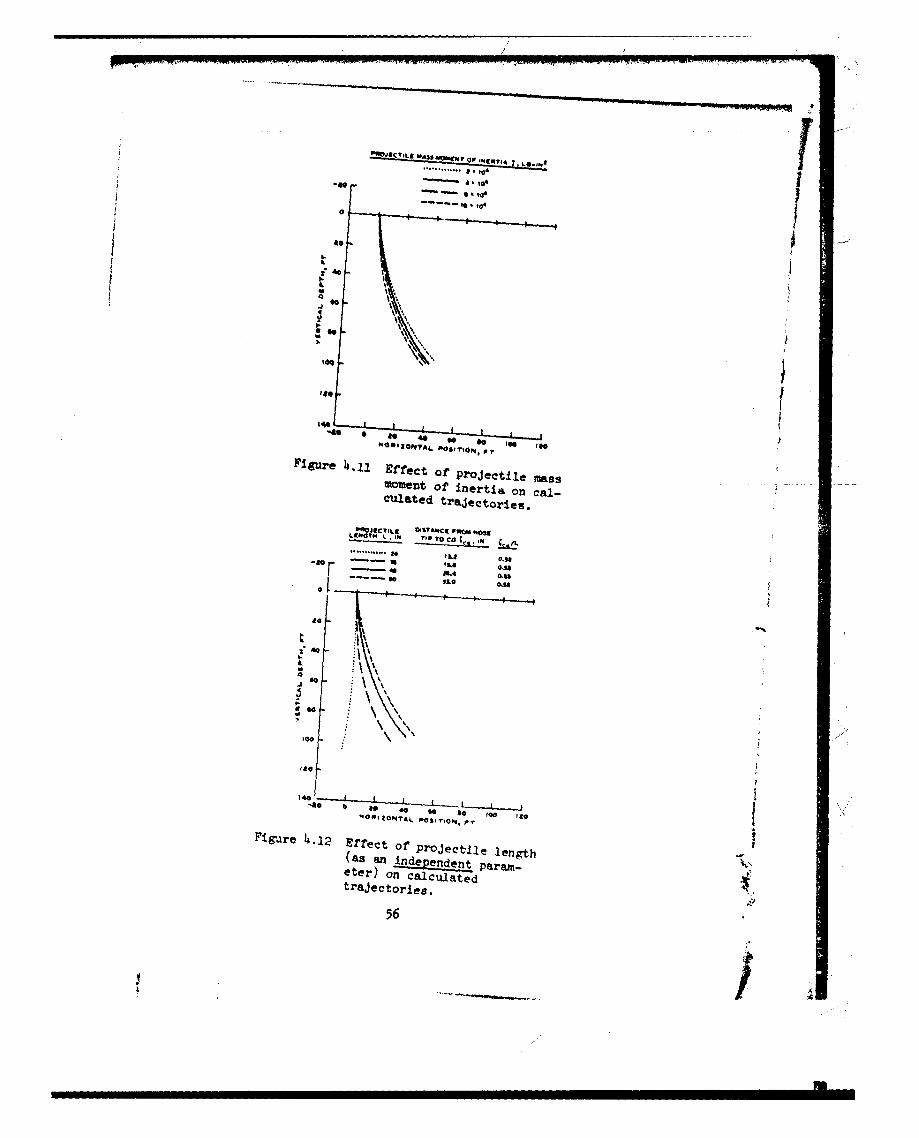
4.11 Effect of projectile mass moment of inertia on cal-culated trajectories .......... ... .............. ... 56
4.12 Effect of projectile length (as an independentparameter) on calculated trajectories .......... 56
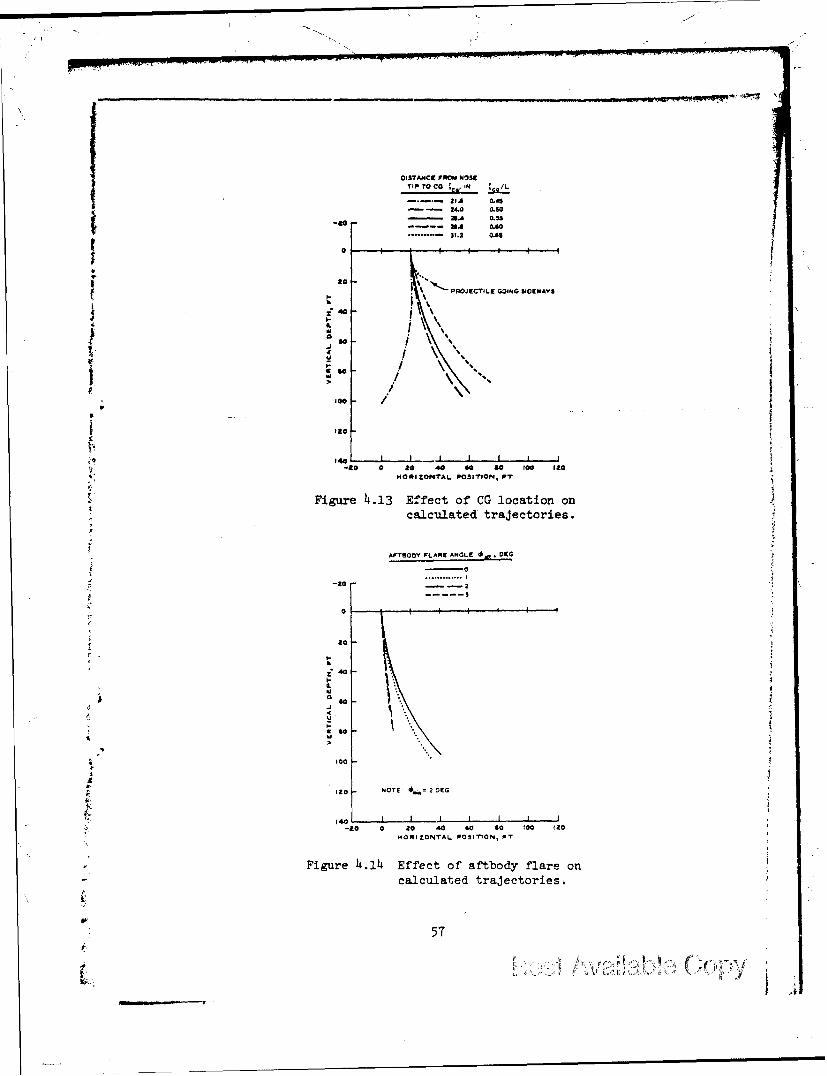
4.13 Effect of CG location on calculated trajectories ... ..... 574.14 Effect of aftbody flare on calculated trajectories .... 574.15 Scale drawing of projectile with 3-degree aftbody
flare ....... ......... .......................... ... 584.16 Combined effects of weight, length, CG location, and
mass moment of inertia on calculated trajectories .... 58A.1 Nondimensionalized penetration data for rock and
concrete ... ......................... 71B.1 Comparison of calculated penetration depths with data
from TTR Main Lake area ......... ..... ................ 80
Best Available Copy
5
CONVERSION FACTORS, U. S. CUSTOMARY TO METRIC (SI)UNITS OF MEASUREMENT
U. S. customary units cf measurement used in this report can be con-
verted to metric (SI) units as follows:
Multiply By To Obtain
feet 0.3048 metres
inches 0.0254 metres
feet per second 0.3048 metres per second
pounds (force) per foot 14.5939 newtons per metre
pounds (force) per square inch 6894.757 pascals
pounds (mass) 0.4535924 kilograms
pounds (mass) per cubic foot 16.01846 kilograms per cubic metre
pounds (mass) per inch 17.85797 kilograms per metre
pounds (mass)-square inches 0.0002926 kilograms-square metres
Best Available Copy
6
PROJECTILE PENETRATION IN SOIL AND ROCK:
ANALYSIS FOR NON-NORMAL IMPACT
CHAPTER 1
INTRODUCTION
1.1 BACKGROUNID
In recent years, due to growth of the experimental data base,
development of empirical formulas, and implementation of new theoretical
and computational techniques, it has become possible to predict the
approximate motion of stable earth penetrators after normal impact in
many types of geological targets (Reference I-L). Results of some non-
normal (yawed/oblique) impact tests have also been predicted success-
fully, although the data base is small compared to that for normal impact
(References 5 through 7).
Previous analyses by the U. S. Army Engineer Waterways Experiment
Station (WES) of non-normal impact have used the Cavity Expansion Theory
(CET) for rock, and an empirical formu-lation similar to Young's equation
for soil (References 5 and 8). These analyses were considered prelimi-
nary when they were first developed, and it was hoped that more credible
analyses would arise in the future.
1.2 PURPOSE AND SCOPE
The present investigation concerns the development of a generalized
znalysis for oblique/yawed impact and penetration in soil and rock (or
rock-like) targets, based on the modification of previous analyses and
the interpretation of recent test data. The objectives are (a) to
obtain external load-time histories sufficiently accurate for structural
response calculations and (b) to calculate postimpact trajectories well
enough to predict the terrndynamic performance and stability of a given
projectile.
The two-dimensional (2-D) penetration theory, including equation of
motion, stress distribution, and free-surface tnd wake separation-
reattachment effects, was developed. The penetr ation theory was computer
Best Available Copy
Icoded into PENCO2D to make comparison calculations with experimental
data from both reverse ballistic and conventional penetration tests.
Using PENCO2D, the effects of initial impact conditions, projectile
geometry, and soil penetrability were examined in a brief parameter
study.
Best Available Copy
8i
ileot Ava llab) e Copy
CHAPTER 2
PENETRATION ANALYSIS FOR MOTION IN TWO DIMENSIONS
2.1 PROJECTILE MOTION IN TWO DIMENSIONS
Consider a rigid, deeply buried projectile (no free-surface effects),1
whose motion lies in the XZ-plane, as shown in Figure 2.1. The rota-
tion is described by the angular velocity 0 , and the translation by
S.. Z , the X- and Z-velocity components of the center of gravity
(CG). 2 ' 3 For analysis, it is convenient to express the CC velocity in
terms of its lateral and axial (x- and z-) components V and V ,4 x z
respectively:
V X cose -e sin e (2.1)
V z sin 0 + cos 8 (2.2)
For purely axial motion (Vx 0 , 6 = 0), the stress distribution on
the projectile is symmetric, and the net force is in the axial direc-
tion, producing no pitch (turning) moment. The introduction of rotation
(6 0 0) or lateral motion (Vx 0 0) destroys this symmetry, and it is
necessary to specify the asymmetric stress distribution in order to
calculate the resulting force and moment.
Suppose that the compressive resisting stress a is always normal
to the projectile surface (no tangential stresses). On any surface area
element dA , the x- and z-components of a are, respectively,
1 The XZ-coordinate system is fixed in the target (Figure 2.1).2 A dot above any quantity indicates differentiation with respect to
time.For convenience, symbols and abbreviations used in this report are
4 listed and defined in the Notation, Appendix C.The xz-coordinate system is fixed on the projectile axis, with itsorigin at the CC (FiFure 2.1). Equations 2.1 and 2.2 representthe projections of the absolute velocity vector along the x- andz-axes.
9
o a a cos ,n co0 8 (2.3)x
a a o sinrn (2.li)a
where
* * azimuthal angle (Figure 2.2)
tan n s ulope of projectile surface at a given point, with respectto axis of symmetry (Figures 2.1 and 2.3)
The lateral and axial, force components (Figure I.') acting on surface
element dA are, res!,ectively,
dF - -o dA (2.5)x x
dF -o dA (2.6)
where dA in the differential element of surface area. The lateral
aid axial net force comivnentts acting on the entire projectile are then
F - -f o dA (W.7)x x
F - -f o. lA (2.8)
where the integral is evaluatied over the entire projectile ,urfaece.
The translational (i2G) equations of motion are
M X - F eos 0 + F nin 0 (2W.)
M - -F ,in 0 + F cos 0 (W. 10IX
where M in t he proje1e t. iI mnn rmind X iuih ntrc the omponeInit.S of'
at-oeleration In the X- nnd '.7-M rect. l.r *, restlpe-,t ively. The projlect, ile
is nhitmiied to be rigid, zio the roeatn Iton]i erint. ion of' mot.ion is
1;;- f , - f x ,IF 12.11)
10
Best Available Copy
where I In the trmaivernt' maps nitimoet of' Inert ia aboitt the C0, 0 Is
the nngular nceeleration, andi x mid r, mire the lateral And atxial
dlantacea, respeot ivelvy, from the CO (Figitre 0.01. 'Me right-hand s~ide
of FEquation Xli1 in the t.otAl moment exertet tin the pro~jeotilie ikbouit.
ItS CGt, Andi thIe integraln are ev~unt~ed over the etit ire nren or the
iprojeect le ourfnoe.
2~. " STMI OI)TTHPIVION FtPROCK( AND CONCRFTF
For 1'enetrat ion into conorete mtid IntAot rook (Appendix A), the
net force on the projleeti Ic cn lip oalcUlAttd appIrx~xItmAtely from the
following norMal st~rens dist ribut. tn:
where
Y - unconfined oompirnsin vi sttrength or lutacnt tntrget maiterint
11 target. mnts delirlity
v nb'oo i t e I oal vet colt y (i tA a ~ (n poinut. ton projcoft le miiwt'nov(Figrp 2. 3)
v oiftitintd ormnl e.lmpotiont or' v t, I1ur' 2.
ci' i ned in tvermrn of' V *V , 0 ,Anti 7 , the iliitAt.it.Ies v Andx
v kre
v j~~ (V, 4,
I f tierorsnry , mitllnc 00t-'et I ,'is Y onii l'~' ffidietforC I h' .pim I It ycr the rook or for t he rinimi mInnn~~e~te~ II I the con..I'Mret(Append i A'). Any tirt. or imits otnn ber iinc! III F'qunt ion 212Hitfhoy mint. I'e I mrns lonnlI ly vompnt. 11, 1r (n. #. s' Iign , feert
Best Available COPY
vn V. sin n + (Vx + zi) cos n cos * (2.14)
It is assumed that a given surface element must have a net motion into
the target material to produce a resisting stress; hence, a vanishes
when vn < 0 in Equation 2.12.
2.3 STRESS DISTRIBUTION FOR SOIL
For penetration into soil (Appendix B), the net force on the
projectile can be calculated approximately from the following normal6stress distribution:
V V V+5 r v >0
S v S p v $2 v n
a. (2.15)
0, v <0
where
1.96 x 10⁵ lb/ft, constant 7
8 6.25 x 10⁶ Ib2-sec 2 /ftT, constant
y U 1.56 x 10⁵ lb/ftt3 , constant
S a Young's S-number (Appendix B), soil penetrability index
rp - local cylindrical radius at a given point on the projectilesurface
Z - vertical depth of a given point on the projectile surface,measured from the target surface
The expressions for v and vn are still given by Equations 2.13 and
2.lh, respectively; and the requirement that vn 0 for o 0 applies
in soil as well as in rock or concrete.
The quantities u , p , and y are constants, independent of soil
6 Any set of dimensionally compatible units can be used in Equation 2.15,
7 as long as all quantities are converted to those units.A table of factors for converting U. S. customary units of measurementto metric (ST) units is presented on page 6.
12
Best Available Copy
type and projectile characteristics. Thus, the only parameter charac-
terizing the soil is Young's empirical S-number, which can be obtained
for a given target from previous penetration data or from correlation
with geological descriptions (Table B.1).
2.4 WAKE SEPARATION AND REATTACTUENT
Flash X-ray photographs and two-dimensional (2-D) finite-difference
calculations have shown that loss of contact between target and projec-
tile occurs somewhere on the nose, while reattachment may or may not
occur on the aftbody. The current analysis is not sophisticated enough
to predict the actual onset of separation. Nevertheless, it is neces-
sary to include a simple model for the kinematics of wake separation,
especially when 2-D projectile motion in soil is investigated.
It is assumed that there is a minimum angle of approach, or wake
separation angle, *min required between the target and the projectile
contact surface (Figure 2.4) in order for contact to be maintained.
For a given surface element, the local angle of approach 0 is deter-
mined by the instantaneous orientation8 of the projectile such that
Vsin =n (2.16)
where V is the CG velocity and V is its outward component normalnto the projectile surface, given by
V n V sin n + V cos n cos i (2.17)n z x
Thus, separation occurs whenever < <min ' i.e., whenever the local
angle of approach is less than the wake separation angle. 9
Separation is only part of the problem; reattachment may or may
The rotational velocity 6 is not considered in formulating thecriterion for wake separation. This quantity does, however, playa strong role in wake reattachment.For the case of no yaw (no angle of attack), Equation 2.16 reducesto sin * sin ni
13
-.. r - S !
not occur, depending on the relative motion of the wake and the aftbody
downstream of the separation point. It is expected that the wake separa-
tion angle +rmin will generally be small (<10 degrees), in which case
the angle of attack a required to maintain contact will also be small.
In any case, reattachment will be analyzed based on three assumptions:
1. Constant axial velocity (V )2. Constant angular velocity (6)
3. Constant angle of attack (a)
Obviously, these three quantities change as the projectile penetrates
into the target. Nevertheless, if the quantities do not vary rapidly,
the quasistatic approximation is adequate.
The cavity formed by the wake is a gently curved cylindrical tube
of increasing radius (with time), and the projectile rotates inside
this tube as it travels forward. The curved axis of the cavity is
fixed in the target, and aftbody reattachment occurs wherever the
projectile rotates into the cavity wall (Figure 2.5).
Disregarding any stresses that may oppose the radial expansion of
the cavity, conservation of mass and incompressibility in the target
requires that
r constant (2.18)
where r is the local cylindrical wake-cavity radius. EvaluatingcEquation 2.18 at the separation point, it then follows that
rc c = r V tan (2.19)
where r is the projectile radius at the separation point. For smallo
values of ,min ' r is approximately the radius corresponding to
n = @rmin (Figure 2.4). Furthermore, for straight- and tapered-aftbody
projectiles, r is approximately the radius at the base of the nose,o
Denoting axial distance aft of the nose tip by C , time deriva-
tives can be related to V and C by the transformationz
14

d= v d (2.20)dt zdý
and Equation 2.19 reduces to
drr c cr tan (2.21)
for which the solution is
r c 4r2 + 2r (- )tan in ->O (2.22)
where o is the value of C at the separation point. For < o
the cavity radius is the same as the projectile radius, since no loss
of contact has occurred.
Using Equation 2.20 again, the differential equation for the
lateral displacement 6 of a point on the projectile axis, relative
to the cavity centerline (Figure 2.5), is
dt dS (2.23)dt z dr
Treating V and e as constants, the solution for 6 isz
f 2 6 (2.24)z
The initial displacement 8 = . sin a is the displacement due to theo10
angle of attack a (treated here as a constant), so Equation 2.24 is
replaced by
10 It is assumed that small attack angles do not significantly change
the cavity geometry. Thus, if 6 0 , the cavity centerline willbe straight; but if in addition a $ 0 , the projectile axis willbe skewed relative to the cavity, producing displacements 6Ssin c between the projectile axis and the cavity centerline.
15
I

C. .. ( 2.25
2 1 - )2 + • sin a( )
where
Q -tanI (2.26)
At any point on the projectile surface aft of the separation point, the
criterion for no contact is
2oa r 2 2 <S4 ") * sin a -rp PCos r< r sin2 '0, <_ _
z 2
(2.27)
r Cose 2 sia< r 2 r 2 si
Hence, if m min and Equation 2.27 are satisfied, there is no con-
tact, and 0 0.
The foregoing analysis is only a rough method of accounting for
wake separation and reattachment using a single input parameter, the
wake separation angle jmin * Nevertheless, this analysis does make
it possible to assess the relative effects of separation and reattach-
ment on projectile stability, as will be shown in Chapter 3.
2.5 FREE-SURFACE EFFECT
In brittle materials, such as rock and concrete, a crater is always
formed during (or just after) impact. Postimpact inspections in rock
(Reference 9) indicate that these craters may be as much as 10 projec-
tile diameters across at the target surface. The crater width decreases
Figure 2.6 presents a rear axial view of the projectile and cavitycross sections at an arbitrary location aft of the separation point.The figure is valid only for small displacements, i.e. 6 -<<
16
rapidly with depth, however, approaching a value equal to (or slightly
less than) the projectile diameter after a few calibers of penetration.
The same phenomenon occurs in soil, though to a lesser extent than in
rock, since soils are more ductile than brittle in behavior.
For normal impact or for near-normal impact with slight yaw, it is
not necessary to account for the cratering phenomenon (i.e., free-
surface effect) in calculating the loads on the projectile with the
current analysis. On the other hand, for oblique impact with no initial
yaw, the free-surface effect is probably one of the dominant mechanisms
creating an unbalanced lateral force on the projectile, especially in
rock and concrete. Thus, for analyzing non-normal impact in general,
the presence of the free surface should be acknowledged, even if only
by a crude representation of its effect.
The influence of the free surface is modeled herein with an on-off
stress criterion, governed by the location of a given projectile surface
element dA with respect to the free surface (Figure 2.7). Whenever
the radial distance from the projectile axis (through dA) to the free12
surface is less than some prescribed value r , then the stress onsdA is set equal to zero. Quantitatively, this condition is expressed
by setting a = 0 whenever
ZCG + z cos e < rs sin e cos j (2.28)
where ZCG is the vertical distance from the free surface to the CG.
Assuming r to be directly proportional to the local projectile radiuss
r , Equation 2.28 is replaced by the stipulation that a = 0 wheneverp
ZCG + z cos 8 < krp sin 8 cos k (2.29)
where the free-surface parameter is
12 rs is the maximum perpendicular distance from projectile axis,
through dA , to target surface for which stress relief due to thefree surface can occur.
17
r
k • a constant (2.30)p
This model for the free-surface effect produces a stress distribu-
tion that may be partially or completely turned off on the top side
(-w/2 < 0 < w/2) of the projectile, depending on the geometry, depth,
and orientation with respect to the target surface. The deeper the
penetration and the more vertical the orientation, the smaller the
influence of the free surface on the lateral loads.
~~ A\,ailable COPy
18
I
9f

WoT9 I z C0o.C'Att SVSItU,,%to No T%( YAKUOT
mCO0ROOMATI SVITO C
A1140 010 P*MJCF.tqW?[ A
Figure 2.1 Projectile motion in two dimensions.
Figure 2.2 Three-dimensional view of projectile.
19
"1b-
fI
Figure 2.3 Projectile surface geometry andvelocity components.
V..i.20OINT
V,Vz
Figture 2.4 Wake separation for purely axial motion.
20
\, \ \.-,..
OFF.•
Poo. I WAfL
( '
me ~ I atV4~d
"%. S%
Figure 2.5 Separation and reattachment ona rotating projectile.
WAK1-CAVITY WALL
PR JCTL .v~
NOTE. THIS DRAWING VALID ONLN FOR
DISPLAý'EMENT RELATIVE TO WANkE-CAVIT'tCROSS SECTION AFT OF SEPARATION POINT
Figure R. ear axial view otf pro'jec.til]e
cross section.
21
Figure 2.7 Projectile orientation with respectto f~ree surface.
22
/
CHAMMI2 3
CALCULATIONS AND FXPERIMENTAL DATA
3.1 BACKGROUND
Detailed information concerning non-normal impact effects is scarce,
mainly because additional parameters that go beyond those important for
normal impact are Involved. In the latter case, the important quantities
are the weight, size, and geometry of the projectile; the Impact veloc-
ity; the final depth; and the axial deceleration record. For non-normal
tests, however, the additional important parameters are the moment of
inertia and CG of the projectile, the lateral compor.ents of the impact
velocity, the 2- or 3-D trajectory (including projectile orientation),
and the lateral components in the deceleration record.
Usually, the only way to obtain all this information is by con-
ducting a reverse ballistic test (RBT). Still, if the projectile
parameters are known, much Insight can be gained from knowing only the
impact conditions and the final position, particularly with regard to
stability.-In this chapter, comparisons will be made between calculationsI and
test results for RBT's and conventional penetration tests. The main pur-
pose will be to investigate the general credibility of the analysis and
the parameters used therein. Although the data are too few to achieve
the degree of verification that can be obtained for normal impact, there
are still enough benchmarks available to check for unreesonable predic-
tions. With this done, some credence can be given to the parameter
study in Chapter 4.
3.2 REVERSE BALLISTIC TESTS IN SANPSTONE
Tn 1Q77, Sand iL Liborattoris cornductd l'our DNA-t:-.potorced H1VV'":i In
sandstone. A completc description of the tte-;tto Is given In Reference 10,
The PENCO2D computer code, which solves the penetration problem In two
dimensions, uring the annlysis presented In Chapter 2, was used forall calculations reported herein.
23 • n n

and the processed data are presented in References 11 and 12. I'o of
the tests (Nos. 2 and 3) were done at a 3-degree attack angle, and one
(No. 4) at 20 degrees obliquity (no angle of attack). The impact veloc-
ity was approximately 1500 Wt/e In each case. Nominal target properties2
are
p * 130 lb/ft3
Y - 3400 psi
Rock quality designation (R(D) w 100
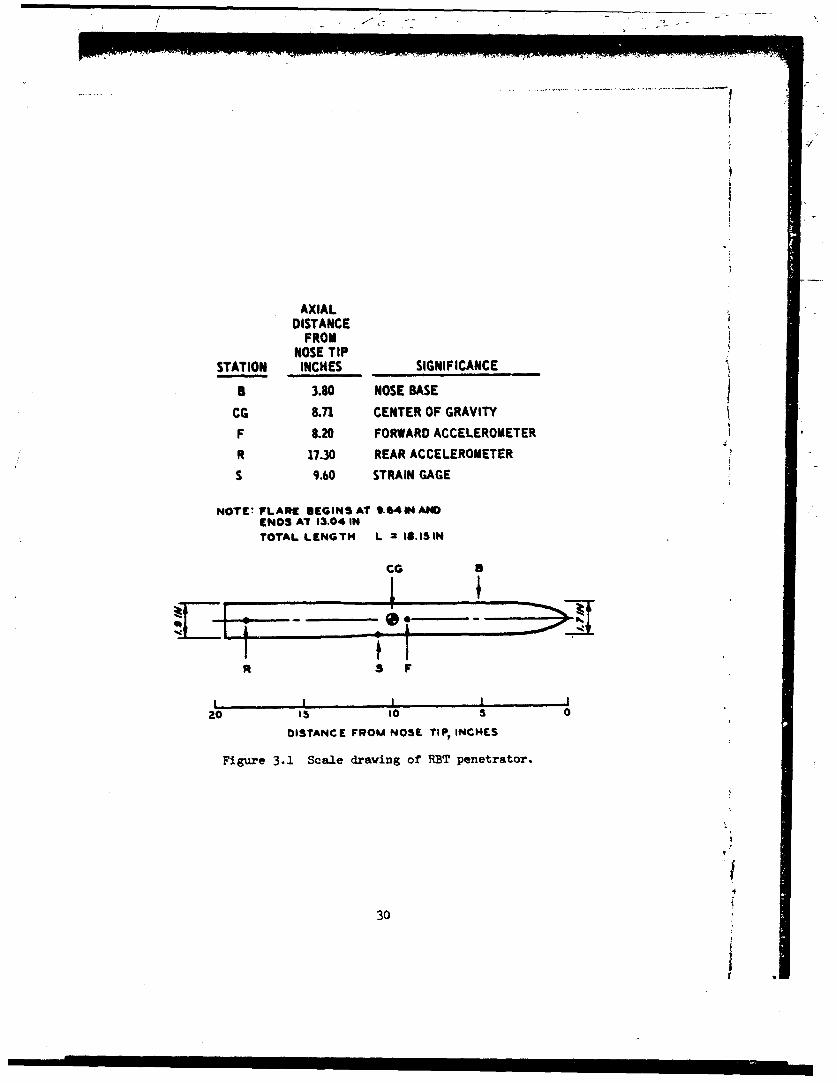
A scale drawing of the projectile Is shown In Fig•tre 3.1; the projectile
parameters are'
Length (L) - 18•.19 Ia
Weight (W) - (•. 48 l1b
Diameter (D) - 1.9 In
Caliber radlun head (CRH) w 6.0O (beveled tip)
r " .X1.Q Ib-in
For each caae, the load dt atribut, iont on the projIect le, calculated
using the P NCO0;1 computer code (with output moditfioation..), have been
used an Input to a daynmilc ,truottural-response code (W1AMI1) by
T. Ilelytschko.3 lT'redIottoun were generated for acceleromter Rtid .train-
gage outputs, aamplen of whtich are compared with tesit resu lts in
Figures 3..' through 4.7. In the WHAKS ai.culat, ionu, the nceierometprs
indicated In Ft lgre, 3.; and .. 3 were located on the ax Ir, 16.3', 16. In
from the nose tip. The .itrainn gng was on the out.itIde
"The units naowaa were cahosaena for convente n'e of expw',e.ijoin. I oal -culations they must be oonvert.ed to a iompntlble .ayst m (0'.g.1, r ugs, *feet, seconds,).Pernonal oonmaun I latt ton, r'ceivedl •anrch IaQT, tfrom T. Velyt..ehko, Inc.,Chicago, IllT., to R. Blernard , Geomeohannitos Dvi .ota, Utl. alte trrlaboratory. a
2. I•
I
bottom (w - w), 9.6 inches from the nose tip.
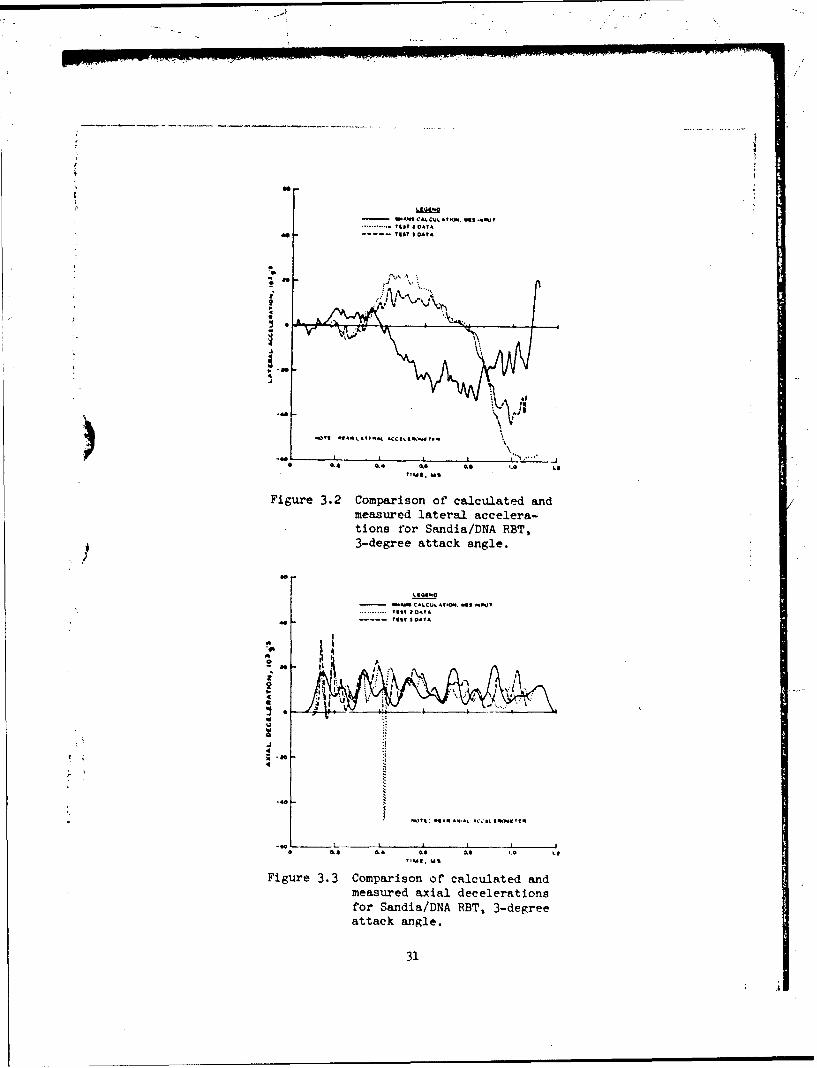
For the 3-degree attack angle calculation, there is clearly a
phase difference between the calculated and measured lateral accelera-
tions (Figure 3.2), the cause of which is not yet understood. Also, the
initial positive peaks in the calculated results are somewhat low, but
the later negative peaks are in fair agreement with the test data.
Better agreement exists for the axial decelerations (Figure 3.3). Fair
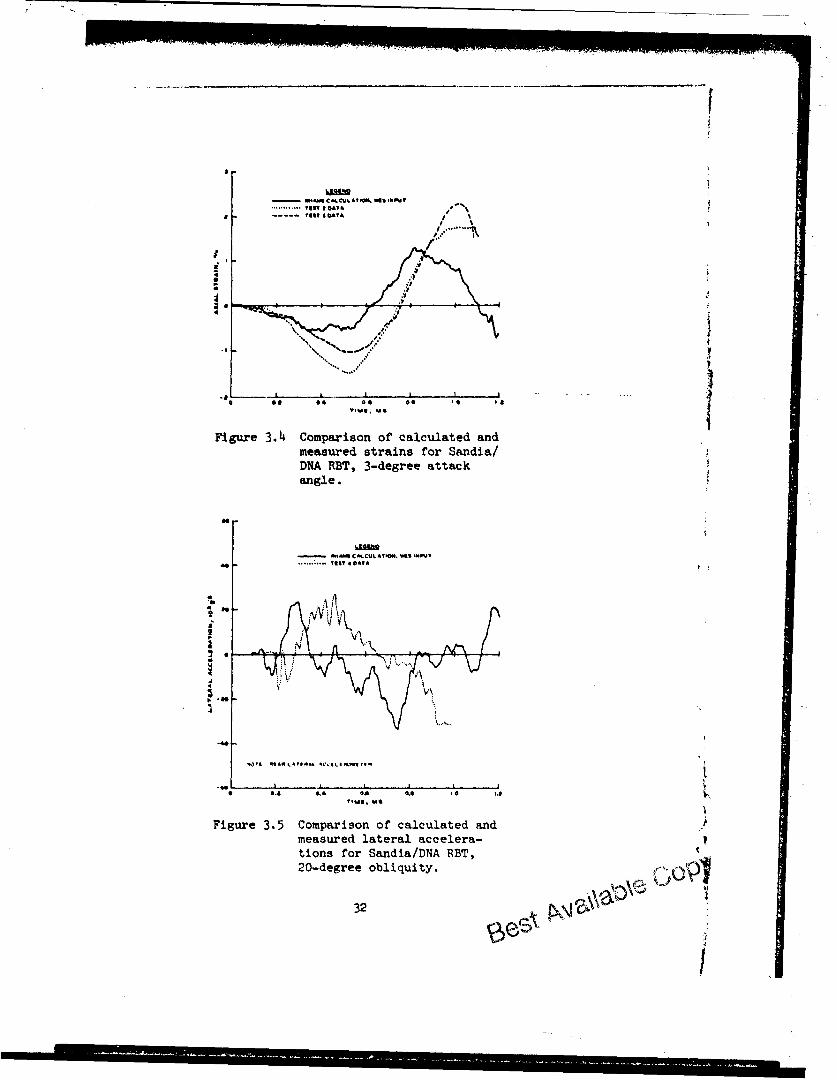
agreement is obtained for the strain gage output (Figure 3.4), although
the initial negative strains are somewhat underpredicted.
For the 20-degree obliquity calculation, the calculated results are
in much better agreement with the test data (Figures 3.5 through 3.7),
although the phase-difference problem is still apparent in the lateral
acceleration (Figure 3.5) data and the strain gage output (Figure 3.7).
In using the rENCO2D computer code to generate the input for
Belytschko's WIAMS calculations, the free-surface parameter was set at
k - 8 , and the wake separation angle was set at *min a 0 . Thlese
values were chosen after examining the effect of varying k and 0min
in WES predictions for total lateral force and pitch moment (Figures
3.8 through 3.13). The value k = 8 is reasonable in light of pene-
tration-crater measurements in sandstone (Reference 9), and the n 0
value is reasonable, since the wake separation angle should be small in
hard targets.
In order to examine the effects of attack angle and obliquity on
lateral load and pitch moment in the WLE3 theory, a series of calculations
has been made using the 3- and 20-degree RST's as baseline cases. The
results are shown in detail in Figures 3.14 throut-,h 3.17 antd summarired
in Figures 3.18 and 3.19. A similar series of' calculatlon, was made,
varying the target strength for the 3-degree Ri1T. T'he results, shown
in Figures 3.20 and 3.21, indicate that the tNi tinI peaks in the lateral
force (at 0.12 ms) are much more dependent on strr'i-tfh than arc the
later peaks (at 0.7 to 0.8 ms). The reason for the similarity in the
Variation of k has no discernible effect on the 3-degree rPTcalculation.
25
later peaks can be seen by examination of the lateral force distribution
(per unit length) at 0.7 me (Figure 3.22). The amplitude of the force
distribution is a strong function of the strength, but the positive and
negative contributions are such that there is little difference in the
net lateral force at 0.7 me.
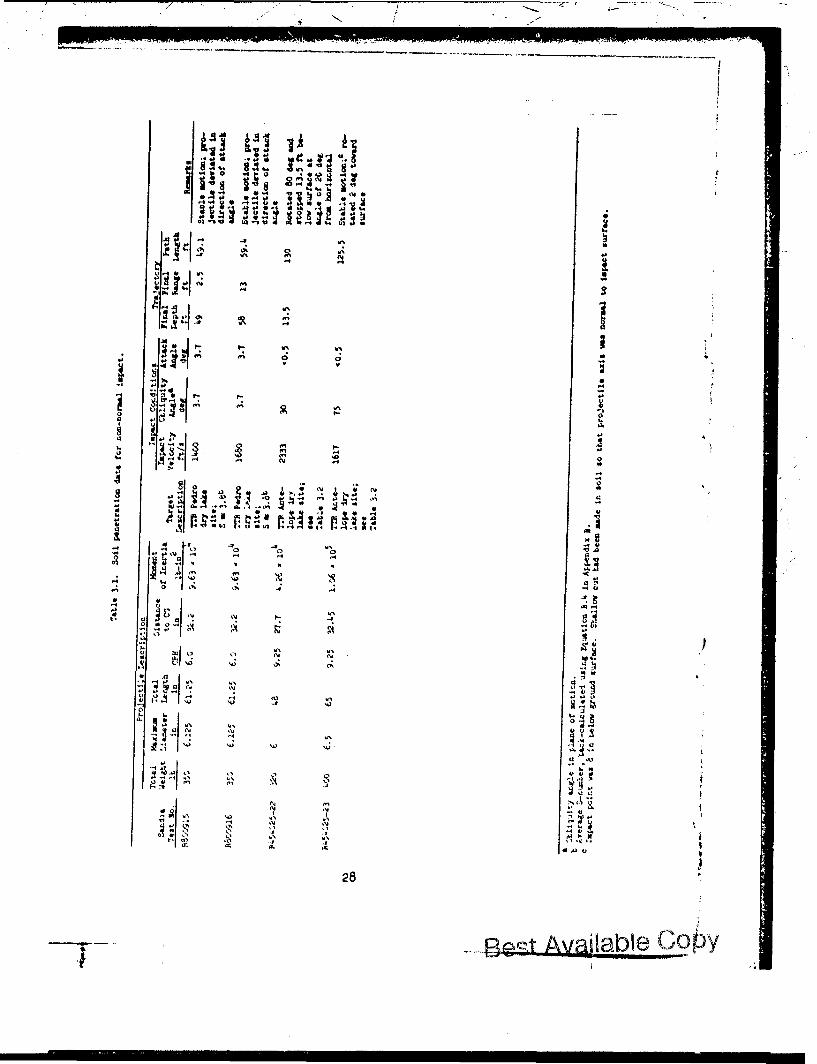
3.3 FULL-SCALE PENETRATION TESTS IN SOIL
Sandia Laboratories has conducted at least four full-scale soil
penetration tests that are suitable as benchmarks for the WES 2-D pene-
tration theory. Two of these tests, Nos. R800915 and R800916 (Refer-
ence 13), were conducted in the Pedro dry lake site on Tonopah Test
Range (TTR). The other tests, Nos. R454025-22 and R454025-23 (Refer-
ence 14), took place in the Antelope dry lake site on TTR. Pertinent
information for all four teats is summarized in Table 3.1, and Young's
S-number profile (Reference l4) for the Antelope site is given in
Table 3.2.
Using the information given in Tables 3.1 and 3.2 as input,
calculations have been made for the penetrator trajectories. The re-
stilts are compared with the Sandia test data in Figures 3.23 through
3.27.
Calculations for tests R800915 and R800916, presented respectively
in FIgures 3.23 and 3.211, show the effects of varying the wake separa-
tion angle. Here the expetimental results are inconsistent. The tests
were identical except for a 20 percent difference In impact velocity,
yet there was a 500 percent difference in lateral (horizontal) displace-
ment.5 One of the reasons for the discrepancy may have been a differ-
ence In the amount of wake separation In the two tests. Separation
alone, however, Is not enough to account for the difference, since even
the calculatlon for #min * 0 predicts 8 feet of lateral displacement
for test R800015. Tn these caculations the free-surface parameter was
5 The average vertical penetration resistance apparently was the same,because the depths can be calculated with same S-number.
26
set at k = 0 , due to its lack of influence on near-vertical impact
problems.
Test R454025-23 is a good example for assessing the effects of the
free-surface parameter independent of the wake separation angle effects.
Here the initial obliquity is large, and k and 4min both influence
the Qalculated trajectory (Figures 3.25 and 3.26). For this test the
best simulation of the observed trajectory is obtained for k = 4 and
imin = 0.6 Nevertheless, it is clear from the calculations that thewake separation angle has a much stronger influence than the free-
surface parameter, even for large obliquity.
Test R454025-22 was conducted with a shorter projectile (L/D - 8)
than the other three tests (L/D - 10). In this case, the penetrator
impacted at 30 degrees and rotated 80 degrees before coming to rest 13.5
feet below the target surface. With the free-surface parameter set at
k a 4 , calculations made for different values of the wake separation
angle (Figure 3.27) indicate that a value of *min = 4 degrees best
reproduces the observed final position of the penetrator.
In other (normal impact) tests7 in the Antelope site, Sandia has
found L/D = 10 to be significantly more stable than L/D - 8 (Refer-
ence 14). For comparison of the two projectiles in this study, calcula-
tions were made for the shorter projectile (from test R454025-22) using
the S-number and impact conditions of test R800916, setting k = 0 , and
varying *min * The results (Figures 3.28-3.31) indicate that the
stability of either projectile is strongly dependent on the value
selected for the wake separation angle.
6 To simulate the test conditions (Table 3.1), the calculation was
started with the nose tip at Z = 8 inches0 = 2 degrees, a < 0.5 degrees.
27
4 '-
I -
I -'
pI j� � .4v'� *�. �
..4
I�'j ..4 -*
4" "4 .4
"4 44'
0.4444,, .-.144' 1I�.jo� -
44' 44'
.4 � i*
p..
4., 4., 44'
3*. .44, 3.44*4
�** .444., 4.' -4
4., .40
a4- �"I 4-1 344 2.44 4-.
.. .. .4)
S � 4 I� �. � a- ...-. iha * *� - 1.4.4 41 .41.... n £3.4 4; � * �'44a �L. '� �
44�4�JJ . 4
- . '� 'S .40I�'4 -4 -4
* WI'I 0 ' 444-4
-4
. --- '.4 n'� .4.4 4.4 .� )
1I'4 44.4 1044.
'4) 4" 0.4
44' 0.44H 40 .4, .4
'£3 -4 '£3
'£3 '£3 '£3
£3 .0
4:4 42--4 '-4
�444:
"4 '4, I..
44' *.�4) 4'J.4' .4�4 '4
I.. 44)-4 4 �
.4. 44. dM0
28 4.
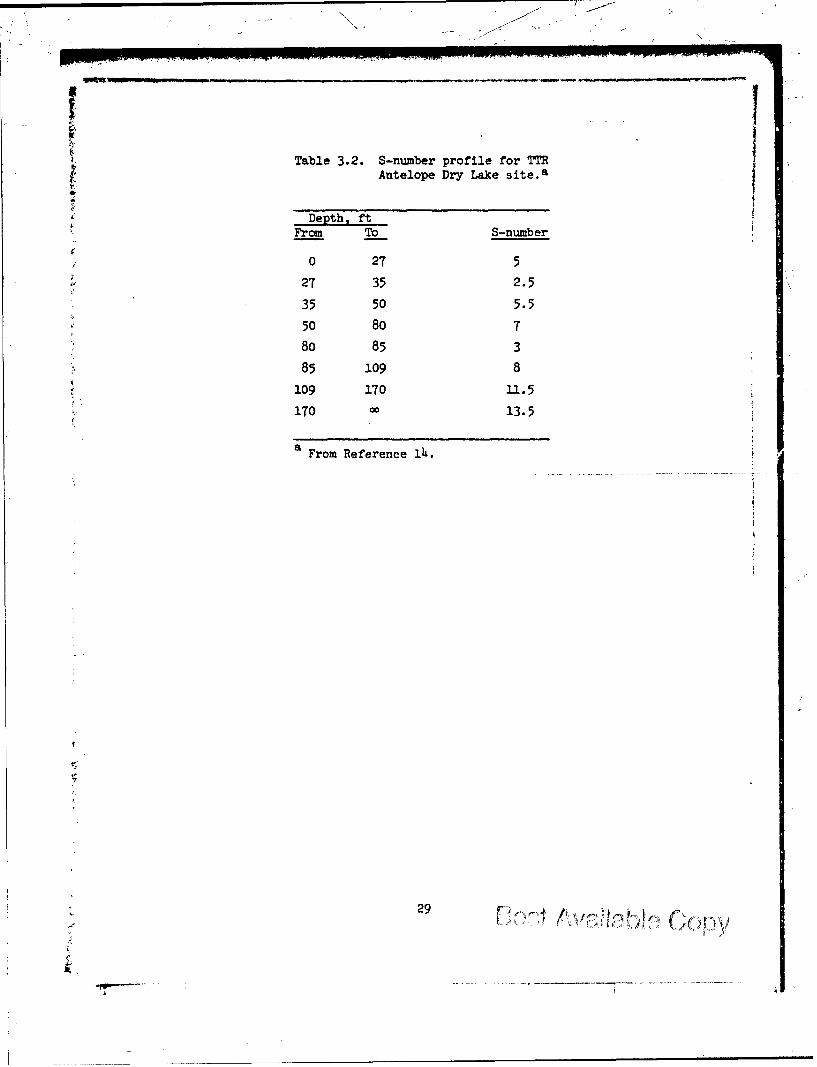
Table 3.2. S-number profile for TTRAntelope Dry Lake site.a
*
Depth, ftFrom To S-number
0 27 5
27 35 2.5
35 50 5.5
50 80 7
80 85 3
85 109 8
109 170 11.5
S170CM 13.5
a From Reference 14.
29 r-i~r- rcy4~ ioly
I
AXIALDISTANCE
FROMNOSE TIP
STATION INCHES SIGNIFICANCE
B 3.80 NOSE BASE
CG 8.11 CENTER OF GRAVITY
F 8.20 FORWARD ACCELEROMETER
R 17.30 REAR ACCELEROMETER
S 9.60 STRAIN GAGE
NOT[E FLARE UEGINS AT .64IN AMNDENDS Al 13.04 INTOTAL LENGTH L 2 I18.I5IN
CG 8
R 3 F
I I I .... I
20 IS 1O 5 0
DISTANCE FROM NOSE TIP, INCHES
Figure 3.1 Scale drawing of RBT penetrator.
4
30'
i ,
........... T4 A &L DATA
TIST IO DAT------ lYv)O.T4
4v
I .-IS
) ,,o~ .t*,•......ctta,,,-r"%\
-444
Figure 3.2 Comparison of calculated andmeasured lateral accelera-tions for Sandia/DNA RBT,3-degree attack angle.
4*
- • a ALCUL At~cO, re *41 . v&fS ........... 111t I co•r.STEST *OA0*
-4.
ai
S14071: *IlAA , tCg l bitT ¢11 8K1IS•I
Q. a a 4 a's .O ,,ýv,•l %
Figure 3.3 Comparison of calculated andmeasured axial decelerationsfor Sandia/DNA RBT, 3-degreeattack angle.
31
mesure stais o Snda
DN - BT 3I-tS5AA atac
anle
Figure 3.54 Comparison of calculated and
mesiedstans for Sandia/DART20DNA r obli3qegreittac
32le
....... *TIST 4 GAT&
* aA
J
*Aai A 6 9
4I I
Fiur 3. oprsoefolua dadmn
0ue strin for GA tlilM IN* .
obliquit oliqity
33
-r,,, TCAL..uaAt'lY C'OVU?)
91016I1SNPWACC PARAMaTER
J0
0 0.2 04 06 @0610 0uIS s
Figure 3.8 Calculated lateral force for different valuesof free-surface parameter,* Sandia/DNA RBT,20-degree obliquity.
PRIER-34,111ACE PARAMETER i
-- 4
-12
0 0.8 0.4 0.0 0.6 1.0 1.2
Time, MS0
Figure 3.9 Calculated pitch moment for different values offree-surface parameter, Sandia/DNA RET, 20-degree obliquity.
334
SWAKE SIEPARATION ANGLE t. QEG
S0". ..... .
-A -- 4
I--0 0
$ U.
o.9 04, o.6 0 10, 1
-rime, M 3
Figure 3.10 Calculated lateral force for different valuesof wake separation angle, Sandia/DNA RBT,20-degree obliquity. ,
10,- WAKE siEPARATiON ANGLE 01"• . 01EG
0
.... o..o.o... 244
8
j3:
U
'--
&
- ,o . .. . .. I, , I
0 0.2 04 0. O'a ,.aTIME. MSFigure 3.11 Calculated pitch moment for different values of
wake separation angle, Sandia/DNA RBT, 20-degree obliquity.
35
*Sow S O L
- 0 .M~
............ 2
a4
ItI
WAKE SEPARATION ANGLE •m O EO
J _- 4
1-S
10
-4 0 L I I . . .. , . . . . .
a a 6 as -. 0
'Time. MS
4 I,
Figure 3.12 Calculated lateral force for different valuesof wake separation angle for Sandia/DNA RBT,3-degree attack angle.
Io WAKE SEPARATION ANGLE DEG
0............... 2
Iz /P " .,
"0 / " ........
I.:
0
-0
i -,oi .. . i
o 0.2 0.4 0.0 0.0 1.0 1.
TIME, MS
Figure 3.13 Calculated pitch moment for different values ofwake separation angle for Sandia/DNA RBT, 3-degree attack angle.
36
c~k
aJ
INITIAL OBLIQUITY ANGLE O,, OEG
' 210
-, I - 4 0Il
04
U
U.
4 0 ......
NO0
0 Oa 04 Os O I0 I2
TIME, MS
Figure 3.14 Calculated lateral force for different valuesof obliquity, Sandia/DNA RBT.
INITIAL, ATACIK ANGLE do . DIG
0
. ... ......
- IQ-oI I1I
T-, II NI S
Figure 3.15 Calculated lateral force for differ-ent values of attack angle, Sandia/DNA RBT.
37
*0 - INITIAL oSLIQUITY ANGLE 9Q .
-......--......
J A
I-
S..D
S~NOTE: •G 0
-go I I II , I
0 0.2 0.4 0.6 0.6 1.o 1.2
TIME, MS
Figure 3.16 Calculated pitch moment for different values ofobliquity, Sandia/DNA RBT.
ooI hINITIAL ATTACK ANGLE a%. OEG
....... I3
7
...... ... ..........i-,
20
U
IL
NOTE: @o0 ao
-io I I I
0 0.2 0.14 0.0 0.3 5.0 1.2
TIME, MS
Figure 3.17 Calculated pitch moment for different values ofattack angle, Sandia/DNA RBT.
38
OMN -on
I Figure 3.18 Variation of maximum
calculated lateral I"rA ATAC AfU Co agload with attack N,-,* AT,*. ANGLO • , 56
angle and obliquity, •Sandia/DNA RBT.
0 I , , I , I
so 50 30 40 so
INITIAL OULIQU.IY ANGLO 0, 0140
; ' INITIAL ArAI 'oL c.N Figure 3.19 Variation of maximum
01
Icalculatedpic
pitch
moment with attackr angle and obliquity,Sandia/DNA RBT.
SI
INITIAL •0 A
39
,,,,I T• ,L .N ig r .9 V r a l n o a i u
TARGET STRENGTH, PSI
...... - 6000
- 6,000
0IL
0
* ~ %.........
a0* 04 0.e ofV1.Time. MS
Figure 3.20 Calculated lateral force for different valuesof target strength, Sandia/DNA RBT, 3-degreeattack angle.
t0
TARGIET STRENGTH, PSI
.................. 2.000
-I $ -¶ .0w0
30
L
-o00 1.2 0 14 0 16 06 ¶a0I 1i
Figure 3.21 Calculated pitch moment for different values of,target strength, Sandia/DNA RBT, 3-degreeattack angle.
4o~hOJ
6s .
ill........ .... L.ow
Figure 3.22 Calculated lateralforce distribution I
for different valuesof target strength, \ IISandia/DNA RBT, 3-degree attack angle.
Mork: IYP 'tD CTLAO .5O
AISTANCEM•.NOO TA Most TY I
ACTUAL TPAJECTOW1
.CALCU..ATtO TRAJItCTO0M&II 6
I Figure 3.23 Effect of wakeseparation"angle *minon calculated-I
S Itrajectories,I e-."... Sandia Test
SI 4 R800915.SI
4 0
14S. , I I ..
NOSYRION*IlL. P•OSITlON, Ir'
k4l
Pm 01"I/lt oTl-V, "WI¢TN 0WI
!-.
ACTUJAL T"JgCT*M- CA.OJLAIUO TRAJECTOMICS. 0.
00 " I "T ' *, I
*me a. ae a a."6O416ftYAL POSITION. IT
Figure 3.24 Effect of wake separationangle Omin on calculatedtrajectories, Sandia Test
o800916.
LEGEND
ACTUAL TRAJECTORYCALCULATED TRAJECTORIES, 0m 0
O 0 =8 II
IL.
go I I I I
-20 0 20 40 60 60 100 Izo 140
HORIZON'TAL POSITION, Fr
Figure 3.25 Effect of free-sutrface parameter k on calculatedtrajectories, Sandia Test R454025-23. • £
4.2
oN,
:ta

CALCULATED OgTRAETORN, k 0
'4-0 * 0 too ISO SO 94 00
HONSIOI.IAL POSITIoN, r?
~~Figure 3.26 Effect of vake separationanl
~~~trajectorieCs, Sandia Test 402W OnCluae
CAL5 LA025 *Q4r022.
143

.a .-.. 4 J
* Cam
048406-M 6 So I
so v._o n
S a
As SO SO
- - 1p I•
""O" '0P6YAU POSIT,*", .?
Figure 3.28 Comparison of calculated tra-jectories for Sandia pene-trators, *mi 1 degree.
.e SO SO
-... .. ,-,,' . ..o•
a
* as
U . , P.,LL, .-
Figure 3.29 Comparison of calculated tra-
jectories for Sandia pene-trators, i n 2 degrees.
.434

f
"" ,. v e .,,T
41
Figue 3 mar of c-O L V, .V , ¶S
Figure 3.30 Comiparison of calculated tra-jectories for Sandia pene-trators, n * 4 degrees.
min
-. , .. /o,'
- s/
* ~I
*0
Figure 3.31 Comparison of" calculated tra-[ jectories for Sandia pene-,, ~trators, *mi a S degrees.
•. I m5
.ICHAPTER 4
PARAMETER STUDY FOR SOIL PENETRATION
4.1 BACKGROUND
The PENCO2D computer code predicts trajectories that seem reasonable
in light of existing non-normal soil penetration data (Chapter 3),
although inconsistencies in the test results leave unresolved the ques-
tion of wake separation and its quantitative effect on stability. Un-
certainties notwithstanding, enough benchmarks do exist so that some
credence can be given to a study of the effects of varying the projectile
parameters, the impact conditions, and the target penetrability.
A baseline projectile, target, and set of impact conditions are
specified in this chapter, and calculations are presented in which indi-
vidual parameters have been varied one at a time. In some cases the
variation of a given quantity independent of other quantities may be un-
realistic in a practical sense (e.g., changing the projectile length
without affecting the moment of inertia). However, the objective in
such instances is to show the influence of a particular parameter in the
calculation itself. In a practical design-parameter study (Section 4.6),
coupled parameters (e.g., weight, length, and mass moment of inertia)
have to be varied together.
24.2 BASELINE CONDITIONS
The projectile chosen for this study is similar to the one used in
Sandia Test R454025-23 (L/D a 8) and represents a marginally stable
design, according to Sandia's experience. The pertinent projectile
quantities are
W a 300 lb
D 6 in
L a 48 in
CRH - 6.0
CG location CCG a 26.4 in from nose tip
246
14 2I u 14 X 10 lb-in
Aftbody taper angle *aft = 0
The baseline impact conditions are
V a 1500 ft/sec0
a 0 -4 degreeso
0e a degrees
The baseline target properties are
S 8
ýmin = 2 degrees
All of the above parameters will be varied except k and min whose
effects have already been demonstrated in Chapter 3. Aside from the
individual quantity or quantities being varied, the input will be the
same as the baseline conditions. 1
Figures 4.1, 4.2, and 4.3 show the trajectory, external forces, and
pitch moment, respectively, calculated for the baseline conditions.
Since the baseline calculation uses a constant wake separation angle
(fmin - 2 degrees), the penetration path is curved, rather than straight,
and there is some residual oscillation in the pitch moment as aftbody
contact alternately increases and decreases.
U. 3 VARIATION OF TARGET PENETRABILITYAND IMPACT CONDITIONS
Figure 4.4 indicates the degree to which the target S-number in-
fluences the trajectory. The main effect seems to be an increase in
the total path length with increasing S . Although the horizontal dis-
placement increases with S , there seems to be little variation in the
The baseline calculation will appear in all comparisons of trajectories
except Figure 4.7, and will be represented by a solid curve (e.g.,Figure 4.1).
47
°.t
overall path shape. The same thing can be said for the impact velocity
(Figure 4.5).
The initial attack angle has a mild effect on the trajectory (Fig-
ure 4.6), aside from a marked increase in path curvature and horizontal
displacement between 0 and 2 degrees. The 0-degree case goes straight
in because there is no angle of attack (or obliquity) to initiate rota-
tion. Large obliquities (a° U 0, e0 z 60 degrees) can produce ricochet
(Figure 4.7), although lesser obliquities seem to have a gentle effect
on path curvature.2
4 .4 INDEPENDENT VARIATION OF PROJECTILEPARAMETERS FOR STRAIGHT AFTBODY
Figures 4.8, 4.9, and 4.10 show the effects of varying the weight,
diameter, and nose shape, respectively. Treated as independent param-
eters, none of these variables has much effect other than changing the
path length. The horizontal displacement increases with path length,
but the shape of the trajectory changes only slightly.
It might be argued that the mass moment of inertia alone should
have a big influence on the trajectory. This is not the case, however,
as can be seen in Figure 4.11. Although the mass moment of inertia has
a moderately stabilizing effect, it is overshadowed by aftbody separation,
which allows the projectile to rotate with little opposition during most
of the event (see Figure 4.3).
Figure 4.12 shows the consequences of treating the projectile length
as an independent parameter, keeping the geometric position of the CG
constant (CCG/L - 0.55). A reduction in projectile length has a stabi-
lizing effect, due to reductions in the moment arm and the total (lateral)
loaded area on either side of the CG. This is the least realistic of
all the foregoing trajectory comparisons because a physical change in
length changes all other parameters (Section 4.6).
The most important single parameter is the geometric CG location
The initial obliquity required for ricochet would be smaller if a
larger value has been chosen for ýmin
48
I J~eI
CCG/L , as is indicated in Figure 4.13. If the CG is far enough forward
(CcG/L = 0.45), the negative moment (after CG entry into the target)
outweighs the initial positive moment, and a rotation reversal occurs.
If the CG is far enough aft ({cG/L = 0.65), the initial positive moment
is so great that the projectile ends up going sideways.
4.5 VARIATION OF AFTBODY FLARE
Figure 4.14 shows trajectories calculated for different values of
the aftbody flare angle *aft * In each calculation the aftbody merges
with the ogive nose section at the point of tangency, where n =aft
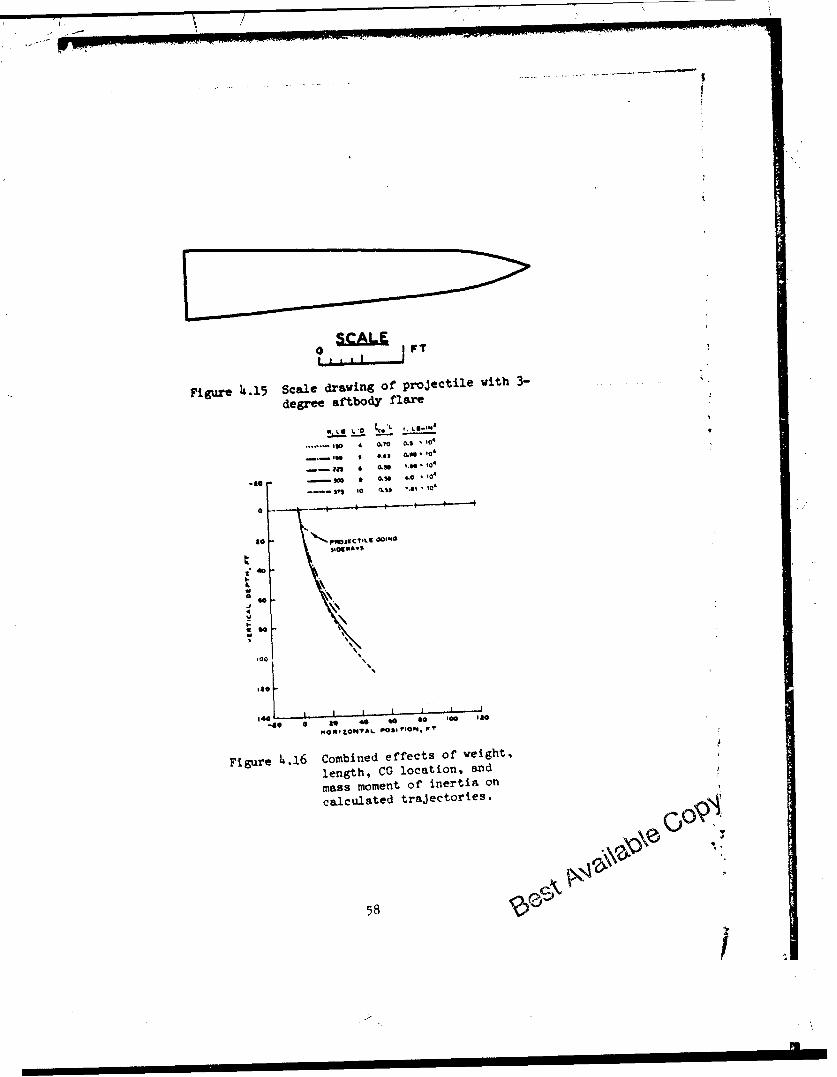
An illustration for *aft = 3 degrees is shown in Figure 4.15.
If *aft = *min , there is no loss of contact with the target, andthe penetrator goes almost straight in. On the other hand, if
0 < aft < ,min ' the trajectory is straighter than the baseline case
(straight aftbody, *aft= 0) but it is still noticeably curved. Flare
angles greater than Omin reduce the final depth, due to increased base
diameter (decreased W/A).
From this comparison, the optimum flare angle appears to be a value
less than the wake separation angle, producing a slightly curved trajec-
tory but leaving the depth essentially unaffected. The flare must be
installed without shifting the CG toward the tail.
4.6 VARIATION OF COUPLED PROJECTILE PARAMETERS
The projectile parameters that were varied independently in Sec-
tion 4.4 are coupled to one another in practice. As far as stability is
concerned, the most important coupling occurs among weight, length, CG
location, and mass moment of inertia. A serious parameter study should
consider the simultaneous variation of these quantities.
A simple but fairly realistic way of accounting for the change in
W , CG ' and I with L is to add or subtract cylindrical aftbody
sections of constant linear density3 from the baseline projectile, while
Constant weight/unit length = 300 lb/48 in = 6.25 lb/in.
49
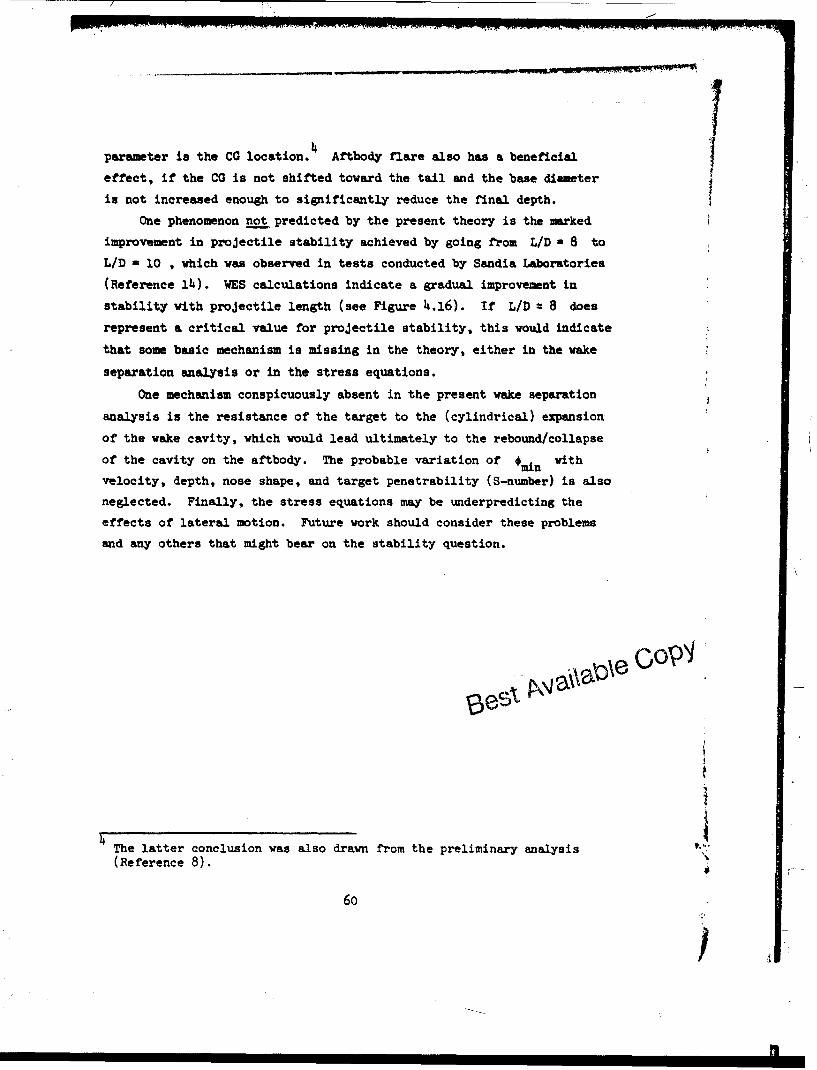
asauming I W ? Figure 4.16 shows trajectories for projectiles
whose properties were varied in this way.
According to the calculations, if the projectile is short enough
(L/D < 5), the CG wll lie in an unstable position, ultimately producing
sideways motion. Otherwise, the effect of the changing parameters is
little more than an increase in path length with projectile length.
141
See also Figure 4.13.
50
S~ '~ "

/
-ai.
I0
a.0
V, - Iw o"11S
541E
to..
IS L.O •
|00
140 I I I I-so 0 0 to 44 40 IGO in0
4II00IZONTAL POSITION, PT
Figure 4.1 Calculated trajectory forbace ine conditions.
I I iS0 40 t0 IO SoO 140 I0O
TieI, Me
Figure 4.2 Calculated external forces for baselineconditions.
51
i
I-
-00 fOI I % -. q I-I
-- !
Figure 4.4 Effect of sol pntnbli
P:L~~~uo calCi culated p~c trnjecYt ot* tien. t
5P.. . A A
to
J " \
14 . .. L ..... J . . L I .. l I"40 0 00 4S4 44 00 00 00
Figure },Ji Effect of soil penetrabilityon calculated traJectorien.
5;,
____ ____ __ /
/k
II
MIAC? 'lLOCIl'Y V' P11S
-- I000SO-
40
J
too N,
10%
I* *o
-40 .I 1L.
-10 0 *6 dO 00 *0 loG lao
MOU•OA014AL POSITION, FT
Figure 4.5 Effect of impact velocity oncalculated trajectories.
INITIAL A'GL1 OF AtA< 1 O.EO
-4
o~~~~~~o ... a• t •.---
000
-10 0 *0 40 0 s too IS *OIAOPZONTAL. 002I'ON. PT
Figure 4.6 Effect of attack angle oncalculated trajectories.
53

INITIAL. AN .4[ 09 O .1LIQIJTv 1, 010
"o i \ ...\ . .. ...... ..-(0
z'o
a so
14
wN
ROTLE %* O
-to
•40 I I I,
Figure 24.7 Effect of obliquity on calcu-lated trajectories.
PUOJE[CTILIr OfIN IItl
0"
som0
I-*
"'-S
.50 • io 40 a0 so ice 81o
MMI01ZONtTAL. "OSIIONI, Vf
Figure 4.8 Effect of projectile weighton calculated trajectories.
*5)4
~!
,~5 , - .. . .. .. .. t,\e . '..
* tor• ~ ~PNOJV[CILE 0ODME1UR[ 0. I N
*10 • 6.0
40100
SI O
U4,SV
i
S•~40 I I I I I10 0 so 40 80 s0 too IS0
""ONRIZONTAL POSITION, PT
Figure 4,.9 Effect of projectile diameteron calculated trajectories.
IOJrECTILI NOSI SI4APZ. CM4
...... .. ... 1.2s
--- 2.20
6.0
00
040
o-
ISO
140-10 00 o0 00 I&0
MORPIZONTAL PO•ITION, PT
Figure 4.10 Effect of projectile noseshape on calculatedtrajectories.
55
" 8 0 • 4 ' to '
40
Figure 4.21 Effect of projectile massmoment Of inertia on cal- . ......culated trajectories.
GL l dr = 149 III • 141. , O. C "C . "[ M ra *'40
It
9..
~\ /
'40
- '3.I, * , A . 0 O * g l e, 0 'Fig-are .12 Effetect o f P roject ile ngth
eter) oWen ccuiatea octe.trajectories.
56
~~O~ g ?I L * 0'It I. C E W U~ M k ~ /l
I II III I III lllll lll 14 I 'L a i 0,i iiiilli1 II
01$YANCE[ FRM0, NOSETIP TO CO Ce., I,'
21.A 0.a524.0 0.30
-a. .8 0DA031.2 0.5*
FO PROJECTILE GOING 3SOEWAYS
i i "-,£40IL
a tES.j
100
Itol
-Ito 0 LO O so so too IIO,45ORIZONTAL POSITION, FT
Figure 4.13 Effect of CG location on"calculated trajectories.
APTSOOVY FLAtE ANGLE #,t . DIE
............
-o -;
<&
IL
0.5J
4,
* 100
Izo NOTE: * 2 DEG
"140 I I I I I-- o o 20 Ao so So 00 fo
HORIZONTAL POsITION, F'T1
Figure 4.14 Effect of aftbody flare on
calculated trajectories.
0-
57
-~ IF-
0 I FT0 -A
Figure 4.15 Scale drawing of projectile with 3-
degree aftbody flare
!. +1 I 'D •e I , LlU.S41
• i 4ll l 0.71 0.i O .10
23 • ,9 9 0 1.6. * 104
-in • 0 0.56 4.0 104
- 37 0 % ,I
-Il
40
.009
I I I I -J
144-o0 0 a t 66 4 0 .0 0
PIUI ONL0S,?I"OV. P,
Figure 4.16 Combined effects of weight,
length, CG location, and
mass moment of inertia on
calculated trajectories.
58
.>I

CHAPTER 5
CONCLUSIONS
An empirical theory has been developed for analyzing impact and
penetration in soil and rock. Calculations with this theory reproduce
penetration data for normal impact at least as well as other empirical
analyses (e.g., Young's equation). The extension from one- to two-
dimensional motion was obtained by extrapolation, with simple models
postulated for the free-surface and wake separation effects. The entire
non-normal analysis was then incorporated into the PENCO2D computer code.
Benchmarks for the theory consist of strain and acceleration data from
RBT's in sandstone, and trajectory data from conventional penetration
tests into soil.1Projectile acceleration and strain predictions, generated from WES-
calculated external loads, agree fairly well with the RBT data. There is,
however, a tendency to underpredict the lateral loads for yawed impact
somewhat. There is also an unexplained phase difference between the cal-
culated and observed lateral accelerations for both yawed and non-yawed
oblique impact. On the other hand, the calculated variations of maximum
lateral force and pitch moment with initial obliquity and attack angle
are quite reasonable (essentially linear). In any case, the recommended
values for the wake separation angle and free-surface parameter, respec-
tively, are #rin = 0 and k - 8 for rock and rocklike materials. 2
Comparisons of calculated and observed penetrator trajectories in
soil are inconclusive, since the test data are not consistent. Concern-
ing terradynamic stability, however, the most important target parameter
is the wake separation angle,3 whereas the most important projectile
WHAMS code (dynamic structural response) calculations made by2 T. Belytschko, with PENC02D calculations as input.
These values gave reasonable external load predictions for the RBT's.At this point, it is impossible to specify the most likely values ofthe free-surface parameter and the wake separation angle. A reasonableguess for the respective ranges of values, however, is 0 < k < 3and 0 < min <8 degrees
59
parameter is the CG location. Aftbody flare also has a beneficial
effect, if the CG is not shifted toward the tail and the base diameter
is not increased enough to significantly reduce the final depth.
One phenomenon not predicted by the present theory is the marked
improvement in projectile stability achieved by going from LID a 8 to
L/D a 10 , which was observed in tests conducted by Sandia Laboratories
(Reference 14). WES calculations indicate a gradual improvement in
stability with projectile length (see Figure 4.16). If LID a 8 does
represent a critical value for projectile stability, this would indicate
that some basic mechanism is missing in the theory, either in the wake
separation analysis or in the stress equations.
One mechanism conspicuously absent in the present wake separation
analysis is the resistance of the target to the (cylindrical) expansion
of the wake cavity, which would lead ultimately to the rebound/collapse
of the cavity on the aftbody. The probable variation of min with
velocity, depth, nose shape, and target penetrability (S-number) is also
neglected. Finally, the stress equations may be underpredicting the
effects of lateral motion. Future work should consider these problems
and any others that might bear on the stability question.
The latter conclusion was also drawn from the preliminary analysis(Reference 8).
60
l I ~i l
//
REFERENCES
1. C. W. Young; "The Development of Empirical Equations for Pre-dicting Depth of an Earth-Penetrating Projectile"; Development ReportNo. SC-DR-67-60, May 1967; Sandia Laboratories, Albuquerque, N. M.
2. C. W. Young; "Depth Prediction for Earth-Penetrating Projec-tiles"; Journal, Soil Mechanics and Foundations Division, AmericanSociety of Civil Engineers, Vol 95, No. SM3, May 1969; pp 803-817.
3. C. W. Young; "Empirical Equations for Predicting PenetrationPerformance in Layered Earth Materials for Complex Penetrator Configura-tions"; Development Report No. SC-DR-72-0523, Dec 1972; Sandia Labora-tories, Albuquerque, N. M.
Z4. R. S. Bernard; "Depth and Motion Prediction for Earth Penetra-tors"; Technical Report S-78-4, Jun 1978; U. S. Army Engineer WaterwaysExperiment Station, CE, Vicksburg, Miss.
5. R. S. Bernard and D. C. Creighton; "Non-Normal Impact andPenetration: Analysis for Hard Targets and Small Angles of Attack";Technical Report S-78-14, Sep 1978; U. S. Army Engineer WaterwaysExperiment Station, CE, Vicksburg, Miss.
6. Y. M. Ito and others; "Analysis of 0.284-Scale RBT for 30Yawed Impact"; Informal Report, Contract DNA 001-76-C-0383, Oct 1978;California Research and Technology, Inc., Woodland Hills, Calif.
7. D. Henderson and E. J. Giara, Jr.; "Earth' Penetrator TechnologyProgram"; Draft Report DNA 4571, Jan 1978; Avco Systems Division,Wilmington, Mass.
8. R. S. Bernard; "Earth-Penetrator Trajectories in Soil: Prelimi-nary Analysis and Parameter Study"; Letter Report to Defense NuclearAgency, Oct 1978; U. S. Army Engineer Waterways Experiment Station, CE,Vicksburg, Miss.
9. C. W. Livingston and F. L. Smith; "Bomb Penetration Project";Apr 1951; Colorado School of Mines and Research Foundation, Inc.,Golden, Colo.
10. W. R. Kampfe; "DNA 1/3-Scale Pershing Penetrator Tests";Letter Report to Defense Nuclear Agency dated Oct 1977; Sandia Labora-tories, Albuquerque, N. M.
11. D. C. Creighton; "Correlation of Reverse Ballistic Test Data";Letter Report to Defense Nuclear Agency, Dec 1977; U. S. Army EngineerWaterways Experiment Station, CE, Vicksburg, Miss.
12. D. C. Creighton; "Correlation of Additional Reverse BallisticTest Data"; Letter Report to Defense Nuclear Agency, Aug 1978; U. S.Army Engineer Waterways Experiment Station, CE, Vicksburg, Miss.
13. C. W. Young; "Results of December 1977 Davis Gun Tests at TTR";Memorandum dated 13 Jan 1978; Sandia Laboratories, Albuquerque, N. M.
61
.714. C. W. Young; "Status Report on High Velocity Penetration
Program"; Report No. SAND 76-0291, Sep 1976; Sandia Laboratories,Albuquerque, N. M.
15. R. S. Bernard and S. V. Hanagud; "Development of a ProjectilePenetration Theory, Report 1"; Technical Report S-75-9, Jun 1975; U. S.Army Engineer Waterways Experiment Station, CE, Vicksburg, Miss.
16. R. S. Bernard; "Development of a Projectile Penetration Theory,Report 2"; Technical Report S-75-9, Feb 1976; U. S. Army Engineer Water-ways Experiment Station, CE, Vicksburg, Miss.
17. R. S. Bernard and D. C. Creighton; "Projectile Penetration inEarth Materials: Theory and Computer Analysis"; Technical ReportS-76-13, Nov 1976; U. S. Army Engineer Waterways Experiment Station, CE,Vicksburg, Miss.
18. J. A. Canfield and I. G. Clator; "Development of a Scaling Lawand Techniques to Investigate Penetration in Concrete"; Technical Report2057, Aug 1966; U. S. Naval Weapons Laboratory, Dahlgren, Va.
19. W. J. Patterson, Sandia Laboratories, Albuquerque, N. M.,Untitled Letter Report to: R. S. Bernard, Soil Dynamics Division, U. S.Army Engineer Waterways Experiment Station, CE, Vicksburg, Miss.;26 Aug 1976.
20. D. U. Deere; "Technical Description of Rock Cores for Engineer-ing Purposes"; Rock Mechanics and Engineering Geology, 1964, Vol. 1,No. 1, pp 16-22; International Society of Rock Mechanics, Springer-Verlag, N. Y.
21. D. J. Dunn; "Bomb Penetration of Earth-Covered ConcreteTargets"; Proceedings of the Seminar on the Attack of Earth, Stone, andConcrete Barriers by HE Projectiles (15-16 May 1974), Part 1, ReportBRL-R-1872, Apr 1976; U. S. Ballistic Research Laboratories, AberdeenProving Ground, Md.
22. R. S. Bernard; "'Empirical Analysis of Projectile Penetrationin Rock"; Miscellaneous Paper S-77-16, Nov 1977; U. S. Army EngineerWaterways Experiment Station, CE, Vicksburg, Miss.
23. W. J. Patterson; "Projectile Penetration of In Situ Pick";Report No. SLA-73-9831, Nov 1973; Sandia Laboratories, Albuquerque, N. M.
24. S. W. Butters and others; "Field, Laboratory and ModelingStudies on Mount Helen Welded Tuff for Earth Penetrator Test Evaluation";Report No. TR 75-9, Aug 1976; Terra Tek, Inc., Salt Lake City, Utah.
25. D. K. Butler and others; "Constitutive Property Investigationsin Support of Full-Scale Penetration Tests in Dakota Sandstone, SanYsidro, New Mexico"; Technical Report S-77-3, Apr 1977; U. S. ArmyEngineer Waterways Experiment Station, CE, Vicksburg, Miss.
26. W. J. Patterson; "Physical Properties and Classification ofSeven Types of Rock Targets"; Report No. SC-TM-68-621, Sep 1968; SandiaLaboratories, Albuquerque, N. M.
62
S..... ............ . . .. G O
27. C. W. Young and G. M. Ozanne; "Compilation of Low VelocityPenetration Data"; Report No. SC-RR-306A, Jun 1966; Sandia Laboratories,Albuquerque, N. M.
63
k'
APPENDIX A
PENETRATION THEORY FOR ROCK AND CONCRETE
A.1 EMPIRICAL THEORY FOR NORMAL IMPACT
Early penetration analyses at WES (References 15 through 17) relied
heavily on the Cavity Expansion Theory (CET), whereby the coefficients
a and b and the function f(V) in the resisting stress
a = a + b f(V) (A.1)
could be obtained explicitly in terms of the density, strength, and
elastic moduli of the target. Examination of penetration data from
several sources, however, has failed to show a consistent correlation
between penetrability and standard engineering properties, especially
for soil. Although the most consistently accurate predictions have
been obtained for concrete, additional factors such as aggregate size
may overshadow elastic effects.
In the long run, a "fundamental" theory like the CET requires
empirical modification in order to be of general use as a predictive
tool. An empirical approach from the outset seems better, thus keeping
the functional relations among the parameters as simple as possible.
For concrete and rock, a stress equation of the form
a = a + bV (A.2)
does seem adequate for correlating penetration data obtained with a
given projectile/target combination. In general, however, the coeffi-
cients a and b will vary with the characteristics of the projectile
and the target. Based on penetration tests in concrete (Reference 18)
and intact rock (Reference 19), the following empirical formula is pro-
posed for the stress distribution on the projectile1
All dimensional quantities must be expressed in compatible units;
e.g., slugs, feet, and seconds.
65_
Z4OT
OY + 3VV-p) wrain(.3
Relating Equation A,3 to A.2, it in clear that a a 6.328 Y ioiITand that b a 14.7i46 /pY -in n . When Equation A.3 in subntituted into
Equationto 02.4, and '.8, the equation of motion (Equation P.10, 0 - 0)
for a fully embedded projectile become-i
N 4Y +~ W4v7) (A.4~)re"
where D In the maximum diameter and N IIl the none performance
coefficient In rock and concrete, given for ogives by
r, i il . ]I/i,
N o.863 LRil1 (A.5)
#%nt| for coneri by
N -re ,0.-- (A. ()
with ni repreiet.titig the cone hl f-nnmgle nnd ('Ilii reprenent. ig the
rmdiua of curvitture of the ta'ngent ogive in enlib ers (multiplen of P).
1isrepgnrding the changing croton seetion during thi nolte-emhetment
proeen, the, "i al-depth soluth Ion to EqwIit ion A.) i In
iiN Mi Iv ~ ri- Nmax * ."� " ,1 - In 1 + V (A.')
whrre V ino iio Im1, t'. velovity.0
Tt aiddIt, It e to the parame•f•ern iven In II ' Fu'.i ,n A.7, thrert I1" nt.
Scan:t, on" mere, par lte,.,,r t~hat. lf~l izn't '�e prti trabi ]i ty. Iin "'ok t hi :
(l•ut.it.y In the Nlook uin lit.y P•en I 'tioh (03,11)), t.ro th',d by POvert,
(leferelnc e 20). "hi, 8Ii , an I :iderx for t.he Ierrrv- or in stltm fr'itot.m-itin

in a given site, is obtained using a modified core-logging procedure:
All solid pieces of core that are 4 inches long orlonger are added up, and this length is called the mod-ified core recovery. The modified core recovery is di-vided by the total length of core run, and the quotientmultiplied by 100 percent is the value of the RQD.
In concrete, the maximum size of coarse aggregate D apparently has aagmild effect on penetrability (Reference 21), via the ratio Dag/D .
Letting Y represent the intact unconfined strength for rock and
concrete, the effective strengths for penetration can be calculated from
. Y" O (A.8)
( ) Y " 2 (A.9)
Thus, to calculate penetration in less-than-intact rock (RQD < 100), the
quantity Yr should replace Y in Equations A.3, A.4, A.7, and 2.12.
Likewise, when the maximum aggregate size is specified for a given
concrete, Y should replace Y in the same equations. 2
cFigure A.1 shows a comparison of Equation A.7 with nondimension-
alized penetration data for rock and concrete. The concrete data were
obtained for a case in which D/Dag = 3 ; i.e., Yc = Y . Primarily,
the figure shows the degree to which Equation A.7 is able to collapse
the data to a single curve. There is some residual scatter, but this
correlation represents an improvement over previous attempts (Referencesand 22).3' TabTle A.1 presents the data in dimensional form, whereas
Table A.2 gives the target properties and projectile parameters.
A.2 EXTRAPOLATION TO NON-NORMAL IMPACT
Equation A.3 was obtained by starting with Equation A.2 and
In structural concrete, Dag usually varies from 0.75 to 1.5 inches.
3 The RQD is always assumed to be 100 for concrete.The improvement comes from the addition of a nose-shape effect and thereduction of the RQD effect initially used in References 4 and 22.
67
, ...i
/,I
adjusting coefficients until a good data fit was achieved for combined
rock and concrete penetration data (Figure A.1) taken from References
18, 19, and 23. Previous experience with these materials had shown
that a and b should be proportional to Y and 4P? , respectively;
the Tan-n-proportionality (nose-shape effect) was drawn from Young's
observations of soil penetration and was presumed to hold true for
harder targets. With the addition of the RQD effect on the apparent
strength, the correlation shown in Figure A.1 was achieved.
The form of Equation A.3 is such that it can readily be extrapo-
lated to the case of nonax~al motion. Recognizing that for axial
motion
Vsin n - (Aa.1)
V
where Vn = component of V normal to projectile surface, it is reason-
able to replace V and V , respectively, by the local velocity vfl5and its normal component vn . Thus, for 2- or 3-dimensional motion,
the expression for the compressive normal stress on the projectile
surface is
o = 1.582 (4Y + 3v÷ /) 1 J1 (A.11)
where
v a absolute local velocity relative to fixed target
vm = compopent of. v normal- te projectIll' surfac "
In order for a stress to act on a given projectile surface element,
there must be contact with the target (Section 2.4) and net motion into
the target (v > 0). Otherwise, it is presumed that a 0n
Additional material property information is given in References 24-26.For purely axial motion, V and Vn are identical with v and vnrespectively. In extrapolating to a local definition of stress fornonaxial motion, the most direct route is to use the local velocity.
68
I /
Table A.1. Penetration data for rock and concrete.
Impact PenetrationVelocity Depth
Test Source Target Material fps in
Canfield and Clator Concrete 1005 8.0Canfield and Clator Concrete 1025 9.0Canfield and Clator Concrete 1250 10.0Canfield and Clator Concrete 1485 14.5Canfield and Clator Concrete 1775 16.5Canfield and Clator Concrete 1975 23.5Canfield and Clator Concrete 2020 19.5Canfield and Clator Concrete 2325 26.0Canfield and Clator Concrete 2350 24.oCanfield and Clator Concrete 2430 27.5Canfield and Clator Concrete 2535 29.0Canfield and Clator Concrete 2655 29.5
Sandia/DNA Welded Tuff 1220 87Sandia/DNA Welded Tuff 1350 102Sandia/DNA Welded Tuff 1560 142Sandia/DNA Welded Tuff 16hO 132Sandia/DNA .. . .... Welded Tuff . 1650 132
Sandia/DNA Sandstone 1455 140
Sandia/DNA Sandstone 1505 146
Sandia No. 120-77 Welded Agglomerate 1065 156
Sandia No. 120-112 Sandstone 824 122
Sandia No. 120-103 Sandstone 880 1 2 0 a
Sandia No. 120-106 Granite 860 150
a In this test the sandstone was covered by 30 inches of soil, so the
total depth of penetration is 150 inches. However, the penetrationresistance of the soil is negligible compared with that of the rock.
69
-- ".. e
/ 3 S ~ GP
C)~Q : CCJ CU 0 -
022
.0
UN ~ U-\ H 4
ft00O0 43 04
t t-- O H 0 ý4 0\ t- ~4-02 4.0
34-413
qu4 4.) Hi
4) -) 4- 02 43 0.)0C.) 4.) *t1 +)
U.4 W m tC-
44~ u iuH~ 434)4
~~~~~i UU*0 cj c~ ~ ') H0
434* 4 0 0~t 0 '\J 0 0 Hl\ 3*
4-.) 43 9 . . . .0
m EH H 00\0 0 c C
04.1 4 )H
000
+- 43
HH 3
0 4 41) 4413 ý
A oCO 00 0 c4.Q4)
HM Hq 1 02(1
00
04- 4) ))
"Ol So
07
ri)

I
LEGEND
SYMBOL TARGET SOURCEOF DATA
0 CONCRETE CANFIELD & CLATORA WELDED TUFF SANDIA/DNA TESTS
o1 SANDSTONE SANOIA/ONA TESTSA WELDED AGGLOMERATE SANDIA TEST NO. 120-77* SANDSTONE SANDIA TEST NO. 120-112* SANDSTONE SANDIA TEST NO. 120- 103V GRANITE SANDIA TEST NO. 120-106
z0o.8 0
0 I
0 2 4. 6 6
V(p/Y)0 5s (100/RQD)
0 `
Figure A.1 Nondimensionalized penetration data for rockand concrete.
71
low

APPENDIX B
PENETRATION THEORY FOR SOIL
B.1 EMPIRICAL THEORY FOR NORMAL IMPACT
To date, Young's equation (References 1-3) has been the most con-
sistently successful formula for calculating penetration depths in soil.
Rather than using standard engineering properties to describe the
target, Young lumps the penetrability into a single empirical variable,
represented by S . In U. S. customary units,1 Young's equation is
0.0031 S N VVA (V - OO) , Vo > 200 ft/s
o.53 3 Ns V_ In (l + 100,000)' V0 < 200 ft/s
where
Z = final depth, ftmax
W = projectile weight, lb
A = 1 = maximum cross-sectional area, sq in
V = impact velocity, ft/s
N = nose performance coefficient in soil, dimensionlesss
S = soil penetrability index, dimensionless
The S-number can be obtained directly from previous penetration
data for a given target, or it can be estimated from data for geologi-
cally bimllar targets (Table B.I). "Whatever the case, Young's equation
represents a scaling relation between the projectile characteristics
(size, weight, geometry), the impact velocity, and the maximum depth of
penetration.
Since Young's equation gives only the final depth, it cannot be
used to calculate the instantaneous resisting force, only the average
resisting force. This is not a drawback for normal impact, since the
1 Young's equation is not dimensionally homogeneous. All quantities
must be specified in the units given.
73
*n uC=llM piACM M.&zK NOT FflMsDi
Swg
I
axial resisting force is often a step-pulse (i.e., uniform, except for
some oscillation) in a given layer. On the other hand, for non-normal
impact, both the axial and lateral forces must be known if the 2- and
3-D motion is to be calculated. Since Young's equation gives no indica-
tion of the lateral forces, a more detailed analysis is needed.
In Reference 4 a projectile equation of motion was developed for
normal impact and penetration in soil, based on data originally used
by Young. Postulating that the axial force should (a) have the form of
a step-pulse and (b) exhibit linear dependence on velocity, it was
"found that an equation of the form
dV (-M- a + bV + cZ (B.1)
would satisfy both these criteria, provided that
b (B.2)
The explicit appearance of the projectile mass in the velocity coeffi-
cient b was puzzling but absolutely necessary to generate a step-
pulse resisting force. Moreover, it brought the mass dependence of the
maximum depth into agreement with Young. Physically, however, the mass
should occur only on the left side of Equation B.1, with parameters such
as diameter, nose shape, and S-number appearing in the coefficients a
b , and c .
The mass dependence of the coefficient b is now thought to be a
size effect in disguise. This is reasonable since many of the larger
projectiles used by Young had masses roughly proportional to D3 2
Con3equently, an alternative to Equation B.2 is
2 The deep earth penetrators, built and tested by Sandia Laboratories,
had L/D ratios of about 10 to maintain stability. For many of theseprojectiles the weight (in pounds) can be related to the maximumdiameter (in inches) by
3A
W = 1.3 D + 30%
7 4
6esZ7 ,~' FO\ ~P /
b IýD' a(B.3)
In either case, the approximate solution for the final depth Z ismax
a [-(a + bvy + bV v)2 + McV 2 (B.4)
and the dependence of a and c upon S and D is the same as in
Reference 4:
Da- (B.5)
D2c-D2 (B.6)
s 2
which insures that for low-velocity, shallow penetration,
z S (Rp7)max D
in accordance with Young's equation. When the nose performance coeffi-
cient N is added, the coefficients a , b , and c can be expressed5
in terms of three "universal" constants y , B y
a D -(B.8)S .N . • . I . . ..
b 'G(B.9)
SN
2c S 2 Ns2 (B.10)
With these expressions for a , b and c , it follows from Equa-
tion B.4 that
75
AIp
I
Zma -- (B.u1)D"
where
1 1n < 2.5 (B.12)
and Young's nose performance coefficient in soil is approximated by
N o0.632 L (CRx 'lJ ogives (B.13)4 CRH - 11
"N , cones (B.114)f sin nc
The values of the constants u , 8 , and y have been obtained.
The ratio uf O/y was adjusted until step-pulse deceleration curves
were achieved. The values of p and y were then determined by
fitting Equation B.4 to shallow penetration data (Reference 27) for
projectiles with the same weight and diameter3 in the Main Lake area of
Tonopah Test Range (TTR). The values for the three constants are
a 1.96 x lo5 lb/ft
B a 6.25 x 10⁶ lb 2 s 2 /ft7
y 1.56 x 10⁵ lb/ft 3
Figure B.1 compares Equation B.4 with normalized 5 deep- and
4 W 224 pounds, D = 4.4 inchesEquations B.1, B.4, B.8-B.l0, B.15, and B.16 are dimensionallyhomogeneous. Any set of dimensionally compatible units may be usedtherein, as long as all quantities are converted to the same systemof units.Normalized using Equation B.4. Amount of scatter in normalized dataindicates degree of validity as scaling relation.
76 GOO
'A -

shallow-penetration data for TTR Main Lake. The same data are given in
original form in Reference 2, where Young gives the S-number profile as
S a 5.2 from 0 to 8 feet and S = 2.5 from 8 to 25 feet. Equation B.4
* agrees best with the shallow data using S = 4.3 and with the deep
data using S - 3
Equation B.4 appears to do about as well as Young's equation in
extrapolating and interpolating soil penetration data, but as a formula
for depth prediction, it offers no advantage over the latter. On the
other hand, the underlying equation of motion (Equation B.1) contains
* some additional information concerning the explicit relation between
the axial resisting force and the velocity, depth, diameter, and
geometry of the projectile.
The analysis of nonaxial motion requires that the stress distribu-
tion be specified on the projectile. In the present context, any stress
distribution is potentially correct if it generates Equation B.4 with
the values of a , b , and c given by Equations B.8-B.IO. The
simplest distribution that accomplishes this, giving approximately the
right dependence of Ns on projectile geometry, is a compressive normal
stress defined as follows:
0.625 + 5 sin + 5 sin n (B.15)S r p S2
where
rp = local cylindrical radius of projectile
, local angle belweeJ projectile surface and axis of symmetry
Z = vertical depth from target surface to point on projectile
surface (Figure 2.7)
B.2 EXTRAPOLATION TO MON-NORMAL IMPACT
Nov that the stress distribution is defined by Equation B.15, the
extrapolation procedure for soil is the same as for rock and concrete
(Appendix A). Thus, for 2- or 3-D motion, the function sin n is re-
placed by v/v, and V by v ,so thatn
77
I
" rp + 59 (B.16)
As in Appendix A, it is assumed that for a stress to act on a given
projectile surface element there must be contact with the target (Sec-
tion 2.4) and net motion into the target (vn > 0), otherwise a - 0
78 •,..,.-,•a 0 9.1
__L .. i ....
Table B.1. Typical S-numbers for natural earth materials.
S Materials
1-2 Frozen silt or clay, saturated, very hard. Rock, weathered,low strength, fractured. Sea or freshwater ice more than10 feet thick.
2-3 Massive 'gypsite deposits.b Well-cemented coarse sand andgravel. Caliche, dry. Frozen, moist silt or clay.
4-6 Sea or freshwater ice from 1 to 3 feet thick. Medium dense,medium to coarse sand, no cementation, wet or dry. Hard,dry, dense silt or clay.c Desert alluvium.
8-12 Very loose, fine sand, excluding topsoil. Moist, stiff clayor silt, medium dense, less than about 50 percent sand.
10-15 Moist topsoil, loose, with some clay or silt. Moist, mediumstiff clay, medium dense, with some sand.
20-30 Loose, moist topsoil with humus material, mostly sand andsilt. Moist to wet clay, soft, low shear strength.
40-50 Very loose, dry, sandy topsoil (Eglin AFB). Saturated, verysoft clay and silts, with very low shear strengths andhigh plasticity.d Wet laterltic clays.
a Taken from Reference 3.b White Sands Missile Range, New Mexico.c Tonopah Test Range, Nevada, drn lake playss.
Great Salt Lake Desert and bay mud at Skaggs Island.
79
, ,
3.1
3* /
//30 ~
It /
/ •/
a a /
• mm .,mm r•C~ ON .4.02d l
//1 0/. ,
• a" ,00 000/
NI _PA' CT' 'f/
FIr&gur B.1 Cc:lupwrion of CILtlevited penetration depths vith data fO
M Main L~ke area.
80 GOO~OALZET
-jc
nnn• • "6
i * ar ce ~l Il ac 100 zoo''ll[Ir'"'

APPENDIX C
NOTATION
a, b, c Empirical force coefficients
A Maximum cross-sectional area of projectile
CRH Tangent-ogive radius of curvature, in calibers ("caliberradius head")
dA Differential element of surface area on projectile
dFx, d z Differential force components in the body-fixed lateral andaxial (x- and z-) directions, respectively
D Maximum projectile diameter
D Maximum coarse aggregate sizeag
f(V) Function of velocity
F', F z Net force components in the body-fixed lateral and axial(x- and z-) directions, respectively
g Gravitational acceleration (32.2 ft/s )
I Transverse mass moment of inertia about CG
k Free-surface parameter, rs/rp
L Projectile length
M Projectile mass, W/g
n Exponent
N Nose performance coefficient in rock and concreterc
N Nose performance coefficient in soil
r c Cylindrical radius of wake cavity
r° 0 Cylindrical radius of projectile at separation point
r Local cylindrical radius on projectile surface at a givenP point
r s Maximum perpendicular distance from projectile axis,through dA , to target surface, for which stress reliefcan occur due to free-surface effect
81
RQD Rock quality designation
S Soil penetrability index
t Time1
v Absolute local velocity of any point on projectile surface
v Outward normal component of local velocityn
Vx' vz Local velocity components in body-fixed lateral and axial(x- and z-) directions, respectively
V Projectile CG velocity
Vn Outward normal component of CG velocity
V Impact velocity
V V Components of CG velocity in body-fixed lateral and axialx, Z (x- and z-) directions, respectively
W Projectile weight
x Lateral (body-fixed) position in projectile
X Horizontal position in target
X, Z Components of acceleration in the X- and Z-directions,respectively
Y Unconfined compressive strength of intact rock or concrete
Y Concrete strength, corrected for aggregate sizeC
Y Rock strength, corrected for RQDr
z Axial (body-fixed) position in projectile, measured forwardfrom CG
Z Vertical position (depth) in target, measured downwardfrom target surface
Z Vertical position (depth) of CG, measured downward fromcc target surface
Z Maximum (final) depth of penetration of nose tip
max
A dot over any quantity indicates differentiation with respect to
time.
82 NJ\a'GOO'
a Angle of attack
mo Initial angle of attack
0 Constant, 6.25 x 10⁶ lb 2 -s2 /ftT
Y Constant, 1.56 x lo5 lb/ft 3
a Lateral displacement of point on projectile axis, relativeto wake cavity
a Initial displacement of point on projectile axis0
C Axial distance aft of the nose tip
Co Axial distance from nose tip to separation point
CG Axial distance from nose tip to CG
Local angle between projectile axis and line tangent toprojeci.ile surface
"c Cone half-angle
o Obliquity angle, measured counterclockwise from target-fixedZ-axis to projectile-fixed z-axis
e Angular velocity
o Angular acceleration
0 Initial obliquity angleo
P Constant, 1.96 x 10⁵ lb/ft
p Mass density of rock or concrete
a Local compressive normal stress on projectile surface
ax a z Components of local compressive normal stress in body-fixedlateral and axial (x- and z-) directions, respectively
Local angle of approach between projectile surface elementand target, based on CG velocity components
Oaft Aftbody flare angle
#min Angle of approach at which separation occurs (wake separa-tion angle)
Azimuthal angle on projectile
83
Hest Available Copy
SD4 TRZDIM 1Z0ON LIS?
DEPARTMENT OF DEFENSE DEPARTMENT OF THE ARMY
Assistant to the Secretary of Defense, Director, U. S. Army Ballistic MissileAtoaic Energy, Defense Advanced Technology Center
ATTN: Donald R. Cotter ATTN: BMDATC-XSCDABB-S
Director, Defense Advanced ResearchProjects Agency, Ballistic Missile Defense Program Manager, U. S.
ATTN: COL B. Pafe Army Ballistic Missile Defense Program OfficeIlWRO ATTN: DACS-DIT/Dr. John SheaPaul C. MeJonigalCD J. Beetty Headquarters, Central Army GroupLTC M. Franklin ATTN: CEU LTC J. L. SpruillS. LukasikPNO Office, Chief of EngineersSTO 2 cy ATTN: DAJU-ABI-LEric H. Willis 2 cy DAJD0C-DTechnical Library DAJI-RDL
Federal Eergency Management Agency Office, Chief of Research, Development, andATTN: Director Acquisition
ATTN: DAJMA-CSM
Defense Documentation Center, Cameron Station Technical Library12 cy ATTN: TC/Myer B. Kahn
Commander, Harry Diamond LaboratoriesDirector, Defense Intelligence Agency AT1!: A. HolIes
AT!!: DI-TE AMXD)O-4DT-2, Weapons * Systems Division ANXDO-RBH/J. OwaltneyDI-TD, Phys. VuL.. Div.,
Edvard O'FarreUl Project Maneager, Remotely Monitored BattlefieldTechnical Library Sensor System, U. S. Army Materiel Development
and Readiness Comand (DAPCOM)Defense Mapping Agency ATM!: Chuck Higgins
ATW!. H. LindseyComamnding Officer, Picatinny Arsenal
Director, Defense Nuclear Agency ATT!: Paul HarrisATiM: STSI (Archives) P. Angelloti
2 ey STlL (Technical Library) Technical Library1 cy SPSS S.UPA-ND-S/E. Zimpo
DDST Willimm MeyerRay Goldstein
Director of Defense Research and Engineering Ray MoessnerATTN: Assistant Director, Strategic Marty Margolin
Weapons Jerry Pental
Deputy Director, Strategic SUMPA-AD-D-A-TSystems SUMPA.AD-D-A
M. J. Minneman SUMPA-AD-D-MGeorge BarseCraig W. Hartsell Director, U. S. Army Ballistic Research
R. Thorkildsen LaboratoriesDeputy Director, Tactical Warfare ATTN: AMXBR-X/J. J. Meszaros
J. H. KeeferCommander, Field Command, Defense Nuclear AMXBR-TB/J. T. Frasier
Agency W. J. TaylorAT!M: FCPR Norris J. Huffington, Jr.
D. DunnInterservice Nuclear Weapons School G. Grabarek
ATM!: Technical Library B. ReiterG. Roecker
Director, Joint Strategic Target Planning 2 cy Technical Library/Edward BaicyStaff, JCS J. W. Apgar
ATTN: Science and Technology Info R. Paul Ryan, Chief, ClosedLibrary Literature, Scientific and Tech-
nical Information Branch
Director, Weapons Systems Evaluation GroupATTN': Technical Library Comeander/Director, U. S. Army Cold Regions
Research and Engineering LaboratoryATT!: G. Svinzow
851I§MREo=)#G PAM• BLANK N OT F711EM
(J
DEPARTM4ENT OF THE ARMY (Continued) DEPARTMENT 0F THE NAVY
Division Engineer, U. S. Ar-my Engineer Division. Chief of Naval Research, Department ofHuntsville the Navy
ATTN: HNDE)-CS/Michael N. Dembo ATTN: Technicsl Library
District Engineer Officer in Charge, Civil Engineering Laboratory,U. S. Army Engineer District, St. Paul Naval Construction Battalion Center
ATTN: Library ATTN: R. J. OdelloTechnical Library
Division Engineer, U. S. Army Engineer Division,Ohio River Commander, Naval Electronics Systems Commsand,
ATTN: ORDAS-L/Technical Library HeadquartersATTN: PME-.ll-21A
Director, U. S. Army Engineer WaterwaysExperiment Station Commander, Naval Facilities Engineering Command
ATET!: Mr. L. F. Ingram ATTM: Technical Library, Code 0911CMr. L. K. DavisMr. William J. Flathau Superintendent, U. S. Naval Postgraduate SchoolMr. John Strange ATTS: Library, Code 212h
3 cy LibraryDr. Paul Hadala Director, Naval Research LaboratoryDr. Guy Jackson ATET: Code 2027/Tech LibraryDr. Behzad RohaniMr. Allen D. Rooke Comander, Naval Surface Weapons Center
ATTN: Mr. KasdorfCommander, U. S. Army Materials and Mechanics Technical Library
Research Center C, Ie 1224 Navy Nuc Prgms OffATTN: John Mescall Jules Enig
Technical Library Mary P. KingRichard Shea L. Roslund
Robert D. HeidenreichDirector, U. S. Army Material Systems Analysis G. Briggs
Agency Technical LibraryATTN: J. Sperazza William Wisherd
M. Reches Ted WilliamsM. Weiland
Comnander, U. S. Army Mobility EquipmentR&D Center Commander, Naval Weapons Center
ATTN: STSFB-MW ATTN: Code 603, Dr. Carl AustinSTSFB-XS Mr. P. CordleTechnical Library Code 533, Technical Library
Commandant, U. S. Army Engineer School Coemmander, Naval Weapons Evaluation FacilityATITN: ATS!.7-SY-L ATTN: Technical Library
Commander, U. S. Army Materiel Development Director, Strategic Systems Project Office,and Readiness Command, (DARCOM) Navy Department
Research and Concepts Branch 2 cy ATTN: NSP-43, Technical Library
Commander, U. S. Army Nuclear Agency DEPARTMENT OF THE AIR FORCEATTN: Document Control
Technical Library Air Force Armament and Testing Laboratory, AFSCCOL Quinn AN'!: Technical LibraryMAJ F. P. Weichel MAJ Thomas Tomasetti
3 cy Mr. John CollinsCoimmander, U. S. Army Missile Comand Mr. Leonard Wilson
ATTN: Technical Library Mr. Masey ValentineF. Fleming Mr. William CramerAMCPM-PE-X (William K. Jann) Dr. Kulp
Commander, U. S. Army Armament Command Air Force Institute of TechnologATTN: Technical Library ATTN: Technical Library
Division Engineer, U. S. Army Engineer Commander, Air Force Weapons Laboratory, AFSCDivision, Missouri River ATTN: SUL, Technical Library
ATMN: Library DEV-S/Dr. M. A. Plamondon
S36 Avail abl (eS
DZPARWI¶4EW OF THE AIR FORCE (Continued) EiERGY RESEACJcH & DEVELOPMENTAw(INrSTRATrON (Continued)
Headquarters, Air Force Systems CommandA•riM% Technical Library Director, Lawrence Livermore Laboratory
AM.,N: Technical Information Division,* Project Manager, Oator Mine Program Technical Library
A•It S. J. Lindsey Larry Woodruff. L-125Doc Control for W. Scanlin
Oklahoma State University, Field Office Frank Walkerfor Weapons Effectiveness Mark Wilkins
ATTN: Ed JackettOTHER GOVERHNMENT AGENCIES
Air Force Office of Scientific ResearchATPI: LTC L. P. Mosteller, Jr. Electric Power Research Institute
ATTM: Dr. George Sliter
. Commander, Rome Air Development Center, AFSC
ATT.: DTrLD, Documents Library Office of Nuclear Reactor Regulation, NuclearRegulatory Comission, Division of Technical
Commander, Armament Develolsent and Test RevievCenter AM.TN Mr. Lawrence Shao, Chief,
AMN: AWYiC/DLODL/Technical Library Struc Engrg Br
Commander. Foreign Technology Division, AFSC Bureau of Mines, Twin Cities Research Center
ATTM: TD-BTA Library ATTN: R. E. Thill
HQ USAF/IlI DEPARTMENT OF DEFENSE CONTRACTORSAMT:: INATA
Aerospace Corporation
HQ USAF/RD ATT: Technical Information ServicesAMI: RDFM, COL J. E. McCormick R. Strickler
George YoungSpace and Missile Systems Organization
ATM: DEB Agbabian AssociatesATrN: Dr. M. S. Agbabian
EENROY RESEARCH & DEVELOPMENT ADMINISTRATIONApplied Theory Incorporated
U. S. Energy Research and Development 2 cy ATM,: Dr. John G. TrulioAdministration, Division of MilitaryApplication AVCO, Government Products Group
ATTN: Doe Control for Test Office AT'Mi: David HendersonFrank Lasher
U. S. Energy Research and Development Research Library A830, Room 7201Administration, Albuquerque Operations Office John Atanasoff
ATTii: Doe Control for Technical Library
Battelle Columbus LaboratoriesU. S. Energy Research and Development ATTM: Technical Library
Administration, Division of HeadquartersServices, Library Branch G-043 Bell Telephone Laboratories, Inc.
ATMH: Doc Control for Class Tech Lib ATMI: Technical Report Center
U. S. Energy Research and Development Boeing CompanyAdministration, Nevada Operations Office ATTN: Aerospace Library
AI'1N: Doe Control for Teehnical Library Reynold Atlas
Los Alamos Scientific Laboratory California Research and Technology, Inc.ATM.: Doec Control for Reports Library AT•ri: Dr. K. N. Kreyenhagen
Doc Control for Tom Dowler Technical LibraryDoc Control for C. CremerDoc Control for G. Dials Civil/Nuclear Systems Corporation
AMPH: Robert CravfordSand ia Laboratories
ATTN: Doe Control for T. Gold EG4,. Inc.Doe Control for Technical Library ATIII: Technical Library
Doc Control for Dr. Walter HerrmanDoe Control for John Colp General Dynamics Corporation
Doe Control for John Keizur, ATlM: Keith Anderson
Org. No. 1312Doe Control for William Patterson General Electric Cmpany, TEMPO-Center
Doec Control for Al Chabsi for Advanced StudiesDoe Control for 3141 Sandia Rpt Coll AMl': DASIACDoe Control for Ray Reynolds
8 Best Available Copy
, , I I II I "' I I I I II '7'

///.... / ___". __ ,_,
DEPARTMENT OF DEENS• E CONTRACTORS (Continued) DEPARI¶M!.r Or DEFENSE CON'TRACTORS (ContinuedL
IIT Research Institute Systems. Science and SoftvareATI: Technical Library ATTIN: Dr. Donald R. Grins
Technical LibraryInstitute for Defense Analyses
ATrM: IDA Librarian Ruth S. Smith Terra Tek, Inc., Univrrsity Reuearch ParkATTN: Mr. S. .1. 3reen
Consulting and Special Engineering Services, Inc. Dr. A. H. Jones
ATTN: Dr. J. L. Merritt Technical LibraryTechnical Library
Texas A&M UniversityKaman Avidyne, Division or KXaan Scietices Corp. AMTI: Harry Coyle
ATTN: Technical Library Prof. L. J. Thompson9. S. CrisiconeN. P. Hobbs TRW Defense and Space Syntemn Croup
ATTN: Tech Info Center/S-1930
Kaman Sciences CorporationATTN: Technical Library Weidlinger Associates, Consulting Engineers
ATMlI: Dr. Melvin L. BaronLockheed Missiles and Space Company Mr. J. W. Wright
ATTN: Tech Info Center D/Coll Dr. J. IsenbergTechnical Library
Lovell Technical Institute. Department of
Martin Marietta Aerospace Civil Engineering
ATT'1N: M. Anthony ATTIN: L. W. ThigpenGerbert E. McQuaig (MP-81)
Georgia Institute of Technology, DepartmentUniversity of Illinois of Aerospace Engineering
AM#: Dr. Nathan M. Newmark AIM t: S. V. Hana4gudL. N. Rehfield
University of Hey Mexico
AI'TTI: H. D. Southvard Engineering Societies Library
G. E. Triandafalidis AMT : Acqu'sitions Librarian
Physics International Company Paciric Technology, Inc.AMTl: Doe Control for Mr. Fred M. Sauer ATTN: G. 1. Kent
Doe Control for Dr. Robert Svift R. L. BjorkDoc Control for Technical LibraryDoe Control for Mr. Dennis L. Orphal FOREIGN EXCHANGES
Doc Control for Mr. Larry BehrmanRegierungorat, Bundesanstalt fur Strmssenvenen
R&D AssociatesAM'iN: Dr. Harold L. Brode Department of Physical Geography, Uppsala
Dr. H. F. Cooper, Jr. UniversityMr. R. J. PortTechnical Library Prof. Leopold Muller, Abtellung Felsmechanik,Mr. William B. Wright Institut fur Bodenmechanik und Felssiechanik."Dr. C. P. Knowles Universitat Karlsruhe
Mr. J. G. LevisrOr../rTIC EXCHANGE
Science Applications, Inc.ATTN: Mr. David Bernstein Tennessee Valley Authority
Dr. D. E. Maxwell AMN: Ronald (G. Domer, Chier.Dr. Cecil Ivan Hudson, Jr. Civil Engineering Branch
-fDr. W. M. Layson
Staneord Research InstituteATTN: Dr. Carl Peterson
Dr. G. AbrahamsonMr. Lynn SeajmansSRI Library Room n021
BeS Avaiiable CoPYY
/ A'
In accordance with letter from DAEN-RDC, DAEN-ASI dated22 July 1977, Subject: Facsimile Catalog Cards forLaboratory Technical Publications, a facsimile catalogcard in Library of Congress MARC format is reproducedbelow.
Bernard, Robert SProjectile penetration in soil and rock: analysis for non-
normal impact / by Robert S. Bernard, Daniel C. Creighton.Vicksburg, Miss. : U. S. Waterways Experiment Station ; Spring-field, Va. : available from National Technical InformationService, 1979.
88 p. : ill. ; 27 cm. (Technical report - U. S. Army Eagi-near Waterways Experiment Station ; SL-79-15)
Prepared for Defense Nuclear Agency, Washington, D. C.,under DNA Subtask Y9OQAXSB211, Work Unit 20.
References: p. 61-63.
1. Ballistics. 2. Computer analysis. 3. Impact. 4. Numericalanalysis. 5. Penetration. 6. Projectiles. 7. Rock penetra-tion. 8. Soil penetration. I. Creighton, Daniel C., jointauthor. II. United States. Defense Nuclear Agency. III. Series:United States. Waterways Experiment Station, Vicksburg, Miss.Technical report , SL-79-15.TA7.W34 no.SL-79-15
Best Available Copy