policy instruments to reduce consumption of …
TRANSCRIPT

* Corresponding author: Travis P. Wagneremail: [email protected]
Detritus / Volume 09 - 2020 / pages 11-26https://doi.org/10.31025/2611-4135/2020.13903 © 2019 Cisa Publisher. Open access article under CC BY-NC-ND license
POLICY INSTRUMENTS TO REDUCE CONSUMPTION OF EXPANDED POLYSTYRENE FOOD SERVICE WARE IN THE USATravis P. Wagner *University of Southern Maine, Environmental Science and Policy, 106 Bailey Hall Gorham, ME 04038, United States
Article Info:Received: 9 July 2019Revised: 3 December 2019Accepted: 5 December 2019Available online:10 February 2020
Keywords:Plastic marine debrisSingle-use plasticsPolystyreneRecyclingExpanded polystyreneLitter
ABSTRACTThere is global recognition that waste plastic is a ubiquitous pollutant in the built and natural environments. A component of plastic litter and debris is single-use, expanded polystyrene (EPS) food service ware. Reducing the consumption of EPS food service ware is challenging because reuse is not feasible, recycling is not eco-nomically viable, and composting is not possible. In the absence of national action to reduce EPS in the USA, local governments have taken the lead on enacting or-dinances to eliminate or reduce EPS food service ware. This paper examined the variety of policy instruments that can or have been used by local governments in the USA to reduce EPS food service ware. Because of the inabilities to reuse, recycle, and/or compost EPS, the most frequently used policy instrument has been a ban. As of December 2019, there were 249 local bans in the USA covering 12.85% of the nation’s population: of these bans, 9.6% were partial bans restricting distribution only on government and public property, 65.9% were narrow bans that ban distribution by restaurants and food providers, 8.8% were full bans that include the narrow ban and also ban using EPS food packaging by grocery stores, and 15.7% adopted an expanded ban that includes the full ban and also baned other single-use plastic food ware related items including the selling or distributing of EPS coolers and single-use plastic utensils, straws, stirrers, lids, cups, plates, and containers.
1. INTRODUCTIONContinuous images of plastic waste, litter, and debris
have established that plastic waste is ubiquitous in the built and natural environments. While there has been rec-ognition for decades that plastics were a major component of land-based, surface water, and costal/beach litter, its prevalence in seemingly unexpected areas have raised the public’s alarm.
In 2010 alone, an estimated 4.8 to 12.7 million MT of plastic waste entered the ocean from land (Jambeck et al., 2015). In the open oceans, the worldwide marine distri-bution of plastic debris is mostly accumulating in the five ocean gyres (Cózar et al., 2014). Plastics and microplastics occur on ocean surfaces, in the water column, in sediments (Galgani, Hanke, & Maes, 2015), and in marine organ-isms (Law, 2017). Humans are exposed to waste plastics through the consumption of contaminated seafood (Smith, Love, Rochman, & Neff, 2018; Cox et al., 2019). Microplas-tics have even been found in remote mountain areas as a result of wind transport (Allen et al., 2019) and are entering the environment through organic compost (Weithmann et al., 2018). Collectively these occurrences firmly establish that plastic waste is a ubiquitous environmental pollutant.
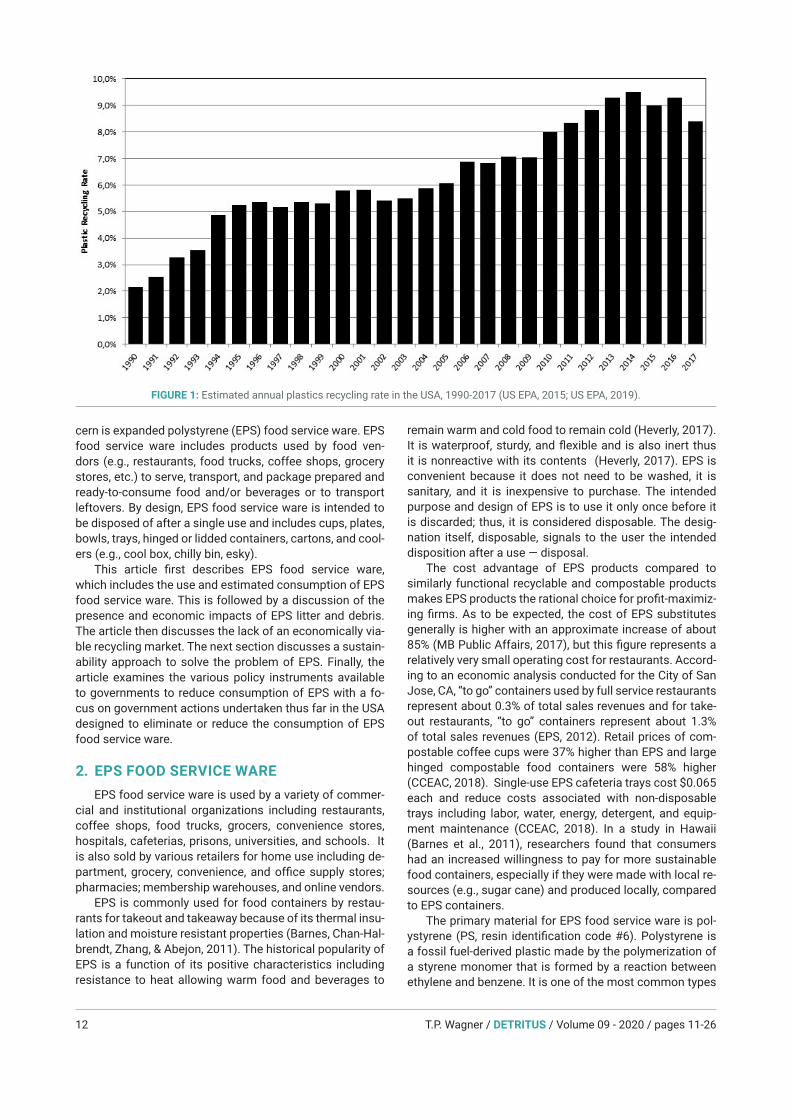
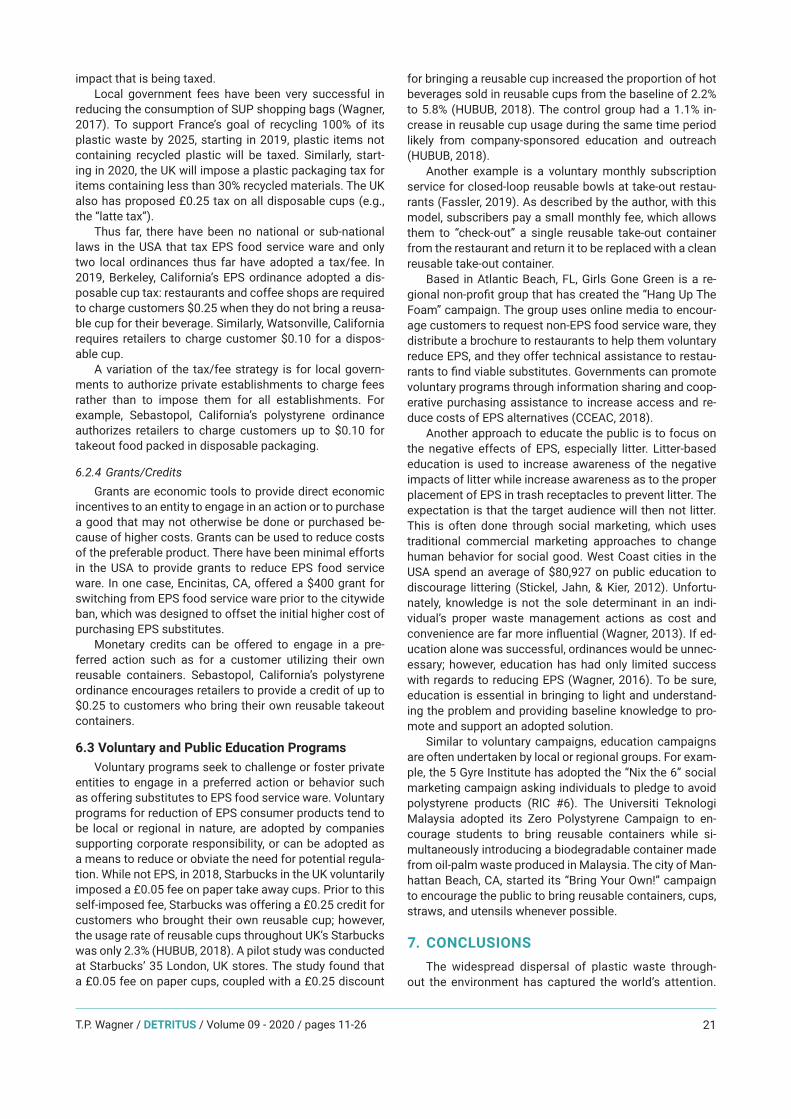
Each year more than 300 million MT of plastics are produced worldwide (Law, 2017); the majority of these plastics are not recovered. As shown in Figure 1, in 2014 only 9.5% of post-consumer plastics were recovered for recycling in the USA (US EPA, 2018), which was the high-est rate recorded. Since 2014 the rate has decreased; in 2017, the recycling rate dropped to 8.4% (US EPA, 2019) and will likely have decreased in 2018 and 2019 because of the implementation of China’s National Sword Program as discussed below. As a consequence, non-recovered plastic waste is disposed or becomes litter thereby potentially en-tering the environment.
This pervasiveness of plastic waste in the environment has prompted the media, concerned citizens, environmen-tal groups, corporations, and governments to reassess our seemingly insatiable consumption of plastics, specifically single use plastic (SUP) products. This concern is further exacerbated by the predicted growth of the SUP industry fueled by population growth, increased urbanization, and growth in middle-class income (Plastics Insight, 2019). Na-tional, sub-national, and local governments have begun to act to reduce the consumption of SUPs, especially plastic bags. One particular category of SUPs of increasing con-
T.P. Wagner / DETRITUS / Volume 09 - 2020 / pages 11-2612
cern is expanded polystyrene (EPS) food service ware. EPS food service ware includes products used by food ven-dors (e.g., restaurants, food trucks, coffee shops, grocery stores, etc.) to serve, transport, and package prepared and ready-to-consume food and/or beverages or to transport leftovers. By design, EPS food service ware is intended to be disposed of after a single use and includes cups, plates, bowls, trays, hinged or lidded containers, cartons, and cool-ers (e.g., cool box, chilly bin, esky).
This article first describes EPS food service ware, which includes the use and estimated consumption of EPS food service ware. This is followed by a discussion of the presence and economic impacts of EPS litter and debris. The article then discusses the lack of an economically via-ble recycling market. The next section discusses a sustain-ability approach to solve the problem of EPS. Finally, the article examines the various policy instruments available to governments to reduce consumption of EPS with a fo-cus on government actions undertaken thus far in the USA designed to eliminate or reduce the consumption of EPS food service ware.
2. EPS FOOD SERVICE WAREEPS food service ware is used by a variety of commer-
cial and institutional organizations including restaurants, coffee shops, food trucks, grocers, convenience stores, hospitals, cafeterias, prisons, universities, and schools. It is also sold by various retailers for home use including de-partment, grocery, convenience, and office supply stores; pharmacies; membership warehouses, and online vendors.
EPS is commonly used for food containers by restau-rants for takeout and takeaway because of its thermal insu-lation and moisture resistant properties (Barnes, Chan-Hal-brendt, Zhang, & Abejon, 2011). The historical popularity of EPS is a function of its positive characteristics including resistance to heat allowing warm food and beverages to
remain warm and cold food to remain cold (Heverly, 2017). It is waterproof, sturdy, and flexible and is also inert thus it is nonreactive with its contents (Heverly, 2017). EPS is convenient because it does not need to be washed, it is sanitary, and it is inexpensive to purchase. The intended purpose and design of EPS is to use it only once before it is discarded; thus, it is considered disposable. The desig-nation itself, disposable, signals to the user the intended disposition after a use — disposal.
The cost advantage of EPS products compared to similarly functional recyclable and compostable products makes EPS products the rational choice for profit-maximiz-ing firms. As to be expected, the cost of EPS substitutes generally is higher with an approximate increase of about 85% (MB Public Affairs, 2017), but this figure represents a relatively very small operating cost for restaurants. Accord-ing to an economic analysis conducted for the City of San Jose, CA, “to go” containers used by full service restaurants represent about 0.3% of total sales revenues and for take-out restaurants, “to go” containers represent about 1.3% of total sales revenues (EPS, 2012). Retail prices of com-postable coffee cups were 37% higher than EPS and large hinged compostable food containers were 58% higher (CCEAC, 2018). Single-use EPS cafeteria trays cost $0.065 each and reduce costs associated with non-disposable trays including labor, water, energy, detergent, and equip-ment maintenance (CCEAC, 2018). In a study in Hawaii (Barnes et al., 2011), researchers found that consumers had an increased willingness to pay for more sustainable food containers, especially if they were made with local re-sources (e.g., sugar cane) and produced locally, compared to EPS containers.
The primary material for EPS food service ware is pol-ystyrene (PS, resin identification code #6). Polystyrene is a fossil fuel-derived plastic made by the polymerization of a styrene monomer that is formed by a reaction between ethylene and benzene. It is one of the most common types
FIGURE 1: Estimated annual plastics recycling rate in the USA, 1990-2017 (US EPA, 2015; US EPA, 2019).

13T.P. Wagner / DETRITUS / Volume 09 - 2020 / pages 11-26
of plastics for food service ware, which includes cups, lids, bowls, and takeout/takeaway containers, trays for pre-pared foods, straws, and utensils. The major types of PS are extruded, molded, and expanded. Extruded PS, which contains less air than expanded PS, is a smooth material used primarily for displaying and packaging food including “foam” trays for meat, produce, bakery items, deli, seafood, and eggs. Another version of extruded PS is oriented PS, which is a clear, stretched PS film used in bakery, deli, and freezer applications. Clear extruded PS is also used for clear hinged food containers (“clamshells”). Molded PS is used to produce a more rigid material for such products as disposable cups and lids, containers for dairy products, cutlery, straws, and containers used for salad bars and pro-duce. Expanded polystyrene (EPS) is typically produced by expanding polystyrene beads that contain pentane in the presence of steam; the greatly expanded pellets are subsequently steam-fused and molded. EPS is used to produce take-out food and beverage containers primarily cups, bowls, plates, hinged clamshell containers, platters, and cafeteria trays and is also used for disposable cool-ers and packing material. EPS coffee cups first entered the market in 1960 (Smith, 2017). EPS is also used as an insulator to hold and ship perishable goods (e.g., dispos-able coolers and mail order foods) and to protect contents from damage (e.g., packing “peanuts” and formed blocks). Styrofoam™, a commonly used but incorrect generic term for EPS food service ware, is actually the Dow Chemical Company’s trademarked name for closed-cell extruded PS used for thermal insulation in buildings.
Regarding consumption data, the only national con-sumer data for some EPS food service ware in the USA is from 2004 and 2008, but only for certain EPS products. In 2004, Americans consumed 56.73 billion EPS cups, bowls, plates, clamshells, and trays, which equated to 193.2 items per person (Keybridge Research, 2009). In 2008, consump-tion increased slightly to 59.04 billion items, or 194.2 items per person (Keybridge Research, 2009). As shown in Table 1, if historical trends were to continue, extrapolating line-arly to 2019, Americans will consume 63.628 billion SUP food service ware items. (This amount does not include the consumption of molded and extruded EPS food service ware.) It is recognized that at best, the extrapolation is only an indicator of potential consumption due to a variety of factors. For example, between 2008 and 2018, there was an 8.7% increase in real personal income in the USA (USA Census Bureau, 2019). The reliance on take-out food, and thus SUP food service ware, has increased. Between 1997 and 2017, American’s increased their expenditure on take-out food by 8.4%; take-out food now comprises 36.1% of
all food away from home expenditures (USDA, 2018). How-ever, voluntary and government actions (discussed later in this paper) have reduced consumption in some areas.
3. EPS LITTER AND DEBRISLitter is generally defined as waste items that have
been disposed of improperly at an undesirable location. Lit-ter is also generated through the mismanagement of waste including its spillage and escape during collection and transportation for recycling as well as escape as dispos-al as trash. A study in Florida (FCSHWM, 2003) found that overflowing and uncovered dumpsters were major causes of solid waste collection-generated litter. Collection-gener-ated litter is especially pronounced with automated collec-tion as Schert (2000) found a 71% increase in litter with au-tomated collection of trash. SUPs collected from curbside recycling or trash receptacles or public space receptacles can spill during the manual or automatic transfer of materi-als to collection trucks. Litter is commonly generated from the curbside collection of recycling and trash because of the design of some collection containers (open-top bins), wind, wind generated from passing vehicles, the physi-cal transfer of contents to collection vehicles, and from scavenging by humans and animals (Wagner & Broaddus, 2016).
When littered, EPS is problematic because of its lon-gevity, design, and density. EPS is lightweight making it susceptible to dispersion by wind and stormwater. EPS is especially problematic as litter and debris because it is about 95-98% air with a bulk density of only 0.05 g/cm3 and thus highly buoyant allowing it to float; its lightweight design allows it to be windblown (natural wind and wind produced by passing motor vehicles). The buoyancy as-pect also makes littered EPS transportable by stormwater resulting in its transfer from land to surface water to ocean and stormwater collection systems to surface water and ocean. Because EPS is not biodegradable, when littered, it will break down into macro, micro, and nanoparticles through a variety of processes including abrasion, embrit-tlement, wind, wave and tidal action, and photooxidation (Wang et al., 2016). This results in increased and wider dis-persion and accumulation of EPS in the environment.
3.1 Prevalence of EPS Litter Plastics have consistently dominated the top items col-
lected around the globe based on item counts of coastal litter. Each year, the Ocean Conservancy conducts an Inter-national Coastal Cleanup event. In the 2018 global clean-up event, 122 countries participated (Ocean Conservancy,
Cups Plates, bowls & platters Clamshells Trays Total
Consumption
Mean per capita 110.6 36.5 36.5 9.8 193.4
Mean per household+ 279.8 92.3 92.3 24.8 489.3
Total consumption 36.387 billion 12.008 billion 12.008 billion 3.224 billion 63.628 billion
+The US population in 2019 was 329 million; mean individuals per household in 2016 was 2.53 (US Census Bureau, 2016).
TABLE 1: Estimated annual USA national consumption of EPS food service ware, 2019.
T.P. Wagner / DETRITUS / Volume 09 - 2020 / pages 11-2614
2019). The 2017 cleanup event was the first year that the top-ten most commonly found items were all made of or in-cluded plastics, which was repeated during the 2018 clean-up event (Ocean Conservancy, 2019). In the 2018 coastal cleanup, EPS food service ware and packaging was the 8th most commonly found item in the USA (Ocean Conservan-cy, 2019).
Baltimore, MD, has three water-wheel trash intercep-tors, which are stationary, solar and hydro powered vessels that intercept and remove debris from tributaries of Balti-more’s Inner Harbor. The first wheel was installed in 2014, the second in 2017, and the third was installed in 2018. Between 2014 and November 2019, the three wheels col-lected and removed 1,478,787 EPS containers (Clearwater Mills, 2019).
A trash survey of the Anacostia River in the State of Maryland (USA) found that on a per item count basis, EPS food service ware was the fourth largest category of trash behind plastic bags, the largest category; food packaging and plastic bottles were the second and third highest count categories respectively (MWCOG, 2015).
EPS has been found to be a significant component of trash collected in stormwater drains. In the San Francis-co Bay area of California, trash in stormwater capture de-vices was collected and characterized. EPS food service ware accounted for 6% by volume of the waste character-ized; however, on a per-item count, EPS was 262% greater than recyclable beverage containers and 87% greater than SUP bags (EOA, 2014). In San Jose, CA, EPS was found in stormwater drains at volumes ranging from 7.8% to 10.8% of trash collected that was consistent with findings of the California Department of Transportation, which found that EPS constituted 15% by volume of the trash in statewide sampled storm drains (Romanow, 2012). In a sampling event in Santa Cruz County, CA, EPS constituted 12.66% by count of all trash found in the stormwater system (Ro-manow, 2012).
3.2 Economic Impacts of Plastic LitterAs found by Beaumont et al. (2019), the direct and in-
direct costs of marine plastic debris are significant and include the loss of seafood as a human food source, a neg-ative impact to heritage through the loss of culturally sig-nificant and iconic marine megafauna, and reduced marine ecosystem services. The authors postulate that marine plastic debris causes an annual loss of $500–$2,500 bil-lion in reduced marine ecosystem services, which equates to $3,300 - $33,000 per MT (Beaumont et al., 2019).
The presence of litter, especially in tourist-heavy recre-ational areas, also has a negative economic impact in part because of its adverse aesthetics prompting some visitors to avoid littered beaches (Leggett et al., 2018). Based on an analysis of the economic impact of marine debris during the three-month prime beach season for 31 beaches in Or-ange County, CA, the economic benefits of a 25% reduction in marine debris were valued at $29.5 million with a per capita seasonal value of $12.91 (Leggett et al., 2018)
Cleaning-up marine litter from the open ocean is not currently feasible as prevention is the only successful ap-proach to manage the problem (Jambeck, 2015). In con-
trast, cleaning up coastal and land-based litter is feasible, but can be a significant expense for a local government. The annual cost of beach and waterway cleanup in New York City was $2,719,500 (Columbia University, 2015). In a comprehensive marine debris cost study by Stickel, Jahn, and Kier (2012), the authors found that on average West Coast cities in the USA annually spent $56,688 on beach and waterway cleanups, $664,580 for street sweeping, $165,811 for stormwater capture devices, $294,935 on storm drain cleaning and maintenance, and $304,545 for manual cleanup of litter. In a study on the impact and cost of litter from curbside recycling collection, the estimated labor cost to collect each visible piece of litter ranged from $0.17 to $0.79 (Wagner & Broaddus, 2016). San Francisco estimated the clean-up cost for each littered plastic bag to be $0.052 (Pender, 2005; Burnett, 2013).
4. NO ECONOMICALLY VIABLE MARKET FOR RECYCLED EPS
Currently, the recycling rate for EPS food service ware in the USA is insignificant. Although no national recycling rate of EPS food service ware is available, in Los Angeles County, CA, the EPS food service recycling rate in 2011 was about 1% (LA County, 2011). The statewide recycling rate of EPS food service ware and packaging in California in 2001 was 0.2% (IWMB, 2004). In Baltimore, MD, a free EPS food service ware drop-off recycling program operat-ed from 2011 to 2018, but collected only about 4 tons per year (Weigel, 2018), which equates to about 0.2 ounces per person per year or about the equivalent to 4 EPS coffee cups per year.
The city of San Diego, CA found that it was not eco-nomically viable to continue collecting EPS in curbside col-lection systems based on the high collection and recycling costs. The city estimated that the collection and recycling of 105 tons of EPS over a 7-year period would cost ap-proximately $900,000 or $8,570 per ton of EPS (San Diego, 2019). Based on a study by the New York City Department of Sanitation (NYC Department of Sanitation, 2017), over a 30-year effort, even when subsidized by the plastics indus-try, recycling EPS food service ware was not economically feasible
EPS is extremely lightweight (about 95%-98% air) mean-ing that a large volume is required to produce sufficient marketable quantities for recycling. For example, weight per volume for EPS is about 9.6 pounds per cubic yard. In comparison, whole unflattened plastic bottles are 36 lbs/yd3, corrugated cardboard is 100 lbs/yd3, and newspaper is about 433 lbs/yd3. (It should be noted that the bulkiness of EPS is also a negative when landfilled and/or transport-ed because it consumes a disproportionate amount of landfill and collection vehicle space in relation to its weight requiring the vehicle to take more trips.) Thus, collection and transportation costs are comparatively very high and inefficient without significant compaction or densification. Compaction and densification requires special equipment, such as grinders and densifiers, to compact EPS into dense blocks for transportation or storage prior to recycling, which are both labor intensive. And, only clean EPS can be
15T.P. Wagner / DETRITUS / Volume 09 - 2020 / pages 11-26
densified. For example, based on a limited cost analysis conducted by Sedona Recycles (Sedona Recycles, 2015); there was a net loss of $725 in recycling an 837-lb pallet of EPS, which was due primarily to the labor involved in den-sifying the material. Because of its high volume to weight ratio, considerable space is also required to store EPS prior to densification. In addition, an EPS food service ware recy-cling program would require a separate collection system.
EPS cannot effectively be collected in a single-stream system because it breaks apart easily. EPS in tiny pieces is too difficult and not cost effective to sort and segregate for market (City of Portland, 2013). Because of the difficul-ty and cost of segregating out EPS, allowing it to remain with other recyclable materials can contaminate the tar-get material thereby further reducing the target material’s post-consumer market value; the lower the contamination of a commodity, the higher value. For example, at materials recovery facilities, EPS fragments can blow throughout the facility often entering the paper stream and causing con-tamination of segregated paper (City of Portland, 2013). EPS food service ware, especially food and beverage con-tainers, are often contaminated with food, oils, grease, and other materials reducing recycling efficiency and its ac-ceptance as a post-consumer commodity. In addition, food residues on containers can also contaminate other mate-rials in single stream systems (FPI, 2014). Consequently, EPS food service ware is generally prohibited from munici-pal curbside and drop-off recycling programs because it is viewed as a contaminant.
China, which has been a major importer of post-con-sumer plastics for recycling, has enacted a series of initia-tives (i.e., Green Fence, National Sword, and Blue Sky) that have essentially banned the import of post-industrial recy-clables beginning in 2018. China’s import policies banned certain recyclable materials, particularly mixed plastics, and instituted exceptionally strict standards on allowable contaminants while increasing compliance inspections of recyclable commodity imports. The ban has caused major upsets for communities that had collected and segregat-ed low grade plastics (RIC #3-7), which include EPS, and now have to pay to have these materials recycled or have chosen to instead, dispose of this material. As noted by Brooks, Wang, and Jambeck (2018), “89% of historical exports of plastic waste consist of polymer groups often used in SUP food packaging…”.
As China’s market has closed, industrialized countries, including the USA, have sought other markets for low grade plastics including Bangladesh, Laos, Ethiopia, Senegal, and Vietnam (McCormick et al., 2019). In response, the unregu-lated dumping of low grade plastics was addressed at the Basel Conference of the Parties in May 2019. The Basel Convention on the Control of Transboundary Movements of Hazardous Wastes and Their Disposal is designed to promote the environmentally sound management of wastes and prevent dumping in less developed countries. The Convention was amended to include plastic waste in a legally-binding framework for Parties to increase the trans-parency and regulation of the global trade of plastic waste (Basel, 2019). The USA, one of the largest producers of plastic waste, is not a Party to the Basel Convention.
5. SOLVING THE PROBLEMThe environmental problem presented is the ubiqui-
tousness of EPS litter and debris in the environment. In constructing a policy goal to solve this specific problem, sustainable materials management provides guidance. Sustainable materials management is a principle strat-egy adopted by the Organization of Economic Coopera-tion and Development OECD Council in 2008 regarding resource productivity (OECD, 2008). As defined by the US EPA (2015), “Sustainable Materials Management (SMM) is an approach to serving human needs by using/reusing resources productively and sustainably throughout their life cycles, generally minimizing the amount of materials involved and all associated environmental impacts.” A prin-ciple philosophy of SMM is to reduce disposal and environ-mental impacts by using less of the material.
By applying the principle philosophy of SMM, a series of hierarchical management approaches can be employed as shown in Figure 2. The preferred approach of SMM is source reduction, or avoidance. Source reduction is crucial because often the greatest environmental and resource demand impacts are at the materials acquisition and manufacturing stages, the upstream, as opposed to the use and post-consumer/end-of-life (EOL) stage, the down-stream. Thus, reducing the creation of a material not only reduces the generation of EOL waste, but also reduces the upstream generation of wastes and associated environ-mental impacts. Source reduction can also include product substitution where less harmful materials are used as a substitute for the target materials or recovered post-con-sumer materials are used to reduce the amount of virgin materials consumed. If, however, source reduction is not appropriate or achievable, and the material is created and used, the priority is to reuse the item. If reuse is not feasi-ble or possible, recycling is the next priority, which seeks to maximize the recovery of the material’s values. Compost-ing can be considered a form of recycling, but it is debat-able as to whether composting, hierarchically speaking, is superior to recovery of materials through recycling. Next in the hierarchy is to extract the energy value from the ma-terial, generally with waste-to-energy facilities. Finally, the least desirable action is disposal through landfilling, or in-cineration without energy recovery.
Based on SMM’s hierarchy, the policy goal proffered here is to reduce or eliminate the consumption of EPS. Because EPS is not reused, unless EPS is replaced with reusable food service ware items, the ability to success-fully recycle or compost alternative food service ware items is crucial (some compostable products have fossil fuel-based coatings rendering them non-compostable in many compost systems). The actually recyclability and compostability of each product, however, are a function of the capabilities, budgets, and preferences of the local solid waste management program. Thus, within the SMM framework, it is insufficient that a product be “recyclable” or “compostable,” which is theoretical, but that it is actual-ly recycled or composted locally. Alternative products that are potentially recyclable include polyethylene terephtha-late (PET, RIC #1), polypropylene (PP, RIC #5), aluminum,

T.P. Wagner / DETRITUS / Volume 09 - 2020 / pages 11-2616
and paper and paperboard. Alternative products that are potentially compostable, depending on the composting op-eration, include plant-based products made from bagasse, cassava starch, potato starch, wheat straw, and palm waste and the bio-plastic polylactic acid (PLA) made from corn or sugarcane, which is also used to coat paper and paperboard products.
One of the major issues with compostability is that most compostable plastics do not readily biodegrade in the natural environment; they require high heat and moisture, which are used in specialized industrial composting facil-ities. According to Goldstein (2019), in the USA, there are only 185 full-scale food waste composting facilities. Based on a survey of these compost facilities, of the respondents (N=95), 37% do not accept Biodegradable Product Institute (BPI) certified compostable paper products and 55% do not accept BPI-certified compostable bioplastic products (Goldstein, 2019).
When focusing specifically on the post-consumer/end-of-life stage of alternatives to EPS, the ability and practice of a product to be effectively recycled or composted are crucial determinants in addition to its fate as litter. In ex-amining EPS’s contributions to land-based litter and marine debris, this is reasonable. Thus, an alternative material that is recycled would have a reduced disposal rate; however, if it not recycled and becomes litter, it can be as problematic as EPS. An additional important comparison is based on the life cycle impacts of each product, which examines the environmental impacts throughout the products’ life cycle from the cradle to the grave. However, there are significant
challenges and limitations to life cycle assessments (LCA) making direct comparisons difficult and potentially mis-leading. For example, there can be significant data gaps, what impact categories are selected, energy type used, spatial variation, land use, resource depletion, uniqueness of local environments, environmental dynamism, treatment of subjective values, and consumer behavior (See for ex-ample, Vendries et al., 2018; Reap at al., 2008). Moreover, LCAs are a snapshot in time to assess current conditions and impacts, which can easily change due to a multitude of factors such as energy source, transportation distances, and local conditions.
Recognizing the limitations of specific LCAs, various studies have been conducted in an attempt to compare EPS and SUP products to available substitutes. For exam-ple, compostable packaging is the best material for sin-gle-use applications when it can be composted locally at EOL (Davis & Song, 2006). In Greece, recycled paper egg cartons had an overall lower environmental impact than polystyrene egg cartons (Zabaniotou & Kassidi, 2003). Based on the LCA, the authors found that polystyrene egg cartons contributed more to acid deposition and photo-chemical ozone by generating seven times more NOx and 16 times more SOx than paper egg cartons while recycled paper egg cartons generated twice as much heavy met-als. In contrast, in Thailand, PLA thermoform boxes had a slightly higher environmental impact than polystyrene boxes when the indirect land use change emissions from growing corn and cassava were included (Suwanmanee et al., 2013). The intent here is not to present an exhaustive
FIGURE 2: SMM minimization hierarchy for EPS and EPS substitutes.
17T.P. Wagner / DETRITUS / Volume 09 - 2020 / pages 11-26
assessment of the various comparisons, but to present an indication of the limitations of comparisons from a LCA perspective while simultaneously heralding the importance of LCAs in guiding the selection of preferable substitutes.
The power of the market is that more environmental-ly preferable substitutes can be produced if sufficient de-mand exists. While demand can be pushed by increased government actions, especially targeted product bans, vol-untary actions can be powerful in increasing the demand for preferable alternatives. For example, Starbucks coffee chain committed US$10 million for the NextGen Cup Chal-lenge to produce a preferable substitute to the disposal cup. Igloo Products Corporation created a reusable and biodegradable cooler (the Recool) designed to replace the disposable EPS cooler.
6. POLICY INSTRUMENTS TO REDUCE CON-SUMPTION OF EPS FOOD SERVICE WARE
As previously discussed, reuse, recycling, and com-posting of fossil fuel-based EPS food service ware are cur-rently not technically feasible and/or economically viable. Reduction, which includes product substitution, is the most preferred goal from a SMM perspective. While the goal of reduction is obvious, with regards to product substitution, the goal is to foster the replacement of EPS with reusa-ble products that contain recycled material or replacement with products that are recycled or composted locally. Again, this does not mean theoretically recyclable or com-postable, but products that actually can be or are recycled or composted locally.
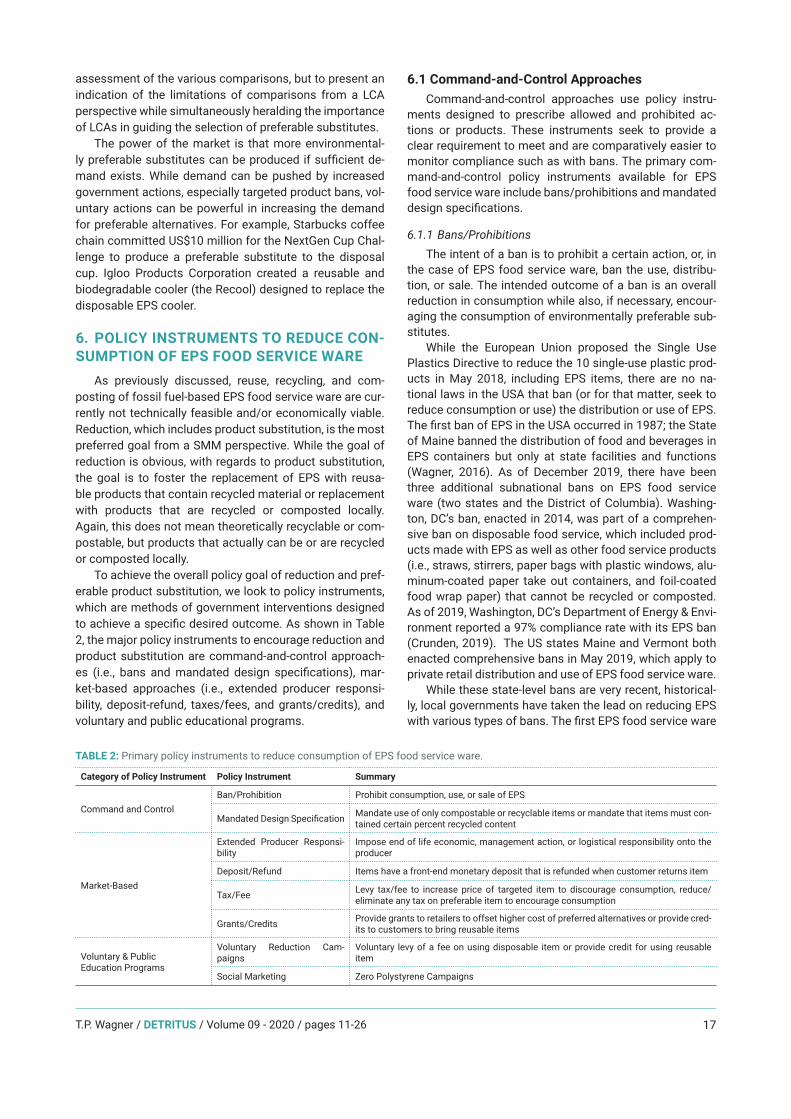
To achieve the overall policy goal of reduction and pref-erable product substitution, we look to policy instruments, which are methods of government interventions designed to achieve a specific desired outcome. As shown in Table 2, the major policy instruments to encourage reduction and product substitution are command-and-control approach-es (i.e., bans and mandated design specifications), mar-ket-based approaches (i.e., extended producer responsi-bility, deposit-refund, taxes/fees, and grants/credits), and voluntary and public educational programs.
6.1 Command-and-Control ApproachesCommand-and-control approaches use policy instru-
ments designed to prescribe allowed and prohibited ac-tions or products. These instruments seek to provide a clear requirement to meet and are comparatively easier to monitor compliance such as with bans. The primary com-mand-and-control policy instruments available for EPS food service ware include bans/prohibitions and mandated design specifications.
6.1.1 Bans/ProhibitionsThe intent of a ban is to prohibit a certain action, or, in
the case of EPS food service ware, ban the use, distribu-tion, or sale. The intended outcome of a ban is an overall reduction in consumption while also, if necessary, encour-aging the consumption of environmentally preferable sub-stitutes.
While the European Union proposed the Single Use Plastics Directive to reduce the 10 single-use plastic prod-ucts in May 2018, including EPS items, there are no na-tional laws in the USA that ban (or for that matter, seek to reduce consumption or use) the distribution or use of EPS. The first ban of EPS in the USA occurred in 1987; the State of Maine banned the distribution of food and beverages in EPS containers but only at state facilities and functions (Wagner, 2016). As of December 2019, there have been three additional subnational bans on EPS food service ware (two states and the District of Columbia). Washing-ton, DC’s ban, enacted in 2014, was part of a comprehen-sive ban on disposable food service, which included prod-ucts made with EPS as well as other food service products (i.e., straws, stirrers, paper bags with plastic windows, alu-minum-coated paper take out containers, and foil-coated food wrap paper) that cannot be recycled or composted. As of 2019, Washington, DC’s Department of Energy & Envi-ronment reported a 97% compliance rate with its EPS ban (Crunden, 2019). The US states Maine and Vermont both enacted comprehensive bans in May 2019, which apply to private retail distribution and use of EPS food service ware.
While these state-level bans are very recent, historical-ly, local governments have taken the lead on reducing EPS with various types of bans. The first EPS food service ware
TABLE 2: Primary policy instruments to reduce consumption of EPS food service ware.
Category of Policy Instrument Policy Instrument Summary
Command and ControlBan/Prohibition Prohibit consumption, use, or sale of EPS
Mandated Design Specification Mandate use of only compostable or recyclable items or mandate that items must con-tained certain percent recycled content
Market-Based
Extended Producer Responsi-bility
Impose end of life economic, management action, or logistical responsibility onto the producer
Deposit/Refund Items have a front-end monetary deposit that is refunded when customer returns item
Tax/Fee Levy tax/fee to increase price of targeted item to discourage consumption, reduce/eliminate any tax on preferable item to encourage consumption
Grants/Credits Provide grants to retailers to offset higher cost of preferred alternatives or provide cred-its to customers to bring reusable items
Voluntary & Public Education Programs
Voluntary Reduction Cam-paigns
Voluntary levy of a fee on using disposable item or provide credit for using reusable item
Social Marketing Zero Polystyrene Campaigns
T.P. Wagner / DETRITUS / Volume 09 - 2020 / pages 11-2618
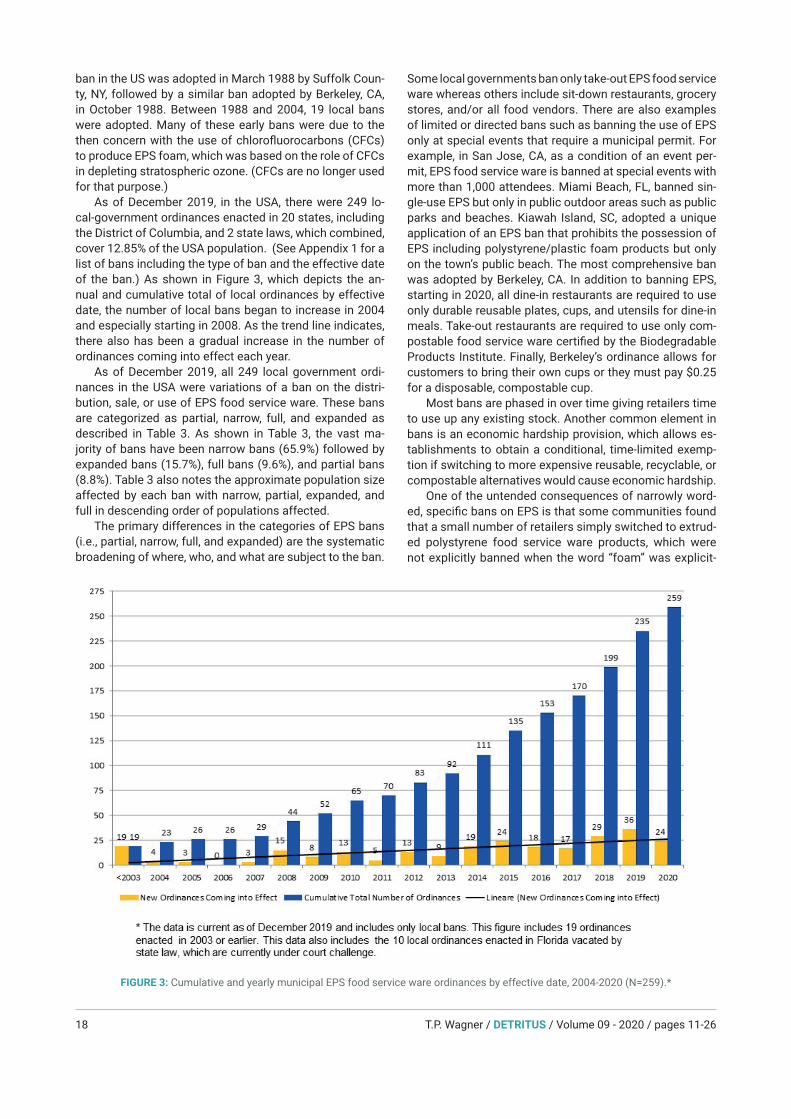
ban in the US was adopted in March 1988 by Suffolk Coun-ty, NY, followed by a similar ban adopted by Berkeley, CA, in October 1988. Between 1988 and 2004, 19 local bans were adopted. Many of these early bans were due to the then concern with the use of chlorofluorocarbons (CFCs) to produce EPS foam, which was based on the role of CFCs in depleting stratospheric ozone. (CFCs are no longer used for that purpose.)
As of December 2019, in the USA, there were 249 lo-cal-government ordinances enacted in 20 states, including the District of Columbia, and 2 state laws, which combined, cover 12.85% of the USA population. (See Appendix 1 for a list of bans including the type of ban and the effective date of the ban.) As shown in Figure 3, which depicts the an-nual and cumulative total of local ordinances by effective date, the number of local bans began to increase in 2004 and especially starting in 2008. As the trend line indicates, there also has been a gradual increase in the number of ordinances coming into effect each year.
As of December 2019, all 249 local government ordi-nances in the USA were variations of a ban on the distri-bution, sale, or use of EPS food service ware. These bans are categorized as partial, narrow, full, and expanded as described in Table 3. As shown in Table 3, the vast ma-jority of bans have been narrow bans (65.9%) followed by expanded bans (15.7%), full bans (9.6%), and partial bans (8.8%). Table 3 also notes the approximate population size affected by each ban with narrow, partial, expanded, and full in descending order of populations affected.
The primary differences in the categories of EPS bans (i.e., partial, narrow, full, and expanded) are the systematic broadening of where, who, and what are subject to the ban.
Some local governments ban only take-out EPS food service ware whereas others include sit-down restaurants, grocery stores, and/or all food vendors. There are also examples of limited or directed bans such as banning the use of EPS only at special events that require a municipal permit. For example, in San Jose, CA, as a condition of an event per-mit, EPS food service ware is banned at special events with more than 1,000 attendees. Miami Beach, FL, banned sin-gle-use EPS but only in public outdoor areas such as public parks and beaches. Kiawah Island, SC, adopted a unique application of an EPS ban that prohibits the possession of EPS including polystyrene/plastic foam products but only on the town’s public beach. The most comprehensive ban was adopted by Berkeley, CA. In addition to banning EPS, starting in 2020, all dine-in restaurants are required to use only durable reusable plates, cups, and utensils for dine-in meals. Take-out restaurants are required to use only com-postable food service ware certified by the Biodegradable Products Institute. Finally, Berkeley’s ordinance allows for customers to bring their own cups or they must pay $0.25 for a disposable, compostable cup.
Most bans are phased in over time giving retailers time to use up any existing stock. Another common element in bans is an economic hardship provision, which allows es-tablishments to obtain a conditional, time-limited exemp-tion if switching to more expensive reusable, recyclable, or compostable alternatives would cause economic hardship.
One of the untended consequences of narrowly word-ed, specific bans on EPS is that some communities found that a small number of retailers simply switched to extrud-ed polystyrene food service ware products, which were not explicitly banned when the word “foam” was explicit-
FIGURE 3: Cumulative and yearly municipal EPS food service ware ordinances by effective date, 2004-2020 (N=259).*

19T.P. Wagner / DETRITUS / Volume 09 - 2020 / pages 11-26
ly used in the ordinance’s definition or applicability. This is a common challenge of narrowly and explicitly worded bans.
Public school systems, which often operate as a some-what separate municipal authority within local govern-ments in the USA, have imposed their own bans, primari-ly on single-use EPS cafeteria food trays, applicable only within the school system. For example, EPS food trays have been banned and replaced with compostable fib-er-based trays in the USA’s six largest school districts with 2.9 million students: New York City, Los Angeles, Chicago, Miami-Dade, Dallas, and Orlando (Layton, 2015). These six school districts collectively serve about 2.5 million meals per day resulting in an annual reduction of approximately 225 million EPS trays. The state of Oregon passed a law in 2015 that banned school districts from using EPS food service ware unless the school district recycles EPS.
6.1.2 Mandated Design SpecificationAnother approach to eliminate EPS food service ware is
to mandate that only recyclable or compostable food serve ware items may be sold or used, which acts as a de facto ban on EPS. Product specification can mandate that items be recyclable, biodegradable, or compostable or that the product contain a specified amount of recycled content. Biodegradable generally means that a product can degrade by naturally occurring microorganisms (e.g., bacteria, fun-gi, and algae) whereas compostable is biodegradable in a composting environment, which means controlled condi-tions. However, the designations of recyclable and com-postable are theoretical; another approach is to specify that a product is recycled or composted locally, which in addition to technical feasibility, also incorporates econom-ics and infrastructure.
For example, the US State of Maine has proposed the term “readily recyclable,” which means a material can be sorted by a Maine-based materials recovery facility and “there has been a consistent market for the material for the previous two calendar years” (Staub, 2020).
Portland, Oregon’s original ordinance of 1989 banned all food vendors from using EPS that was manufactured using chlorofluorocarbons (CFC). The ordinance was sub-sequently modified to eliminate the CFC component. Port-land’s definition of EPS Foam Food Containers means any material composed of EPS and having a closed cell air ca-pacity of 25% or greater, or a density of less than 0.787 grams per cubic centimeter based on an average EPS den-sity of 1.05 grams per cubic centimeter, as determined by an analytical testing laboratory. As argued by Hardy and Charles (2007), Portland’s approach can encourage the use of EPS that is denser. This is another example of the challenges and potential negative unintended consequenc-es when proscribing narrowly and explicitly defined actions in municipal ordinances.
6.2 Market-based ApproachesA primary intent of market-based policy instruments
is to raise the price of non-desirable products and/or low-er the price of desirable products. This approach allows for consumer choice, but modifies the price signal with regard to that choice. The primary market-based policy instruments used for EPS are the imposition of extended producer responsibility, deposit-refunds, taxes/fees, and grants.
6.2.1 Extended Producer Responsibility and Product Stew-ardship
In North America, the primary management responsi-bility for municipal solid waste (MSW) resides with local governments funded by local taxpayers. Because produc-ers are able to externalize costs related to end-of-life (EOL) management of EPS (e.g., collection, recycling, disposal, etc.), the price is distorted through indirect subsidies from local taxpayers. The intent of extended producer respon-sibility (EPR) and Product Stewardship (PS) is to shift the economic cost and/or logistical responsibility of their prod-ucts at EOL from local governments and onto producers and other responsible parties. EPR seeks to require man-
Ban Type Description Prevalence Affected Approximate Population
Partial Ban
Partial Bans apply only to (1) EPS sold by local governments or in public buildings, facilities, and public property (e.g., parks and beaches) and/or (2) sale or distribu-tion of EPS special events (e.g., festivals, parades, concerts, etc.) requiring a local government permit.
8.8% 13.52 million
Narrow Ban
Narrow Bans ban retailers that sell or provide prepared food, including full-service and take-out restaurants, from using or providing EPS food service ware. Some Narrow Ban ordinances include or specifically exclude food trucks. Narrow Bans do not include packaging (e.g., meat and deli trays and egg cartons) for foods sold by grocery stores.
65.9% 21.43 million
Full BanFull Bans include Narrow Bans on EPS, and also prohibit all polystyrene (i.e., foam and extruded) packaging used for meat, poultry, fish, produce, deli, and bakery products and egg containers at grocery stores.
9.6% 1.1 million
Expanded Ban
Expanded Bans include Full Bans and also (1) prohibits retail sale or distribution of EPS food service ware, (2) sale of single-use EPS coolers, and/or (3) sale or distribution of single use plastic (regardless of resin identification code) food service ware related items including utensils, straws, stirrers, lids, cups, plates, and containers.
15.7% 6.09 million
The 249 ordinances are local, municipal ordinances only and do not cover the state-level bans. They do not include the 10 municipal bans in Florida affected by the state preemption law
TABLE 3: Categories, prevalence, and populations covered by EPS food service ware bans, USA (N=249).

T.P. Wagner / DETRITUS / Volume 09 - 2020 / pages 11-2620
ufacturers of specific products to take environmental re-sponsibility for the management of the product throughout its lifecycle with special emphasis on the post-consumer stage. In contrast, PS is a strategy to share the econom-ic and/or logistical responsibility of a product among all responsible parties including the manufacturer, retailer, consumer, and government (Curtis et al., 2014). Both pro-grams seek responsible parties to internalize the costs, which theoretically would encourage them to incorporate sustainable practices into product design including envi-ronmental and economic EOL considerations (McKerlie, Knight, & Thorpe, 2006) and consumption. EPR and PS have been adopted by national governments and sub-na-tional governments in North America, Europe, and Asia for multiple product categories including electronics, product packaging, beverage containers, fluorescent lights, batter-ies, cell phones, mercury-thermostats, architectural paint, mattresses, and carpet.
In the State of Maine, PS for electronic waste was im-plemented in 2006, which required waste electronics to be certified that they were recycled in an environmentally sound manner. Households had to deliver their electronics to a designated municipal or retail collection point where they may have to pay a fee. Local governments had to col-lect, document, and prepare for shipment all household electronic waste. Consolidators collected, transported, and recycled the waste. Producers were required to pay the consolidators for the transportation and recycling costs, which shifted the costs away from local governments (and in most cases, households) and shared the costs among all parties, with producers paying the majority of costs. In the first three years of the program there was a 221% increase in the number of electronic items collected and properly re-cycled (Wagner, 2009). The upsurge in collection rates was a result of the dramatic increase in convenient drop-off locations at municipalities and non-profits, a reduction or elimination of fees previously charged to households due to producer financing, public education and outreach, and a subsequent disposal ban on electronic waste starting in 2007 (Wagner, 2009).
While the electronic waste PS program in Maine has been successful, in contrast, two other PS–based pro-grams in Maine, covering mercury thermostats and mercu-ry-containing compact fluorescent lamps, have not been successful. The mercury thermostat program requires producers to pay a US$5.00 bounty for each wall-mount-ed thermostat it collects, but the recovery rate has nev-er exceeded 13% in any year (MDEP, 2019). Similarly, the collection and recycling of mercury-containing compact fluorescent lamps are funded by the lamp industry, but the lamp recovery rate has been only 10.15% (MDEP, 2019). Some of the primary reasons why these programs have not been as successful as the electronic waste program include the number of collection sites, public awareness, and most importantly, the funding responsibility. While all three programs are funded by the producers, only the electronic waste program is basically operated by an inde-pendent third party, the consolidators, which are incentiv-ized to collect as much electronic waste as possible with the costs passed onto the producers. In contrast, there is
no independent third party running the collection and re-cycling in the thermostat and fluorescent lamp programs. Consequently, there is an inherent economic disincentive for producers of thermostats and compact fluorescent lamps to collect and recycle their products. This disin-centive manifests itself in a lack of education and public outreach, fewer collection sites, and imposition of burden-some paperwork.
While EPR and PS-based programs are an option for states in the USA, local governments charged with the responsibility to manage MSW lack the legal authority to adopt EPR. Regarding EPS food service ware, thus far, no state (or local governments) in the USA has adopted EPR.
6.2.2 Deposit/RefundA type of PS-based program is the deposit/refund
system, in which the manufacturer, retailer, and consum-er typically share some responsibility to implement the system. Deposit/refund programs have been used for beverage containers, used motor oil, tires, and automotive lead-acid batteries. According to the Container Recycling Institute (2013), USA states with beverage container de-posit-refund programs achieve container recycling rates of between 70% and 95% while states without deposit-refund programs achieve container recycling rates of about 22%. The application of a deposit-refund system can be applied to select, reusable food service ware where the meal or beverage is intended to be consumed onsite such as the informal pfand (deposit) system in Germany. In addition to Germany’s official pfand system covering beverage containers where deposits and refunds are managed at re-tail beverage and grocery stores, there is also an informal pfand system widely used for reusable food service items (plates, cups, glasses, mugs, and utensils) at festivals and food and beverage kiosks. The system works by charging a customer a separate pfand (e.g., 1€) above the price of the food or beverage. The customer is typically given a plastic or wooden token that when returned along with the covered food service ware item, receives the deposit back. This demonstrates that such a system can be adopted on a voluntary basis by any establishment, but it could also be adopted as a local ordinance for appropriate food and beverage service operations.
6.2.3 Taxes/FeesThe primary goal of levying taxes and fees is to directly
raise the price of a targeted product to discourage its con-sumption. Taxes/fees do not prohibit the use or sale of a product or behavior so it maintains consumer choice. High-ly visible, small taxes/fees are often referred to as nudges as they are intended to encourage a specific behavior or action rather than impose an economic hardship (Rivers, Shenstone-Harris, & Young, 2017). To be most effective, fees and taxes need to be levied at the point of sale. As noted by Bury (2010), a separate, visible point-of-sale tax or fee can prompt the customer to internalize the cost. In response, overall consumption will decrease when custom-ers are presented with a higher price because of the tax or fee. Taxes/fees for EPS food service ware can be defined as a litter, eco, or disposal tax/fee signaling the negative
21T.P. Wagner / DETRITUS / Volume 09 - 2020 / pages 11-26
impact that is being taxed. Local government fees have been very successful in
reducing the consumption of SUP shopping bags (Wagner, 2017). To support France’s goal of recycling 100% of its plastic waste by 2025, starting in 2019, plastic items not containing recycled plastic will be taxed. Similarly, start-ing in 2020, the UK will impose a plastic packaging tax for items containing less than 30% recycled materials. The UK also has proposed £0.25 tax on all disposable cups (e.g., the “latte tax”).
Thus far, there have been no national or sub-national laws in the USA that tax EPS food service ware and only two local ordinances thus far have adopted a tax/fee. In 2019, Berkeley, California’s EPS ordinance adopted a dis-posable cup tax: restaurants and coffee shops are required to charge customers $0.25 when they do not bring a reusa-ble cup for their beverage. Similarly, Watsonville, California requires retailers to charge customer $0.10 for a dispos-able cup.
A variation of the tax/fee strategy is for local govern-ments to authorize private establishments to charge fees rather than to impose them for all establishments. For example, Sebastopol, California’s polystyrene ordinance authorizes retailers to charge customers up to $0.10 for takeout food packed in disposable packaging.
6.2.4 Grants/CreditsGrants are economic tools to provide direct economic
incentives to an entity to engage in an action or to purchase a good that may not otherwise be done or purchased be-cause of higher costs. Grants can be used to reduce costs of the preferable product. There have been minimal efforts in the USA to provide grants to reduce EPS food service ware. In one case, Encinitas, CA, offered a $400 grant for switching from EPS food service ware prior to the citywide ban, which was designed to offset the initial higher cost of purchasing EPS substitutes.
Monetary credits can be offered to engage in a pre-ferred action such as for a customer utilizing their own reusable containers. Sebastopol, California’s polystyrene ordinance encourages retailers to provide a credit of up to $0.25 to customers who bring their own reusable takeout containers.
6.3 Voluntary and Public Education ProgramsVoluntary programs seek to challenge or foster private
entities to engage in a preferred action or behavior such as offering substitutes to EPS food service ware. Voluntary programs for reduction of EPS consumer products tend to be local or regional in nature, are adopted by companies supporting corporate responsibility, or can be adopted as a means to reduce or obviate the need for potential regula-tion. While not EPS, in 2018, Starbucks in the UK voluntarily imposed a £0.05 fee on paper take away cups. Prior to this self-imposed fee, Starbucks was offering a £0.25 credit for customers who brought their own reusable cup; however, the usage rate of reusable cups throughout UK’s Starbucks was only 2.3% (HUBUB, 2018). A pilot study was conducted at Starbucks’ 35 London, UK stores. The study found that a £0.05 fee on paper cups, coupled with a £0.25 discount
for bringing a reusable cup increased the proportion of hot beverages sold in reusable cups from the baseline of 2.2% to 5.8% (HUBUB, 2018). The control group had a 1.1% in-crease in reusable cup usage during the same time period likely from company-sponsored education and outreach (HUBUB, 2018).
Another example is a voluntary monthly subscription service for closed-loop reusable bowls at take-out restau-rants (Fassler, 2019). As described by the author, with this model, subscribers pay a small monthly fee, which allows them to “check-out” a single reusable take-out container from the restaurant and return it to be replaced with a clean reusable take-out container.
Based in Atlantic Beach, FL, Girls Gone Green is a re-gional non-profit group that has created the “Hang Up The Foam” campaign. The group uses online media to encour-age customers to request non-EPS food service ware, they distribute a brochure to restaurants to help them voluntary reduce EPS, and they offer technical assistance to restau-rants to find viable substitutes. Governments can promote voluntary programs through information sharing and coop-erative purchasing assistance to increase access and re-duce costs of EPS alternatives (CCEAC, 2018).
Another approach to educate the public is to focus on the negative effects of EPS, especially litter. Litter-based education is used to increase awareness of the negative impacts of litter while increase awareness as to the proper placement of EPS in trash receptacles to prevent litter. The expectation is that the target audience will then not litter. This is often done through social marketing, which uses traditional commercial marketing approaches to change human behavior for social good. West Coast cities in the USA spend an average of $80,927 on public education to discourage littering (Stickel, Jahn, & Kier, 2012). Unfortu-nately, knowledge is not the sole determinant in an indi-vidual’s proper waste management actions as cost and convenience are far more influential (Wagner, 2013). If ed-ucation alone was successful, ordinances would be unnec-essary; however, education has had only limited success with regards to reducing EPS (Wagner, 2016). To be sure, education is essential in bringing to light and understand-ing the problem and providing baseline knowledge to pro-mote and support an adopted solution.
Similar to voluntary campaigns, education campaigns are often undertaken by local or regional groups. For exam-ple, the 5 Gyre Institute has adopted the “Nix the 6” social marketing campaign asking individuals to pledge to avoid polystyrene products (RIC #6). The Universiti Teknologi Malaysia adopted its Zero Polystyrene Campaign to en-courage students to bring reusable containers while si-multaneously introducing a biodegradable container made from oil-palm waste produced in Malaysia. The city of Man-hattan Beach, CA, started its “Bring Your Own!” campaign to encourage the public to bring reusable containers, cups, straws, and utensils whenever possible.
7. CONCLUSIONSThe widespread dispersal of plastic waste through-
out the environment has captured the world’s attention.
T.P. Wagner / DETRITUS / Volume 09 - 2020 / pages 11-2622
It is a symptom of a global problem: seemingly insatiable consumption of plastics coupled with poor EOL manage-ment of plastics. One of the contributors of this problem is EPS food service ware. Its consumption continues to increase in spite of the lack of environmentally preferable EOL management. Moreover, the use of EPS food service ware presents an economic burden to local governments’ solid waste management efforts because of its limited recyclability and the costs of litter and stormwater sys-tem clean-up. There are also economic and social costs included in the negative impacts of EPS litter to local governments from reduced tourism and blocked storm drains. Given that reuse, recycling, and composting of EPS are not currently viable options, based on SMM, the primary policy goal should be to reduce the consumption of EPS food service ware. In the USA, this goal has been the focus as 249 local governments and 2 states (and the District of Columbia) have banned EPS to varying de-grees. While most of the bans have focused on EPS food service containers, increasingly, bans have included EPS packaging (e.g., deli and food trays, egg cartons) and oth-er materials (e.g., EPS coolers and packing material and SUP utensils). An intended consequence of these bans has been to foster the switch to environmentally preferred substitutes that are locally recycled and/or composted. The adoption of fees for single-use cups has also recently been adopted as means to retain customer choice while achieving the goals of reduction and preferable product substitution.
To be sure, reducing EPS and increasing the use of environmentally preferable food service ware substitutes is a complex challenge. Until recently we have relied on private markets to solve the problem by producing a via-ble and cost-effective substitute to EPS. However, as ev-idenced by the continued build-up of plastic waste, litter, and debris and the increasing consumption of EPS with no economically viable post-consumer market, government intervention to solve the problem has increased. In the ab-sence of national and state actions, and given that local governments shoulder the economic burden of MSW man-agement in the USA, they have taken the lead on adopting ordinances to reduce their costs and reduce local environ-mental impacts primarily through bans.
ACKNOWLEDGMENTSSpecial thanks to the anonymous reviewers for critical-
ly reading the manuscript and suggesting substantial im-provements.
REFERENCESAllen, S., Allen, D., Phoenix, V. R., Le Roux, G., Jiménez, P. D., Simonneau,
A., ... & Galop, D. (2019). Atmospheric transport and deposition of microplastics in a remote mountain catchment. Nature Geosci-ence, 12(5), 339.
Barnes, M., Chan-Halbrendt, C., Zhang, Q., & Abejon, N. (2011). Con-sumer preference and willingness to pay for non-plastic food containers in Honolulu, USA. Journal of Environmental Protection, 2(9), 1264-1273
Basel. (2019). Basel Convention, Plastics, Overview. Secretariat of the Basel Convention. Retrieved from http://www.basel.int/implemen-tation/plasticwastes/overview/tabid/6068/default.aspx.
Beaumont, N. J., Aanesen, M., Austen, M. C., Börger, T., Clark, J. R., Cole, M., ... & Wyles, K. J. (2019). Global ecological, social and economic impacts of marine plastic. Marine Pollution Bulletin, 142, 189-195.
Brooks, A. L., Wang, S., & Jambeck, J. R. (2018). The Chinese import ban and its impact on global plastic waste trade. Science Advanc-es, 4(6), eaat0131. DOI: 10.1126/sciadv.aat0131.
Burnett, H.S. (2013). Do bans on plastic grocery bags save cities mon-ey? Report #353. National Center for Policy Analysis. Retrieved from http://www.ncpa.org/pdfs/st353.pdf.
Bury, D.R. (2010). Policy forum: Should extended producer responsibil-ity programs use eco-fee-included pricing? Canadian Tax Journal, 584, 927-950.
CCEAC. (2018). Carroll County Environmental Advisory Council. Ex-panded PS (EPS) reduction in Carroll County: single-use food ser-vice ware and loose fill packaging products. Retrieved from http://ccgovernment.carr.org/ccg/eac/docs/EPS%20Report%20-%202018-Sep-19%20Final%20(w%20Appen).pdf?x=1545941935275
City of Portland. (2013). Report of the majority of the green packag-ing working group recommending a ban on the sale of PS foam food packaging in Portland. Retrieved from http://www.portland-maine.gov/AgendaCenter/ViewFile/Agenda/03192014-272?pack-et=true.
City of San Diego. (2016). City of San Diego, expanded PS food con-tainer recycling study. Retrieved from docs.sandiego.gov/council-comm_agendas_attach/2016/enviro_161012_9.pdf.
Clearwater Mills. (2010). Mr. Trash Wheel™:a proven solution to ocean plastics. Retrieved from https://www.mrtrashwheel.com.
Columbia University. (2015). Quantifying the financial costs to commu-nities of managing trash in the Hudson-Raritan estuary. Prepared for the New York Department of Environmental Conservation and the USA Environmental Protection Agency, Region 2. Retrieved from http://mpaenvironment.ei.columbia.edu/files/2015/06/Quantifying-the-Costs-of-Managing-Marine-Debris_FINAL.pdf
Container Recycling Institute. (2013). Bottled up (2000-2010) - bever-age container recycling stagnates.
Cox, K. D., Covernton, G. A., Davies, H. L., Dower, J. F., Juanes, F., & Dudas, S. E. (2019). Human consumption of microplastics. Envi-ronmental Science & Technology, 53(12), 7068-7074.
Cózar, A., Echevarría, F., González-Gordillo, J. I., Irigoien, X., Úbeda, B., Hernández-León, S., ... & Fernández-de-Puelles, M. L. (2014). Plas-tic debris in the open ocean. Proceedings of the National Academy of Sciences, 111(28), 10239-10244.
Crunden, E.A. (2019). Increasingly popular single-use bans pose hur-dle for plastics industry. Waste Dive. Retrieved from https://www.wastedive.com/news/plastics-bans-taxes-straws-circular-econo-my-panel/565669.
Curtis, C., Collins, S., Cunningham, S., Stigler, P., & Novotny, T. E. (2014). Extended producer responsibility and product stewardship for to-bacco product waste. International Journal of Waste Resources, 4(3), 157-165.
Davis, G., & Song, J. H. (2006). Biodegradable packaging based on raw materials from crops and their impact on waste management. In-dustrial Crops and Products, 23(2), 147-161.
EOA. (2014). San Francisco Bay Area stormwater trash generation rates. Prepared for the Bay Area Stormwater Management Agen-cies Association (BASMAA). Retrieved from https://www.water-boards.ca.gov/sanfranciscobay/water_issues/programs/storm-water/MRP/BASMAA_Trash_Generation_Rates_Final_Report.pdf.
EPS. (2012). Economic impact analysis of EPS food service ware costs. Prepared for City of San Jose. Prepared by Economic & Planning Systems Inc. Retrieved from https://www.sanjoseca.gov/Archive/ViewFile/Item/2025.
Fassler. J. (2019). Can a new reusable container program—dishwash-ing included—help solve America’s takeout trash problem? The New Food Economy. October 10, 2019. Retrieved from https://newfoodeconomy.org/dig-reusable-container-canteen-pfas.
FCSHWM. (2003). Litter from solid waste collection trucks, Report #03-04. Florida Center for Solid and Hazardous Waste Manage-ment. Retrieved from https://www.hinkleycenter.org/images/sto-ries/publications/wastetrucklitter.pdf.
FPI. (2014). Food residue in food service packaging recycling: over-view of FPI food residue studies. Food Packaging Institute, Octo-ber 2014.
Galgani, F., Hanke G., & Maes T. (2015). Global distribution, composi-tion and abundance of marine litter. In: Bergmann M., Gutow L., Klages M. (eds) Marine Anthropogenic Litter. Springer, Cham.
23T.P. Wagner / DETRITUS / Volume 09 - 2020 / pages 11-26
Goldstein, N. (2019). Food waste composting infrastructure in the USA BioCycle, 60(1), 23.
Hardy, M., & Charles, J.A., Jr. (2007). Sustainable failure: why Portland’s EPS foam ban should be repealed. Cascade Policy Institute. Re-trieved from http://cascadepolicy.org/pdf/env/200712_sustaina-ble_failure.pdf.
Heverly, S. (2017). Recommendations for reducing or banning foam food service ware: an analysis of economic and environmental impacts of PS policies. Equinox Project Center for Sustainable En-ergy. Retrieved from https://energycenter.org/sites/default/files/Guide_for_PS_Reduction_Policies.pdf
HUBBUB. (2018). Impact report: disposable cup charge. Re-trieved from http://s3.amazonaws.com/document.issuu.com/180709133754-58e2ea525b8ec7360710161cea493c0c/original.file?AWSAccessKeyId=AKIATDDRE5J74BSJXDAH&Ex-pires=1571527834&Signature=4mS%2F72OUCxY8Q4JorFjp-7MxxWBY%3D.
IWMB. (2004). Use and disposal of PS in California: a report to the California Legislature. Integrated Waste Management Board. Re-trieved from http://www.calrecycle.ca.gov/publications/Detail.as-px?PublicationID=1011.
Jambeck, J. R., Geyer, R., Wilcox, C., Siegler, T. R., Perryman, M., An-drady, A., ... & Law, K. L. (2015). Plastic waste inputs from land into the ocean. Science, 347(6223), 768-771.
Keybridge Research. (2009). Quantifying the potential economic im-pacts of a ban on PS foam food service wares in California. Pre-pared for Pactiv Corporation and the American Chemistry Council.
LA County. (2011). Expanded PS food containers in Los Angeles Coun-ty, part two: feasibility of implementing a restriction of expanded PS food containers at county unincorporated area retailers. Pre-pared for the Los Angeles County Board of Supervisors by the Los Angeles County. Retrieved from http://file.lacounty.gov/green/cms1_189336.pdf.
Law, K.L. (2017). Plastics in the marine environment. Annual Review of Marine Science, 9, 205–229.
Layton, L. (2015). Six of the nation’s largest school districts dump polystyrene trays. The Washington Post. May 24, 2015. Re-trieved from https://www.washingtonpost.com/local/education/six-of-the-nations-largest-school-districts-dump-polystyrene-trays/2015/05/24/3abb5636-00b4-11e5-8b6c-0dcce21e223d_story.html?utm_term=.7190e2834b25.
Leggett, C. G., Scherer, N., Haab, T. C., Bailey, R., Landrum, J. P., & Do-manski, A. (2018). Assessing the economic benefits of reductions in marine debris at Southern California beaches: a random utility travel cost model. Marine Resource Economics, 33(2), 133-153.
MB Public Affairs. (2017). Fiscal impacts of prohibiting expanded SUP food service ware in Maryland, SB 186 & HB 229, Preliminary Es-timates.
McKerlie, K., Knight, N., & Thorpe, B. (2006). Advancing extended pro-ducer responsibility in Canada. Journal of Cleaner Production, 14(6-7), 616-628.
McCormick, E., Murray, B., Fonbuena, C., Kijewski, L., Saraçoğlu, G., Fuulerton, J. …(2019, June 17). Where does your plastic go? Global investigation reveals America’s dirty secret. The Guardi-an. Retrieved from https://www.theguardian.com/us-news/2019/jun/17/recycled-plastic-america-global-crisis.
MDEP. (2019). Annual product stewardship report. Maine Depart-ment of Environmental Protection. Report to the Joint Standing Committee on the Environment and Natural Resources. Re-trieved from https://www.maine.gov/tools/whatsnew/attach.php?id=1086794&an=1.
MWCOG. (2015). Montgomery County: Anacostia trash TMDL monitor-ing-related efforts technical memorandum 2013 - 2014. Metropol-itan Washington Council of Governments. Prepared for the Mont-gomery County Department of Environmental Protection.
NYC Department of Sanitation. (2017). Determination on the recycla-bility of food-service foam. Retrieved from https://www1.nyc.gov/assets/dsny/docs/2017-05-12FoamDetermination_FINAL.pdf.
OECD. (208). Recommendation of the council on resource productivity. Meeting of the Environment Policy Committee (EPOC) at Minis-terial Level Environment and Global Competitiveness, 28-29 April 2008. Organisation of Economic Co-operation and Development. Retrieved from https://www.oecd.org/env/40564462.pdf
Ocean Conservancy. (2019). The beach and beyond. International Coastal Cleanup 2018 Report. Retrieved from https://oceancon-servancy.org/wp-content/uploads/2019/09/Final-2019-ICC-Re-port.pdf.
Pender, K. (2005). Adding up the cost of bags. SF Gate, January 25, 2005. Retrieved from http://www.sfgate.com/business/networth/article/Adding-up-the-cost-of-bags-2703028.php.
Plastics Insight. (2019). Polystyrene (PS): Production, market, price and its properties. Retrieved from https://www.plasticsinsight.com/resin-intelligence/resin-prices/polystyrene.
Reap, J., Roman, F., Duncan, S., & Bras, B. (2008). A survey of unre-solved problems in life cycle assessment. The International Jour-nal of Life Cycle Assessment, 13(5), 374.
Rivers, N., Shenstone-Harris, S., & Young, N. (2017). Using nudges to reduce waste? The case of Toronto’s plastic bag levy. Journal of Environmental Management, 188, 153-162.
Romanow, K. (2012). Bring your own bag ordinace [sic] implementa-tion results and actions to reduce EPS foam food service wares. Memorandum to the City of San Jose, CA, Transportation and En-vironment Committee. November 20, 2012. Retrieved from http://www3.sanjoseca.gov/clerk/CommitteeAgenda/TE/20121203/TE20121203_d5.pdf.
San Diego. (2019). Curbside Recyclable materials processing & market-ing contracts with Allan Company and EDCO Disposal Corporation. Memorandum, June 13, 2019. Retrieved from https://onbase.sand-iego.gov/OnBaseAgendaOnline/Documents/ViewDocument/Staff%20Report%20for%20-%20%20().pdf?meetingId=1470&doc-umentType=Agenda&itemId=36822&publishId=196950&isSec-tion=false.
San Jose. (2013). EPS foam disposable food service ware ordinance. City of San Jose, CA. Retrieved from www.cupertino.org/Modules/ShowDocument.aspx?documentid=7699.
Schert, J. (2000). Picking up after the collection crew. Resource Recy-cling, 19(8), 34-39.
Sedona Recycles. (2015). The real cost of recycling foam plastic. Re-trieved from http://www.sedonarecycles.org/general/news/the-re-al-cost-of-recycling-foam-plastic.
Smith, E. (2017). The brief, confusing history of foam packaging. Atlas Obscura. Retrieved from https://www.atlasobscura.com/articles/styrofoam-history.
Smith, M., Love, D. C., Rochman, C. M., & Neff, R. A. (2018). Microplas-tics in seafood and the implications for human health. Current En-vironmental Health Reports, 5(3), 375-386.
Staub, C. (2020). Northeast state takes next step toward EPR for pack-aging. Resource Recycling. Retrieved from https://resource-recy-cling.com/recycling/2020/01/21/northeast-state-takes-next-step-toward-epr-for-packaging.
Stickel, B. H., Jahn, A., & Kier, B. (2012). The cost to West Coast com-munities of dealing with trash, reducing marine debris. Retrieved from https://www.coastal.ca.gov/publiced/coordinators/West-CoastCommsCost-MngMarineDebris.pdf.
Suwanmanee, U., Varabuntoonvit, V., Chaiwutthinan, P., Tajan, M., Mungcharoen, T., & Leejarkpai, T. (2013). Life cycle assessment of single use thermoform boxes made from polystyrene (PS), poly-lactic acid,(PLA), and PLA/starch: cradle to consumer gate. The International Journal of Life Cycle Assessment, 18(2), 401-417.
UNEP (2018). EPS: a roadmap for sustainability. United Nations Envi-ronment Programme. Retrieved from https://wedocs.unep.org/bit-stream/handle/20.500.11822/25496/singleUsePlastic_sustaina-bility.pdf?isAllowed=y&sequence=1.
US Census Bureau. (2016). Families and living arrangements. Retrieved from www.census.gov/hhes/families/data/households.html.
US Census Bureau. (2019) Real median personal income in the United States [MEPAINUSA672N]. Retrieved from https://fred.stlouisfed.org/series/MEPAINUSA672N.
USDA, (2018). New USA food expenditure estimates find food-away-from-home spending is higher than previous estimates. USA De-partment of Agriculture. Retrieved from https://www.ers.usda.gov/amber-waves/2018/november/new-us-food-expenditure-es-timates-find-food-away-from-home-spending-is-higher-than-pre-vious-estimates.
US EPA. (2015). Sustainable materials management (SMM) - materials and waste management in the United States key facts and figures: Data set. Retrieved from https://edg.epa.gov/metadata/catalog/search/resource/details.page?uuid=%7BC9310A59-16D2-4002-B36B-2B0A1C637D4E%7D.

T.P. Wagner / DETRITUS / Volume 09 - 2020 / pages 11-2624
US EPA. (2018). Advancing sustainable materials management: facts and figures 2015. US Environmental Protection Agency. Retrieved from https://www.epa.gov/sites/production/files/2018-07/docu-ments/smm_2015_tables_and_figures_07252018_fnl_508_0.pdf.
US EPA. (2019). Advancing sustainable materials management: 2017 fact sheet. US Environmental Protection Agency. Retrieved from https://www.epa.gov/sites/production/files/2019-11/docu-ments/2017_facts_and_figures_fact_sheet_final.pdf.
Vendries, J., Hawkins, T. R., Hottle, T., Mosley, J., Allaway, D., Canepa, P., ... & Mistry, M. (2018). the significance of environmental attributes as indicators of the life cycle environmental impacts of packaging and food service ware. Franklin Associates. Retrieved from https://www.oregon.gov/deq/FilterDocs/MaterialAttributes.pdf.
Wagner, T. P. (2009). Shared responsibility for managing electronic waste: A case study of Maine, USA. Waste Management, 29(12), 3014-3021.
Wagner, T. P. (2013). Examining the concept of convenient collection: An application to extended producer responsibility and product stewardship frameworks. Waste Management, 33(3), 499-507.
Wagner, T. (2016). Municipal approaches in Maine to reduce single-use consumer products. Maine Policy Review, 25(2), 31-43. http://digi-talcommons.library.umaine.edu/mpr/vol25/iss2/7.
Wagner, T. P. (2017). Reducing single-use plastic shopping bags in the USA. Waste Management, 70, 3-12.
Wagner, T.P., & Broaddus, N. (2016). The generation and cost of litter resulting from the curbside collection of recycling. Waste Manage-ment, 50, 3-9.
Wagner, T.P., Toews, P., & Bouvier, R. (2013). Increasing diversion of household hazardous wastes and materials through mandated retailer take-back. Journal of Environmental Management, 123, 88-97.
Wang, J., Tan, Z., Peng, J., Qiu, Q. and Li, M., 2016. The behaviors of microplastics in the marine environment. Marine Environmental Research, 113, pp.7-17.
Weigel, B. (2018). More than a year before Styrofoam ban is to take effect, vendor for free recycling pulls plug. Baltimore Fish Bowl. Retrieved from https://baltimorefishbowl.com/stories/more-than-a-year-before-styrofoam-ban-is-to-take-effect-vendor-for-free-recy-cling-pulls-plug.
Weithmann, N., Möller, J. N., Löder, M. G., Piehl, S., Laforsch, C., & Freitag, R. (2018). Organic fertilizer as a vehicle for the entry of microplastic into the environment. Science Advances, 4(4), eaap8060.
Zabaniotou, A., & Kassidi, E. (2003). Life cycle assessment applied to egg packaging made from polystyrene and recycled paper. Journal of Cleaner Production, 11(5), 549-559.
APPENDIX 1 List and type of municipal bans on EPS food service ware in the USA as of December 2019 (N=259).
City State Ban Type Effective Date
Bethel AK Partial 2010
Cordova AK Narrow 2016
Seward AK Narrow 2019
Fayetteville AR Narrow 2019
Alameda city CA Expanded 2018
Alameda County CA Narrow 2008
Albany CA Narrow 2008
Aliso Viejo CA Narrow 2005
Arcata CA Narrow 2015
Arroyo Grande CA Narrow 2016
Avalon CA Narrow 2018
Belmont CA Narrow 2012
Berkeley CA Narrow 1988
Brisbane CA Narrow 2014
Burlingame CA Narrow 2012
Calabasas CA Narrow 2008
Campbell CA Narrow 2015
Capitola CA Narrow 2009
Carmel CA Narrow 1989
Carpentaria CA Expanded 2009
Colma CA Narrow 2013
Concord CA Narrow 2019
Contra Costa CA Narrow 2020
Costa Mesa CA Partial 2019
Culver City CA Expanded 2017
Cupertino CA Narrow 2014
Daly City CA Narrow 2012
Dana Point CA Narrow 2012
Davis CA Expanded 2017
City State Ban Type Effective Date
Del Rey Oaks CA Narrow 2010
El Cerrito CA Narrow 2014
Emeryville CA Expanded 2008
Encinitas CA Narrow 2017
Fairfax CA Narrow 1993
Fort Bragg CA Narrow 2015
Foster City CA Narrow 2012
Fremont CA Expanded 2011
Gonzales CA Narrow 2015
Greenfield CA Narrow 2015
Grover Beach CA Expanded 2018
Half Moon Bay CA Narrow 2011
Hayward CA Narrow 2011
Hercules CA Narrow 2008
Hermosa Beach CA Expanded 2020
Huntington Beach CA Narrow 2004
Imperial Beach CA Narrow 2018
Lafayette CA Narrow 2015
Laguna Beach CA Narrow 2008
Laguna Hills CA Partial 2004
Laguna Woods CA Narrow 2013
Livermore CA Narrow 2011
long Beach CA Expanded 2018
Los Altos CA Expanded 2014
Los Altos Hills CA Narrow 2012
Los Angeles City CA Partial 2008
Los Angeles County CA Partial 2010
Los Gatos CA Narrow 2015
Malibu CA Narrow 2005

25T.P. Wagner / DETRITUS / Volume 09 - 2020 / pages 11-26
City State Ban Type Effective Date
Manhattan Beach CA Full 2013
Marin County CA Narrow 2010
Marina CA Narrow 2012
Martinez City CA Narrow 1995
Mendocino County CA Narrow 2014
Menlo Park CA Narrow 2012
Mill Valley CA Narrow 2009
Millbrae CA Expanded 2008
Milpitas CA Narrow 2018
Monterey City CA Narrow 2009
Monterey County CA Narrow 2010
Morgan Hill CA Narrow 2014
Morro Bay CA Expanded 2016
Mountain View CA Expanded 2014
Newport Beach CA Narrow 2008
Novato CA Narrow 2014
Oakland CA Narrow 2007
Ojai CA Narrow 2014
Orange County CA Partial 2005
Pacific Grove CA Narrow 2008
Pacifica CA Narrow 2010
Palo Alto CA Expanded 2010
Pasadena CA Narrow 2017
Petaluma CA Partial 2020
Pismo Beach CA Narrow 2016
Pittsburg CA Narrow 1993
Pleasanton CA Narrow 2013
Portola Valley CA Narrow 2012
Rancho Cucamonga CA Partial 1989
Redwood City CA Narrow 2013
Richmond CA Expanded 2009
Salinas CA Narrow 2012
San Bruno CA Narrow 2010
San Carlos CA Narrow 2012
San Clemente CA Narrow 2011
San Diego CA Expanded 2019
San Francisco CA Expanded 2007
San Jose CA Narrow 2014
San Juan Capistrano CA Narrow 2004
San Leandro CA Narrow 2012
San Luis Obispo CA Narrow 2016
San Luis Obispo County CA Expanded 2020
San Mateo CA Narrow 2013
San Mateo County CA Partial 2008
San Pablo CA Narrow 2015
San Rafael CA Narrow 2013
Santa Barbara CA Narrow 2019
Santa Clara City CA Narrow 2014
Santa Clara County CA Narrow 2013
Santa Cruz City CA Expanded 2008
Santa Cruz County CA Expanded 2008
Santa Monica CA Narrow 2007
City State Ban Type Effective Date
Sausalito CA Narrow 2008
Scotts Valley CA Narrow 2009
Seaside CA Full 2010
Sebastopol CA Full 2019
Solana Beach CA Narrow 2015
Sonoma City CA Narrow 2015
Sonoma County CA Narrow 1989
South Lake Tahoe CA Expanded 2018
South Pasadena CA Full 2018
South San Francisco CA Narrow 2008
Sunnyvale CA Expanded 2014
Ukiah CA Narrow 2015
Union CA Narrow 2017
Ventura County CA Partial 2004
Walnut Creek CA Narrow 2014
Watsonville CA Expanded 2009
West Hollywood CA Narrow 1990
Yountville CA Narrow 1989
Hamden CT Narrow 1990
Norwalk CT Expanded 2020
Westport CT Narrow 2019
Washington DC Expanded 2017
Alachua County* FL Narrow 2020
Bal Harbour* FL Narrow 2014
Bay Harbor Islands* FL Narrow 2015
Coral Gables* FL Narrow 2016
Deerfield Beach FL Partial 2017
Gainesville* FL Full 2019
Hollywood* FL Narrow 1996
Key Biscayne* FL Narrow 2014
Miami Beach FL Partial 2014
Miami-Dade FL Partial 2017
North Bay Village* FL Narrow 2015
Orlando* FL Narrow 2019
St. Augustine Beach* FL Narrow 2020
St. Petersburg FL Partial 2019
Surfside FL Narrow 2015
Hawaii County HI Narrow 2019
Maui County HI Narrow 2018
Abington MA Narrow 2018
Amherst MA Narrow 2014
Andover MA Expanded 2018
Arlington MA Full 2020
Brookline MA Narrow 2013
Cambridge MA Narrow 2016
Chelmsford MA Partial 2019
Concord MA Narrow 2017
Denis MA Narrow 2016
Falmouth MA Partial 2018
Georgetown MA Narrow 2018
Gloucester MA Narrow 2019
Great Barrington MA Narrow 1990
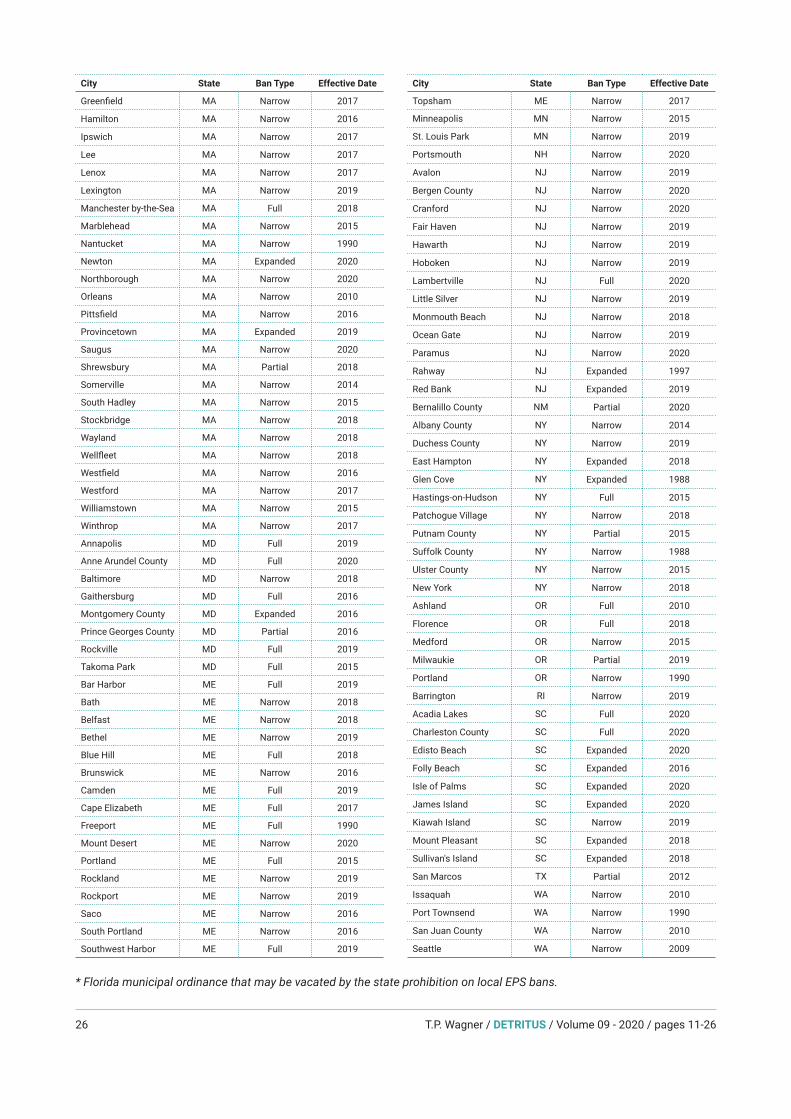
T.P. Wagner / DETRITUS / Volume 09 - 2020 / pages 11-2626
City State Ban Type Effective Date
Greenfield MA Narrow 2017
Hamilton MA Narrow 2016
Ipswich MA Narrow 2017
Lee MA Narrow 2017
Lenox MA Narrow 2017
Lexington MA Narrow 2019
Manchester by-the-Sea MA Full 2018
Marblehead MA Narrow 2015
Nantucket MA Narrow 1990
Newton MA Expanded 2020
Northborough MA Narrow 2020
Orleans MA Narrow 2010
Pittsfield MA Narrow 2016
Provincetown MA Expanded 2019
Saugus MA Narrow 2020
Shrewsbury MA Partial 2018
Somerville MA Narrow 2014
South Hadley MA Narrow 2015
Stockbridge MA Narrow 2018
Wayland MA Narrow 2018
Wellfleet MA Narrow 2018
Westfield MA Narrow 2016
Westford MA Narrow 2017
Williamstown MA Narrow 2015
Winthrop MA Narrow 2017
Annapolis MD Full 2019
Anne Arundel County MD Full 2020
Baltimore MD Narrow 2018
Gaithersburg MD Full 2016
Montgomery County MD Expanded 2016
Prince Georges County MD Partial 2016
Rockville MD Full 2019
Takoma Park MD Full 2015
Bar Harbor ME Full 2019
Bath ME Narrow 2018
Belfast ME Narrow 2018
Bethel ME Narrow 2019
Blue Hill ME Full 2018
Brunswick ME Narrow 2016
Camden ME Full 2019
Cape Elizabeth ME Full 2017
Freeport ME Full 1990
Mount Desert ME Narrow 2020
Portland ME Full 2015
Rockland ME Narrow 2019
Rockport ME Narrow 2019
Saco ME Narrow 2016
South Portland ME Narrow 2016
Southwest Harbor ME Full 2019
City State Ban Type Effective Date
Topsham ME Narrow 2017
Minneapolis MN Narrow 2015
St. Louis Park MN Narrow 2019
Portsmouth NH Narrow 2020
Avalon NJ Narrow 2019
Bergen County NJ Narrow 2020
Cranford NJ Narrow 2020
Fair Haven NJ Narrow 2019
Hawarth NJ Narrow 2019
Hoboken NJ Narrow 2019
Lambertville NJ Full 2020
Little Silver NJ Narrow 2019
Monmouth Beach NJ Narrow 2018
Ocean Gate NJ Narrow 2019
Paramus NJ Narrow 2020
Rahway NJ Expanded 1997
Red Bank NJ Expanded 2019
Bernalillo County NM Partial 2020
Albany County NY Narrow 2014
Duchess County NY Narrow 2019
East Hampton NY Expanded 2018
Glen Cove NY Expanded 1988
Hastings-on-Hudson NY Full 2015
Patchogue Village NY Narrow 2018
Putnam County NY Partial 2015
Suffolk County NY Narrow 1988
Ulster County NY Narrow 2015
New York NY Narrow 2018
Ashland OR Full 2010
Florence OR Full 2018
Medford OR Narrow 2015
Milwaukie OR Partial 2019
Portland OR Narrow 1990
Barrington RI Narrow 2019
Acadia Lakes SC Full 2020
Charleston County SC Full 2020
Edisto Beach SC Expanded 2020
Folly Beach SC Expanded 2016
Isle of Palms SC Expanded 2020
James Island SC Expanded 2020
Kiawah Island SC Narrow 2019
Mount Pleasant SC Expanded 2018
Sullivan's Island SC Expanded 2018
San Marcos TX Partial 2012
Issaquah WA Narrow 2010
Port Townsend WA Narrow 1990
San Juan County WA Narrow 2010
Seattle WA Narrow 2009
* Florida municipal ordinance that may be vacated by the state prohibition on local EPS bans.