polish construction companies 2015: key players, growth ... · introduction dear sir/madam, we have...
TRANSCRIPT

Polish construction companies 2015: Key players, growth factors and industry development prospects


Table of contents
Introduction 5 Chapter 1. Financial analysis of the biggest construction companies 7 1.1. Ranking of the biggest construction companies by 2014 revenue 8 1.2. Ranking of the largest construction companies by 2014 operating margin 9 1.3. Ranking of the biggest construction companies by 2014 net profit 11 1.4. Debt of 15 biggest construction companies in 2014 2014 13 1.5. Capital expenditure to sales ratio of the largest companies in 2014 14 1.6. Revenue of the 15 largest construction companies by geography and by type in 2013 16 1.7. Market Capitalisation of the largest construction companies listed on Warsaw Stock Exchange at December 31, 2014 23 Chapter 2. Prospects for development of construction companies in Poland 27 2.1. Introduction 28 2.2. Key factors of the construction market development in Poland 30 2.3. Bankruptcies in the construction sector 32 2.4. Employment in the construction sector 34 2.5. Development outlook for construction segments in Poland 36 2.6. From the market perspective 52 2.7. Summary 54 Chapter 3. Profiles of the biggest construction companies in Poland 57 Bibliography 102 Contact 104
4
Introduction
Dear Sir/Madam,
We have the pleasure to present the third edition of the Polish construction companies 2015: Key players, growth factors and industry development prospects report, analysing the condition of the 15 largest construction companies operating on the Polish market based on their revenue, and describing their prospects for business development.
In 2014, a recovery was observed, accompanied with positive change in market outlook. Total revenue of the 15 largest companies increased by nearly PLN 2.5 billion, i.e. 9% vs. 2013. The growth correlated with an improved operating performance and net profit of the top fifteen. Capitalisation of the largest construction companies listed on the Warsaw Stock Exchange and included in the ranking was only slightly higher at the end of 2014 than in the previous year.
The reversal of the previously negative trend resulted mostly from the completion of unprofitable road construction contracts, which materially affected the performance of most companies in the past. The infrastructure segment continued to play a key role in construction and assembly related production, although railway, industrial and hydrotechnical construction was the main driver of the entire sector’s growth. Once tenders regarding contracts co-funded by the EU budget under the new financial perspective 2014-2020 are accepted, the increasing trend in the sector should be consitent.
The first part of our report is a financial analysis of companies in the construction sector in Poland, based on 15 entities that have managed to build the strongest position in the market. We analyse their revenue, operating margins, net profits, debt, and revenue structure by geography and by type.
The second part comprises a high-level analysis of the prospects for the industry’s short-term and medium-term development, including presentation of planned expenditure in each market segment, bankruptcy statistics and employment trends in the construction sector. This part of the report is concluded with a summary of the present condition and key growth factors for the sector from the viewpoint of the largest construction companies in Poland.
In the final part of the report we briefly examine the characteristics of the business activity of the 15 most important market players in 2014.
It includes crucial information concerning the scope of their activities, ownership structure and detailed financial data derived from their annual financial statements.
When preparing the report, we referred to commonly available financial data or information provided to us directly by the entities presented herein.
We hope that you will find the report Polish Construction Companies 2015: Key players, growth factors and industry development prospects useful and that it will give you better understanding of the current construction market position, indicating challenges and opportunities faced by construction companies in the years to come.
As always, we are open to your ideas and suggestions regarding any of the presented topics.
Polish construction companies 2015: Key players, growth factors and industry development prospects 5


Chapter 1.Financial analysis of the largest construction companies
Polish construction companies 2015: Key players, growth factors and industry development prospects 7

No. Company name Revenue RevenueChange expressed in
PLNChange expressed
in %
1 Skanska Group 5 081 675 4 362 167 719 508 16.5%
2 Budimex Group 4 949 939 4 749 459 200 480 4.2%
3 Strabag Group** 3 133 492 3 298 754 -165 262 -5.0%
4 Polimex-Mostostal Group* 2 102 197 2 362 752 -260 555 -11.0%
5 Erbud Group 1 692 055 1 223 609 468 446 38.3%
6 Trakcja Group* 1 601 674 1 274 222 327 452 25.7%
7 PBG Group* 1 530 248 1 227 600 302 648 24.7%
8 Mostostal Warszawa Group 1 509 524 1 633 363 -123 839 -7.6%
9 Elektrobudowa Group 1 108 316 905 553 202 763 22.4%
10 Unibep Group 1 079 703 920 548 159 156 17.3%
11 Warbud S.A.* 1 049 886 1 121 472 -71 586 -6.4%
12 PORR (Polska) S.A. 1 045 019 1 030 076 14 943 1.5%
13 Mirbud Group 971 603 937 301 34 302 3.7%
14 Mostostal Zabrze Group 862 650 575 117 287 533 50.0%
15 Torpol Group 775 399 415 717 359 682 86.5%
Total 28 493 380 26 037 710 2 455 671 9.4%
Average 1 899 559 1 735 847 163 711 9.4%
Note: This analysis does not include the performance of foreign establishments of the construction companies operating in Poland, or that of SPV’s established within consortia in order to perform specified tasks, since this performance is included in consolidated performance of consortium members.
Source: Financial statements for the years 2014-2013
Table 1.1: Ranking of construction companies in Poland by revenue in 2014 (PLN’000)
1.1. Ranking of the largest construction companies by 2014 revenueIn 2014, the combined revenue of the 15 largest companies was PLN 28.5 billion which constitutes a growth of PLN 2.5 billion, i.e. 9.4% compared to 2013. In this year’s ranking, the Skanska Group came first with revenue of PLN 5.1 billion and 16.5% growth. The Budimex Group, controlled by Ferrovial of Spain, came second with revenue of PLN 4.9 billion and 4.2% growth, compared to 2013. Austrian Strabag was also in the top three, which was the only company that saw a revenue drop in 2014 (revenue decreased 5% to PLN 3.1 billion). Revenue was, however, sufficient to maintain its position from the previous year. Apart from the Skanska Group, the largest revenue growth by value was seen by the Erbud Group and Torpol Group, whose revenue increased by PLN 468 million and PLN 360 million, respectively. The Torpol Group also saw the largest revenue growth expressed as a percentage, while revenue generated by the Mostostal Zabrze Group increased by 50%. Thanks to the good performance, both groups debuted in this year’s ranking.
The Polimex- Mostostal Group reported the biggest year-on-year drop in revenue (PLN 261 million), but it has managed to maintain the fourth place that it occupied in the previous year. Apart from Polimex – Mostostal Group (an 11% drop in revenue), the largest revenue drop in excess of 5% was seen by the Mostostal Warszawa Group and Warbud S.A. (7.6% and 6.4% year-on-year, respectively).
Please note that in 2014, the number of companies that generated revenue growth was much bigger than in the previous year. Only four companies experienced a decrease in revenue. At the same time, the revenue of 11 companies increased.
Last year’s ranking was the opposite case.The average increase in revenue of 9% generated by the largest entities in the construction industry confirms the development of the construction market and reflects the growth seen in the industry in 2014.
8

No. Company nameOperating
margin 2014Operating
margin 2013
Change expressed in
PLN
Change expressed in %
1 Budimex Group 432 680 395 416 37 264 9%
2 Trakcja Group* 202 128 93 241 108 887 117%
3 Warbud S.A.* 136 033 116 516 19 517 17%
4 Strabag Group** 114 172 8 527 105 645 1239%
5 Mostostal Warszawa Group 103 927 -154 573 258 500 167%
6 Erbud Group 99 242 90 910 8 332 9%
7 PBG Group* 94 494 -26 952 121 446 451%
8 Mostostal Zabrze Group 73 791 45 725 28 066 61%
9 Elektrobudowa Group 73 218 63 147 10 071 16%
10 Mirbud Group 67 240 54 837 12 403 23%
11 Unibep Group 66 713 58 309 8 404 14%
12 Torpol Group 48 368 24 294 24 074 99%
13 Polimex-Mostostal Group* -201 623 24 673 -226 296 -917%
14 Skanska Group no data no data no data no data
15 PORR (Polska) S.A. no data no data no data no data
Average 100 799 61 082
Average operating margin (%) 5.86% 3.85%
Table 1.2: Operating margin of the 15 biggest companies in nominal terms (PLN’000)
For the Strabag Group companies, preparing profit and loss account by nature of expense, the operating margin reflects selling expenses and general and administrative costs (unlike that of the remaining companies).
Source: Financial statements for the years 2014-2013
1.2. Ranking of the largest construction companies by 2014 operating marginThe operating margin earned by the biggest construction companies, expressed as the operating revenue less costs of sales (excluding other operating revenue and expenses), indicates that the revenue increase in 2014 was accompanied by a growth in the profit of core operations. The average operating margin of the largest companies increased by nearly PLN 40 million, with a profit on core operations for the largest companies increased by nearly PLN 40 million in 2014 (compared to a PLN 117 million increase in 2013). As in the preceding year, the Budimex Group recorded the biggest operating margin and earned a profit on sales of PLN 433 million. The Trakcja Group came second with an operating margin of PLN 202 million, i.e. more than double the previous year. Warbud S.A. took third place, having generated an operating margin of PLN 136 million (more than PLN 66 million lower than the Trakcja
Group). Only one entity in the ranking, the Polimex-Mostostal Group, incurred an operating loss (PLN 202 million) in 2014.
Polish construction companies 2015: Key players, growth factors and industry development prospects 9
12.96% 12.62%
8.74% 8.55%
6.92% 6.88%6.61% 6.24% 6.18% 6.18% 5.87%
3.64%
-9.59%
5.86%
10.39%
7.32%8.33% 7.95%
5.85%
-9.46%
6.97%
5.84%6.33%
-2.20%
7.43%
0.26%1.04%
b.d. b.d.
3.85%
-10.00%
-5.00%
0.00%
5.00%
10.00%
15.00%
-15.00%
Averag
e
Strab
ag G
roup
**
Budim
ex G
roup
Torp
ol Gro
up
Trakc
ja Gro
up*
Elektr
obud
owa G
roup
Mos
tosta
l Zab
rze G
roup
Unibep
Gro
up
Mirb
ud G
roup
Erbud
Gro
up
Mos
tosta
l War
szawa G
roup
PBG G
roup
*
Polim
ex-M
osto
stal G
roup
*
Skan
ska G
roup
2014 2013
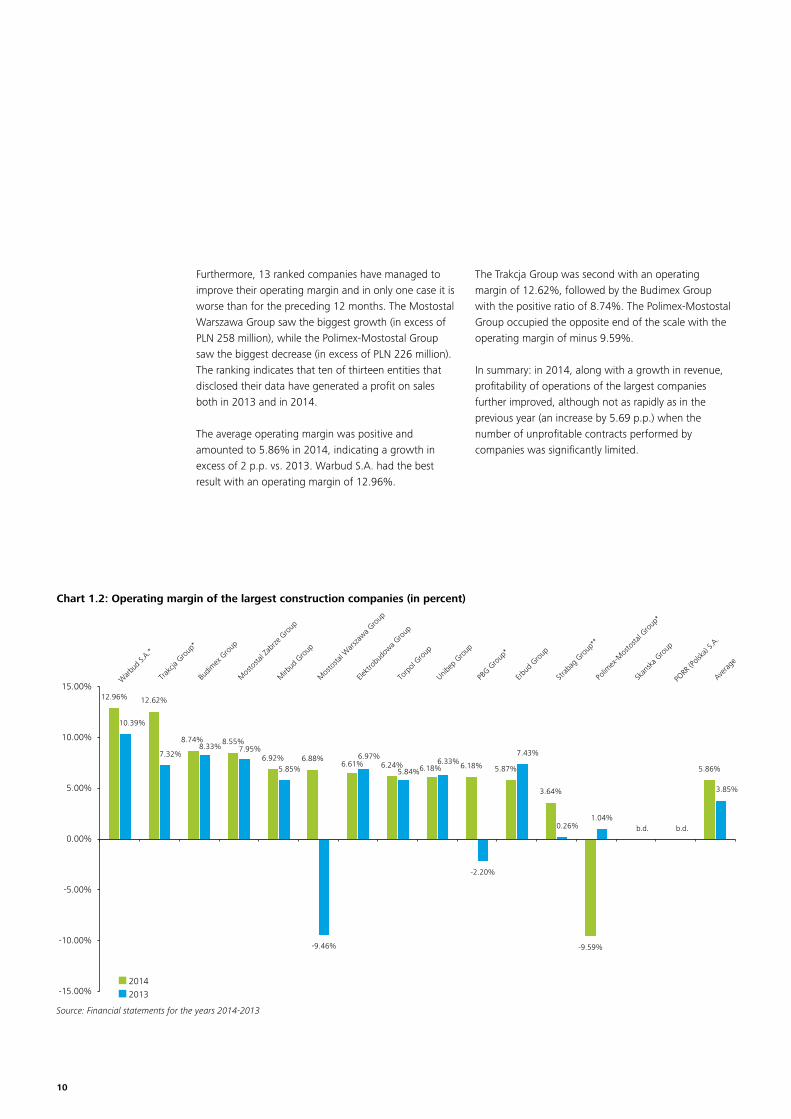
Chart 1.2: Operating margin of the largest construction companies (in percent)
Source: Financial statements for the years 2014-2013
Furthermore, 13 ranked companies have managed to improve their operating margin and in only one case it is worse than for the preceding 12 months. The Mostostal Warszawa Group saw the biggest growth (in excess of PLN 258 million), while the Polimex-Mostostal Group saw the biggest decrease (in excess of PLN 226 million). The ranking indicates that ten of thirteen entities that disclosed their data have generated a profit on sales both in 2013 and in 2014.
The average operating margin was positive and amounted to 5.86% in 2014, indicating a growth in excess of 2 p.p. vs. 2013. Warbud S.A. had the best result with an operating margin of 12.96%.
The Trakcja Group was second with an operating margin of 12.62%, followed by the Budimex Group with the positive ratio of 8.74%. The Polimex-Mostostal Group occupied the opposite end of the scale with the operating margin of minus 9.59%.
In summary: in 2014, along with a growth in revenue, profitability of operations of the largest companies further improved, although not as rapidly as in the previous year (an increase by 5.69 p.p.) when the number of unprofitable contracts performed by companies was significantly limited.
10

Table 1.3: Net profit of the 15 biggest companies in nominal terms (PLN’000)
Source: Financial statements for the years 2014-2013
No. Company nameNet profit
2014Net profit
2013Change expressed
in PLNChange
expressed in %
1 Budimex Group 193 938 301 300 -107 362 -36%
2 Strabag Group** 148 330 74 351 73 979 99%
3 Trakcja Group* 50 391 29 995 20 396 68%
4 Warbud S.A.* 48 416 32 555 15 861 49%
5 Erbud Group 27 892 18 079 9 813 54%
6 Elektrobudowa Group 27 015 17 585 9 430 54%
7 Torpol Group 25 009 4 790 20 219 422%
8 Unibep Group 20 925 16 211 4 713 29%
9 Mostostal Zabrze Group 19 134 7 648 11 486 150%
10 Mirbud Group 17 583 16 601 982 6%
11 Mostostal Warszawa Group -8 738 -314 380 305 642 97%
12 PBG Group* -80 799 207 512 -288 311 -139%
13 Polimex-Mostostal Group* -153 226 -260 889 107 663 41%
14 Skanska Group no data no data no data no data
15 PORR (Polska) S.A. no data no data no data no data
Average 25 836 11 643
Average net margin (%) 1.50% 0.73%
1.3. Ranking of the largest construction companies by 2014 net profit The net profit is a material indicator reflecting the overall condition of construction companies. The median net profit of the key 13 companies that disclosed their data for 2014 was positive and totalled PLN 26 million, i.e. a growth in excess of PLN 14 million compared with PLN 12 million in 2013.
The Budimex Capital Group earned the highest net profit of PLN 194 million which represents a 36% year-on-year decrease. However, the profit for 2013 included a gain from selling shares in the subsidiary Budimex Danwood. Following elimination of the transaction balance, the net profit of the Budimex Group for 2014 improved by approx. 34%. The Strabag Capital Group came second with a net profit of PLN 148 million, and the Trakcja Capital Group was third with a net profit
of PLN 50 million. Performance of Warbud S.A. was similar with a net profit of PLN 48 million. The Polimex-Mostostal Group generated a loss of PLN 153 million and closed the ranking.
As many as ten ranked companies that disclosed their data earned a net profit, whereas three incurred a loss. In the previous year, ten entities had generated a net profit, but the average net profit of all ranked companies had been lower. Additionally, please note that ten companies earned a net profit both in 2013 and 2014.
Polish construction companies 2015: Key players, growth factors and industry development prospects 11
4.73% 4.61%3.92%
3.23% 3.15% 2.44% 2.22% 1.94% 1.81% 1.65%
-0.58%
-5.28%
-7.29%
b.d. b.d.
1.50%2.25%
2.90%
6.34%
1.15% 2.35% 1.94% 1.33% 1.76% 1.77% 1.48%
-19.25%
16.90%
-11.04%
0.73%
-20.00%
-15.00%
-10.00%
-5.00%
0.00%
5.00%
10.00%
15.00%
20.00%Ave
rage
Strab
ag G
roup
**
Budim
ex G
roup
Torp
ol Gro
up
Trakc
ja Gro
up*
Elektr
obud
owa G
roup
Mos
tosta
l War
szawa G
roup
Polim
ex-M
osto
stal G
roup
*
PBG G
roup
*
Erbud
Gro
up
Mirb
ud G
roup
Unibep
Gro
up
Mos
tosta
l Zab
rze G
roup
Skan
ska G
roup
2014 2013
Source: Financial statements for the years 2014-2013
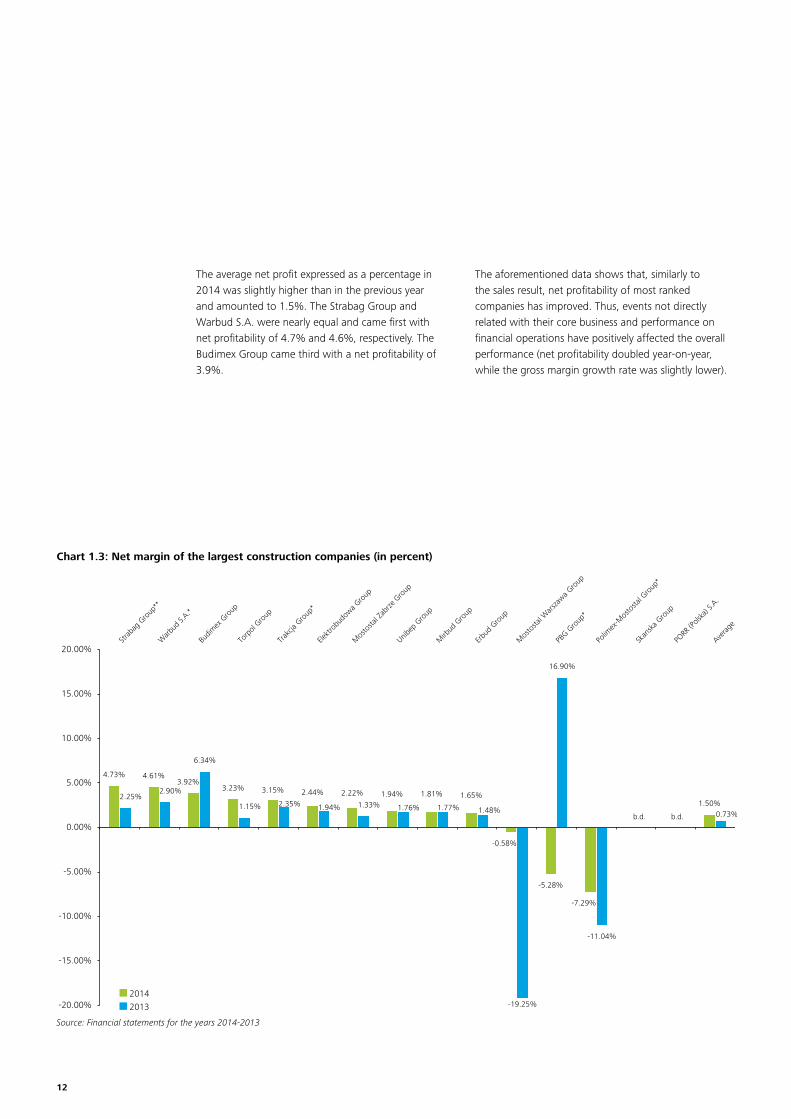
The average net profit expressed as a percentage in 2014 was slightly higher than in the previous year and amounted to 1.5%. The Strabag Group and Warbud S.A. were nearly equal and came first with net profitability of 4.7% and 4.6%, respectively. The Budimex Group came third with a net profitability of 3.9%.
The aforementioned data shows that, similarly to the sales result, net profitability of most ranked companies has improved. Thus, events not directly related with their core business and performance on financial operations have positively affected the overall performance (net profitability doubled year-on-year, while the gross margin growth rate was slightly lower).
Chart 1.3: Net margin of the largest construction companies (in percent)
12

78.43%
b.d.
b.d.
0.49
0.58
0.70
0.58
0.66
0.73
0.66
0.75
0.83
0.88
0.87
0.83
1.22
78.48%
0.51
0.53
0.63
0.63
0.70
0.70
0.73
0.75
0.80
0.84
0.86
0.86
1.31
0.00 0.25 0.50 0.75 1.00 1.25 1.50
Average
Warbud S.A.*
Mostostal Warszawa Group
PORR (Polska) S.A.
Skanska Group
Unibep Group
Strabag Group**
Erbud Group
Elektrobudowa Group
Polimex-Mostostal Group*
Trakcja Group*
Mirbud Group
Torpol Group
Mostostal Zabrze Group
PBG Group*
Budimex Group
2014 2013
Chart 1.4: Debt/equity ratio in 2013 - 2014
Source: Financial statements for the years 2014-2013
1.4. Debt of 15 biggest construction companies in 2014Analysis of the debt ratios shows that the biggest construction companies’ debt was relatively high in 2014 (similar to 2013). In 2014, the average debt (weighted by revenue) remained flat and amounted to 78%. In the aforementioned period, six companies increased and six reduced the percentage of debt in their financing structure.
Similarly to 2013, six entities used debt capital to the extent corresponding to at least 75% of their assets.
In 2014, as in 2013, the PBG Group has the highest percentage debt with the total debt constituting 131% of its total assets (i.e. it exceeded the value of the company’s assets by 31%) and has increased by 9% compared to 2013. Following the loss of liquidity in 2012, the company had been put into liquidation with an arrangement option, which was voted for by its creditors in 2015. Among the remaining companies, Erbud had the largest debt increase, from 66% at the end of 2013 to 73% at the end of 2014. The growth in the debt of the other companies did not exceed 5 p.p. in 2014.
Polish construction companies 2015: Key players, growth factors and industry development prospects 13
No. Company nameCapital
expenditure 2014Capital
expenditure 2013Change expressed
in PLNChange expressed
in %
1 Budimex Group 48 401 17 724 30 677 173%
2 Polimex-Mostostal Group* 26 869 29 533 -2 664 -9%
3 Trakcja Group* 25 674 18 238 7 436 41%
4 Strabag Group** 24 464 44 580 -20 116 -45%
5 Warbud S.A.* 19 187 11 085 8 102 73%
6 Mostostal Zabrze Group 19 011 10 554 8 457 80%
7 Mirbud Group 17 212 3 158 14 054 445%
8 PBG Group* 17 125 179 970 -162 845 -90%
9 Erbud Group 16 077 12 007 4 070 34%
10 Torpol Group 15 046 7 026 8 020 114%
11 Elektrobudowa Group 11 489 17 399 -5 910 -34%
12 Mostostal Warszawa Group 8 279 12 684 -4 405 -35%
13 Unibep Group 3 191 11 734 -8 543 -73%
14 Skanska Group no data no data no data no data
15 PORR (Polska) S.A. no data no data no data no data
Total 252 025 375 692 -123 667 -33%
Average 19 387 28 899 -9 513 -33%
Source: Financial statements for the years 2014-2013
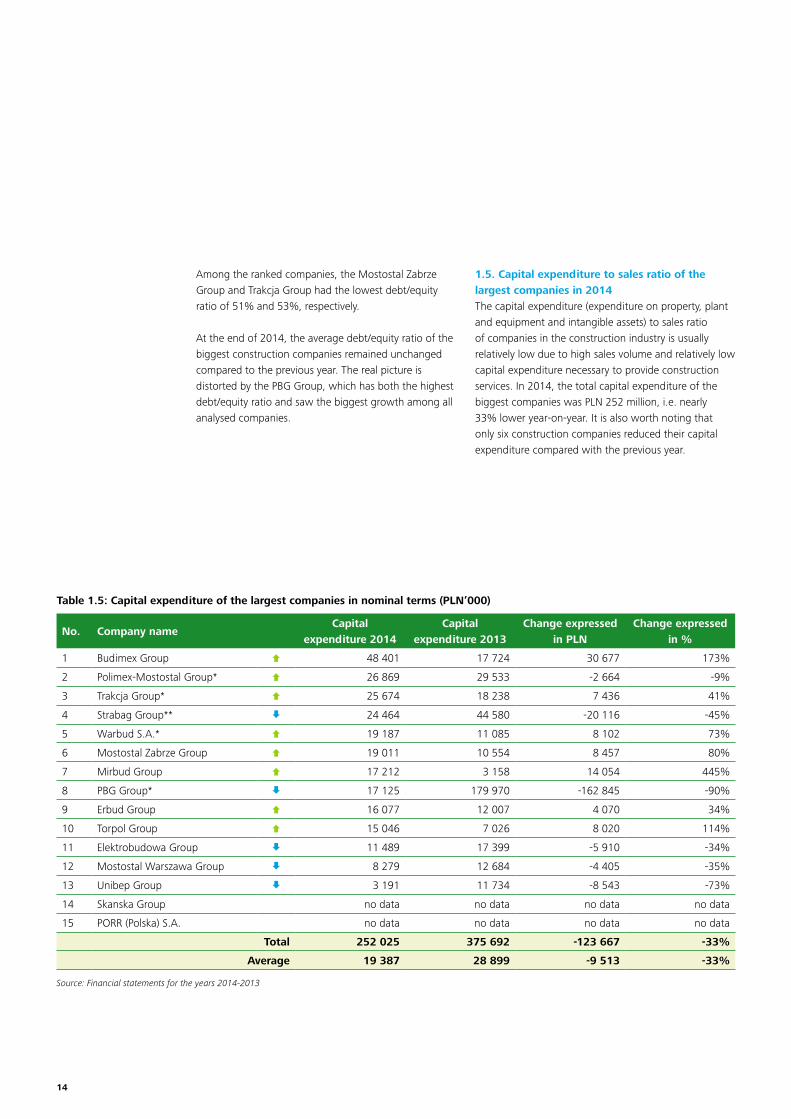
Table 1.5: Capital expenditure of the largest companies in nominal terms (PLN’000)
Among the ranked companies, the Mostostal Zabrze Group and Trakcja Group had the lowest debt/equity ratio of 51% and 53%, respectively.
At the end of 2014, the average debt/equity ratio of the biggest construction companies remained unchanged compared to the previous year. The real picture is distorted by the PBG Group, which has both the highest debt/equity ratio and saw the biggest growth among all analysed companies.
1.5. Capital expenditure to sales ratio of the largest companies in 2014 The capital expenditure (expenditure on property, plant and equipment and intangible assets) to sales ratio of companies in the construction industry is usually relatively low due to high sales volume and relatively low capital expenditure necessary to provide construction services. In 2014, the total capital expenditure of the biggest companies was PLN 252 million, i.e. nearly 33% lower year-on-year. It is also worth noting that only six construction companies reduced their capital expenditure compared with the previous year.
14

1.82%
b.d.
b.d.
1.27%
0.78%
1.35%
0.98%
0.37%
1.92%
14.66%
1.25%
1.43%
0.34%
0.99%
1.69%
1.84%
1.13%
0.30%
0.55%
0.78%
0.95%
0.98%
1.04%
1.12%
1.28%
1.60%
1.77%
1.83%
1.94%
2.20%
0.00% 2.00% 4.00% 6.00% 8.00% 10.00% 12.00% 14.00% 16.00%
Average
PORR (Polska) S.A.
Skanska Group
Unibep Group
Mostostal Warszawa Group
Strabag Group**
Erbud Group
Budimex Group
Elektrobudowa Group
PBG Group*
Polimex-Mostostal Group*
Trakcja Group*
Mirbud Group
Warbud S.A.*
Torpol Group
Mostostal Zabrze Group
Chart 1.5: Capital expenditure to sales ratio (data for 2014 and 2013)
Source: Financial statements for the years 2014-2013
2014 2013
As regards nominal capital expenditure, the Budimex Group was the leader in 2014 with the total of PLN 48 million (i.e. a 173% increase compared to 2013). The Polimex-Mostostal Group with a total expenditure of PLN 27 million (a 9% drop year-on-year) and the Trakcja Group with the total expenditure of PLN 26 million (a 41% increase year-on-year) came second and third, respectively.
The general drop in year-on-year capital expenditure resulted mostly from a significant reduction in capital expenditure of the PBG Group, which used to be the ranking leader in this respect. Having eliminated the PBG Group from the ranking, the general level of capital expenditure among the largest construction companies increased by 20% compared to 2013.
In 2014, the capital expenditure to revenue ratio was 1.13% and was almost 0.7 p.p. lower than in 2013. The drop resulted from a significant reduction in capital expenditure in the PBG Group vs. 2013 on the one hand, and the general increase in revenue generated by construction companies on the other. The Mostostal Zabrze Group saw the highest capital expenditure to sales ratio.
In 2014, the Unibep Group had the lowest capital expenditure to sales ratio (0.3% in 2014 vs. 1.27% in 2013) with the Mostostal Warszawa Group coming second last (0.55% vs. 0.78% in 2013).
Polish construction companies 2015: Key players, growth factors and industry development prospects 15

No. Company nameExport sales
revenue2014
Export sales revenue
2013
Nominal change
Percentage change
1 Trakcja Group* 565 884 462 926 102 958 22%
2 Polimex-Mostostal Group* 383 978 588 481 -204 503 -35%
3 Unibep Group 319 497 255 636 63 861 25%
4 Mostostal Zabrze Group 254 503 235 578 18 925 8%
5 PBG Group* 226 268 230 512 -4 244 -2%
6 Budimex Group 195 632 550 574 -354 942 -64%
7 Erbud Group 195 373 209 736 -14 363 -7%
8 Mostostal Warszawa Group 144 453 414 262 -269 809 -65%
9 Elektrobudowa Group 67 336 229 269 -161 933 -71%
10 Torpol Group 28 507 13 927 14 580 105%
11 Strabag Group** 8 863 5 545 3 318 60%
12 Warbud S.A.* 0 0 0 0%
13 Mirbud Group 0 0 0 0%
14 Skanska Group No data No data No data No data
15 PORR (Polska) S.A. No data No data No data No data
Total 2 390 294 3 196 446 -806 152 -25%
Average 183 869 245 880 -62 012 -25%
Table 1.6.1: Export sales revenue of the largest construction companies in nominal terms (PLN’000)
Financial statements for the years 2014-2013
1.6. Revenue of the largest construction companies by geography and by type in 2014
1.6.1 Revenue by geography The largest construction companies operating in Poland operate also on foreign markets, but their export sales volume is relatively small. The median revenue generated by the biggest companies abroad amounted to PLN 184 million and was PLN 62 million lower than in 2013, marking a 25% year-on-year drop. The Trakcja Group generated the highest foreign revenue amounting to PLN 566 million, i.e. 22% higher than in 2013. The Group operates on the Lithuanian market. Polimex-Mostostal Group with a total revenue of PLN 384 million (a 35% drop year-on-year) was second
and the Trakcja Group with a total revenue of PLN 319 million (a 25% increase year-on-year) came third. Export operations of the Polish construction companies have focused on the neighbouring markets, mostly Eastern Europe, Scandinavia and Germany.
16

Chart 1.6.1: Percentage share of export sales in total sales of the largest companies in 2014
Source: Financial statements for the years 2014-2013
2014 2013
On average, export sales revenue amounted to 11% of total operating revenue (4 p.p. lower than in 2013). Export sales of three entities was in excess of 30% of total sales revenue (the Trakcja Group with 35%, the Unibep Group and the Mostostal Zabrze Group with 30% each).
Sales analysis by geography indicates that the number of entities in the construction sector that find their clients abroad has been increasing, as they search for new markets to diversify their operational risk. In light of the expected reduction in new investments once the EU funds for the 2014-2020 perspective are consumed, the trend may further increase.
35%
30% 30%
18%
15%
12%10%
6%4% 4%
0% 0% 0%
11%
36%
28%
41%
25%
19%17%
25% 25%
12%
3%0% 0% 0% b.d. b.d.
15%
0%
5%
10%
15%
20%
25%
30%
35%
40%
45%
50%
Averag
e
Trakc
ja Gro
up*
Unibep
Gro
up
Mos
tosta
l Zab
rze G
roup
Polim
ex-M
osto
stal G
roup
*
PBG G
roup
*
Erbud
Gro
up
Mos
tosta
l War
szawa G
roup
Elektr
obud
owa G
roup
Budim
ex G
roup
Torp
ol Gro
up
Strab
ag G
roup
**
Mirb
ud G
roup
Skan
ska G
roup
Polish construction companies 2015: Key players, growth factors and industry development prospects 17

Skanska Group
Budimex Group
Strabag Group**
Polimex-Mostostal Group
Erbud Group
Trakcja Group
PBG Group
Mostostal Warszawa Group
Elektrobudowa Group
Unibep Group
Warbud S.A.
PORR (Polska) S.A.
Mirbud Group
Mostostal Zabrze Group
Torpol Group
MARKETS
DomesticWestern Europe
Eastern Europe
Scandinavian Asian OtherTOTAL
(2014, PLN’000)
5 081 675
4 949 939
3 133 492
2 102 197
1 692 055
1 601 674
1 530 248
1 509 524
1 108 316
1 079 703
1 049 886
1 045 019
971 603
862 650
775 399
28 493 380TOTAL:
4 754 307
3 124 629
1 718 219
1 496 682
1 035 790
1 365 071
760 206
971 603
608 147
no data
No information on the place of origin of the export revenue Export revenue value - 8 863
No information on the place of origin of the export revenue Export revenue value - 383 978
565 884
79 701
191 197 63 306
Chart 1.6.2: Sales of the largest companies by geography in 2014
Source: Financial statements for the years 2014-2013
no data
158 085 37 547
195 373
1 303 980 No information on the place of origin of the export revenue Export revenue value - 226 268
23 090 39 959 1 703
1 040 980 21 545 17 427 7 5929 806 10 966
173 964 123 323 5822 152
1 049 886
No information on the place of origin of the export revenue Export revenue value - 28 507746 892
18

Budimex Group
Skanska Group
Strabag Group**
Polimex-Mostostal Group*
Mostostal Warszawa Group
Trakcja Group*
PBG Group*
Erbud Group
Warbud S.A.*
PORR (Polska) S.A.
Mirbud Group
Unibep Group
Elektrobudowa Group
Mostostal Zabrze Group
Torpol Group
MARKETS
DomesticWestern Europe
Eastern Europe
Scandinavian Asian OtherTOTAL
(2013, PLN’000)
4 749 459
4 362 167
3 298 754
2 362 752
1 633 363
1 274 222
1 227 600
1 223 609
1 121 472
1 030 076
937 301
920 548
905 553
575 117
415 717
26 037 710TOTAL:
4 198 885
3 293 209
1 774 271
1 219 101
1 013 873
937 301
664 912
676 284
401 790
No information on the place of origin of the export revenue Export revenue value - 5 545
No information on the place of origin of the export revenue Export revenue value - 588 481
209 736
507 479 43 095
40 717
141 931 113 180 525
232 431 122 263 56 731 2 783 54
Chart 1.6.3: Sales of the largest companies by geography in 2013
50 668 90 607 19 600
Source: Financial statements for the years 2014-2013
no data
811 295 462 926
1 121 472
no data
27 597
339 539 203 128 32 450
No information on the place of origin of the export revenue Export revenue value - 13 927
No information on the place of origin of the export revenue Export revenue value - 230 512997 088
Polish construction companies 2015: Key players, growth factors and industry development prospects 19

The sales revenue structure by type shows that the largest construction companies have focused on road and railway construction projects. Construction projects for the power engineering sector have had an increasing share in revenue, too.
Skanska Group
Budimex Group
Strabag Group**
Polimex-Mostostal Group
Erbud Group
Trakcja Group
PBG Group
Mostostal Warszawa Group
Elektrobudowa Group
Unibep Group
Warbud S.A.
PORR (Polska) S.A.
Mirbud Group
Mostostal Zabrze Group
Torpol Group
MARKETS
General construction
Residental construction
Road and railway
construction
Construction engineering
Power construction
Other activities
TOTAL(2014, PLN’000)
5 081 675
4 949 939
3 133 492
2 102 197
1 692 055
1 601 674
1 530 248
1 509 524
1 108 316
1 079 703
1 049 886
1 045 019
971 603
862 650
775 399
28 493 380TOTAL:
4 566 628
no data
239 740
743 523
755 188
1 474 086
1 188 076
466 173
160 185
968 837
434 874
904 583
383 311
427 447
45 448
127 588
342 172
3 159
203 733
211 309
102 437
680 687
20 211
*** General construction and construction engineering
Source: Financial statements for the years 2014-2013
Chart 1.6.2.1: Sales of the largest construction companies by type in 2014
no data
no data
1 397 537 88 885
1 189 302317 063
124 871
1 038 747 11 139
434 292
181 963***
20

Budimex Group
Skanska Group
Strabag Group**
Polimex-Mostostal Group
Mostostal Warszawa Group
Trakcja Group*
PBG Group*
Erbud Group
Warbud S.A.*
PORR (Polska) S.A.
Mirbud Group
Unibep Group
Elektrobudowa Group
Mostostal Zabrze Group
Torpol Group
MARKETS
General construction
Residental construction
Road and railway
construction
Construction engineering
Power construction
Other activities
TOTAL(2013, PLN’000)
4 749 459
4 362 167
3 298 754
2 362 752
1 633 363
1 274 222
1 227 600
1 223 609
1 121 472
1 030 076
937 301
920 548
905 553
575 117
415 717
26 037 710TOTAL:
4 005 617
no data
367 243
998 102
343 006
623 640
126 008***
79 658
774 302
96 219
791 382
484 705
596 795
1 144 184
1 107 460
743 842
607 332
980
130 038
453 298
49 630
14 012
75 468
199 659
281 913
21 684
1 147 678
394 033
*** General construction and construction engineering
Source: Financial statements for the years 2014-2013
no data
no data
516 827
627 755 93 134
449 109
Chart 1.6.2.2: Sales of the largest construction companies by type in 2013
Polish construction companies 2015: Key players, growth factors and industry development prospects 21

17.45%
b.d.
b.d.
b.d.
0.06%
1.25%
5.22%
4.06%
15.66%
10.21%
8.05%
31.13%
21.69%
25.70%
36.93%
78.09%
13.30%
0.21%
1.06%
2.61%
2.69%
7.74%
7.97%
10.54%
18.38%
19.57%
20.33%
22.36%
78.91%
0.0% 25.0% 50.0% 75.0% 100.0%
Average
PORR (Polska) S.A.
Strabag Group**
Skanska Group
Mostostal Warszawa Group
Warbud S.A.*
Torpol Group
Erbud Group
Budimex Group
Trakcja Group*
Mirbud Group
Elektrobudowa Group
Unibep Group
Polimex-Mostostal Group*
PBG Group*
Mostostal Zabrze Group
Chart 1.6.2.3: Capital expenditure to sales revenue ratio (data for 2014 and 2013)
Source: Financial statements for the years 2014-2013
2014 2013
In nominal terms, the Mostostal Zabrze Group and Polimex-Mostostal Group had the largest share in other non-construction revenue in 2014 with PLN 681 million and PLN 427 million, respectively. As compared to 2013, the average weighted share of other operating revenue expressed as a percentage dropped from 17.5% to 13.3%. In 2014, in most cases, the share of construction and assembly services as a percentage of total revenue was in the range of 80-100%. The Mostostal Zabrze Group remains the entity with the most diversified operations (79%) including, along with construction, assembly and production.
In 2014, of the twelve companies analysed above that generated revenue on other operations, just three managed to increase the percentage share of revenue from non-construction operations as a percentage of total revenue, compared to 2013. The main reason was a growth in revenue generated by the largest construction companies on construction and assembly in 2014.
22

Chart 1.7: Changes in WIG and WIG-Budownictwo indexes in 2005-2014
Source: Deloitte analysis based on data available on the WSE website.
1.7. Market capitalisation of the largest construction companies listed on the Warsaw Stock Exchange as at 31 December 2014The improving investor sentiment regarding companies indexed with WIG-Budownictwo (WIG BUD) has slightly slowed down in 2014.
In 2014, the WIG Budownictwo index decreased by 5% compared to 2013, while the main WIG index was close to the previous year’s level at the end of 2014.
Out of the 15 biggest construction companies, as many as 11 were listed on the Warsaw Stock Exchange in 2014, and we used them as our basis for the capitalisation ranking. At the end of 2014, the combined market value of the eleven construction companies listed on the Warsaw Stock Exchange was PLN 6.1 billion, i.e. PLN 0.2 billion higher than the combined market value of these companies at the end of 2013. Expressed as a percentage, the total capitalisation increased by 4%.
WIG WIG BUDOW
0
2 000
4 000
6 000
8 000
10 000
12 000
14 000
0
10 000
20 000
30 000
40 000
50 000
60 000
70 000
80 000
2005
-01-
0720
05-0
3-16
2005
-05-
3020
05-0
8-04
2005
-10-
1220
05-1
2-21
2006
-02-
2820
06-0
5-11
2006
-07-
1920
06-0
9-26
2006
-12-
0420
07-0
2-13
2007
-04-
2420
07-0
7-04
2007
-09-
1120
07-1
1-19
2008
-01-
3120
08-0
4-10
2008
-06-
2020
08-0
8-28
2008
-11-
0420
09-0
1-19
2009
-03-
2620
09-0
6-05
2009
-08-
1320
09-1
0-20
2009
-12-
3020
10-0
3-09
2010
-05-
1920
10-0
7-27
2010
-10-
0120
10-1
2-10
2011
-02-
1820
11-0
4-29
2011
-07-
0820
11-0
9-15
2011
-11-
2420
12-0
2-02
2012
-04-
1220
12-0
6-22
2012
-08-
3120
12-1
1-08
2013
-01-
2220
13-0
4-02
2013
-06-
1320
13-0
8-21
2013
-10-
2820
14-0
1-14
2014
-03-
2120
14-0
6-02
2014
-08-
0820
14-1
0-16
2014
-12-
29
Polish construction companies 2015: Key players, growth factors and industry development prospects 23

59.37%
6.42%
5.76%
5.44%
5.33%
4.98%
4.74%3.76%
1.97%1.84%
0.39%
No. Company nameMarket
capitalisation 31.12.2014
Market capitalisation 31.12.2013
Change expressed in PLN
Change expressed in %
1 Budimex S.A. 3 612 509 3 369 973 242 536 7%
2 Trakcja PRKiI S.A. 390 637 530 443 -139 807 -26%
3 Elektrobudowa S.A. 350 373 522 237 -171 863 -33%
4 Mostostal Zabrze S.A. 331 070 292 296 38 774 13%
5 Erbud S.A. 324 153 432 167 -108 015 -25%
6 Polimex-Mostostal S.A. 303 166 190 758 112 408 59%
7 Unibep S.A. 288 281 275 361 12 919 5%
8 Torpol S.A. 229 011 IPO on 8 July 2014
9 Mostostal Warszawa S.A. 120 000 89 800 30 200 34%
10 Mirbud S.A. 112 190 117 000 -4 810 -4%
11 PBG S.A. 23 444 31 592 -8 148 -26%
Total 6 084 833 5 851 628 233 205 4%
Table 1.7: Capitalisation of the largest construction companies listed on Warsaw Stock Exchange as at 31 December 2014
Budimex S.A. Trakcja PRKiI S.A. Elektrobudowa S.A. Mostostal Zabrze S.A. Erbud S.A. Polimex-Mostostal S.A. Unibep S.A. Torpol S.A. Mostostal Warszawa S.A. Mirbud S.A. PBG S.A.
Source: Deloitte analysis based on data available on the WSE website.
Chart 1.7.1: Share of the largest companies listed on the Warsaw Stock Exchange in total capitalisation as at 31 December 2014
Five of the eleven companies analysed experienced a drop in market value. Elektrobudowa S.A. saw the biggest drop: in 2014, its market value decreased by 33%. Budimex S.A. has remained the market value leader since 2011, with a capitalisation of PLN 3,613 million (a 7% increase compared to 2013). Trakcja PRKiI S.A. was second, and Elektrobudowa S.A. third with capitalisation of PLN 391 million and PLN 350 million, respectively. At the end of 2014, capitalisation of Budimex S.A. constituted over 59% of the total capitalisation of the eleven largest companies in our ranking listed on Warsaw Stock Exchange (a 2 p.p. drop vs. 2013).
In summary, please note that market capitalisation of the largest construction companies increased by 4% at the end of 2014 year-on-year. The trend agrees with a growth in the construction manufacturing ratio by 0.4% in 2014 and a 9% increase in revenue of the companies included in our ranking compared to 2013.
Source: Deloitte analysis based on data available on the WSE website.
* The financial data for 2013 was reconciled to the financial statements for 2014 following adjustments of the opening balance.
** Due to absence of consolidated financial statements, the financial data of the Strabag Group include (for simplification purposes) the total revenue of Strabag Sp. z o.o. and StrabagInfrastrukturaPołudnie Sp. zo.o.
The financial data of Strabag for 2013 was reconciled to the financial statements for 2014 following adjustments of the opening balance.
24


Chapter 2. Prospects for development of construction companies in Poland
Polish construction companies 2015: Key players, growth factors and industry development prospects 27

Construction Total economy
In the years to come, the construction engineering market shall grow the fastest, mostly thanks to an inflow of funds from the EU. The growth in this segment should peak in the years 2016-2018. The market of building construction shall increase too, in the coming years, although the growth will be slower. We assume the increase shall include the office, housing and warehousing segments.
Krzysztof Andrulewicz, CEO of Skanska S.A.
28
2.1 IntroductionThe second part of the report begins with an analysis of the key factors shaping the construction sector and a presentation of the changes taking place in the sector as seen through statistics on bankruptcies and employment in construction companies. Further herein we will discuss the characteristics and current conditions of each segment in the construction sector and analyse planned expenditures in the short- and medium-term perspective. This part of the report is concluded with a summary of the present condition and key growth factors for the sector from the viewpoint of representatives of the largest construction companies in Poland.
Following a period of slowdown in 2012-2013 resulting from the completion of large capital projects included in the previous EU perspective and organisation of the EURO 2012 tournament, the construction industry in Poland has been recovering.
Despite its growth in 2014 being very small (0.4%), the prospects are positive and the growth should accelerate in the coming years.
A number of signals from the market indicate an improvement in the standing of the construction sector. Since 2014, a significant decrease in the number of bankruptcies announced by construction companies has been observed. Additionally, in the initial months of 2015, a slow increase in employment has been observed, accompanied with further projections of employment growth.1 In the years to come, following the expected commencement of infrastructural investments, an increased labour demand is predicted, in particular in relation to road construction, which may even result in a labour shortage. The economic climate indicator as examined by the Main Statistical Office has confirmed the reversal of the negative trend in the construction sector. Since the beginning of 2013, the indicator for the sector has been growing, having outgrown the indicator for the entire economy in mid-2014.
1 More information provided in the section “Employment in the construction sector”
Economic climate indicator
Source: Main Statistical Office
70
80
90
100
110
120
130
I.08
IV.0
8V
II.08
X.0
8I.0
9IV
.09
VII.
09X
.09
I.10
IV.1
0V
II.10
X.1
0I.1
1IV
.11
VII.
11X
.11
I.12
IV.1
2V
II.12
X.1
2I.1
3IV
.13
VII.
13X
.13
I.14
IV.1
4V
II.14
X.1
4I.1
5IV
.15
VII.
15

Drawing the right conclusions from the previous EU financial perspective is of key importance. We must avoid another accumulation of projects that would generate cyclical speculation on the labour market, to include costs of labour and materials, and finally the costs of projects.
Paulo Silva, Management Board Member, Mota-Engil Central Europe S.A.
Polish construction companies 2015: Key players, growth factors and industry development prospects 29
The inflow of new EU funds shall be the strongest incentive improving the condition of the infrastructural construction segment in the coming years. Under the new 2014-2020 financial perspective, Poland shall receive a record amount of funds EUR 120.1 billion. The amount mostly includes funds under the Cohesion Policy (EUR 82.5 billion), Common Agricultural Policy (EUR 32.1 billion) and European Maritime and Fisheries Fund (EUR 0.5 billion). The construction sector shall mostly use funds under the Cohesion Policy. Significant portion of EU funding will be spend on infrastructural construction projects.
Representatives of the biggest construction companies see new opportunities offered under the new EU financial perspective. In order to avoid the accumulation of projects already experienced with investments carried out for EURO 2012, the General Directorate for National Roads and Motorways has already accepted tenders for PLN 30 billion out of the total of PLN 107 billion planned for investments to be carried out in the years 2014-2025 (as at 11 September 2015).
The attitude of PKP PLK, which, by the end of August, failed to call for any tenders under the new perspective, gives rise to concerns. In order to counteract the anxiety, PKP PLK has announced the Great Railway Investment Campaign, which includes initiatives aimed at improving cooperation with contractors and accelerating the tender procedures. The introduction of a two-stage procedure, additional tender evaluation criteria (along with the price) and advance payments for contracts, payments for materials stored at the construction site or partial payments for the performed work will be the measures adopted to achieve the improvement.
A strong growth in demand observed since 2014 has been the factor of crucial importance for positive prospects of the construction sector. The current macro-economic standing accompanied with access to government subsidies provides grounds for stabilisation in the housing segment in the nearest future.
This has been supported by the record area of office space constructed (622,000 sq. m.). Based on the analysed number of continued and planned investments in the portfolios of construction companies, the coming quarters should support the current positive trend.
In the coming years, some construction companies are planning to further diversify their business through expanding their construction services onto new construction market sectors or developing new non-construction business.
Additionally, certain companies see their potential in geographical diversification, and are planning investments in countries such as the Czech Republic, Slovakia, Romania or Hungary, as well as in Western Europe and Scandinavia.
All of the aforementioned factors are very promising for the Polish construction industry which is entering a new period marked by great opportunities for development.In the next section, we will try to summarise the current opportunities and describe planned directions for market development.

30
2.2. Key factors in the development of the construction market in PolandIn the coming years, the condition of the construction sector shall be determined by both the economic growth in Poland and infrastructural investments co-financed with EU funds under the new 2014-2020 financial perspective, as well as with domestic funds.
Economic growthIn 2014, following an increase in domestic demand, the Polish economy saw a growth of approx. 3.5% after a GDP growth slowdown seen in the years 2012-2013. According to the Economist Intelligence Unit, in 2015-2018 the average annual GDP growth will reach 3.15%. The future increase in GDP shall be supported by large investments related to the new EU perspective, a growth in net exports, private consumption, the improved standing of the labour market and low interest rates. In a longer run, the level of economic growth in Poland shall get closer to that observed in Western European countries, which will determine further GDP increase. The process is expected to be slow, though, in light of the current condition of the global economy and absence of rapid reforms that could materially increase employee productivity.
Public debtAbility to co-fund infrastructural projects from the national and local budgets depends significantly on the public debt level. At the end of 2014, the public debt to GDP ratio was 47.7%. According to the public debt management strategy for 2015-2018 proposed by the Minister of Finance in 2015, the public debt to GDP ratio shall remain at 48% and further decrease to 44.5% in 2018.
EU fundsThe inflow of EU funds under the 2014-2020 financial perspective is a major factor underlying the development of the Polish construction market. The funds allocated to Poland under the cohesion policy amount to EUR 82.5 billion and include EUR 45.6 billion to be used for subsidies under National Operational Programmes.
Public debt as a GDP percentage
Source: Ministry of Finance „Strategia zarządzania długiem sektora finansów publicznych w latach 2015-2018”, September 2014
GDP growth in Poland
Source: EUI “Country Forecast Poland - August 2015 update”
5.0%
1.6%
3.7%
4.8%
1.9%1.7%
3.5%3.3%
3.0% 2.9%
3.4%
0%
1%
2%
3%
4%
5%
6%
2008
2009
2010
2011
2012
2013
2014
2015
P
2016
P
2017
P
2018
P
53.4%52.6%
53.9%
47.7% 48.0%46.9%
46.0%
44.5%
40%
42%
44%
46%
48%
50%
52%
54%
56%
58%
60%
2011 2012 2013 2014 2015P 2016P 2017P 2018P
Technical assistance (EUR 0.7 bn) Eastern Poland (EUR 2 bn) Digital Poland (EUR 2.2 bn) Knowledge Education Development (EUR 4.7bn) Intelligent Development (EUR 8.6 bn) Infrastructure and Environment (EUR 27.4 bn)
Development of TEN-T road network and multimodal transport
Road infrastructure for cities Development of railway transport in Poland Development of low-emission public transport Other priorities
Rural Areas Development Programme Regional Operational Programmes National Operational Programmes
Source: Ministry of Infrastructure and Development
Polish construction companies 2015: Key players, growth factors and industry development prospects 31
Allocation of EU funds under National Operational Programmes under 2014-2020 financial perspective
Source: Ministry of Infrastructure and Development
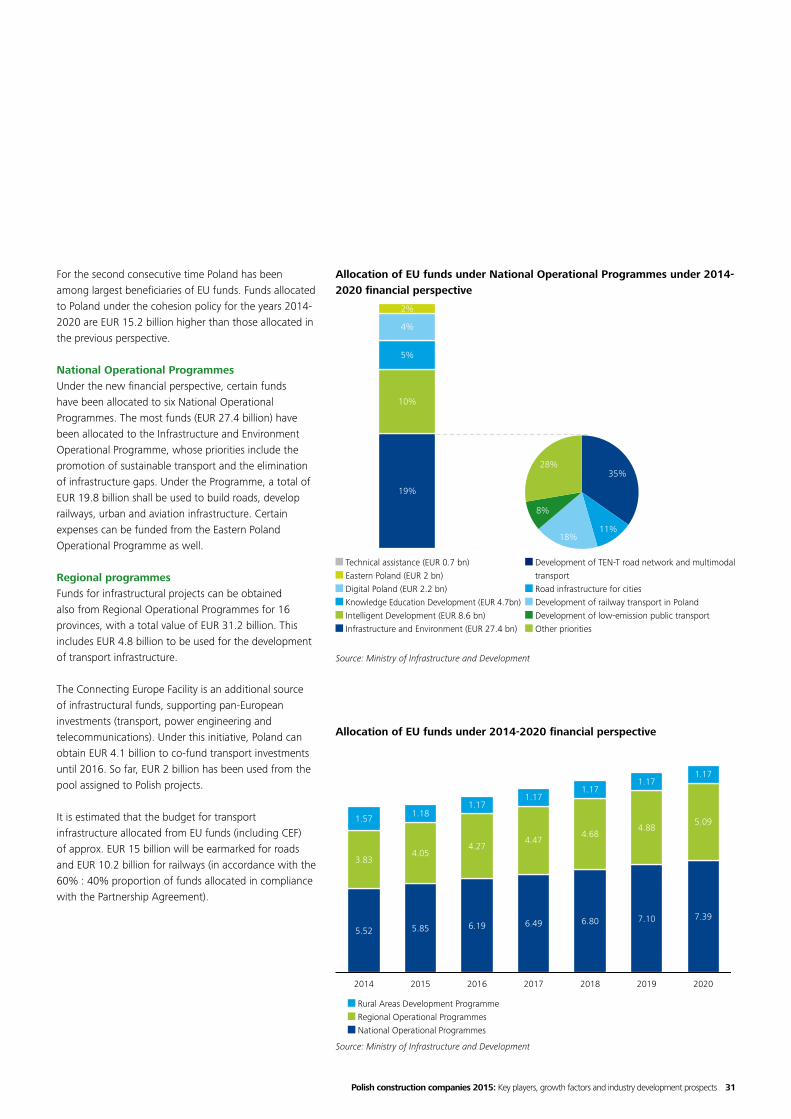
For the second consecutive time Poland has been among largest beneficiaries of EU funds. Funds allocated to Poland under the cohesion policy for the years 2014-2020 are EUR 15.2 billion higher than those allocated in the previous perspective.
National Operational ProgrammesUnder the new financial perspective, certain funds have been allocated to six National Operational Programmes. The most funds (EUR 27.4 billion) have been allocated to the Infrastructure and Environment Operational Programme, whose priorities include the promotion of sustainable transport and the elimination of infrastructure gaps. Under the Programme, a total of EUR 19.8 billion shall be used to build roads, develop railways, urban and aviation infrastructure. Certain expenses can be funded from the Eastern Poland Operational Programme as well.
Regional programmesFunds for infrastructural projects can be obtained also from Regional Operational Programmes for 16 provinces, with a total value of EUR 31.2 billion. This includes EUR 4.8 billion to be used for the development of transport infrastructure.
The Connecting Europe Facility is an additional source of infrastructural funds, supporting pan-European investments (transport, power engineering and telecommunications). Under this initiative, Poland can obtain EUR 4.1 billion to co-fund transport investments until 2016. So far, EUR 2 billion has been used from the pool assigned to Polish projects.
It is estimated that the budget for transport infrastructure allocated from EU funds (including CEF) of approx. EUR 15 billion will be earmarked for roads and EUR 10.2 billion for railways (in accordance with the 60% : 40% proportion of funds allocated in compliance with the Partnership Agreement).
Allocation of EU funds under 2014-2020 financial perspective
19%
10%
5%
4%
2%
35%
11%18%
8%
28%
5.52 5.85 6.19 6.49 6.80 7.10 7.39
3.834.05
4.274.47
4.684.88
5.091.57 1.181.17
1.171.17
1.171.17
2014 2015 2016 2017 2018 2019 2020

Market suffers from the shortage of talents, in particular with regard to railways, electrics, telecoms, utilities or hydro engineering specialists. Qualified production staff is also in high demand. Firms in need of new hires must remember that the Polish labour market has been turning into employee’s market and adjust their HR policies accordingly, bearing in mind not only the need to hire, but also to retain these talents.
Krzysztof Andrulewicz, CEO of Skanska S.A.
32
Number of bankruptcies among contractors in the construction sector in the period from 2011 to Q1 2015
Source: Euler Hermes
Share of construction firm bankruptcies in the number of all announcements
2.3. Bankruptcies in the construction sectorStatistics regarding bankruptcies are a good reflection of the current market condition.2 In the first half of 2015, the balance of bankruptcies decreased by one-third year-on-year and the share of the sector in the total number of bankruptcies dropped by 6 p.p. to 17%.
According to data derived from Euler Hermes reports, in the years 2012-2014, the number of bankruptcies announced for construction contractors decreased every year. During this period, the accumulated annual drop ratio reached 17.9%. The overall condition has improved, but the number of bankruptcies of construction companies compared to other industries was still high in 2014 and accounted for 22.4% of all bankruptcies announced.
Low margins in the construction and assembly sector are still a problem for construction firms. The reasons include pricing competition during tenders, where price is often the key selection criterion. According to the Main Statistical Office, in the years 2012-2014 the combined price decrease index in the sector amounted to 3.0%. Despite the index dropping again in 2014, the number of bankruptcies did not increase, which may be explained by the fact that due to a high number of bankruptcies in the previous year3 only the strongest market players, less sensitive to changes in raw material costs, are still in business.
2 Please note that they do not present the full scale of enterprises facing difficulties. Bankruptcy data does not include liquidated and suspended businesses, which in certain cases results in actual windup.
3 Since 2012, a wave of bankruptcies has gone through the sector. The organisation of the EURO 2012 tournament in Poland resulted in the significant development of infrastructure at the expense of the performance of many construction companies who participated in these investments due to very strong competition and the subsequent “pricing war” that caused a significant reduction of prices in the related tenders. Additionally, the commenced infrastructural projects made the prices of key materials increase, which affected the performance of construction companies. Consequently, in 2012 the number of bankruptcies in the construction industry increased the most in the last decade (according to a report by Arcata Partners). Large companies, such as PBG, Hydrobudowa Polska or DSS, were declared bankrupt, and so were hundreds of their subcontractors. Since then, a reduction in the sales of construction companies declaring bankruptcy has been observed, which confirms that the deterioration in the overall standing has been a problem mostly for subcontractors, not for general contractors, as in 2012.
146
273253
184
9866
0
50
100
150
200
250
300
2011 2012 2013 2014 1H2014 1H2015
17.9%
29% 27% 22% 23% 17%20%
Average gross pay (PLN) Average employment in the year (‘000)
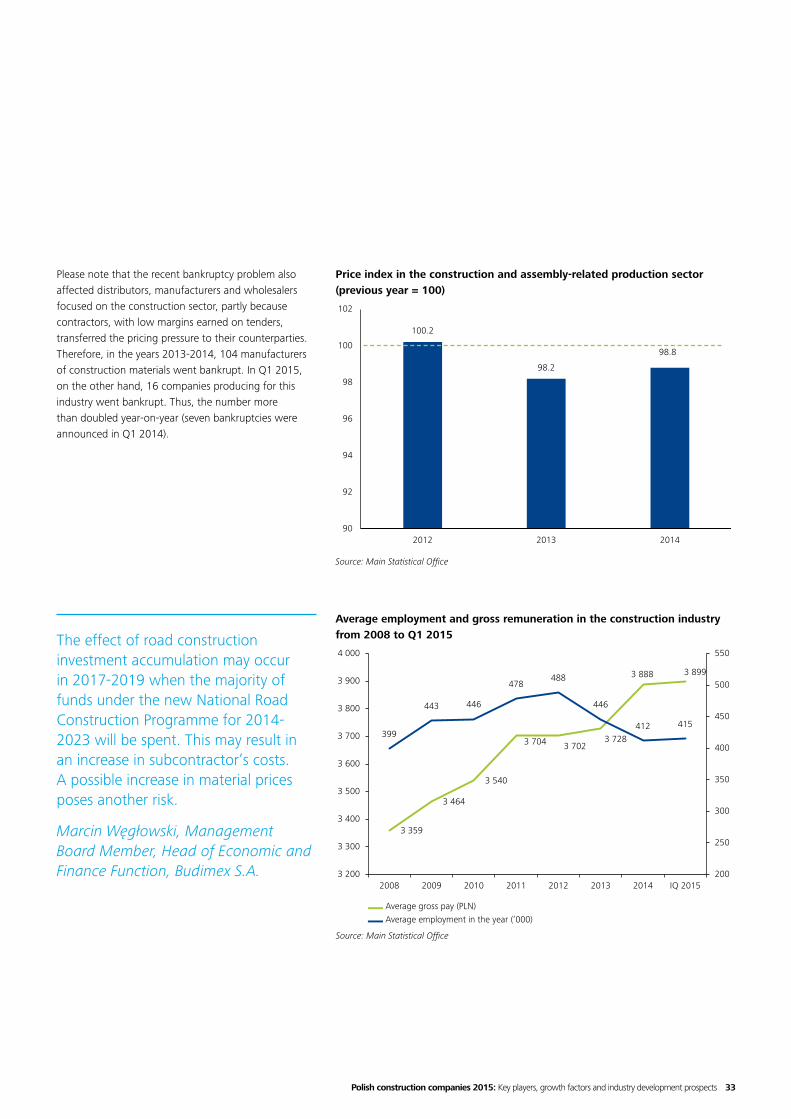
The effect of road construction investment accumulation may occur in 2017-2019 when the majority of funds under the new National Road Construction Programme for 2014-2023 will be spent. This may result in an increase in subcontractor’s costs. A possible increase in material prices poses another risk.
Marcin Węgłowski, Management Board Member, Head of Economic and Finance Function, Budimex S.A.
Polish construction companies 2015: Key players, growth factors and industry development prospects 33
Price index in the construction and assembly-related production sector (previous year = 100)
Source: Main Statistical Office
Average employment and gross remuneration in the construction industry from 2008 to Q1 2015
Source: Main Statistical Office
Please note that the recent bankruptcy problem also affected distributors, manufacturers and wholesalers focused on the construction sector, partly because contractors, with low margins earned on tenders, transferred the pricing pressure to their counterparties. Therefore, in the years 2013-2014, 104 manufacturers of construction materials went bankrupt. In Q1 2015, on the other hand, 16 companies producing for this industry went bankrupt. Thus, the number more than doubled year-on-year (seven bankruptcies were announced in Q1 2014).
100.2
98.2
98.8
90
92
94
96
98
100
102
2012 2013 2014
3 359
3 464
3 540
3 704 3 7023 728
3 888 3 899
399
443 446
478488
446
412 415
200
250
300
350
400
450
500
550
3 200
3 300
3 400
3 500
3 600
3 700
3 800
3 900
4 000
2008 2009 2010 2011 2012 2013 2014 IQ 2015

Average pay per segment Average pay in the construction sector
In the years to come, a continued stable increase of the housing market is expected since the number of flats per 1,000 inhabitants ratio is still low compared to other EU countries and the existing housing resources are of low quality due to a high share of flats in so-called “concrete panel” buildings.
Marcin Węgłowski, Management Board Member, Head of Economic and Finance Function, Budimex S.A.
34
2.4. Employment in the construction sector In 2014, the average employment in the construction sector decreased by 7.7% year-to-year and amounted to 411,500 people. Therefore, the decreasing trend observed since 2012 was still visible. Since January 2015, the negative trend has slowed down. According to data published by the Main Statistical Office, the average employment in Q1 2015 increased by 1.5% year-on-year, and remains low.
In Q1 2015, salaries and wages in the construction sector increased by 5.2% year-on-year.4
The highest average pay level in the construction sector regarded civil and water engineering services, while the lowest occurred in construction of buildings.
4 Please note that due to the seasonal nature of its operations, wages and salaries in the construction sector are usually the lowest in Q1.
Average gross pay in Q1 2015 per construction industry segment
Source: Main Statistical Office
3 617
4 170
3 949
3 899
3 300
3 400
3 500
3 600
3 700
3 800
3 900
4 000
4 100
4 200
4 300
Constructionof buildings
Works related to constructionof civil and water engineering
structures
Specialised construction works

AUG 2013
AUG 2014
AUG 2015
Labour shortage is a hindrance for companies operating in the construction market. As a result, recruitment has focused on immigrants from the East, who, among other things, require additional training with regard to safety standards.
Joanna Makowiecka - Gaca, Chairman of the Management Board, Polimex-Mostostal S.A.
Polish construction companies 2015: Key players, growth factors and industry development prospects 35
Hindrances faced by enterprisesAccording to a survey carried out by the Main Statistical Office among construction companies, since the beginning of 2013, the shortage of qualified staff has been a growing problem. In July 2015, 22% of enterprises considered it a hindrance in their business operation. This fact is confirmed by a report published by pracuj.pl, according to which the number of job offers in this sector, in particular for specialists, has grown substantially. Please note that 62% of employers in the construction sector indicate labour costs as a hindrance in their business operations. This is the largest financial burden for companies in this sector.
Employment projectionsThe newest report entitled Barometr Manpower Perspektyw Zatrudnienia presents employment in the Polish economy projected for Q4 2015. Information presented in the report is based on individual interviews with a selected group of Polish employers and indicate the presence of positive sentiments in the construction sector. The year-on-year employment growth projected for Q4 2015 is 11%. Due to a significant number of projects to be performed in the next six or seven years thanks to availability of EU subsidies under the 2014-2020 financial perspective, an employment growth in the infrastructural construction sector may be expected in a longer time horizon. According to projections by Hays, the increase will focus on the road infrastructure segment with the average employment ratio in the railway infrastructure segment remaining flat. Demand for specialists in heavy construction and power engineering will increase as well.
0%
10%
20%
30%
40%
50%
60%
70%
Employment costs Insufficient demand Costs of materials Shortageof qualified staff

Specialised construction works
Construction of civil and water engineering structures
Construction of buildings
Specialised construction works
Construction of civil and water engineering structures
Construction of buildings
33.5% 33.8%
26.0% 25.8%
40.6% 40.4%
0%
10%
20%
30%
40%
50%
60%
70%
80%
90%
100%
2013 2014
36
Structure of the construction market in Poland in 2014
Source: Main Statistical Office
Polish construction market value by segment in 2010-2014 (PLN bn)
* CAGR - Compound Annual Growth Rate in a given period
Source: Main Statistical Office
2.5. Development outlook for construction segments in Poland
2.5.1. General description and outlookIn 2014 specialist construction services accounted for 40% of the construction market value, construction of buildings – 34% and civil and water engineering services making up the remaining 26%)5. The share of construction of buildings increased slightly year-on-year at the expense of the other segments.
In 2014, following a two-year recession, a symbolic growth of 0.4% in the construction market value occurred, compared to 2013.6 In light of higher economic growth projected for the coming years compared to the period 2012-2013 and planned infrastructural investments, the increase in the value of the construction market should accelerate.
The drop in construction related production in the years 2011-2014 resulted from a number of factors: GDP decrease from 4.8% in 2011 to 1.8% in 2012-2013, the completion of infrastructural investments prepared for EURO 2012, reduced trust and outflow of investors from the real property segment and a general decrease in investments made in other sectors of economy. The significant deterioration observed from 2011 was reflected by the WIG Budownictwo index, which has demonstrated a growing trend since the beginning of 2015.
5 The construction of civil and water engineering structures includes road and railway construction, as well as environmental and energy investment projects (pipelines, telecommunication lines, power lines, etc.). The construction of buildings comprises the construction of residential, office, commercial, industrial and warehouse buildings and structures. The specialist construction consists of demolition work, site preparation, electrical installations, water and sewage systems, painting and finishing.
6 Following the intense growth before 2011, the value of the construction market in Poland amounted to PLN 182.2 billion (+13.2% vs. 2010). During the two subsequent years, a significant decrease in construction-related production was observed in Poland (by 6.3% in 2012 and by 7.4% in 2013 year-on-year).
71.8 64.2 63.1 52.9 53.7
37.7 48.9 47.0
41.0 40.9
51.469.1
60.6
64.1 64.1
2010 2011 2012 2013 2014
CAGR*-4.5%

WIG Budownictwo WIG 20
Investments in expressways and motorways included in the National Roads Construction Programme for the years 2014-2023 (with projections until 2025)
Diversification, which should support margin growth on the highly competitive Polish market, seems to be unavoidable.
Paulo Silva, Management Board Member, Mota-Engil Central Europe S.A.
Polish construction companies 2015: Key players, growth factors and industry development prospects 37
An accelerated market growth in the coming years will be possible thanks to the inflow of EU funds under the 2014-2020 perspective and the expected 3.15% annual average GDP growth between 2015-20187. The projected market acceleration has been confirmed by market analysts who predict the average annual growth of the entire construction market of 4.6%8, in the years 2015-2017, with differences in the growth level in each market segment. According to analysts, the increase in general construction segments in Poland shall reach 2.6% in 2015, while the construction engineering segment will grow by 6.7%.
2.5.2. Road constructionIn 2014, the road construction segment continued projects commenced under the 2007-2013 perspective. The planning of investments for the new 2014-2020 perspective has commenced.
In the previous years, the National Roads Programme for the years 2011-2015 was the key document determining the development directions of the road construction segment.
Only in 2014, 331.7 km of national roads were commissioned (four sections of motorways, six expressways and two ring roads). In 2014 the total cost to the National Roads Fund and State Treasury in this respect was almost PLN 9.6 billion. Investments co-funded by the EU under the 2014-2020 perspective shall be based on the National Roads Construction Programme for the years 2014-2023 (with projections until 2025) developed by the Ministry of Infrastructure and Development (henceforth: ”NRCP”) being a follow-up of the previous Programme.
7 According to projections of the Economist Intelligence Unit. 8 Based on the report “Construction Market in Poland 2015- 2019”
prepared by TechNavio.
WIG Budownictwo and WIG20 index in the period from 31 July 2008 to 18 September 2015
Source: National Roads Construction Programme for the years 2014-2023 (with projections until 2025)
Completed or pending investments New investments included in NRCP 2014-2023 New investments included in the funding system beyond the state budget
0
500
1000
1500
2000
2500
3000
3500
2014-12-30 2015-06-30

EU funds
National Road Fund
State budget
38
As in the preceding period, in 2014-2023, investments within the National Road Construction Programme will be financed from the National Road Fund, contributed to from a variety of sources9, including, among others, through EU funding. State budget funds will be used to maintain technical standards of the existing road network, prepare tasks to be performed in the future and carry out management roles. Expenditure on national roads to be incurred in 2014-2025 are estimated at PLN 168.4 billion, out of which PLN 14.5 billion shall be used to continue the tasks under the National Roads Construction Programme 2011-2015 and PLN 107.1 billion to finance investments under the 2014-2020 EU perspective. Out of this amount, PLN 97.5 billion shall be used to build motorways and expressways, and PLN 9.6 billion for ring roads. The list of tasks includes two motorway sections, 49 expressway sections and 57 ring road sections of trunk roads.
Following public consultation, the NRCP has been extended for two additional years (2024 and 2025) and the pool of the National Roads Fund assigned to tasks performed under the 2014-2020 perspective has been increased by PLN 14.4 billion10. The objective of the NRCP is to complete the target motor- and expressway network in Poland as defined in the Transport Development Strategy until 2020 (with projections until 2030)11. The completion of the task shall depend also on the value of savings on investment projects. The amount of the savings may be substantial, as confirmed by an analysis of tenders already closed under the new EU perspective. The average price of winning tenders in projects included in our analysis (the total value of which constitutes nearly 30% of the accepted tenders amounting to PLN 30 billion) constituted 70% of the investment value as estimated by the General Directorate for National Roads and Motorways.
9 Defined in the Act on toll roads and National Road Fund of 27 October 1994 (Journal of Laws of 2012 item 931 as amended).
10 Ministry of Finance and the Council of Ministers approved the increase of the investment pool.
11 Transport Development Strategy defines the target motor- and expressway network in accordance with the Ordinance of the Council of Ministers of 20 October 2009 amending the ordinance on the network of motor- and expressways.
Funding sources for railway infrastructure investments in 2014-2025 (PLN bn)
Source: National Roads Construction Programme for the years 2014 – 2023 (with projections until 2025)
Length ratio of expressways and motorways (km / 1,000 sq. km of national territory)
Source: General Directorate forNational Roads and Motorways, Eurostat, Deloitte analysis.
2.9 2.9 3.15.1 5.2 5.3 5.4 5.5 5.6 5.7
1.6
6.2
10.5
12.5 11.59.6
10.97.9
1.71.15.2
2.7
5.4
8.5 10.5
10.35.3
0.2
0.0
5.0
10.0
15.0
20.0
25.0
30.0
2014 2015 2016 2017 2018 2019 2020 2021 2022 years2023-25
9.7
36.2
32.8
20.8 20.5
15.7 15.1 14.5
0.0
5.0
10.0
15.0
20.0
25.0
30.0
35.0
40.0
PolandRepublic
Germany Spain France Austria CzechRepublic
UK Ireland

Investments under 2014-2020 EU perspective
Continued investments
Maintenance and management expenses (financed from the state budget)
Polish construction companies 2015: Key players, growth factors and industry development prospects 39
The network of trunk roads, accounting for 4.7% of the total length of public roads in Poland, supports over 60% of traffic. This confirms the necessity to carry out broad-scale investment projects concerning these roads especially that Poland lags behind other EU countries in terms of the density of its expressway and motorway network. For example, expressways and motorways account only for 9.7 km per 1000 sq. km of land in Poland compared with 36.2 km in Germany. The objective determined in the NRCP is to achieve the density ratio of 22.7 km / 1,000 sq. km.
The poor technical condition of roads, which deteriorated in 2014 despite significant investments, has remained a problem in Poland. At the end of 2014, 13.2% of the roads were considered ‘in poor condition’ (compared with 12.5% at the end of 2013) and 25.1% were deemed ‘unsatisfactory’ (compared with 21.4% in 2013).
According to the Report on the Technical Condition of Trunk Roads at the end of 2014 prepared by the General Directorate for National Roads and Motorways, the deterioration in the technical condition of these roads has resulted from the reduced length of road sections commissioned and refurbished in 2014 compared to 2012 and 2013 (mainly resulting from a reduction of funds assigned to the Directorate, unfavourable climate conditions and the growing number of trucks). The General Directorate for National Roads and Motorways (GDNRM) assumes that financial needs related to the improvement of roads assessed as in poor or unsatisfactory condition shall amount to PLN 6.6. billion in 2015.
Expenditure on trunk roads in the years 2014-2025 (PLN bn)
Source: National Roads Construction Programme for the years 2014 – 2023 (with projections until 2025)
Condition of surface of trunk roads per province (at the end of 2014)
Source: Report on the Technical Condition of Trunk Roads at the end of 2014, GDNRM
Performing most works with the use of own resources allows effective control of projects and keeping the deadlines.
Paulo Silva, Management Board Member, Mota-Engil Central Europe S.A.
2.9 2.9 3.15.1 5.2 5.3 5.4 5.5 5.6 5.7
6.13.8 3.1
1.2 0.3
0.65.2
12.8
19.8 21.620.0
16.2
8.11.7 1.1
0.0
5.0
10.0
15.0
20.0
25.0
30.0
2014 2015 2016 2017 2018 2019 2020 2021 2022 years2023-25
Good condition
Unsatisfactory condition
Poor condition
Legend

40
Network of provincial, municipal and county roadsApart from trunk roads (to include motor- and expressways), the Polish network of public roads includes also those maintained by local governments: provincial, county and municipal.
The Ministry of Infrastructure and Development supports the financing of investments in provincial, county and municipal roads under the general subsidy provision and the National Programme for Local Roads Redevelopment (henceforth: NPLRR) valid until the end of 201512.
In September 2015 the Council of Ministers passed the Programme for Development of Municipal and County Road Infrastructure for 2016-2020, being a follow-up of NPLRR. Subsidies available under the programme in the years 2016-2020 total to PLN 4 billion13. which will allow construction, redevelopment and renewal of approx. 2,200 km of county and municipal roads each year.
12 National Programme of Local Roads Redevelopment has been carried out since 2008 and expires at the end of 2015. In the period 2008-2014 local self-government entities carried out over 4,900 investments and renewals totalling to nearly PLN 9.3 billion under the programme. The amount of PLN 4.4 billion was assigned to these tasks from the state budget. The programme has resulted in improvement and extension of the local roads network with the total length of 12,200 km.
13 PLN 800 million, PLN 1 billion, PLN 1.1 billion and PLN 1.1 billion in subsequent years.
According to the Supreme Control Chamber (NIK), 25% of county and municipal roads are in poor condition, with a mere 29% being in good and satisfactory condition14. The poor condition of these roads and no funds earmarked for the co-financing of local road infrastructure investments15 under the new EU perspective require the provision of financial support from the state budget.
14 As in March 2014 including the effects of NPLRR implementation. 15 Investments in provincial roads may be funded under Regional
Operational Programmes.
Classes of public roads in Poland
Road class Length [km] Share [%] Managing body* Owner
Trunk roads 19 296 4,7% GDNRM State Treasury
Provincial roads 28 480 6,8% Province authorities Provincial self-government
County roads 125 274 30,1% County authorities County self-government
Municipal roads 242 923 58,4% Mayor Municipal self-government
Total 415 973 100% - -
*In the territory of cities classified as counties, the city president is the managing body of all public roads except of motor- and expressways.
Source: National Roads Construction Programme for the years 2014-2023 (with projections until 2025), Deloitte analysis
The legal system discouraging investments, all the way from the public procurement law to the local zoning plans, hinders the development of the railway market in Poland. Additionally, the price remains the key criterion in tenders and risks are not equally distributed between contract parties.
Jarosław Tomaszewski, Chairman of the Management Board, TRAKCJA PRKiI S.A.

Performance
Estimates
Projection
Infrastructure and Environment OP
Regional Operational Programmes
State budget
Railway Fund
TEN-T
Polish construction companies 2015: Key players, growth factors and industry development prospects 41
2.5.3. Railway constructionThe railway construction sector including the improvement and construction of railway and tram infrastructure is another segment with fast-growth forecasts.
Almost 20,000 km of railways are used in Poland, out of which approx. 93% is managed by PKP PLK S.A. The technical quality of the railway infrastructure is unsatisfactory. Only 47% of the total railway length is considered to be in good condition, with the condition of 27% being considered satisfactory and of 26% - unsatisfactory.
Improving the technical condition of the infrastructure to make railway transport safer and more efficient and thus more important in the integrated national transportation system is the key objective of investments in railway infrastructure.
The railway investment framework has been determined by two documents: the Long-Term Railway Investment Programme until 2015 (LTRIP) which was updated and extended with forecast until 2020, following the transfer and continuation of investment programs under the 2007-2013 EU perspective and the National Railway Programme until 2023 (NRP) being a follow-up of the LTRIP, approved by the Council of Ministers on 15 September 2015.
As a follow-up of the LTRIP, the NRP, which will expire in 2016, includes projects under the 2014-2020 perspective, phased projects (commenced under the 2007-2013 perspective and continued under the 2014-2020 perspective) and those carried out under CEF16. The forecast value of projects included in the NRP, assuming the maximised use of EU funds available under the 2014-2020 perspective, funds provided by the state budget and the Railway Fund is PLN 67.5 billion. Should the European Commission decide not to fund the phased projects from the two financial perspectives, the NRP assumes they will be subsidised with domestic funds.
16 CEF is discussed in the “EU funds” section hereof.
Expenditure for railway investments of PKP PLK (PLN bn)
Source: Reports of PKP PLK, Long-term Railway Investment Programme, National Railway Programme, Deloitte analysis
Funding of railway investments under LTRIP (PLN bn)
Source: Long-term Railway Investment Programme until 2015 with projections until 2020
1.42.4
3.2 2.8 2.83.8 3.9
5.36.0
9.0
7.26.2
9.5
14.3
18.4
7.0
3.01.9
2006 2007 2008 2009 2010 2011 2012 2013 2014 2015 2016 2017 2018 2019 2020 2021 2022 2023
21.3
1.5
8.6
0.2 0.1

Other
ROP 2007-2013
ROP 2014-2020
EP OP
Source: Reports of PKP PLK, Long-term Railway Investment Programme, National Railway Programme, Deloitte analysis
42
Under the LTRIP, in 2011-2014, 65 investment projects with a total value of PLN 6.5 billion were completed, out of 153 investments planned until 2020 under the Programme, with the total value of PLN 31.6 billion (out of which PLN 6.0 billion was used in 2014 and expenditure planned for 2015-2016 amounts to PLN 9.0 billion and 5.6 billion, respectively).
Representatives of construction companies are afraid that in 2016, performance gaps will occur and in 2019-2020 investments will accumulate, which may result in an accumulation similar to that observed in road construction projects performed under EURO 2012. By the end of August 2015, PKP PLK had not announced any construction projects under the new perspective. Responding to concerns raised by construction companies, PKP PLK has announced that by the year-end it would organise tenders amounting to PLN 11 billion. By 22 September 2015, the company called for tenders for the completion of the improvement of the RailBaltica line and the construction of ERTMS/GSM-R infrastructure.
The condition of the railway construction sector depends not only on the number and volume of investments funded from the state and EU budget, but also on the involvement of local authorities, especially local municipal investment plans in respect of the maintenance and repair of commuter rail. The tasks are financed with special purpose funds and the Railway Fund. The schedule of works and expenditures included in the Railway Fund projects assign PLN 237 million for this purpose in the years 2014-2019.17 The amended Act on the Railway Fund signed by the President on 5 August 2015 projects additional support for local governments amounting to PLN 400 million in 2016-2020 perspective18.
17 Data regarding allocation of the Railway Fund money, later than those presented in the previous version of the report, are not available.
18 Detailed allocation of funds will be known only after the schedule of works and expenditures has been updated by the Council of Ministers.
Funding of investments under NRP in the years 2016-2023 (PLN bn)
I&E OP 2007-2013
I&E OP 2014-2020
CEF
Investments in railway infrastructure planned for 2014-2020, included in the National Railway Programme vs. implemented LTRIP projects
In the case of railway projects, accumulation in a short period may result in the risk of a sharp increase in demand for working capital and a growth in the prices of construction materials.
Jarosław Tomaszewski, Chairman of the Management Board, Trakcja PRKiI S.A.
0.7 1.63.4
5.46.5
2.80.7 0.5
1.8
2.7
3.7
5.6
7.8
3.1
1.20.3
3.4 0.1
0.2
0.7
0.7
0.4
1.3
2.4
1.2
1.8
1.8
1.2
1.0
1.0
1.01.0
2016 2017 2018 2019 2020 2021 2022 2023

Polish construction companies 2015: Key players, growth factors and industry development prospects 43
City plans also include investments in the construction and refurbishment of tramlines. According to the Long-Term Financial Plans of the six largest cities in Poland the aforementioned expenditure could reach about PLN 1.5 billion in the years 2015-202019.
2.5.4. Power engineering construction20
Large-scale power engineering investments have been planned in Poland. According to data provided by the Energy Regulatory Office, energy enterprises plan to commission new power units with a total capacity of 18 GW in 2014-2028, out of which 7.5 GW will involve wind power investments. The total investments in power generation estimated for the years 2014-2028 will amount to PLN 55 billion.
Wind farms have the largest share (40%) in the total investment value, followed by units fuelled with hard coal (32%) and natural gas (22%). Over 60% of investments in an advanced stage of completion are based on hard coal. The commissioning of substantial capacity power generators is planned for the period from 2017 to 2019.
Key investments in the energy sector (by stage of completion):
Investments in progress:
1. Power unit in Kozienice (900-1,000 MW, hard coal);
2. Two power units in Opole (2 x 900 MW, hard coal);
3. Power plant in Stalowa Wola (450; 240 MW; natural gas);
4. Power plant in Włocławek (463 MW; natural gas);
5. Heat and power plant in Bydgoszcz (437 MW; natural gas);
6. Power plant in Turów (450 MW, brown coal);
7. Power plant in Jaworzno (910 MW, hard coal).
19 The estimated amount does not reflect the total value of investment in city tram routes, though, since it includes only investments planned in municipal budgets, without expenses of municipal transport companies.
20 State documents regarding planned power engineering investments, discussed in the previous edition of the report, remain up to date.
Investment outlays planned for the years 2014-2028 by type of fuel technology (PLN bn)
*Excluding the planned nuclear power plant.
Source: ERO
Hard coal 26,5 Colliery gas 0,7 Sun energy 0,0 Natural gas 13,4 Brown coal 3,3 Other 0,8 Water 0,9 Biomass 0,4 Wind 8,9
Biomass 0.5% Sun energy 0.0% Colliery gas 0.5% Brown coal and other 4.5% Natural gas 22.0% Wind 40.2% Hard coal 32.3%
Biomass 0.4% Sun energy 0.1% Colliery gas 1.2% Brown coal and other 12.5% Natural gas 24.6% Wind 0.8% Hard coal 60.5%
Investment outlays planned for the years 2014-2028 by type of fueltechnology (PLN bn)
Source: ERO
4.5%
22.0%
40.2%
32.3%
12.5%
24.6%
60.5%
0.4%0.1%
1.2%
0.8%
0.5%
0.5%
26.5
13.4
3.3
8.9
0.7
0.80.90.4

44
Agreement signed / tendering procedure in progress:
1. Łagisza power plant (413 MW, natural gas), a co-funding agreement signed by Polish Development Investments (PIR). Work commencement is planned for 2015/2016 and the completion in the second half of 2018;
2. Żerań heat and power plant (420-490 MW; natural gas);
3. Płock power plant (400 – 600 MW, natural gas; planned commissioning deadline – 2017/2018).
Planned investments / pre-investment analyses:
1. Północ electric power plant (target capacity 2 x 800 MW; hard coal; agreement for stage one with a capacity of 800 MW signed, but administrative procedures regarding the permission have been suspended);
2. Grudziądz power plant (about 420-600 MW; natural gas);
3. Puławy power plant (about 400 MW; natural gas).
Plans regarding the construction of a nuclear power plant in Poland constitute a material aspect of power engineering investments. In January 2014, the Council of Ministers adopted the Polish Nuclear Energy Programme (PNEP). Under the programme, the costs of constructing a nuclear plant are estimated at PLN 40 to 60 billion. According to the timeline adopted in the PNEP, the location shall be determined and a contract for supply of a selected technology for the first power station shall be signed by the end of 2016, while the first power unit will be built between 2019-2024. The completion of the first nuclear power plant is planned for 2031, and of the second one, for 2035.
There are new investment plans for the Renewable Energy Sector in Poland, too. According to the Energy Regulatory Office, the capacity of renewable energy sources is 6.3 GW (as at 30 June 2015). Based on the Regulatory Impact Assessment of the Act on Renewable Energy Sources of 20 February 2015, the estimated total increase of installed capacity in RES, included in the system support for the years 2015-2020 should reach approx. 4.2 GW21. Therefore, by 2020, power generation in this segment would increase to approx. 32.4 TWh (in 2015-2020, the increase should reach approx. 15.7 TWh).
21 At present, amendments to the Act on RES have been prepared, but the Regulatory Impact Assessment including the amendments is not available yet.
Table: Total agreed capital expenditure of the five distribution system operators (DSO) and a transmission system operator (TSO) in 2014-2019 (in PLN million.
Year 2014 2015 2016 2017 2018 2019
Outlays 6482* 6800 7419 7617 8199 5246**
*Actual performance** Outlays of five DSO (without the TSO).
Source: Energy Regulatory Office
ŻarnowiecChoczewo
Gąski Rajkowy
Grudziądz
Bydgoszcz
WłocławekPłock
Żerań
Kozienice
Stalowa Wola
Turów
Opole Łagisza
Jaworzno
Puławy
Hard coal
Brown coal
Natural gas
Possible locations of the nuclear plant
Picture 1: Map of selected key planned investments in power generation units
Source: Deloitte’s own analysis based on information of CIRE (www.cire.pl)

Polish construction companies 2015: Key players, growth factors and industry development prospects 45
According to the Energy Market Agency, the share of renewable energy in Poland will account for about 19% in 2030.22
Apart from investments in capacity, a series of projects involving the extension of the transmission and distribution network is planned (total budget assigned for the years 2014-2019 is approximately PLN 42 billion).
The estimated capital expenditure of the five largest DSOs in the years 2014-2019 will reach approx. PLN 35 billion according to development plans agreed with ERO.
PSE, the distribution system operator, is planning to spend approx. PLN 1.1 billion for infrastructural investments in 2015 only.
The total investment of PSE in the power network in the years 2015-2019 is estimated at PLN 7 – 8 billion. They will include the construction of 19 transmission lines including approx. 2,677 km of current circuits (200 kV and 400 kV) and seven power substations, as well as the extension of 47 substations of various voltages. Approximately 18% of the total expenditure shall be assigned to the improvement of infrastructure and installation of 44 transformers.
Some investments undertaken by PSE, e.g. the project involving the construction of a power connection between Poland and Lithuania and extension of the power network in Słupsk to connect wind farms, are to be co-funded by the European Union.
22 Projected nuclear power plant capacity structures by 2030 assuming pre-determined technical and economic parameters, ARE S.A., June 2013.
Estimated capital expenditure of the largest DSOs in the years 2014-2019 (PLN bn)
Picture 2: Transmission network map – status projected at the end of 2018
Source: PSE, Updated plan of satisfying the current and future power demand for 2010 – 2025 regarding the period 2014 –2018
750 kV
400 kV
220 kV
Legenda:
KOP
BYD
JAS
PLE
CZE
PPD
MON
GLN
PLC
GOR
DUN
SLK
ZRC
GBL
GDA
GRU
TEL
PAT
KON
ADA
OLM
OLS
PLO
PDEMSK
SOC
LSN
LES
OSRZUKPOL
CRN
MIK
HAG
VIE
PIA
SDU
KOZ
ROZPUL
ABRCHS
NAR
BIA ROS
OSC
MKR
ZAM
DOB
STWCHM
PEL
RZE
BGC
KPK
RAD
KIE
JAN
PIO
PAB
ZGI
TRE
ROG
JOA
ANI
HCZ
WRZ
LOS
TAW
ATA
KLA
KRI
WAN
LUASIE
ROK
GRO
DBN
ZBK
SWI WRC
PAS
BOG
CPC
ALBNOS
TCN
KRA
LEM
KRM
OLT
SKA
MOR
LSY
PKW
ZYD
OST
BLA
REC
POM
KED
CHAWIE
LAG
PRBCZT
ZAP
BUJKOM
BIR
HALKAT
JAMKHK
MOS
LIS
LMS
MIL
PBO
STN
BYC
BCN
ZDK
ALY
ELKBISELK
WPR
WLA
WWTT OO
ZGC
SDP
PLP
GDP
KLE
BSP
BEK
400 220 kV
450 kV
( ) w latach 2014-20182018
Source: Deloitte analysis
There are significant opportunities to develop and diversify our business operations through implementation of infrastructural projects on Scandinavian markets.
Paweł Nogalski, Vice-Chairman of the Management Board, CFO, Trakcja PRKil S.A.
2
5
8
10 10
0
2
4
6
8
10
12
RWE StoenOperator
Enea Operator Energa operator Tauron Dystrybucja PGE Dystrybucja

The current accumulation of construction projects in the power engineering sector has demonstrated a shortage of specialized design companies. A similar accumulation of projects may be expected in the railway sector.
Joanna Makowiecka - Gaca, Chairman of the Management Board, Polimex-Mostostal S.A.
46
2.5.5. Environmental protectionWater management/sewage treatment and waste treatment are other market segments that will benefit from the EU funds under the 2014-2020 financial perspective. Thanks to these funds, Poland shall continue the investment programme commenced after its EU accession, aimed at adjusting its water management, sewage treatment and waste treatment system to parameters determined by the EU under the Council Directive concerning urban waste water treatment (91/271/EEC), as well as the Framework Directive and the Directive on the landfill of waste. The water management/sewage treatment and waste treatment sectors shall be beneficiaries of the Infrastructure and Environment Operational Programme. Funds allocated to these two sectors under the Programme in the period 2014-2020 amount to EUR 1.62 billion and EUR 0.93 billion, respectively.
Water management and sewage treatmentMaster Plan for Implementation of 91/721/EEC Directive (“Master Plan”) and the National Urban Waste Water Treatment Programme (NUWWTP) are the documents determining the planned water management/sewage treatment investments. In May 2015, the Ministry of Environment approved the Master Plan and the updated NUWWTP.
Under the newest update, the estimated total value of the investments incorporated in the NUWWTP for the years 2014-2015 amounts to PLN 6.5 billion, and the total projected outlay, along with the amount to be spent after 2015, will reach PLN 28.2 billion.
Investments included in the 4th update of National Urban Waste Water Treatment Programme
Investment 2014-2015 After 2015
Sewage networkconstruction
4 635 km 15 996 km
Sewage networkimprovement
688 km 3 274 km
Sewage treatment plant construction
28 91
Improvement and/or extension of sewage treatment plants
230 646
after 2015*
2014-2015
Assumed budget for National Urban Waste Water Treatment Programme (PLN bn)
*Completion of all investments is planned by 2022.
Source: Masterplan of implementation of Directive 91/271/EEC
3.8
2.7
14.3
7.5
Sewage systems
Sewage treatment
0.0 5.0 10.0 15.0

Project location
MSWTTP productivity
(tonnes’000 / year)
Estimated project cost (mln PLN)
Subsidies from I&EOP (PLN mn)
Implementation form
Projected implementation period 2014-20
Existing
Warsaw 40 Traditional Operating
Under construction
Kraków 220 797 372 Traditional Under construction (construction stage: 2012-2016)
Szczecin 150 666 255 Traditional Under construction (construction stage: 2012-2016)
Bydgoszcz 180 491 260 Traditional Under construction (construction stage: 2012-2015)
Białystok 120 333 210 Traditional Under construction (construction stage: 2012-2015)
Konin 94 296 155 Traditional Under construction (construction stage: 2012-2015)
Poznań 210 725 340 PPP Under construction (construction stage: 2012-2016)
In pre-construction stage
Warszawa 305 1 100 Traditional
The city has signed an agreement with Municipal Waste Management company to extend the incinerating plant. A tender for selection of a designer for the extension and improvement of the plant is pending. The planned commissioning deadline is 2019.
Oświęcim 160 400 Traditional A contractor has been selected. The project should be completed in 2018.
Łódź 200 1 130 PPP A technical dialogue is pending.
Koszalin 92 340 PPP The contractor selecting procedure is being carried out.
Gdańsk 250 400-500 PPPA procedure of selecting the designer, contractor and operator if the incinerationplant in Szadółki near Gdańsk is being carried out. The construction work is planned for the years 2018-2020.
Olsztyn 100 250 PPP
The project is in the planning stage. An application of co-funding from PIR (Polish Development Investments) has been initially accepted (the PIR investment would amount to PLN 100 million). The commencement of the investment is planned for 2016, and completion for 2019-2020.
Rzeszów 100 300 TraditionalThe environmental decision is positive, but the construction permit has not been obtained.The planned commissioning date: 2018.
Legnica 120 347 Traditional No decision has been taken to commence the investment.
Sosnowiec 180 480 Traditional No decision has been taken to commence the investment.
Discontinued investment
Ruda Śląska 500 1 699 Traditional The investment has been discontinued.
Current capacity of the thermal treatment plant 40,000 tonnes per year
Target capacity to be achieved in 2016 1,014,000 tonnes per year
Potential capacity if all considered investments are carried out 2,481,000 tonnes per year
Municipal Solid Waste Thermal Treatment Plants under construction and in pre-construction stage
Polish construction companies 2015: Key players, growth factors and industry development prospects 47
Waste managementThe National Waste Management Plan 2014 (NWMP) is the key document describing waste management investment plans in Poland. On 28 July 2015, updated draft assumptions to the NWMP were released. Objectives and tasks determined in the document pertain to the period 2016-2022 and 2023-2030 for a longer perspective. The key objective of the NWMP is to avoid waste generation and use waste as resources. The objective complies with measures determined in the Infrastructure and Environment Operational Programme for municipal waste treatment.
Funds allocated to municipal waste treatment under the I&E OP in 2014-2020 perspective amount to EUR 0.93 billion.
Poland has only one incinerating plant operating in Warsaw, capable of processing less than 50 thousand tonnes of waste a year. Extension of this installation is planned to achieve a capacity of 305 tonnes per year. Six more incinerating plants are under construction (in Białystok, Bydgoszcz, Konin, Kraków, Poznań and Szczecin), and construction of new plants is planned in Gdańsk, Łódź, Koszalin and Olsztyn (as elements of heat and power plants).
Source: Deloitte analysis

48
2.5.6. Construction in the retail and service sectors Currently, 10.3 million sq. m of modern retail space is available in Poland. In 2014, 474,700 sq. m of modern retail space was added to the market which constituted a 23% increase compared to 2013. Most of the new commercial facilities were smaller-format ones. Analysts predict that in the next few years developers will begin abandoning large-format retail space in favour of building smaller-format shopping centres. At present, a clear market trend towards constructing small-format retail space in small towns is visible. In 2014, 48% of modern commercial space was commissioned in cities below 100,000 inhabitants (vs. just 24% in 2013) with a mere 9% of the supply offered in the largest
agglomerations (vs. nearly 70% in 2013). The ongoing expansion of convenience stores in shopping centres and retail parks gives the industry hope that this market segment is far from saturated and has a very good outlook.
At present, facilities of approx. 900,000 sq. m of commercial space are being constructed, out of which over 62% (563,000 sq. m.) are to be commissioned in 2015, to include 470,000 sq. m to be used by shopping centres
Supply of commercial space (GLA sq. m / 1,000 inhabitants)
Source: Cushman and Wakefield, Global Shopping Centre Development Report, spring 2014
0
200
400
600
800
Nor
way
Luxe
mbo
urg
Esto
nia
Swed
en
Slov
enia
Finl
and
The
Net
herla
nds
Irela
nd
Switz
erla
nd
Aus
tria
Den
mar
k
Lith
uani
a
Latv
ia
Cro
atia
Port
ugal UK
Fran
ce
Spai
n
Pola
nd
Italy
Cze
ch R
epub
lic
Slov
akia
Mal
ta
Ger
man
y
Hun
gary
Rom
ania
Turk
ey
Russ
ia
Belg
ium
Bulg
aria
Ukr
aine
Gre
ece
Bosn
ia a
nd H
erze
govi
na
Serb
iaEU average

Number of commissioned flats
Issued permits for construction of residential buildings
Polish construction companies 2015: Key players, growth factors and industry development prospects 49
2.5.7. Residential constructionLong-term projections for residential construction companies are good. Poland is one of the last countries in Europe in the ranking of the number of flats per 1,000 inhabitants, which illustrates the existing residential construction investment potential.
In 2014 and in the first half of 2015, the residential property market was characterised with strong demand. According to REAS, in Q2 2015, over 12,700 flats were sold in the six largest Polish cities, and during the last four quarters, the number reached 48,500, which is over 27% more than in the record years 2007 and 2013, when about 36,000 flats were sold per year. The period marked with very good sales results on the developer market has lasted nearly two years.
The increased demand for flats has translated into growth in supply. The recovery of the residential construction market was visible in the first half of 2015, in particular in Q2, when 20,000 construction permits were issued, which was a 7% increase year-on-year, and contributed to the construction of 49,000 flats, which signified a 21% increase year-on-year. The number of flats commissioned in Q2 2015 increased by 5% year-on-year.
Number of commissioned flats and construction permits issued (‘000)
Source: Main Statistical Office, Polish Bank Association
Number of flats sold in six largest Polish cities (‘000)
Source: REAS
Number of flats per 1,000 inhabitants in 2014
*Data for 2013Source: Deloitte analysis
In the nearest future, growing competition and new market players should be expected in the railway sector.
Paweł Nogalski, Vice-Chairman of the Management Board, CFO, Trakcja PRKil S.A.
342 363
441 442 446 451 458 461492 508 511 528 549 565 580
0
100
200
300
400
500
600
700
Polan
dRu
ssia
Irelan
d UK
Hunga
ry
The N
etherl
ands
Czech
Repu
blic
Belgi
um
Denmark
German
y
Franc
eSp
ain
Portu
gal*
Italy*
7.5 7.66.4 6.7
7.48.1
9.610.9 11 10.4 10.4
11.2 11.512.7
0
2
4
6
8
10
12
14
I kw
201
2
II kw
201
2
III k
w 2
012
IV k
w 2
012
I kw
201
3
II kw
201
3
III k
w 2
013
IV k
w 2
013
I kw
201
4
II k
w 2
014
III k
w 2
014
IV k
w 2
014
I kw
201
5
II kw
201
5
160
136 132
153145 143
64
91 88 8576
67 65
35
0
20
40
60
80
100
120
140
160
180
2009 2010 2011 2012 2013 2014 I poł. 2015

50
Demand factors on the residential construction marketThe key factors determining the standing of the residential construction market have included low interest rates, faster GDP growth seen since 2014 vs. 2012-2013 and the “Flats for the Young” programme.
The low interest rates have significantly reduced the cost of purchasing a flat. Lately, though, the number of new mortgage loans has decreased. There was a turnaround in Q2 2015, when the number of loan agreements signed was 10% higher than in the preceding quarter, and increased 2% year-on-year.
Starting up the “Flats for the Young” programme in 2014 contributed significantly to the sales level. The scale of interest in the program has grown substantially since its inception. According to an analysis by REAS, in Q2 2015, the number of applications for subsidies submitted in most Polish cities increased compared to the previous quarter, with nearly 20% of flat purchase transactions being supported with funds from the “Flats for the Young” programme. The interest in subsidies under the “Flats for the Young” is estimated to grow following amendments to the programme introduced
in 2015, and some funds will be allocated to the secondary market.
The increase in demand on the residential market was partly caused by a growth in importance of investment transactions resulting from reduced attractiveness of investments in the form of deposits due to low interest rates and a slowdown on the Warsaw Stock Exchange following a reduction in assets managed by Open-ended Pension Funds resulting from a reform of the pension system. This reduced the attractiveness of stock investments due to lower liquidity, which in turn increased the risk of quoted securities since investment portfolios cannot be substantially remodelled in a short period of time.
Number of new mortgage loan agreements concluded (‘000) Value of new mortgage loans originated (PLN’000,000)
Number and value of new mortgage loan agreements concluded in the period from Q1 2014 to Q2 2015
Source: Polish Bank Association
41.9
45.5
43.743.0
42.2
46.5
8 854
9 577
9 2329 161
8 978
10 058
39.0
40.0
41.0
42.0
43.0
44.0
45.0
46.0
47.0
8200
8400
8600
8800
9000
9200
9400
9600
9800
10000
10200
Q1 2014 Q2 2014 Q3 2014 Q4 2014 Q1 2015 Q2 2015

Q4 2014
Q4 2013
Office space available per region in Q4 2014 and Q4 2013 (in percent)
Source: DTZ analysis
Office space available per region in Q4 2014 and Q4 2013 (in percent)
Q4 2014
Q4 2013
Source: DTZ analysis
Polish construction companies 2015: Key players, growth factors and industry development prospects 51
2.5.8. Office space constructionIn 2014, the office space construction market saw a substantial supply increase. At the end of 2014, the supply of office space in the nine largest Polish cities was 7,550,000 sq. m, i.e. approx. 8% more than a year before. In 2014, 622,000 sq. m of office space was constructed, which is a record value for the Polish market so far. The most office space was built in Warsaw (277,000 sq. m.), Kraków (111,000 sq. m), Tricity (69,000 sq. m), Katowice and Wrocław (62,000 sq. m each). Further and more rapid growth can be expected bearing in mind the space under construction (another 1.3 million sq. m) and developers’ plans. In Warsaw alone about 700,000 sq. m of office space is to be commissioned in 2015. According to DTZ analyses, in 2015-2016 the highest growth in the supply of office space can be expected in Wrocław (a 32% increase), Łódź (27%) and Tricity (25%). In 2014, the office space market saw a strong demand as well, which translated into a reduction in the office vacancy ratio on most Polish cities except Kraków, Katowice and Warsaw. Warsaw, whose office space supply accounts for 58% of the total supply in Poland, saw the highest vacancy ratio in 2014 (13.3%) due to the growing supply and demand remaining flat. Also, many transactions involved renegotiation and extension of the existing agreements.
2.5.9. Warehouse space constructionIn 2014, the warehouse construction market grew rapidly. Over 1,000,000 sq. m of warehouse space was commissioned, i.e. three times more than in the previous year and close to the record area in 2007-2008. At the end of 2014, the total supply of modern warehouse space in Poland was 8,850,000 sq. m, with 675,000 sq. m of modern office space being under construction (25% more than as at the end of 2013). In 2014, the volume of transactions concluded was 10% higher than in 2013 of 2,400,000 sq. m. Built-to-suit transactions had a substantial share in the volume.
0% 5% 10% 15% 20%
Kraków
Lublin
Trójmiasto
Wrosław
Łódź
Katowice
Poznań
Szczecin
Warszawa
0% 5% 10% 15% 20%
Poland
Kraków
Poznań
Szczecin
Tricity
Upper Silesia
Wrocław
Warszawa
Central Poland

52
Despite a record growth in supply in 2014, the vacancy ratio dropped from 10.9% to 6.8%. According to a study by Cushman & Wakefield, bearing in mind substantial space under construction and intense activity of lessees, the vacancy ratio can be expected to remain flat or even drop. Development of commercial space in smaller towns and substantial capital expenditure on improvement of transport infrastructure in Poland may contribute to a reduced concentration of warehouse space near Warsaw and the largest urban agglomerations.
2.6. From the market perspectiveAccording to members of management boards in construction companies, the inflow of EU funds under the 2014-2020 perspective will be of decisive importance for the development of the construction sector in the years to come. In their opinion, infrastructural construction, in particular in the road and railway construction segments, along with the power engineering segment, being the largest beneficiaries of the EU funds, will grow the most rapidly.
According to representatives of construction companies, the General Directorate for National Roads and Motorways (GDNRM) learned a lesson from the EURO 2012 experience, when the accumulation of construction projects resulted in a growth in prices of construction materials, which had a negative effect on the industry. As a result, many companies went bankrupt and a few foreign contractors (like Chinese COVEC, Irish SRB and SIAC or Slovak Doprastav) terminated their contracts. Under the new financial perspective, the GDRNM has already accepted tenders for PLN 30 billion. Construction companies point out that the level of organisational preparation in PKP PLK is lower than in the GDRNM. By the end of August 2015, the company did not call for any tenders for construction projects under the new financial perspective, which gives rise to a risk of accumulation of investments in 2019-2020. In response to these concerns, PKP PLK has stated that by the end of 2015 it would call for tenders for the total amount of PLN 11 billion. In the beginning of September 2015, it commenced the programme called the Great Railway Investment Campaign, whose purpose, among others, is to improve the terms of cooperation with contractors and tender organisations. In September 2015, the company called for tenders for the completion of the improvement of the RailBaltica line and construction of ERTMS/GSM-R infrastructure.
Construction companies well remember problems with road investments that occurred before EURO 2012. A similar accumulation of projects may occur this time in the railway sector. PKP PLK plans to solve the problem by inviting foreign contractors to the tender procedure. The idea has met a negative response from management of companies that already operate in Poland. In their opinion, the market is competitive enough and margins are under substantial pressure, so additional foreign contractors will increase the trends winning with low prices and not exposing their own labour or equipment during project performance.
Construction companies have indicated the need to reduce these practices and request the introduction of a condition in the terms of reference, requiring a certain level of a company’s own resources involved in projects.
The Polish legal system, to include the public procurement law, poses other problems indicated by industry representatives. Following amendments to the Public Procurement Law, the price has remained the key selection factor for contracts. Uneven risk distribution in tender proceedings is another significant problem. The first signs of improvement may be observed in the industrial sector, where weights assigned to the price as a selection criterion often reach 70%, in favour of criteria related to technical parameters. Furthermore, the requirement regarding own labour involvement has appeared.
Representatives of construction companies estimate that following the accumulation of projects, construction material prices and employment costs incurred by subcontractors may increase. Therefore, the purchasing competencies of companies have become increasingly important for their ability to maintain the current market position, especially that opportunities to hedge against price risk are limited.

First symptoms of rationalising TOR provisions in industrial construction tenders have appeared: technical parameters are considered along with price in tender evaluation. Further, requirements regarding certain involvement of own resources have been introduced.
Joanna Makowiecka - Gaca, Chairman of the Management Board, Polimex-Mostostal S.A.
Polish construction companies 2015: Key players, growth factors and industry development prospects 53
Most construction companies point out the labour shortage problem. Industry representatives consider labour-related emigration of some construction workers as the main reason of the shortage. The emigration has increased in recent years, alongside a deterioration in the condition of the construction industry. In their opinion, a lack of specialised design companies (e.g. in the power engineering segment) may be a bottleneck, too. Construction companies see changes in the labour market and, interested in hiring young employees, offer them opportunities for personal development and improving their professional skills.
Some firms plan to or have commenced measures aimed at limiting the risk of concentration of their business operations in a single segment and the possible end of EU funding. They attempt to diversify their operations both in terms of specialisation (entering new market segments) and geography (carrying out foreign projects, e.g. in the Czech Republic, Slovakia, Romania, Hungary, Scandinavian and Western European countries). One of the potential sources of funds after 2020 will be performing small and medium scale projects for local governments and private investors. The largest portion of EU funds shall be assigned to large projects of national importance, and this is where construction companies will be most impacted in terms of a drop in the number of projects performed after 2020. Construction companies predict that once the 2014-2020 financial perspective is closed, PPP based projects will grow in importance as a result of a significant reduction in EU funding and the need for local governments to look for alternative sources of financing.

54
2.7. SummaryIn 2014, the decreasing trend in production in the construction sector turned around. The market value increase was small and amounted to 0.4%, but other accompanying symptoms of recovery, to include a growth in sales of construction companies as reported by the Main Statistical Office, an increase in demand and supply in individual market segments and an
inflow of EU funds under the 2014-2020 perspective indicate opportunities to improve the standing of the construction market in the coming years. In order to fully use the new opportunities, though, both public and private partners must draw conclusions from projects performed under the previous EU perspective.
Table: Summary figures regarding selected planned investment classes in each construction market segment
YearsPlanned investment amount
Source of funding
Comments
Road construction
Expressways and motorways
2014-2025 PLN 97.5 bnNational Road Construction Programme for 2014-2023 (with projections until 2025)
Expenditure for improvement of provincial and municipal roads is not included.
Ring roads 2014-2025 PLN 9.6 bn
Maintaining technical standards of the existing road network
2014-2025 PLN 46.8 bn
Road repair works
2015 PLN 6.6. bn GDNRM
The amount includes financial needs related to the liquidation of unsatisfactory and poor condition roads. The amount GDRNM actually plans to spend for this purpose is unknown.
Municipal and county roads
2016-2020 PLN 5.2 bn
Programme for development of municipal and county road infrastructure for the years 2016-2020
Railway construction
Railways 2014-2023 PLN 67.5 bnKrajowy Program Kolejowy do 2023 r.
Trams and suburban trains
2015-2020 PLN 1.5 bn
Long-term financial plans of the six largest Polish cities
Amounts planned in city budgets do not include all capital expenditures related to tramlines in these cities (some shall be funded by urban tram companies).

Source: Deloitte analysis
Polish construction companies 2015: Key players, growth factors and industry development prospects 55
YearsPlanned investment amount
Source of funding
Comments
Power engineering construction
Transmission and distribution network
2014-2019 PLN 42 bnEnergy Regulatory Office
Generation resources
2014-2028 PLN 55 bnEnergy Regulatory Office
Construction of power units of 18 GW capacity is planned. The amount does not include the cost of the nuclear power plant.
Environmental protection
Sewage systems2014-2015
Po 2015
PLN 3.8 bn
PLN 14.3 bn
4th update of National Municipal Wastewater Treatment Programme
Wastewater treatment
2014-2015
Po 2015
PLN 7.5 bn
PLN 2.7 bn
4th update of National Municipal Wastewater Treatment Programme
Municipal Solid Waste Thermal Treatment Plants (MSTTP)
2014-2016 PLN 3.3 bnspalarnie-odpadow.pl, igniss.pl, WPGO
Six investments under the MSTTP, at present in different completion stages.
Building construction
No projected expenditure for a longer perspective.
Projections for residential and commercial construction projects are good for the nearest future.
A strong growth in demand observed since 2014 is the factor underlying the good perspective for the residential segment. The current macro-economic standing accompanied with available government funding allows expecting stable standing of this segment in the nearest future.
In 2014, rapid growth of the commercial construction segment occurred, confirming the record volume of office space supplied. Based on the analysed investment portfolios of construction companies the positive trend may be expected to continue in the subsequent quarters.


Chapter 3Profiles of the largest construction companies in Poland
Polish construction companies 2015: Key players, growth factors and industry development prospects 57

Skanska has been operating in Poland since 1970’s, when it constructed first Western-standard hotels: Novotel Warszawa Centrum (former Forum Hotel) and Sofitel Victoria Warszawa (former Victoria Hotel) in Warsaw and a dry dock for Gdynia Shipyard.
In 2000, Skanska acquired the Exbud Group and has been continuously present on the Polish construction market.
The Skanska Group operates in Europe and the North America acting as a general contractor and developer in housing and office projects. It performs PPP projects as well.
Skanska S.A. specialises in general construction and construction engineering.
General constructionThe Skanska Group acts as a general contractor delivering commercial and entertainment centres, health care and educational facilities, offices, hotels, residential buildings, sports and industrial facilities with the accompanying infrastructure.
Construction engineeringSkanska S.A. carries out road and bridge construction projects, hydrotechnical, environment protection and railway engagements.
Its engineering construction units deal also with rental of site equipment and production of aggregate and asphalt mixes.
Financial data of Skanska S.A. were presented in previous issues of the report. For the purpose of this edition, we have been provided with selected consolidated financial data regarding the Skanska Group companies operating in Poland for 2014.
In 2014, revenue of the Skanska Group amounted to PLN 5.1 billion, with operating profit of PLN 397 million. In 2014 the average employment in Poland amounted to 7,266 people.
SKANSKA GROUP
58

Budimex S.A. has been transformed from Centrala Handlu Zagranicznego Budownictwa Budimex incorporated in 1968 in order to export construction services, mostly to developing markets in Asia and Africa and to the Socialist block countries.
In late 1980’s and early 1990’s, Budimex became a leading contractor on the Polish market.
In 1992 the enterprise was privatised and two years later transformed into a joint-stock company.
Since 1995 it has been listed on Warsaw Stock Exchange. As at 31 December 2014 its major shareholders included Valivala Holdings B.V. (the Netherlands) holding 59.06% of shares (the company belongs to the Spanish Ferrovial S.A. Capital Group) and Aviva OFE Aviva BZ WBK holding 7.13% of shares.The Budimex Group performs broadly defined construction and assembly services acting as a general contractor on the domestic and foreign market, a developer and real property manager, as well as, to a small extent, performing commercial, production, transport and other activities. Budimex S.A. carries out construction operations, and acts as an advisory, management and financial centre in the capital group.
Compared to 2013, revenue of the Budimex Group generated in 2014 increased by 4%. Poland and Germany are the key markets of the Group. Foreign revenue decreased significantly (by approx. 65%) year-on-year and accounted for 4% of the total revenue for 2014. Over 92% of revenue generated in 2014 came from construction and assembly services. Sales in this segment increased by 14% vs. 2013 and exceeded PLN 4.6 billion.
In 2014, revenue from sales of developer and real property management services neared PLN 250 million and increased by approx. 11% year-on-year. Pre-sale of flats reached the level of 1,685, i.e. 127% higher than in the previous year. EBIT generated by the Budimex Group amounted to PLN 247 million and was 26% lower than in 2013. The net profit was reduced by 36%. The better performance in 2013 resulted from one-off events, such as sales of shares in Budimex Danwood Sp. z o.o. that generated profit before tax of PLN 194 million.
At the end of 2014, the general debt level increased by less than 9%. Capital expenditure of the Group increased nearly three times vs. 2013 and amounted to PLN 48.4 million.
In 2014, the Budimex Group companies concluded construction contracts totalling to PLN 6.3 billion, the amount being 93% higher than in 2013. As at 31 December 2014, the portfolio of construction orders held by the Group amounted to PLN 6.1 billion, signifying a 41% increase year-on-year. The quoted value of the company’s shares increased from PLN 3.4 billion at the end of 2013 to PLN 3.6 billion at the end of 2014.
BUDIMEX GROUP
Polish construction companies 2015: Key players, growth factors and industry development prospects 59

Keydata (PLN’000) 2014 2013 2012Change in percent
2014 vs 2013
Assets
Non-current assets 677 496 622 230 559 807 8.9%
Current assets 3 178 532 3 064 523 2 888 404 3.7%
Non-current assets held for sale 2 181 0 0 n.d.
Total assets 3 858 209 3 686 753 3 448 211 4.7%
Equity and liabilities
Equity 522 509 645 175 433 130 -19.0%
Provisions for liabilities 290 767 267 802 257 581 8.6%
Long-term liabilities 233 460 200 309 240 857 16.5%
Short-term liabilities and accruals 2 811 473 2 573 467 2 516 643 9.2%
Total equity and liabilities 3 858 209 3 686 753 3 448 211 4.7%
Profit and loss account
Revenue 4 949 939 4 749 459 6 077 660 4.2%
Domestic sales 4 754 307 4 198 885 5 591 887 13.2%
Export sales 195 632 550 574 485 773 -64.5%
Construction activity 4 566 628 4 005 617 5 441 153 14.0%
Other activities 383 311 743 842 636 507 -48.5%
EBITDA 270 349 362 199 233 092 -25.4%
EBIT 247 318 333 306 182 409 -25.8%
Net profit 193 938 301 300 185 982 -35.6%
Other data
Net debt* 1 504 048 1 382 795 1 697 348 8.8%
Debt/Balance sheet total 86.5% 82.5% 87.4% 4.0%
Capital expenditure/ Revenue 1.0% 0.4% 0.5% 0.6%
Market capitalisation 3 612 509 3 369 973 1 787 107 7.2%
* Net debt is calculated as the difference between total provisions and liabilities and cash.
60
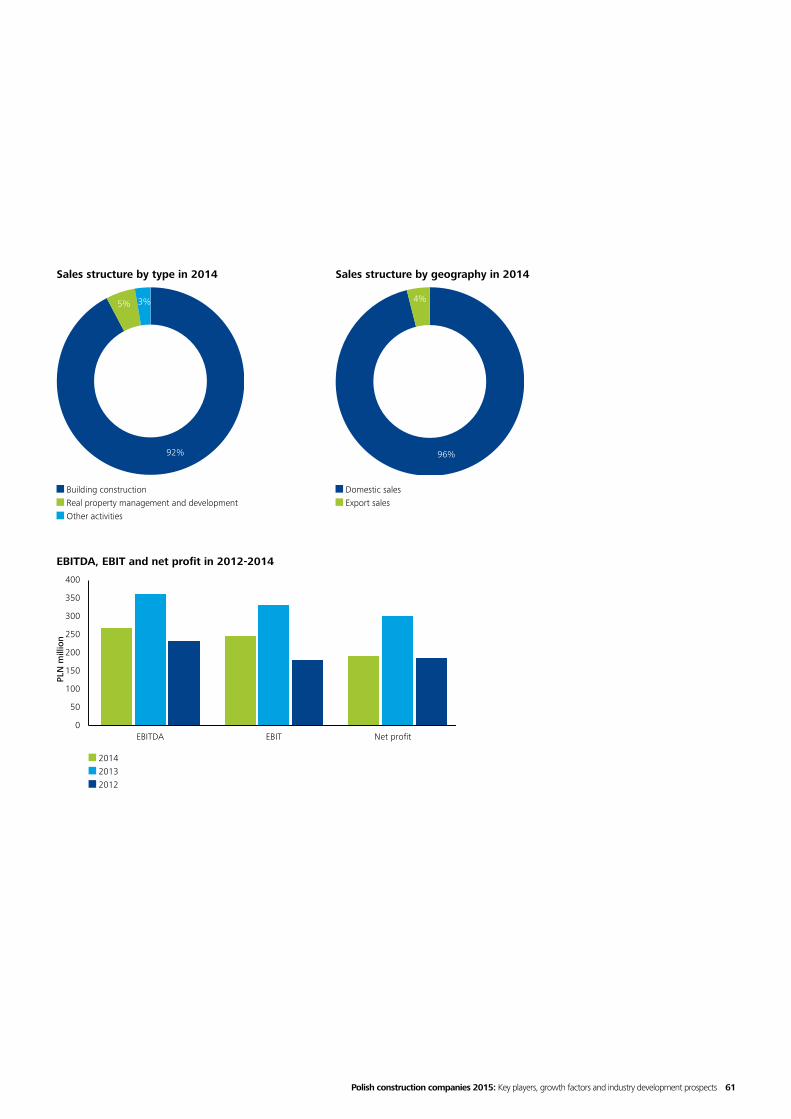
Sales structure by geography in 2014Sales structure by type in 2014
Domestic sales Export sales
Building construction Real property management and development Other activities
2014 2013 2012
PLN
mill
ion
EBITDA, EBIT and net profit in 2012-2014
96%
4%
92%
5% 3%
0
50
100
150
200
250
300
350
400
EBITDA EBIT Net profit
Polish construction companies 2015: Key players, growth factors and industry development prospects 61

Strabag was established in 1835 and has operated in Poland since 1985. This is its third most important market in Europe. In 2014, its revenue generated in Poland amounted to PLN 3.1 billion and was 5% lower than in 2013.
The core business of its Polish companies includes general construction, construction engineering and infrastructure construction. STRABAG is also present in the railway construction, hydrotechnical and power engineering sector. Its key Polish companies include STRABAG to STRABAG Sp. z o.o. and Strabag Infrastruktura Południe Sp. z o.o.
Financial statements of the Polish companies in the STRABAG Group are not consolidated on the local level.
STRABAG SP. Z O.O.Operations of STRABAG Sp. z o.o. include infrastructural and general construction, as well as construction engineering. Further, it specialises in environmental projects, railway construction, improvement and construction of wharves, industrial and power engineering construction, to include renewable energy sources. In 2014, domestic sales generated the entire revenue of the company.
It amounted to PLN 2.6 billion and was 9% lower than in 2013.
The generated EBIT was positive, though, and amounted to PLN 134 million, with the net profit of PLN 132 million.
This is yet another year of debt ratio decrease, which still exceeds 70%. The net debt of PLN 347 million at the end of 2014 resulted mostly from trade liabilities and contract valuation. STRABAG Group companies do not use debt to finance their operations, referring to a cash pool system instead.
In 2014 the average employment in the company was 2,579 people.
STRABAG GROUP
62

Key data (PLN’000) 2014 2013* 2012Change in percent
2014 vs 2013
Assets
Non-current assets 515 889 558 305 638 237 -7.6%
Current assets 1 986 193 1 673 328 1 880 726 18.7%
Total assets 2 502 082 2 231 633 2 518 963 12.1%
Equity and liabilities
Equity 747 660 618 256 567 950 20.9%
Provisions for liabilities 509 815 315 664 462 663 61.5%
Long-term liabilities 0 0 0 n.d.
Short-term liabilities and accruals 1 244 607 1 297 713 1 488 350 -4.1%
Total equity and liabilities 2 502 082 2 231 633 2 518 963 12.1%
Profit and loss account
Revenue 2 611 279 2 854 633 3 932 263 -8.5%
Domestic sales 2 607 538 2 851 224 3 926 461 -8.5%
Export sales 3 741 3 409 5 802 9.7%
Construction activity no data
Other activities no data
EBITDA 211 730 130 125 -659 62.7%
EBIT 134 085 38 111 -114 535 251.8%
Net profit 131 610 57 490 -108 694 128.9%
Other data
Net debt 346 877 494 567 1 503 918 -29.9%
Debt/Balance sheet total 70.1% 72.3% 77.5% -2.2%
Capital expenditure/ Revenue 0.8% 1.6% 0.7% -0.8%
* The financial data of Strabag for 2013 was reconciled to the financial statements for 2014 following adjustments of the opening balance.
Polish construction companies 2015: Key players, growth factors and industry development prospects 63

EBITDA, EBIT and net profit in 2012-2014
2014 2013 2012
PLN
mill
ion
Sales structure by geography in 2014
Domestic sales
100%
-150
-100
-50
0
50
100
150
200
250
EBITDA EBIT Net profit
64

The company has been active in the Polish market for 20 years and its business is mainly concentrated on design and building construction works in the sector of roads and bridges as well as airfield pavements. Until the end of 2014, it operated under the business name of Heilit+ Woerner Sp. z o.o. and then changed its name to STRABAG under the brand unification strategy. The company specializes in concrete pavements. The majority of its revenue is generated in Poland, with only 1% obtained in foreign markets (primarily Norway and Russia). The business of Strabag Infrastruktura Południe is also characterized by low level of diversification. The company observed a growth in revenue by 18%, from PLN 444.1 million in 2013 to PLN 522.2 million in 2014. EBIT and net profit amounted to PLN 18 million (vs. PLN 18.1million in 2013) and PLN 16.7 million (vs. 16.9 million in 2013), respectively. The company is mainly financed by cash pooling-based loans from related parties.
In 2014 it employed 530 people on average.
STRABAG INFRASTRUKTURA POŁUDNIE SP. Z O.O.
Polish construction companies 2015: Key players, growth factors and industry development prospects 65
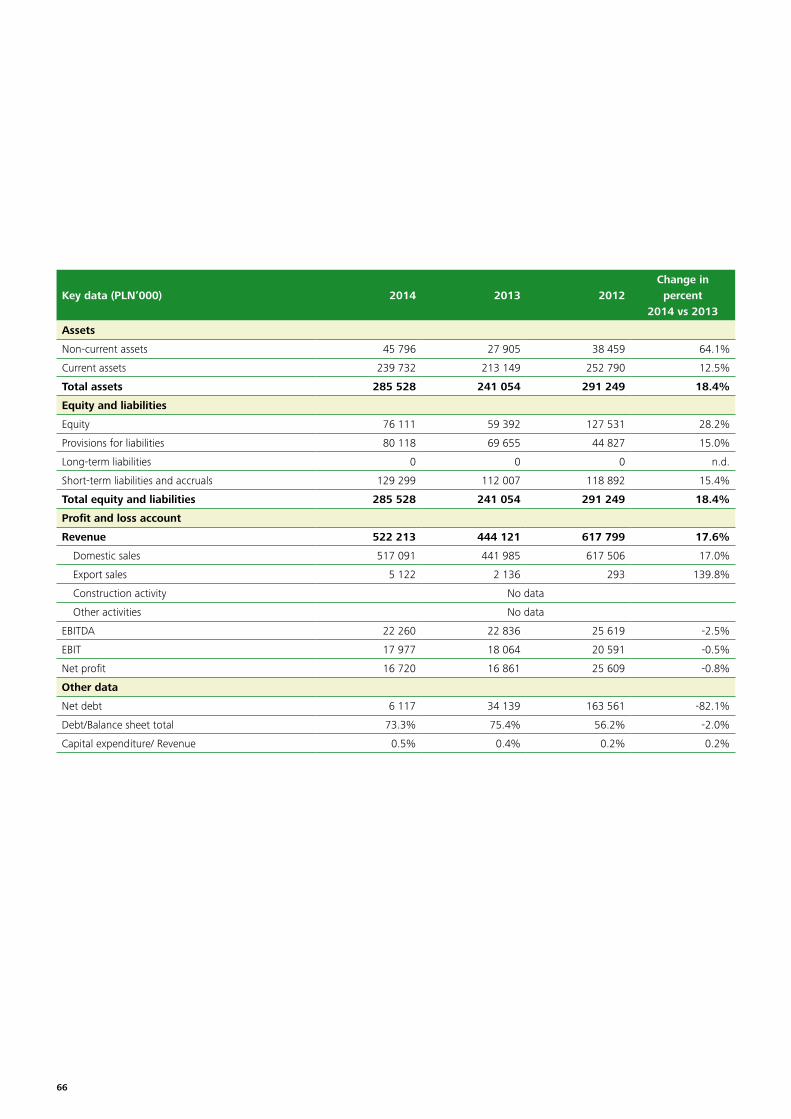
Key data (PLN’000) 2014 2013 2012Change in percent
2014 vs 2013
Assets
Non-current assets 45 796 27 905 38 459 64.1%
Current assets 239 732 213 149 252 790 12.5%
Total assets 285 528 241 054 291 249 18.4%
Equity and liabilities
Equity 76 111 59 392 127 531 28.2%
Provisions for liabilities 80 118 69 655 44 827 15.0%
Long-term liabilities 0 0 0 n.d.
Short-term liabilities and accruals 129 299 112 007 118 892 15.4%
Total equity and liabilities 285 528 241 054 291 249 18.4%
Profit and loss account
Revenue 522 213 444 121 617 799 17.6%
Domestic sales 517 091 441 985 617 506 17.0%
Export sales 5 122 2 136 293 139.8%
Construction activity No data
Other activities No data
EBITDA 22 260 22 836 25 619 -2.5%
EBIT 17 977 18 064 20 591 -0.5%
Net profit 16 720 16 861 25 609 -0.8%
Other data
Net debt 6 117 34 139 163 561 -82.1%
Debt/Balance sheet total 73.3% 75.4% 56.2% -2.0%
Capital expenditure/ Revenue 0.5% 0.4% 0.2% 0.2%
66

Sales structure by geography in 2014
Domestic sales Export sales
EBITDA, EBIT and net profit in 2012-2014
2014 2013 2012
PLN
mill
ion
99%
1%
0
5
10
15
20
25
30
EBITDA EBIT Net profit
Polish construction companies 2015: Key players, growth factors and industry development prospects 67

Polimex-Mostostal is one of the largest Polish capital groups with construction and engineering profile, of strategic importance for the national economy. Polimex-Mostostal S.A. is the parent company in the group and its history dates back to the early post-war era. The company in its current form was established as a result of the merger between Polimex-Cekop S.A. and Mostostal Siedlce which took place in 2004. Polimex-Mostostal S.A. has been listed on Warsaw Stock Exchange since 1997.
The group operates in the power engineering, oil and gas and industrial construction sectors. Polimex-Mostostal is a manufacturer of steel products, to include catwalk grids, and a provider of hot-dip galvanising services. Polimex-Mostostal S.A. is the contractor building power units in Kozienice and Opole power plants.
Apart from the parent company, the following entities made up the Polimex – Mostostal Group in the year 2014: Naftoremont-Naftobudowa Sp. z o.o. Polimex Energetyka Sp. z o.o. (the two operating companies in the group), Polimex Projekt Opole Sp. z o.o., PRInż – 1 Sp. z o.o., Stalfa Sp. z o.o., Polimex-Mostostal Ukraina SAZ, Polimex Projekt Kozienice Sp. z o.o. On 1 July 2014, all shares in Torpol S.A. were sold under IPO.
In 2014 the group employed almost 5,500 employees, but in consequence of the restructuring plan implemented in the company the number is going down.
In 2014, Polimex – Mostostal S.A. restructured its portfolio of non-performing contracts, decided to withdraw from road construction ones and to focus on the power engineering and oil and gas sectors.
In 2014, another stage of the operational and financial restructuring was completed.
Under the restructuring programme, the debt was converted to shares, which resulted in recognition of financial revenue of PLN 272 million. The costs of the restructuring (including employment reduction) were incurred in 2014, which significantly affected the performance of the parent.
In 2014, 82% of the group’s revenue was derived from domestic sales and 18% from export sales - mainly to the European Union member states and Ukraine.
In 2014 the group generated PLN 2.1 billion of revenue from its core business with an 11% decline in sales as compared to the previous year. Both EBIT and the net result for 2014 were negative. EBIT remained at the level of PLN 396 million (decline by 130% as compared with 2013), and the net loss amounted to PLN 153 million (improvement by 41% as compared with 2013). The above shows that the loss of the group was lower than during the previous year. The key factor contributing to the improved performance was a reduction in general and administrative expenses (from approx. PLN 121 million to approx. PLN 90 million).
As compared with 2013 the net debt of Polimex-Mostostal dropped by PLN 694 million, and the debt ratio decreased by 4.5 p.p. vs. the previous year and as at 31 December 2014 it amounted to 84%.
As at 31 December 2014 the orders’ portfolio of the group was valued at PLN 5.9 billion (without consortium shares). Please note two large contracts held in the parent’s portfolio, which will certainly contribute to the improved performance of the company. Both involve the construction of new power units in Opole and Kozienice power plant.
In September 2015, the Polimex-Mostostal Group presented a new strategy for the years 2016-2020, with the following key business areas:
• power engineering,
• oil – gas – chemicals,
• industrial construction,
• manufacturing.
POLIMEX-MOSTOSTAL GROUP
68

Key data (PLN’000) 2014 2013* 2012*Change in percent
2014 vs 2013
Aktywa
Non-current assets 908 997 1 347 640 1 543 624 -32.5%
Current assets 1 331 986 1 698 060 1 843 772 -21.6%
Assets held for sale 450 614 97 476 463 007 362.3%
Total assets 2 691 597 3 143 176 3 850 403 -14.4%
Equity and liabilities
Equity 431 558 363 202 481 402 18.8%
Provisions for liabilities 328 455 177 401 328 425 85.1%
Long-term liabilities 606 814 266 342 1 047 860 127.8%
Short-term liabilities and accruals 1 058 434 2 336 231 1 774 032 -54.7%
Liabilities directly related to assets held for sale 266 336 0 218 684 n.d.
Total liabilities and equity 2 691 597 3 143 176 3 850 403 -14.4%
Profit and loss account
Revenue 2 102 197 2 362 752 4 110 417 -11.0%
Domestic sales 1 718 219 1 774 271 2 805 532 -3.2%
Export sales 383 978 588 481 1 304 885 -34.8%
Construction activity 1 674 750 1 755 420 3 179 305 -4.6%
Other activities 427 447 607 332 931 112 -29.6%
EBITDA -343 685 -105 093 -1 085 757 -227.0%
EBIT -395 752 -173 607 -1 185 103 -128.0%
Net profit -153 226 -260 889 -1 244 044 41.3%
Other data
Net debt 1 583 006 2 276 702 3 108 081 -30.5%
Debt/Balance sheet total 84.0% 88.4% 87.5% -4.5%
Capital expenditure/ Revenue 1.3% 1.2% 2.2% 0.0%
Market capitalisation 303 166 190 758 323 116 58.9%
*The financial data for 2013 and 2012 was reconciled to the financial statements for 2014 following adjustments of the opening balance.
Polish construction companies 2015: Key players, growth factors and industry development prospects 69

Sales structure by geography in 2014Sales structure by type in 2014
Domestic sales Export sales
Production Industry Power engineering Infrastructural construction Petrochemistry Other activities
EBITDA, EBIT and net profit in 2012-2014
2014 2013 2012
PLN
mill
ion
18%
6%
46%
22%
6%2%
82%
18%
-1400
-1200
-1000
-800
-600
-400
-200
0
EBITDA EBIT Net profit
70

Erbud is one of the leading construction companies in Poland, with over 25 years of industrial experience. The company was established by Eryk Grzeszczak and his son Dariusz Grzeszczak in 1990 under the name: Przedsiębiorstwo Budowlane i Usług Technicznych „ERBUD”.
In 1993 its German subsidiary - GWI Bauunternehmung GmbH - was founded to pursue the company’s business operations abroad. In 1999 Józef Adam Zubelewicz joined the company’s shareholders – his responsibility as a management board member was to develop the company’s business in Poland.
Erbud was transformed into a limited liability company in 2003 and at the same time a strategic investor – a German Wolff & Müller GmbH & Co. KG - made a capital injection to provide additional funding. Beginning from the year 2004 the company has been developing independent regional branches in Poland and its Western European expansion began in 2005, also to Belgium, France, Sweden Ireland and England.In 2006 the company transformed into a joint-stock company, and in 2007 its IPO at Warsaw Stock Exchange took place. As part of implementation of its development strategy, in 2007 Erbud took over Budlex S.A. – the leading property developing company in Kujawsko-Pomorskie region. At the end of 2007 Erbud also took over Rembet Plus Sp. z o.o. - a company engaged in engineering and road-related projects. Przedsiębiorstwo Robót Drogowych SA (PRD SA) operating in the road sector joined the group in 2008, whereas in 2010 the road companies operating within the group (PRD SA - Przedsiębiorstwo Robót Drogowych SA and Rembet Plus Sp.z o.o.) consolidated, as a result of which Przedsiębiorstwo Budownictwa Drogowo-Inżynieryjnego SA was established. In 2012 the group bought shares in Engorem – a company operating in the sphere of comprehensive investment, refurbishment and diagnostic services for the energy sector. As part of developing business operations to include modernisation, refurbishing and maintenance of industrial and energy-related installations, a new entity incorporating Engorem (i.e. Erbud Industry) was established in 2014.
As at 31 December 2014 Wolff & Müller GmbH & Co. KG holding 32.54% shares in the share capital was the main shareholder of the company and DGI Fundusz Inwestycyjny Zamknięty Aktywów Niepublicznych controlled by Dariusz Grzeszczak (shareholding of 16.74%) was the second largest shareholder. Two open pension funds (ING and AVIVA) hold 19.2% of shares.
The Erbud Group provides general contracting and subcontracting services in the commercial, residential, public utilities and energy sectors, as well as services in the area of road and engineering in Poland and other European countries, primarily: Germany, Belgium, Luxembourg and the Netherlands. The group is also active in the sphere of property developing.
The group’s priorities include further development of general construction services (office and commercial centres, public utility buildings) and in the power engineering segment in Poland and abroad.
In 2014 the Erbud Group earned revenues of PLN 1.7 billion accompanied with an increase in sales by 38% as compared with the previous year. The growth resulted from an increase in revenue generated in the general construction, engineering and road construction, as well as power engineering segment (by 40.0%, 66.5% and 11.6%, respectively). 88% of the sales revenue was generated in Poland, whereas 12% was derived from the business conducted in Western Europe.
Building construction activities, which accounted for 83% of consolidated sales in 2014, constituted the main source of the group’s revenue.
During this period the group managed to improve its profitability and obtained consolidated EBIT of PLN 43.1 million which represented a 32% growth year-on-year. EBITDA amounted to PLN 52 million (a growth by PLN 11.6 million year-on-year) and the net profit equalled PLN 27.9 million and was 54% higher than in the previous year.
In 2014 the net debt of the group went up by over 37% and arrived at the value of PLN 554.7 million. At the end of 2014, the share of equity in the total financing of the Group’s operations was 27.3%.The Erbud Group employs 1,830 people.
ERBUD GROUP
Polish construction companies 2015: Key players, growth factors and industry development prospects 71

Key data (PLN’000) 2014 2013 2012Change in percent
2014 vs 2013
Assets
Non-current assets 162 161 117 755 123 826 37.7%
Current assets 889 284 678 175 695 867 31.1%
Total assets 1 051 445 795 930 819 693 32.1%
Equity and liabilities
Equity 287 531 266 966 251 443 7.7%
Provisions for liabilities 72 944 63 556 60 973 14.8%
Long-term liabilities 94 425 19 913 65 327 374.2%
Short-term liabilities and accruals 596 545 445 495 441 950 33.9%
Total equity and liabilities 1 051 445 795 930 819 693 32.1%
Profit and loss account
Revenue 1 692 055 1 223 609 1 384 454 38.3%
Domestic sales 1 496 682 1 013 873 1 234 457 47.6%
Export sales 195 373 209 736 149 997 -6.8%
Construction activity 1 646 607 1 173 979 1 320 167 40.3%
Other activities 45 448 49 630 64 287 -8.4%
EBITDA 52 003 40 427 36 942 28.6%
EBIT 43 128 32 700 29 413 31.9%
Net profit 27 892 18 079 18 527 54.3%
Other data
Net debt 554 651 404 374 366 481 37.2%
Debt/Balance sheet total 72.7% 66.5% 69.3% 6.2%
Capital expenditure/ Revenue 1.0% 1.0% 1.0% 0.0%
Market capitalisation 324 153 432 167 176 857 -25.0%
72
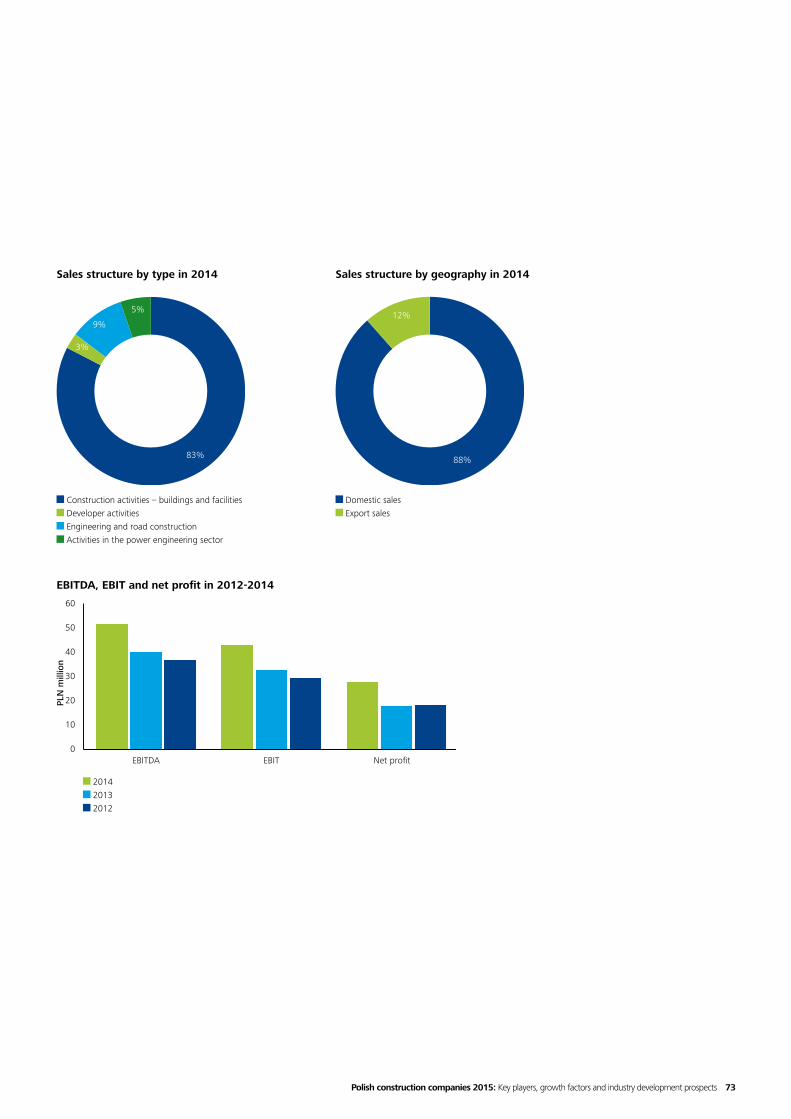
EBITDA, EBIT and net profit in 2012-2014
2014 2013 2012
PLN
mill
ion
Sales structure by geography in 2014Sales structure by type in 2014
Domestic sales Export sales
Construction activities – buildings and facilities Developer activities Engineering and road construction Activities in the power engineering sector
83%
3%
9%
5%
88%
12%
0
10
20
30
40
50
60
EBITDA EBIT Net profit
Polish construction companies 2015: Key players, growth factors and industry development prospects 73

Trakcja PRKiI S.A. is one of the largest companies in the sector of infrastructural construction and railway improvement in Poland. The company has been operating under this name since the end of 2013, but in the organizational terms it continues the tradition and relies on the experience gained by other entities active in the market for more than 60 years (PKRE S.A., PRKiI S.A., PRK 7 S.A.).
The group performs many crucial contracts related to improvement of road and railway infrastructure in Poland and abroad. It has also been engaged in construction and improvement of tramlines, roads, bridges and power engineering infrastructure. The business activity of its subsidiaries includes preparation of feasibility studies and project documentation, specialized services of railway infrastructure maintenance, general and industrial construction and residential developments.
Its current status has been arrived at in stages , the first one being the restructuring of a state-owned enterprise (in 1995). The next stage took place in 2004 and it involved assuming control of the holding company - Trakcja Polska S.A. by Przedsiębiorstwo Kolejowych Robót Elektryfikacyjnych S.A. The company was privatised in 2005 through the sale of a minority shareholding to Spanish Comsa S.A.
After its IPO on Warsaw Stock Exchange at the beginning of April 2008, in 2009 the company merged with PRK 7 S.A. and in 2011 Tiltra Group was acquired. In 2012 the company’s name was changed to Trakcja S.A.
In 2013, the company continued organizational and legal restructuring of the capital group. The most important step was to merge Trakcja S.A. and PRKiI S.A. – in effect, Trakcja PRKiI S.A. was established. With the shareholding and voting rights at the level of 28.8%, Comsa S.A. remains the company’s major shareholder.
At present the business operations of the Trakcja Group are focused specifically on comprehensive design of roads, railways, buildings and facilities, construction and improvement of railways, contact lines, underground and overhead lines, power supply systems, roads, highways, utility infrastructure and engineering structures.
In 2014 as much as 35% of sales were generated outside Poland – mainly thanks to large contracts carried out for the Lithuanian Railways. As far as the Polish market goes, PKP PLK S.A. is the main recipient of the services performed by the group.
In 2014 the Trakcja Group employed 2,002 persons and generated revenue of PLN 1.6 billion, which translates into a nearly 26% growth as compared with the previous year. The railway segment was the key growth engine, with revenue growth from PLN 665 million in 2013 to PLN 1.2 billion in 2014 (i.e. by 82%). The EBIT of the group for 2014 amounted to PLN 85.8 million as compared with PLN 40.6 million in 2013, which signifies a growth of 112%.
In 2014 EBITDA equalled PLN 147 million and increased by 132.2% as compared with 2013. The net result for 2014 amounted to PLN 50.4 million. In 2014, the share of debt capital in the total financing of the capital group’s operations was at least 53%.
TRAKCJA GROUP
74

Key data (PLN’000) 2014 2013* 2012**Change in percent
2014 vs 2013
Assets
Non-current assets 719 867 721 913 699 000 -0.3%
Current assets 725 949 776 004 628 202 -6.5%
Total assets 1 445 816 1 497 917 1 327 202 -3.5%
Equity and liabilities
Equity 674 503 623 372 493 643 8.2%
Provisions for liabilities 53 939 51 204 43 977 5.3%
Long-term liabilities 119 294 80 337 120 376 48.5%
Short-term liabilities and accruals 598 080 743 004 669 206 -19.5%
Total equity and liabilities 1 445 816 1 497 917 1 327 202 -3.5%
Profit and loss account
Revenue 1 601 674 1 274 222 1 346 676 25.7%
Domestic sales 1 035 790 811 295 853 698 27.7%
Export sales 565 884 462 926 492 978 22.2%
Construction activity 1 474 086 1 144 184 1 219 078 28.8%
Other activities 127 588 130 038 127 598 -1.9%
EBITDA 146 949 63 277 55 445 132.2%
EBIT 85 844 40 591 28 268 111.5%
Net profit 50 391 29 995 -12 517 68.0%
Other data
Net debt 709 467 790 946 712 366 -10.3%
Debt/Balance sheet total 53.3% 58.4% 62.8% -5.0%
Capital expenditure/ Revenue 1.6% 1.4% 2.0% 0.2%
Market capitalisation 390 637 530 443 136 942 -26.4%
* The financial data for 2013 was reconciled to the financial statements for 2014 following adjustments of the opening balance.** In the financial statements for 2014 restated balance sheet data as at 1 January 2013 has been presented. Due to lack of restated data regarding financial profit/loss, the data presented for 2012 was reconciled to the financial statements for 2013.
Polish construction companies 2015: Key players, growth factors and industry development prospects 75

Sales structure by geography in 2014Sales structure by type in 2014
Domestic sales Export sales
Railway construction works Road construction works Bridge construction works Production Other activities
EBITDA, EBIT and net profit in 2012-2014
2014 2013 2012
PLN
mill
ion
76%
13%
3%3%
5%
65%
35%
-40
-20
0
20
40
60
80
100
120
140
160
EBITDA EBIT Net profit
76

PBG Group began its operations in 1994 as a family-owned partnership under the name of Piecobiogaz s.c. Jerzy Wiśniewski, Małgorzata Wiśniewska. During the first years of its business operations the entity was primarily focused on construction, upgrade and maintenance of pressure reduction and metering stations, as well as construction of steel and polyethylene pipelines for transmission and distribution of natural gas. In 1997 Technologie Gazowe Piecobiogaz Sp. z o.o. was established and it took over the key part of the partnership’s business involving construction of gas facilities. As a consequence of its continuous growth and innovative projects the company changed its legal form and business name to a joint-stock company - PBG S.A.
IPO in mid-2004 was another step in the transformation. The company’s IPO helped raise the funds necessary to finance its further growth and incorporation of the PBG Group. Since June 2012 PBG S.A. has been in the state of arrangement bankruptcy. The voting regarding the arrangement with creditors took place in August 2015. At the end of 2014 Jerzy Wiśniewski holding 27.15% of share capital (i.e. 42.23% share in voting rights) was still the most important shareholder of PBG S.A. in arrangement bankruptcy. PBG S.A. in arrangement bankruptcy is the parent of the capital group and its business is focused on general EPCM contracting regarding natural gas and oil installations, water and fuels as well as comprehensive performance of power engineering and residential investment projects.
The business of PBG Group is primarily conducted in the domestic market and the group considers that market to be crucial because of investments in the power engineering sector, planned investments in the natural gas and oil segment as well as hydrotechnical investments related to flood prevention systems.
At the end of 2014 the PBG Group saw a year-on-year increase in its sales revenue by 25%. The group’s revenue increased from PLN 1.2 billion in 2013 to PLN 1.5 billion in 2014, while its performance deteriorated. EBIT and net profit were negative and amounted to PLN 46.3 million and PLN 80.8 million, respectively.
At the end of 2014 the value of the PBG Group order portfolio approximated PLN 6.3 billion, with orders amounting to PLN 1.77 billion to be performed in 2015, and the remaining amount in subsequent years. Contracts for the power engineering sector constitute 93% of the group’s order portfolio, including a contract for construction of power units in Jaworzno III Power Plant. Oil, natural gas and fuel segment has the second largest share in the order portfolio (nearly 7%).
PBG GROUP
Polish construction companies 2015: Key players, growth factors and industry development prospects 77
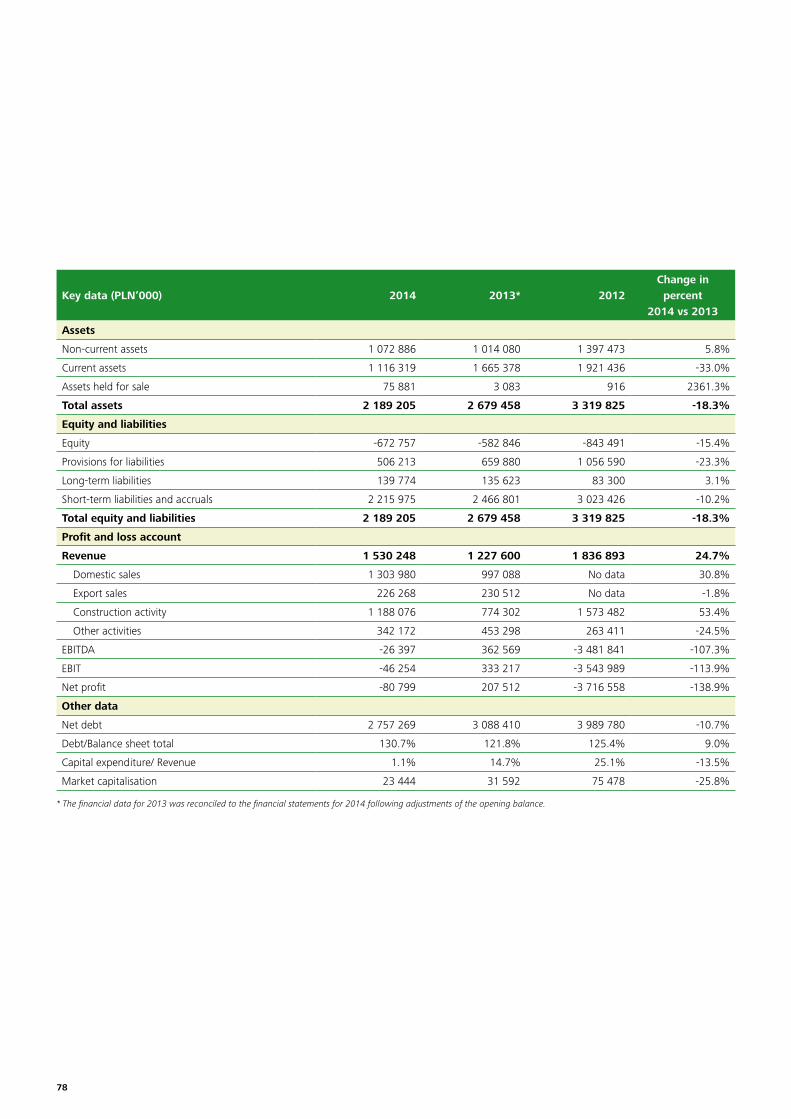
Key data (PLN’000) 2014 2013* 2012Change in percent
2014 vs 2013
Assets
Non-current assets 1 072 886 1 014 080 1 397 473 5.8%
Current assets 1 116 319 1 665 378 1 921 436 -33.0%
Assets held for sale 75 881 3 083 916 2361.3%
Total assets 2 189 205 2 679 458 3 319 825 -18.3%
Equity and liabilities
Equity -672 757 -582 846 -843 491 -15.4%
Provisions for liabilities 506 213 659 880 1 056 590 -23.3%
Long-term liabilities 139 774 135 623 83 300 3.1%
Short-term liabilities and accruals 2 215 975 2 466 801 3 023 426 -10.2%
Total equity and liabilities 2 189 205 2 679 458 3 319 825 -18.3%
Profit and loss account
Revenue 1 530 248 1 227 600 1 836 893 24.7%
Domestic sales 1 303 980 997 088 No data 30.8%
Export sales 226 268 230 512 No data -1.8%
Construction activity 1 188 076 774 302 1 573 482 53.4%
Other activities 342 172 453 298 263 411 -24.5%
EBITDA -26 397 362 569 -3 481 841 -107.3%
EBIT -46 254 333 217 -3 543 989 -113.9%
Net profit -80 799 207 512 -3 716 558 -138.9%
Other data
Net debt 2 757 269 3 088 410 3 989 780 -10.7%
Debt/Balance sheet total 130.7% 121.8% 125.4% 9.0%
Capital expenditure/ Revenue 1.1% 14.7% 25.1% -13.5%
Market capitalisation 23 444 31 592 75 478 -25.8%
* The financial data for 2013 was reconciled to the financial statements for 2014 following adjustments of the opening balance.
78
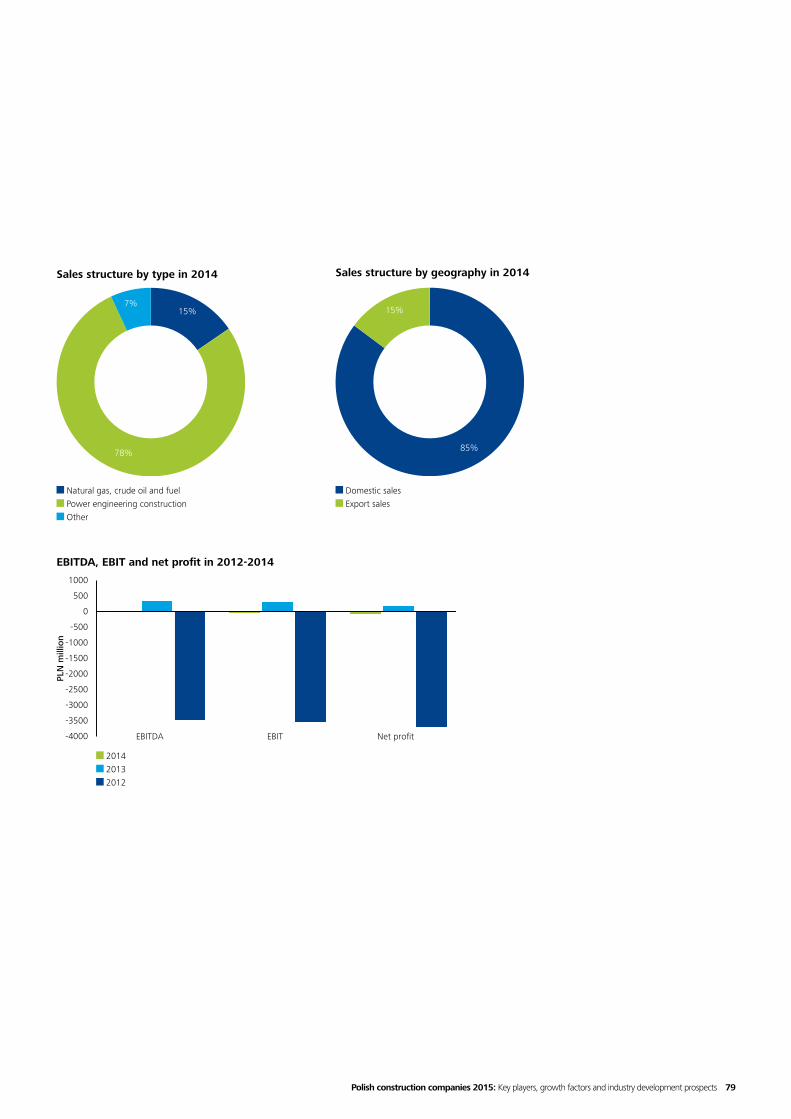
Sales structure by type in 2014
Natural gas, crude oil and fuel Power engineering construction Other
EBITDA, EBIT and net profit in 2012-2014
2014 2013 2012
PLN
mill
ion
Sales structure by geography in 2014
Domestic sales Export sales
15%
78%
7%
85%
15%
-4000
-3500
-3000
-2500
-2000
-1500
-1000
-500
0
500
1000
EBITDA EBIT Net profit
Polish construction companies 2015: Key players, growth factors and industry development prospects 79

Mostostal Warszawa was founded in 1945 and its first projects consisted in reconstructing post-war Warsaw buildings. Mostostal Warszawa launched its business activity in 1973. In 1991 the enterprise was transformed into a joint-stock company and privatized. On 14 October 1993 Mostostal Warszawa had IPO on Warsaw Stock Exchange.
The enterprise started to build its own capital group in 1994 and today the group concentrates the capital of designing and contracting companies.
In 1999 the company was acquired by the Spanish Acciona Group.
At the end of 2014 Acciona S.A. with the shareholding of 50.09% was still the majority shareholder of Mostostal Warszawa. Otwarty Fundusz Emerytalny PZU „Złota Jesień” – open pension fund (17.13%) and AVIVA PTE AVIVA BZ WBK S.A. (5.09%) also had significant shareholding.
The business operations of Mostostal Warszawa can be divided into two main segments: general construction and engineering & industrial. Key facilities commissioned during the year include Kraków Arena (Conference and Sports Centre), Applied Science Centre at University of Silesia in Katowice, Brama Mazur Commercial Centre in Ełk, a ring road in Opalenica, a bridge in w Toruń and completion of a biomass boiler assembly in Karlstad.
Mostostal Warszawa’s consolidated revenue for 2014 amounted to PLN 1.5 billion and was almost in whole derived from construction activities. The majority of contracts focused on general construction as well as engineering and industrial works. The revenue of 2014 was lower than during the previous year and 10% of the sales-related earnings were generated abroad. In 2014 the group incurred a net loss of PLN 8.7 million. EBIT generated in 2014 was positive and amounted to PLN 23.9 million, marking a significant improvement in performance vs. 2013 when it was negative and amounted to PLN 237.5 million.
During 2014 Mostostal Warszawa continued its internal restructuring by introducing a redundancy programme. In 2014 the average employment in Mostostal Warszawa decreased by over 3,000 individuals, and at the end of 2014 the headcount was 1,546. The debt to assets ratio decreased from 87% to 86%.
MOSTOSTAL WARSZAWA GROUP
80
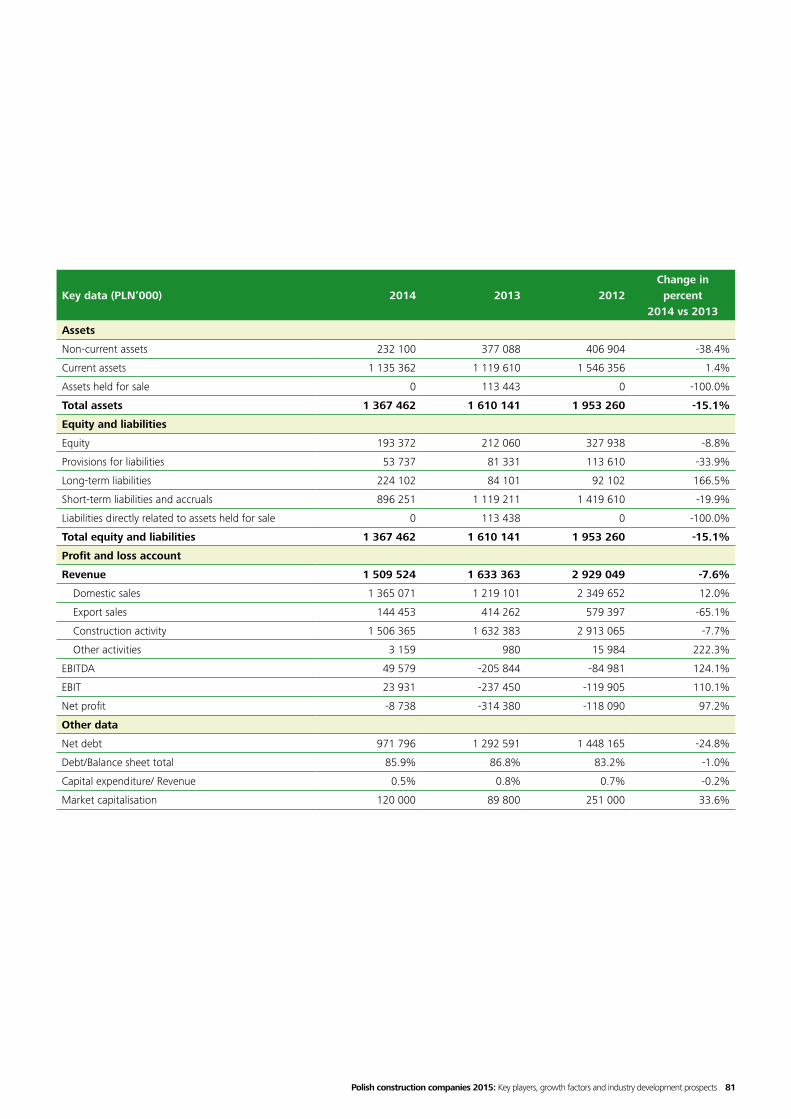
Key data (PLN’000) 2014 2013 2012Change in percent
2014 vs 2013
Assets
Non-current assets 232 100 377 088 406 904 -38.4%
Current assets 1 135 362 1 119 610 1 546 356 1.4%
Assets held for sale 0 113 443 0 -100.0%
Total assets 1 367 462 1 610 141 1 953 260 -15.1%
Equity and liabilities
Equity 193 372 212 060 327 938 -8.8%
Provisions for liabilities 53 737 81 331 113 610 -33.9%
Long-term liabilities 224 102 84 101 92 102 166.5%
Short-term liabilities and accruals 896 251 1 119 211 1 419 610 -19.9%
Liabilities directly related to assets held for sale 0 113 438 0 -100.0%
Total equity and liabilities 1 367 462 1 610 141 1 953 260 -15.1%
Profit and loss account
Revenue 1 509 524 1 633 363 2 929 049 -7.6%
Domestic sales 1 365 071 1 219 101 2 349 652 12.0%
Export sales 144 453 414 262 579 397 -65.1%
Construction activity 1 506 365 1 632 383 2 913 065 -7.7%
Other activities 3 159 980 15 984 222.3%
EBITDA 49 579 -205 844 -84 981 124.1%
EBIT 23 931 -237 450 -119 905 110.1%
Net profit -8 738 -314 380 -118 090 97.2%
Other data
Net debt 971 796 1 292 591 1 448 165 -24.8%
Debt/Balance sheet total 85.9% 86.8% 83.2% -1.0%
Capital expenditure/ Revenue 0.5% 0.8% 0.7% -0.2%
Market capitalisation 120 000 89 800 251 000 33.6%
Polish construction companies 2015: Key players, growth factors and industry development prospects 81

EBITDA, EBIT and net profit in 2012-2014
2014 2013 2012
PLN
mill
ion
Sales structure by geography in 2014
Sales structure by type in 2014
Domestic sales Export sales
Engineering and industrial segment General construction segment Other activities
79%
21%
90%
10%
-350
-300
-250
-200
-150
-100
-50
0
50
100
EBITDA EBIT Net profit
82

The parent company - Elektrobudowa S.A. - was founded in 1953 as Przedsiębiorstwo Montażu Elektrycznego „Elektrobudowa”. In 1992 this state-owned enterprise was transformed into a joint-stock company , and three years later the company’s IPO was held, while the first quotation took place in 1996.
At the end of 2014 open pension funds were the company’s major shareholders: AVIVA OFE AVIVA BZ WBK S.A. (12.2%), PKO BP Bankowy Otwarty Fundusz Emerytalny (9.85%), OFE PZU „Złota Jesień” (9.57%), AXA Otwarty Fundusz Emerytalny (9.41%), ING Otwarty Fundusz Emerytalny (6.76%), PTE Allianz Polska SA (6.31%), MetLife Otwarty Fundusz Emerytalny (5.91%), Generali Otwarty Fundusz Emerytalny (5.09%).
At present the Elektrobudowa Group provides comprehensive construction and installation services for the needs of power engineering, petrochemicals, mining and public utility buildings construction. The business activity of the Group can be divided into the following segments:
• power engineering – electrical installations, electrical substations, power transmission and distribution facilities;
• construction segment – general and industrial EPCM construction and electrical installations;
• industry segment – full electrical installations;
• automatics segment – MV and LV indoor switchgears.
In 2014 the Elektrobudowa Group employed 2,055 persons and generated revenue of PLN 1.1 billion, meaning a year-on-year growth in sales in excess of 22%. As much as 94% of the revenue in 2014 was generated domestically. The remainder was obtained from sales of services and products, among others to EU member states, Eastern Europe and Asia.
In 2014 EBITDA equalled PLN 49.3 million and increased by 27% as compared with 2013. EBIT of the Group for 2014 amounted to PLN 35.7 million vs. PLN 24.7 million in 2013. The net result for 2014 amounted to PLN 27 million and increased by more than a half year-on-year.
In 2014 the share of debt capital in the financing of the Group’s assets was 63%.
ELEKTROBUDOWA GROUP
Polish construction companies 2015: Key players, growth factors and industry development prospects 83

Key data (PLN’000) 2014 2013 2012Change in percent
2014 vs 2013
Assets
Non-current assets 174 263 199 527 197 762 -12.7%
Current assets 737 303 576 137 494 072 28.0%
Non-current assets held for sale 246 0 0 n.d.
Total assets 911 812 775 664 691 834 17.6%
Equity and liabilities
Equity 338 243 326 724 318 882 3.5%
Provisions for liabilities 10 422 12 482 892 -16.5%
Long-term liabilities 14 737 12 338 21 156 19.4%
Short-term liabilities and accruals 548 410 424 120 350 904 29.3%
Total equity and liabilities 911 812 775 664 691 834 17.6%
Profit and loss account
Revenue 1 108 316 905 553 1 018 002 22.4%
Domestic sales 1 040 980 676 284 801 439 53.9%
Export sales 67 336 229 269 216 563 -70.6%
Construction activity 904 583 623 640 780 807 45.0%
Other activities 203 733 281 913 237 195 -27.7%
EBITDA 49 299 38 773 34 500 27.1%
EBIT 35 718 24 682 22 458 44.7%
Net profit 27 015 17 585 23 215 53.6%
Other data
Net debt 511 330 368 452 327 758 38.8%
Debt/Balance sheet total 62.9% 57.9% 53.9% 5.0%
Capital expenditure/ Revenue 1.0% 1.9% 2.1% -0.9%
Market capitalisation 350 373 522 237 505 620 -32.9%
84

Sales structure by geography in 2014Sales structure by type in 2014
Domestic sales Export sales
Construction and assembly services Electrotechnical products Other services Sales of materials
EBITDA, EBIT and net profit in 2012-2014
2014 2013 2012
PLN
mill
ion
2%
82%
16%
2%
94%
6%0%
0
10
20
30
40
50
60
EBITDA EBIT Net profit
Polish construction companies 2015: Key players, growth factors and industry development prospects 85

UNIBEP S.A., whose origins date back to 1950, is the parent company of the UNIBEP capital group. The company first operated as a state-owned enterprise and in 1998 it was transformed into a limited liability stock company. In 1999 the company’s name was changed to UNIBUD BEP Sp. z o.o. and then in 2004 it was transformed into a joint-stock company. It has been operating under its current name - UNIBEP S.A. - since 2006. In 2008 the company made its initial public offering on Warsaw Stock Exchange.
As at 31 December 2014 the shareholding structure of UNIBEP S.A. was as follows: Zofia Mikołuszko held 26.17% of shares, Zofia Stajkowska held 17.11% of shares, Beata Skowrońska held 16.52% of shares and AVIVA OFE AVIVA BZ WBK S.A. held 9.75% of shares.
The core business activity of the parent company includes general construction of buildings both in Poland and abroad, while the services offered by the Group as a whole include construction and assembly, road construction, developer activity and production.
In 2014 the UNIBEP Group employed 975 people and its core business revenue amounted to PLN 1.1 billion with an increase in sales by over 17% vs. 2013. In 2014, 70% of revenue was generated in Poland, whereas the remaining part was derived from export. Sales structure by market segment: 69% of revenue was generated by construction of buildings and facilities, and 31% by other activities, to include road construction, real property management and developer activities.
In 2014 EBITDA amounted to PLN 32 million and decreased by 6% year-on-year. EBIT of the UNIBEP Group for 2014 amounted to PLN 25.1 million as compared with PLN 28.1 million in 2013. The net result for 2014 was PLN 20.9 million and was lower PLN 4.7 million higher than in 2013.
In 2014 the share of equity in the financing of the Group’s assets was 30%.
Contracts for residential building construction in Warsaw and Poznań were most important for the company’s business in 2014. Also, general contractor’s activities were continued on the German market.
UNIBEP GROUP
86

Key data (PLN’000) 2014 2013 2012Change in percent
2014 vs 2013
Assets
Non-current assets 172 281 144 911 107 228 18.9%
Current assets 494 353 409 183 472 585 20.8%
Assets held for sale 10 0 0 n.d.
Total assets 666 644 554 094 579 813 20.3%
Equity and liabilities
Equity 203 046 185 820 171 867 9.3%
Provisions for liabilities 91 872 59 968 59 590 53.2%
Long-term liabilities 68 396 63 391 49 493 7.9%
Short-term liabilities and accruals 303 330 244 915 298 863 23.9%
Total equity and liabilities 666 644 554 094 579 813 20.3%
Profit and loss account
Revenue 1 079 703 920 548 837 821 17.3%
Domestic sales 760 206 664 912 564 364 14.3%
Export sales 319 497 255 636 273 457 25.0%
Construction activity 868 394 720 889 654 466 20.5%
Other activities 211 309 199 659 183 355 5.8%
EBITDA 32 068 34 015 25 754 -5.7%
EBIT 25 138 28 096 20 210 -10.5%
Net profit 20 925 16 211 16 671 29.1%
Other data
Net debt 337 530 277 761 371 384 21.5%
Debt/Balance sheet total 69.5% 66.5% 70.4% 3.1%
Capital expenditure/ Revenue 0.3% 1.3% 0.5% -1.0%
Market capitalisation 288 281 275 361 171 810 4.7%
Polish construction companies 2015: Key players, growth factors and industry development prospects 87
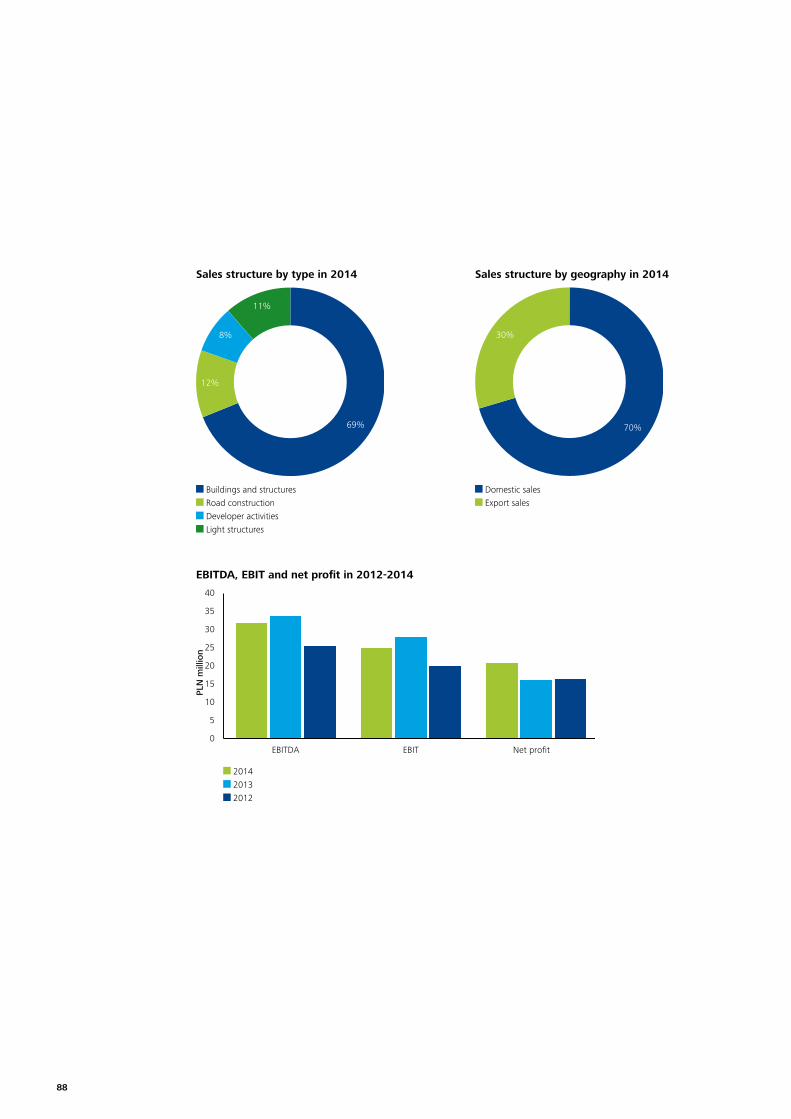
Sales structure by geography in 2014Sales structure by type in 2014
Domestic sales Export sales
Buildings and structures Road construction Developer activities Light structures
EBITDA, EBIT and net profit in 2012-2014
2014 2013 2012
PLN
mill
ion
69%
12%
8%
11%
70%
30%
0
5
10
15
20
25
30
35
40
EBITDA EBIT Net profit
88

Warbud has been operating on the Polish market since 1989. At first the company was functioning as an independent enterprise founded by Włodzimierz Włodarczyk who now is its CEO. In 1992 Warbud was transformed into a joint-stock company with the participation of a French building construction tycoon – CBC (now VINCI Construction) belonging to the VINCI Group. VINCI Construction remains the main shareholder of the company with 99.74% interest in the share capital as at 31 December 2014. For several years now the VINCI Group has been at the top of the ranking of building construction companies in Europe according to the revenue value. Thanks to its membership in the VINCI Group, Warbud can resort to the experience of international experts, it enjoys stability and good financial standing. Benefiting from positive and extensive (over 20 years) experience of VINCI regarding PPP, Warbud has been involved in activities promoting application of PPP solutions in extension and management of public infrastructure. In 2015, the company signed the first governmental PPP project in Poland, regarding the construction of a Regional Court building in Nowy Sącz.
Primarily, Warbud provides services within the construction sector, focusing on buildings and facilities (shopping centres, office buildings, housing developments), civil engineering structures (roads, bridges), developments for healthcare purposes (hospitals, healthcare centres, health farms) culture-related facilities (theatres, concert halls, museums), environmental projects (sewage treatment plants, incineration plants) as well as specialised construction works and concrete production.
In 2014 Warbud employed 967 people and its core business revenue amounted to PLN 1.0 billion with a decrease in sales by 6% as compared with the previous year. 99% of the revenue was generated from construction and assembly activities, whereas 1% was derived from other activities.
The entire revenue was generated on the domestic market.
The EBIT of the company for 2014 amounted to PLN 48.8 million as compared with PLN 37.0 million in 2013, which signifies a growth of 31.7%.
In 2014 EBITDA equalled PLN 56.7 million and increased by 29% as compared with 2013. The net profit for 2014 amounted to PLN 48.4 million and increased by nearly 49% year-on-year. In 2014 the share of debt capital in the total financing of the company’s operations was 80%. The funding structure has not changed over recent years.
WARBUD
Polish construction companies 2015: Key players, growth factors and industry development prospects 89

Key data (PLN’000) 2014 2013* 2012Change in percent
2014 vs 2013
Assets
Non-current assets 80 393 79 401 89 789 1.2%
Current assets 659 294 705 639 730 200 -6.6%
Total assets 739 687 785 040 819 989 -5.8%
Equity and liabilities
Equity 146 697 131 063 126 785 11.9%
Provisions for liabilities 36 583 29 830 24 408 22.6%
Long-term liabilities 103 581 114 017 118 668 -9.2%
Short-term liabilities and accruals 452 826 510 130 550 128 -11.2%
Total equity and liabilities 739 687 785 040 819 989 -5.8%
Profit and loss account
Revenue 1 049 886 1 121 472 1 345 788 -6.4%
Domestic sales 1 049 886 1 121 472 1 345 788 -6.4%
Export sales 0 0 0 n.d.
Construction activity 1 038 747 1 107 460 1 334 465 -6.2%
Other activities 11 139 14 012 11 323 -20.5%
EBITDA 56 726 43 965 40 929 29.0%
EBIT 48 775 37 022 30 080 31.7%
Net profit 48 416 32 555 39 049 48.7%
Other data
Net debt 171 687 209 654 273 972 -18.1%
Debt/Balance sheet total 80.2% 83.3% 84.5% -3.1%
Capital expenditure/ Revenue 1.8% 1.0% 0.4% 0.8%
* The financial data for 2013 was reconciled to the financial statements for 2014 following adjustments of the opening balance.
90

Sales structure by geography in 2014Sales structure by type in 2014
Domestic sales Revenue from construction and assembly services Revenue from other services Revenue from sales of goods and materials
EBITDA, EBIT and net profit in 2012-2014
2014 2013 2012
PLN
mill
ion
99%
1%
100%
0
10
20
30
40
50
60
EBITDA EBIT Net profit
Polish construction companies 2015: Key players, growth factors and industry development prospects 91
The PORR concern was formed in 1869 and is one of the largest Austrian construction companies and a leading player in Europe. With numerous offices across Central, Eastern and South-Eastern Europe, PORR has been expanding into international markets in the Middle East, mainly in Qatar.
In Poland, PORR (POLSKA) S.A. has been involved in the construction business since 1987. The leading company of the concern - PORR (POLSKA) S.A. was established in 1993. PORR (Polska) S.A. offers a wide range of building construction services, in particular: general construction (hotels, office buildings, residential buildings, schools, commercial centres and industrial facilities) and following a merger with PTU Polska Sp. z o.o. and Teerag-Asdag Polska Sp. z o.o. in 2012, its offer has been extended with construction of roads, railways, infrastructure, environmental protection technologies and power engineering facilities. In 2015, PORR Polska Infrastructure S.A., established as a result of acquisition of Bilfinger Infrastructure S.A. by PORR AG, joined the capital group.
As at the end of 2014, the following entities constituted the PORR (Polska) S.A. Capital Group: Stal – Service Sp. z o.o. – offering comprehensive services involving production and supply of construction reinforcement products; Modzelewski & Rodek Sp. z o.o. – ECPM and finishing works, Stump – Hydrobudowa Sp. z o.o. – specialising in engineering and hydrotechnical structures.
Main general construction projects carried out in Poland in 2014:
• construction of the Nimbus office building in Warsaw;
• construction of “Ferio Wawer” commercial centre;
• construction of a residential, office and service centre “Browar Lubicz” in Kraków.
Main infrastructural projects carried out in Poland in 2014:
• Improvement of LK18 railway line from Toruń to Bydgoszcz;
• Improvement of LK132 railway line from Błotnica to Opole;
• Improvement of LK272 railway line from Kluczbork to Ostrzeszów;
• Improvement of LK356 railway line from Poznań Wschód to Gołańcz;
• Construction of DK 61 national road (the ring road of Bargłowo Kościelne).
Revenue of PORR (Polska) S.A. in 2014 amounted to PLN 1,045 million and increased by PLN 15 million vs. 2013.
PORR (POLSKA) S.A.
92

MIRBUD S.A. is a company operating in the residential and industrial construction and road infrastructure segments. It commenced its operations in 1988.
After twenty years in business, it had an IPO on Warsaw Stock Exchange.
MIRBUD S.A. operates mostly as a general contractor. Residential construction contracts are performed mostly by JHM Development S.A., a subsidiary listed on Warsaw Stock Exchange. Przedsiębiorstwo Budowy Dróg i Mostów Kobylarnia S.A., another subsidiary, specialises in road construction and production of bituminous mass. The group owns and manages the market halls located at Marywilska in Warsaw.
In 2014 the group’s revenue was 3.7% higher than in 2013, mainly as a result of a significant increase in sales in the developer segment. The group’s sales structure has generally remained unchanged compared with the previous year.
The construction and assembly services, carried out primarily in the engineering and road construction sector, constituted 89.5% of the total sales of the group.
The EBIT of the group for 2014 exceeded PLN 36 million and was higher by 10% than in the previous year.
The net profit of the group increased by 6% vs. 2013 and amounted to PLN 17.6 million.
Equity accounts for 37% of the financing of MIRBUD Group’s assets.
MIRBUD GROUP
Polish construction companies 2015: Key players, growth factors and industry development prospects 93

Key data (PLN’000) 2014 2013 2012Change in percent
2014 vs 2013
Assets
Non-current assets 323 776 276 759 257 655 17.0%
Current assets 465 577 583 721 425 042 -20.2%
Total assets 789 353 860 480 682 697 -8.3%
Equity and liabilities
Equity 295 019 261 751 245 153 12.7%
Provisions for liabilities 19 508 19 381 14 269 0.7%
Long-term liabilities 155 704 141 539 145 321 10.0%
Short-term liabilities and accruals 319 122 437 809 277 954 -27.1%
Total equity and liabilities 789 353 860 480 682 697 -8.3%
Profit and loss account
Revenue 971 603 937 301 589 808 3.7%
Domestic sales 971 603 937 301 589 808 3.7%
Export sales 0 0 0 n.d.
Construction activity 869 166 861 833 510 527 0.9%
Other activities 102 437 75 468 79 281 35.7%
EBITDA 43 223 38 567 28 745 12.1%
EBIT 36 393 32 991 22 829 10.3%
Net profit 17 583 16 601 8 608 5.9%
Other data
Net debt 474 505 574 687 420 567 -17.4%
Debt/Balance sheet total 62.6% 69.6% 64.1% -7.0%
Capital expenditure/ Revenue 1.8% 0.3% 4.2% 1.4%
Market capitalisation 112 190 117 000 92 250 -4.1%
94
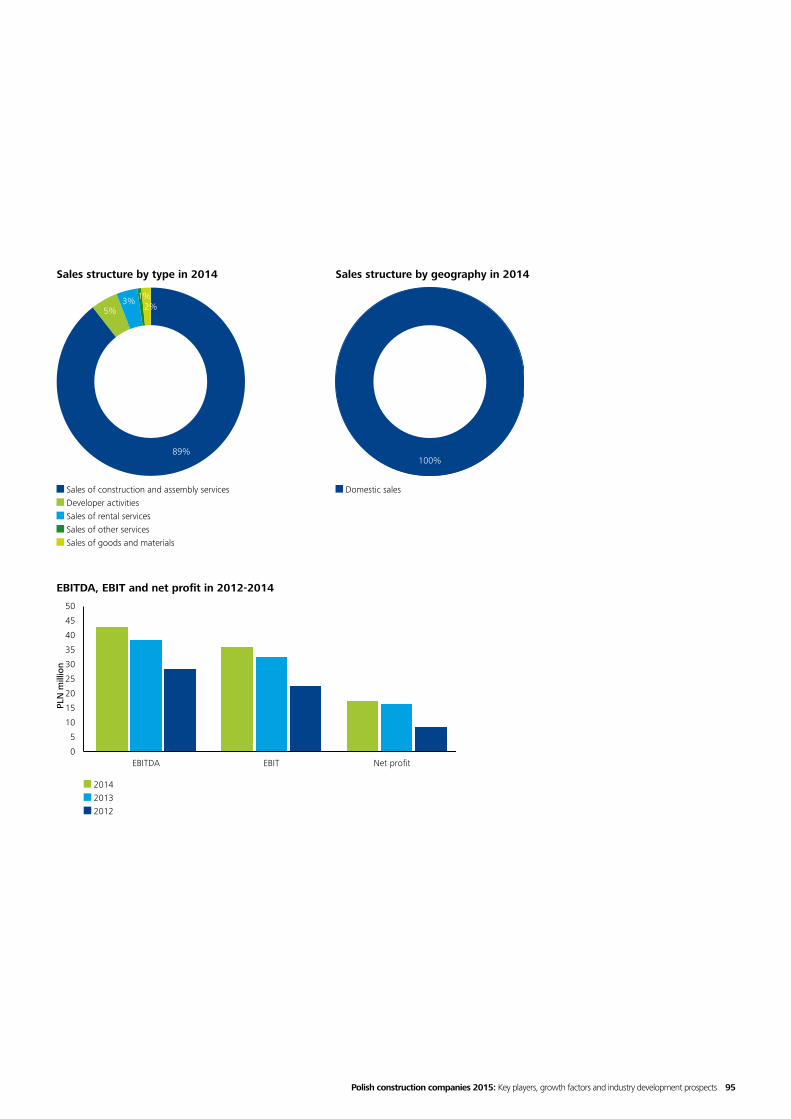
Sales structure by geography in 2014Sales structure by type in 2014
Domestic sales Sales of construction and assembly services Developer activities Sales of rental services Sales of other services Sales of goods and materials
EBITDA, EBIT and net profit in 2012-2014
2014 2013 2012
PLN
mill
ion
89%
5%3% 1%
2%
100%
0
5
10
15
20
25
30
35
40
45
50
EBITDA EBIT Net profit
Polish construction companies 2015: Key players, growth factors and industry development prospects 95

The history of the parent company began in 1945, when the state-owned enterprise Przedsiębiorstwo Budowy Mostów i Konstrukcji Stalowych “Mostostal”in Kraków was founded. In 1992, the entity was privatized and transformed into Mostostal Zabrze – Holding S.A. In 1994 the company made its initial public offering on Warsaw Stock Exchange.
At the end of 2013 the business name of the company was changed to Mostostal Zabrze S.A.
The Mostostal Zabrze Group operates in the following sectors:
• industrial construction (steel sector, power engineering, environmental protection, chemical and petrochemical facilities, facilities for machine industry, mining, automotive and food sector);
• general construction and construction engineering;
• environmental projects;
• specialist construction;
• transport infrastructure (roads, bridges, airports, border crossing points).
In 2014 the group saw a 50% increase in revenue, mainly due to a significant increase in that from domestic sales (by 79%). Export sales increased by 8%. Vast majority of sales revenue (67%) is generated by assembly and production activities.
In 2014, financial performance of the group improved. EBIT increased from PLN 15 million in 2013 to PLN 32.8 million in 2014, while EBITDA increased from PLN 28.7 million in 2013 to PLN 47.1 million in 2014. In 2014, the group generated net profit of PLN 19.1 million, i.e. 150% higher than in 2013.
The share of debt capital and equity in the financing of assets is equal. The net debt level is similar to that of 2013. In 2014 the average employment was 2,411 people.
MOSTOSTAL ZABRZE GROUP
96

Key data (PLN’000) 2014 2013 2012Change in percent
2014 vs 2013
Assets
Non-current assets 188 351 240 531 234 017 -21.7%
Current assets 320 264 292 224 269 065 9.6%
Assets held for sale 60 579 1 811 0 3245.1%
Total assets 569 194 534 566 503 082 6.5%
Equity and liabilities
Equity 280 229 270 824 250 574 3.5%
Provisions for liabilities 45 678 37 291 51 079 22.5%
Long-term liabilities 17 317 20 912 8 312 -17.2%
Short-term liabilities and accruals 225 914 205 539 193 117 9.9%
Liabilities directly related to assets held for sale 56 0 0 n.d.
Total equity and liabilities 569 194 534 566 503 082 6.5%
Profit and loss account
Revenue 862 650 575 117 648 730 50.0%
Domestic sales 608 147 339 539 346 921 79.1%
Export sales 254 503 235 578 301 809 8.0%
Construction activity 181 963 126 008 125 144 44.4%
Other activities 680 687 449 109 523 586 51.6%
EBITDA 47 116 28 659 19 631 64.4%
EBIT 32 770 15 027 6 330 118.1%
Net profit 19 134 7 648 -10 240 150.2%
Other data
Net debt 246 672 241 981 212 001 1.9%
Debt/Balance sheet total 50.8% 49.3% 50.2% 1.4%
Capital expenditure/ Revenue 2.2% 1.8% 2.4% 0.4%
Market capitalisation 331 070 292 296 170 009 13.3%
Polish construction companies 2015: Key players, growth factors and industry development prospects 97

Sales structure by type in 2014
Assembly and production Machinery construction General construction and construction engineering Design and engineering services
EBITDA, EBIT and net profit in 2012-2014
2014 2013 2012
PLN
mill
ion
Sales structure by geography in 2014
Domestic sales Export sales
67%
10%
21%
2%
70%
30%
-20
-10
0
10
20
30
40
50
EBITDA EBIT Net profit
98

Torpol Sp. z o.o., the parent company in the capital group, was incorporated in 1999. In 2012 it was transformed into a joint stock company. On 1 July 2014 allocation of shares of Torpol S.A. took place during IPO, when Polimex – Mostostal, the former owner, sold all shares held. The first quotation of shares and allotment certificates on Warsaw Stock Exchange took place on 8 July 2014.
The core business of the group involves general contractor’s services related to construction of roads and railways.
It also provides general construction services regarding power and telecommunication lines and design services. Key shareholders of Torpol S.A. as at 31 December 2014: TF Silesia Sp. z o.o. (38% of shares), Pioneer Pekao Investment Management S.A. (9.61% of shares), PKO TFI (8.71% of shares), Altus TFI S.A. (5.49% of shares), Noble Funds (5.14% of shares).
In 2014 the average employment in the group exceeded 435 people. In 2014, sales revenue increased substantially (by nearly 87%) compared to 2013 and reached PLN 775 million, both as a result of an increase in revenue generated on the domestic and foreign markets. Most of the revenue is generated from operations in the railway segment.
EBIT, EBITDA and net profit of the group increased significantly.
In 2014, EBIT amounted to PLN 32.6 million (a growth in excess of three times), and EBITDA, to PLN 43.2 million (a 102% increase). The net profit increased more than five times, from PLN 4.8 million in 2013 to PLN 25 million in 2014.
Debt capital accounts for 75% of the financing of Torpol Group’s assets.
TORPOL GROUP
Polish construction companies 2015: Key players, growth factors and industry development prospects 99

Key data (PLN’000) 2014 2013 2012Change in percent
2014 vs 2013
Assets
Non-current assets 115 987 105 727 102 254 9.7%
Current assets 706 733 389 494 247 089 81.4%
Total assets 822 720 495 221 349 343 66.1%
Equity and liabilities
Equity 203 312 123 008 118 492 65.3%
Provisions for liabilities 1 941 914 891 112.4%
Long-term liabilities 33 661 31 718 36 049 6.1%
Short-term liabilities and accruals 583 806 339 581 193 911 71.9%
Total equity and liabilities 822 720 495 221 349 343 66.1%
Profit and loss account
Revenue 775 399 415 717 380 368 86.5%
Domestic sales 746 892 401 790 339 207 85.9%
Export sales 28 507 13 927 41 161 104.7%
Construction activity 755 188 394 033 314 729 91.7%
Other activities 20 211 21 684 65 639 -6.8%
EBITDA 43 161 21 369 20 169 102.0%
EBIT 32 647 10 730 9 436 204.3%
Net profit 25 009 4 790 5 594 422.1%
Other data
Net debt 361 949 252 306 179 876 43.5%
Debt/Balance sheet total 75.3% 75.2% 66.1% 0.1%
Capital expenditure/ Revenue 1.9% 1.7% 4.3% 0.3%
Market capitalisation 229 011IPO
on 8 July2014
100

Sales structure by type in 2014
Railways Tramlines Other
EBITDA, EBIT and net profit in 2012-2014
2014 2013 2012
PLN
mill
ion
Sales structure by geography in 2014
Domestic sales Export sales
93%
4% 3%
96%
4%
0
5
10
15
20
25
30
35
40
45
50
EBITDA EBIT Net profit
Polish construction companies 2015: Key players, growth factors and industry development prospects 101
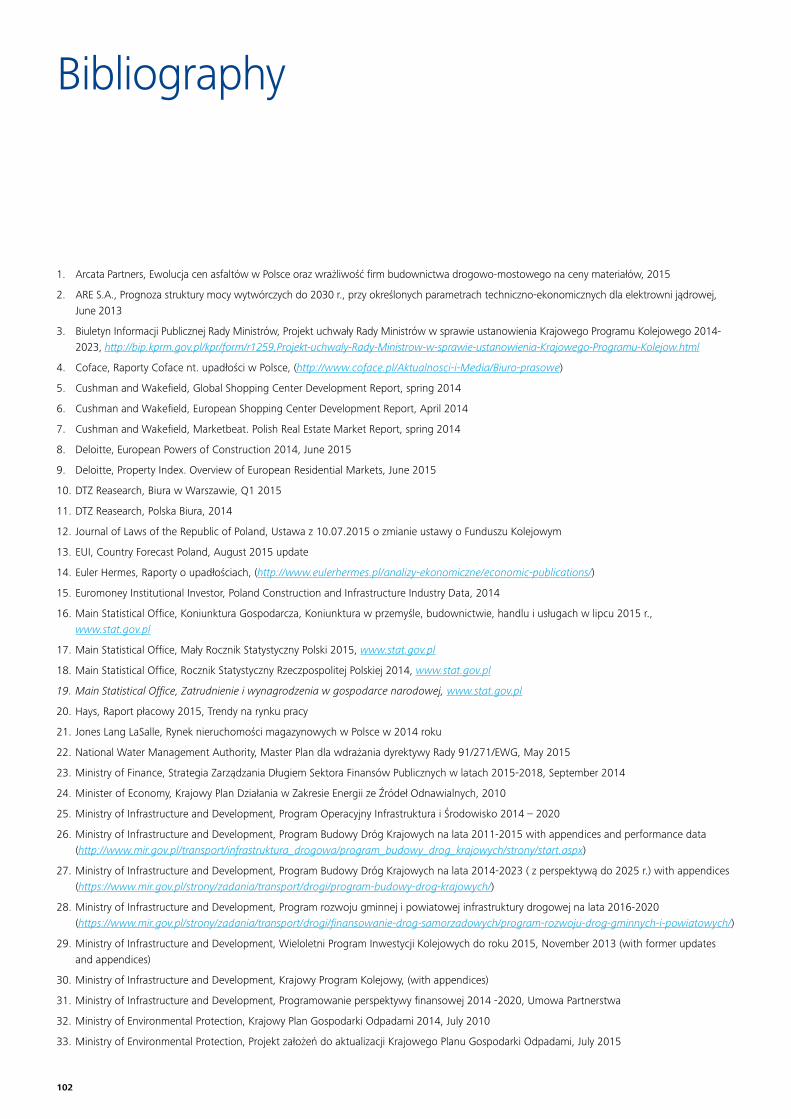
1. Arcata Partners, Ewolucja cen asfaltów w Polsce oraz wrażliwość firm budownictwa drogowo-mostowego na ceny materiałów, 2015
2. ARE S.A., Prognoza struktury mocy wytwórczych do 2030 r., przy określonych parametrach techniczno-ekonomicznych dla elektrowni jądrowej, June 2013
3. Biuletyn Informacji Publicznej Rady Ministrów, Projekt uchwały Rady Ministrów w sprawie ustanowienia Krajowego Programu Kolejowego 2014-2023, http://bip.kprm.gov.pl/kpr/form/r1259,Projekt-uchwaly-Rady-Ministrow-w-sprawie-ustanowienia-Krajowego-Programu-Kolejow.html
4. Coface, Raporty Coface nt. upadłości w Polsce, (http://www.coface.pl/Aktualnosci-i-Media/Biuro-prasowe)
5. Cushman and Wakefield, Global Shopping Center Development Report, spring 2014
6. Cushman and Wakefield, European Shopping Center Development Report, April 2014
7. Cushman and Wakefield, Marketbeat. Polish Real Estate Market Report, spring 2014
8. Deloitte, European Powers of Construction 2014, June 2015
9. Deloitte, Property Index. Overview of European Residential Markets, June 2015
10. DTZ Reasearch, Biura w Warszawie, Q1 2015
11. DTZ Reasearch, Polska Biura, 2014
12. Journal of Laws of the Republic of Poland, Ustawa z 10.07.2015 o zmianie ustawy o Funduszu Kolejowym
13. EUI, Country Forecast Poland, August 2015 update
14. Euler Hermes, Raporty o upadłościach, (http://www.eulerhermes.pl/analizy-ekonomiczne/economic-publications/)
15. Euromoney Institutional Investor, Poland Construction and Infrastructure Industry Data, 2014
16. Main Statistical Office, Koniunktura Gospodarcza, Koniunktura w przemyśle, budownictwie, handlu i usługach w lipcu 2015 r., www.stat.gov.pl
17. Main Statistical Office, Mały Rocznik Statystyczny Polski 2015, www.stat.gov.pl
18. Main Statistical Office, Rocznik Statystyczny Rzeczpospolitej Polskiej 2014, www.stat.gov.pl
19. Main Statistical Office, Zatrudnienie i wynagrodzenia w gospodarce narodowej, www.stat.gov.pl
20. Hays, Raport płacowy 2015, Trendy na rynku pracy
21. Jones Lang LaSalle, Rynek nieruchomości magazynowych w Polsce w 2014 roku
22. National Water Management Authority, Master Plan dla wdrażania dyrektywy Rady 91/271/EWG, May 2015
23. Ministry of Finance, Strategia Zarządzania Długiem Sektora Finansów Publicznych w latach 2015-2018, September 2014
24. Minister of Economy, Krajowy Plan Działania w Zakresie Energii ze Źródeł Odnawialnych, 2010
25. Ministry of Infrastructure and Development, Program Operacyjny Infrastruktura i Środowisko 2014 – 2020
26. Ministry of Infrastructure and Development, Program Budowy Dróg Krajowych na lata 2011-2015 with appendices and performance data (http://www.mir.gov.pl/transport/infrastruktura_drogowa/program_budowy_drog_krajowych/strony/start.aspx)
27. Ministry of Infrastructure and Development, Program Budowy Dróg Krajowych na lata 2014-2023 ( z perspektywą do 2025 r.) with appendices (https://www.mir.gov.pl/strony/zadania/transport/drogi/program-budowy-drog-krajowych/)
28. Ministry of Infrastructure and Development, Program rozwoju gminnej i powiatowej infrastruktury drogowej na lata 2016-2020 (https://www.mir.gov.pl/strony/zadania/transport/drogi/finansowanie-drog-samorzadowych/program-rozwoju-drog-gminnych-i-powiatowych/)
29. Ministry of Infrastructure and Development, Wieloletni Program Inwestycji Kolejowych do roku 2015, November 2013 (with former updates and appendices)
30. Ministry of Infrastructure and Development, Krajowy Program Kolejowy, (with appendices)
31. Ministry of Infrastructure and Development, Programowanie perspektywy finansowej 2014 -2020, Umowa Partnerstwa
32. Ministry of Environmental Protection, Krajowy Plan Gospodarki Odpadami 2014, July 2010
33. Ministry of Environmental Protection, Projekt założeń do aktualizacji Krajowego Planu Gospodarki Odpadami, July 2015
Bibliography
102

34. ManpowerGroup, Barometr Manpower Perspektyw Zatrudnienia Polska Q4 2015
35. PMR, Inwestycje w energetykę konwencjonalną w Polsce w fazie przygotowania i planowania, July 2015
36. PMR, Profile głównych inwestorów na rynku energetycznym w Polsce, lipiec 2015
37. Polish Chamber of Waste Management, Założenia do aktualizacji Krajowego planu gospodarki odpadami, July 2015
38. PSE, Aktualizacja planu rozwoju w zakresie zaspokojenia obecnego i przeszłego zapotrzebowania na energię elektryczną na lata 2010 – 2025 w zakresie lat 2014 – 2018, February 2014
39. REAS, Residential Market in Poland Q2 2015
40. Website of CIRE.pl: http://www.rynek-energii-elektrycznej.cire.pl/st,33,335,tr,145,0,0,0,0,0,budowane-i-planowane-elektrownie.html
41. Website of Eurostat: http://ec.europa.eu/eurostat
42. Website of Ministry of Infrastructure and Development dedicated to EU funds for the years 2014-2020: https://www.funduszeeuropejskie.gov.pl/
43. Website of GDNRM, Raport o stanie technicznym sieci dróg krajowych na koniec 2014 roku: https://www.gddkia.gov.pl/userfiles/articles/r/raporty_18751/raport%202014.pdf
44. Website of PKP PLK: http://www.plk-sa.pl
45. Website of National Water Management Authority dedicated to National Wastewater Treatment Programme: http://kzgw.gov.pl/pl/Krajowy-program-oczyszczania-sciekow-komunalnych.html
46. Website of National Water Management Authority, Master Plan for implementation of the Council Directive 91/271/EEC (http://www.kzgw.gov.pl/pl/Wiadomosci/Master-Plan-dla-wdrazania-dyrektywy-Rady-91271EWG.html)
47. Website of Energy Regulatory Office: http://www.ure.gov.pl/
48. TechNavio, Construction Market in Poland 2015-2019
49. Energy Regulatory Office, Raport Krajowy Prezesa Urzędu Regulacji Energetyki 2015, July 2015
50. Long-term financial plans for Warsaw, Kraków, Poznań, Wrocław, Gdańsk and Katowice
51. The Polish Bank Association, Ogólnopolski raport o kredytach mieszkaniowych i cenach transakcyjnych nieruchomości, August 2015
52. Press releases and websites:
http://www.bankier.pl/wiadomosc/Od-2016-roku-wzrosna-ceny-materialow-budowlanych-7256650.html
http://budownictwo.wnp.pl/budimex-dominuje-portfel-zlecen-moze-siegnac-8-5-mld-zl,255394_1_0_0.html
http://energetyka.wnp.pl/energa-operator-w-najblizszych-latach-blisko-8-mld-zl-inwestycji,219113_1_0_0.html
http://energetyka.wnp.pl/pge-dystrybucja-w-najblizszych-latach-ok-10-mld-zl-inwestycji,218983_1_0_0.html
http://energetyka.wnp.pl/prezes-enea-operator-5-3-mld-zl-inwestycji-w-latach-2014-2019,218948_1_0_0.html
http://energetyka.wnp.pl/rwe-stoen-operator-w-2010-r-zainwestuje-w-siec-energetyczna-okolo-175-mln-zl,114908_1_0_0.html
http://energetyka.wnp.pl/tauron-dystrybucja-ponad-10-mld-zl-inwestycji-w-szesc-lat,218803_1_0_0.html
http://www.funduszeeuropejskie.gov.pl/strony/o-funduszach/zasady-dzialania-funduszy/program-laczac-europe/
http://www.gddkia.gov.pl/pl/2659/Aktualnosci,s-1Puls Biznesu, „PKP PLK na nowych torach, 07.09.2015
http://www.sejm.gov.pl/Sejm7.nsf/komunikat.xsp?documentId=8FFC0FFEAFF3529EC1257D11004B8BED
http://mieszkaniedlamlodych.com/nowelizacja-programu-mieszkanie-dla-mlodych-juz-w-sierpniu/
https://www.mir.gov.pl/strony/aktualnosci/program-rozwoju-gminnej-i-powiatowej-infrastruktury-drogowej/
https://www.mir.gov.pl/strony/aktualnosci/rzad-zaakceptowal-nowy-program-drogowy
https://www.mir.gov.pl/strony/zadania/transport/drogi/rodzaje-drog-w-polsce/
http://energetyka.wnp.pl/zintegrowany-przetarg-na-budowe-elektrowni-jadrowej-w-2015-r,254975_1_0_0.html
http://www.rynekinfrastruktury.pl/wiadomosci/s14-w-nowym-pbdk-znajdzie-sie-miejsce-dla-obwodnicy-lodzi-49887.html
http://www.rynekinfrastruktury.pl/wiadomosci/mg-uruchomienie-polskiej-elektrowni-jadrowej-planowane-na-lata-20272029-50669.html
http://www.wprost.pl/ar/517997/Elektrownia-atomowa-w-Polsce-Budowa-nawet-do-2031-r/
Polish construction companies 2015: Key players, growth factors and industry development prospects 103

Contact
Maciej KrasońDeloittePartner, Leader of Real Estate & Construction Group in Poland, Audit Department+48 (22) 511 03 [email protected]
Wojciech Kłys DeloitteSenior Manager, Audit Department+48 (22) 511 03 [email protected]
Patryk DarowskiDeloitteAssistant Director, Financial Advisory Services+48 (22) 511 04 [email protected]
104


Deloitte provides audit, tax, consulting and financial advisory services to public and private clients spanning multiple industries. With a globally connected network of member firms in 150 countries, Deloitte brings world-class capabilities and deep local expertise to help clients succeed wherever they operate. Deloitte’s 200 000 professionals are committed to becoming the standard of excellence.
Deloitte’s professionals are unified by a collaborative culture that fosters integrity, outstanding value to markets and clients, commitment to each other, and strength from diversity. They enjoy an environment of continuous learning, challenging experiences, and enriching career opportunities. Deloitte’s professionals are dedicated to strengthening corporate responsibility, building public trust, and making a positive impact in their communities.
Deloitte refers to one or more of Deloitte Touche Tohmatsu Limited, a UK private company limited by guarantee, and its network of member firms, each of which is a legally separate and independent entity. Please see www.deloitte.com/pl/about for a detailed description of the legal structure of Deloitte Touche Tohmatsu Limited and its member firms.
© 2015 Deloitte Poland