portal hypertension is the main driver of liver stiffness
TRANSCRIPT

Portal hypertension is the main driver of liver stiffness in advanced liver cirrhosis
Mariia LUNOVA1, Sona FRANKOVA1,2, Halima GOTTFRIEDOVA2, Renata SENKERIKOVA2,6, Magdalena NEROLDOVA1, Jozef KOVAC3, Eva KIESLICHOVA4, Vera LANSKA5, Eva STICOVA6, Julius SPICAK2, Milan JIRSA1,7, Jan SPERL2,7
1Laboratory of Experimental Hepatology, Institute for Clinical and Experimental Medicine, Prague, Czech Republic
2Department of Hepatogastroenterology, Transplant Centre; Institute for Clinical and Experimental Medicine, Prague, Czech Republic
3Department of Diagnostic and Interventional Radiology, Institute for Clinical and Experimental Medicine, Prague, Czech Republic
4Anaesthesiology, Resuscitation and Intensive Care Department, Institute for Clinical and Experimental Medicine, Prague, Czech Republic
5Department of Biostatistics, Institute for Clinical and Experimental Medicine, Prague, Czech Republic
6Department of Clinical and Transplant Pathology, Institute for Clinical and Experimental Medicine, Prague, Czech Republic
7Institute of Medical Biochemistry and Laboratory Diagnostics, First Faculty of Medicine, Charles University, Prague, Czech Republic
Corresponding author
Jan Sperl, M.D., Ph.D., Department of Hepatogastroenterology, Institute for Clinical and Experimental Medicine, Videnska 1958/9, 140 21 Prague, Czech Republic. Telephone: +420 261 364 003; Fax: +420 261 362 602; E-mail: [email protected]
Short title: Portal hypertension drives liver stiffness in cirrhosis

Summary
Liver stiffness (LS) is a novel non-invasive parameter widely used in clinical hepatology. LS correlates
with liver fibrosis stage in non-cirrhotic patients. In cirrhotic patients it also shows good correlation
with Hepatic Venous Pressure Gradient (HVPG). Our aim was to assess the contribution of liver
fibrosis and portal hypertension to LS in patients with advanced liver cirrhosis. Eighty-one liver
transplant candidates with liver cirrhosis of various aetiologies underwent direct HVPG and LS
measurement by 2D shear-wave elastography (Aixplorer Multiwave, Supersonic Imagine, France).
Liver collagen content was assessed in the explanted liver as collagen proportionate area (CPA) and
hydroxyproline content (HP). The studied cohort included predominantly patients with Child-Pugh
class B and C (63/81, 77.8%), minority of patients were Child-Pugh A (18/81, 22.2%). LS showed the
best correlation with HVPG (r=0.719, p< 0.001), correlation of LS with CPA (r=0.441, p< 0.001) and
HP/Amino Acids (r=0.414, p< 0.001) was weaker. Both variables expressing liver collagen content
showed good correlation with each other (r=0.574, p<0.001). Multiple linear regression identified the
strongest association between LS and HVPG (p < 0.0001) and weaker association of LS with CPA (p =
0.01883). Stepwise modelling showed minimal increase in r2 after addition of CPA to HVPG (0.5073
vs. 0.5513). The derived formula expressing LS value formation is: LS = 2.48 + (1.29 x HVPG) + (0.26 x
CPA). We conclude that LS is determined predominantly by HVPG in patients with advanced liver
cirrhosis whereas contribution of liver collagen content is relatively low.
Key words: hepatic venous portal gradient, elastography, collagen, hydroxyproline, osteopontin
Abbreviations
CSPH, clinically significant portal hypertension; HA, hyaluronic acid; HVPG, Hepatic venous pressure gradient; LR, likelihood ratios; LS, Liver stiffness; LSPS, Liver Spleen Platelets Score; MELD, Model for End-Stage Liver Disease; NPV, negative predictive value, PH, Portal hypertension; PIIINP, Amino-Terminal Propeptide of Type III Procollagen; PPV, positive predictive value; TIMP-1, Tissue Inhibitor of Matrix Metalloproteinase 1; VCAM-1, Vascular Cell Adhesion Molecule 1; 2D-SWE, two-dimensional real time shear-wave elastography.

Introduction
Chronic liver disease (CLD) result from the necro-inflammatory process damaging hepatocytes due to
variety of origins and promoting progression of liver fibrosis to cirrhosis. Progression of liver fibrosis
is associated with increase of liver stiffness (LS) caused by collagen deposition and distortion of liver
architecture. Mechanical changes in liver parenchyma represent the major but not exclusive
contributor to increased portal pressure since liver fibrosis is also accompanied by microvascular
thrombosis, hepatic sinusoidal endothelial cell dysfunction and hepatic stellate cell activation
resulting in increased vascular resistance (McConnell and Iwakiri 2018). Pathophysiology of portal
hypertension (PH) development also includes adaptive changes such as splanchnic and systemic
arterial vasodilatation, hyperdynamic circulation and formation of portosystemic collaterals. These
adaptive changes can further increase the portal pressure (Berzigotti and Bosch 2014).
Hepatic vein pressure gradient (HVPG) represents the gold standard for evaluation of the presence
and severity of PH in patients with liver cirrhosis in clinical hepatology (Bosch 2009). HVPG is
presumably the best validated tool for assessing the risk of severe complications in liver cirrhosis.
HVPG higher than 10 mm Hg is considered to be the cut-off value for clinically significant portal
hypertension (CSPH) (Lebrec 1980). Patients with CSPH are at risk of oesophageal varices, develop
ascites and cirrhosis decompensation (Garcia-Tsao 1985, Groszmann 2005, Ripoll 2007). HVPG higher
than 12 mm Hg is associated with the risk of variceal bleeding, more than 16 mm Hg with high
mortality and HVPG higher than 20 mm Hg predicts failure to control variceal bleeding (Abraldes
2008, Silva-Junior 2015). HVPG measurement by hepatic vein catheterization is an invasive procedure
and therefore, there is a need for an accurate non-invasive method. LS measurement as a non-
invasive predictor of portal hypertension has been extensively studied in the last decade. This
approach failed to predict HVPG values higher than 10 mm Hg in some studies (Procopet 2015);
contrarily, other authors proved good correlation between LS and HVPG also for high values of HVPG
(Stefanescu 2019). The factors influencing correlation between LS and HVPG should be elucidated in
the future.
LS can be measured by elastography techniques which can non-invasively estimate liver fibrosis
stage. Liver stiffness measurement (LSM) has been widely used in clinical hepatology to characterize
the stage of chronic liver disease in the last two decades and almost completely replaced invasive
liver biopsy. Apart from non-invasive assessment of liver fibrosis, LSM also offers the possibility of
non-invasive evaluation of portal hypertension.
Quantitative elastography is based on the measurement of shear wave propagation through the
region of interest in the liver parenchyma (Kennedy 2018). Pulse-echo ultrasound acquisition is used
to follow the propagation of the shear wave and to measure its velocity; the stiffer the tissue, the
faster the shear wave propagates. Transient elastography (TE) is the most commonly used method in
clinical hepatology (Sandrin 2003). The shear wave is generated by a mechanical vibrator mounted
on the axis of the probe. The method is fast and easy, but its use is limited by the presence of ascites.
The layer of the liquid represents an obstacle when the mechanical vibration passes across the
abdominal wall to the liver. TE showed an excellent diagnostic accuracy for diagnosis of liver cirrhosis
in several meta-analyses, with AUROC values > 0.9 (Friedrich-Rust 2008, Li 2016, Shaheen 2007,
Stebbing 2010, Talwalkar 2007, Tsochatzis 2011). TE was better at ruling out rather than ruling in
liver cirrhosis with negative predictive value > 90% in these meta-analyses. TE has also been shown
to have an excellent performance in predicting CSPH, with two meta-analyses reporting AUROCs ≥
0.9 (Shi 2013, You 2017).

The ultrasound-based quantitative elastography systems have recently been implemented in the
standard ultrasound systems and therefore they rapidly spread into clinical practice. The shear wave
in the ultrasound-based systems is generated by an acoustic radiation force impulse (ARFI). ARFI
techniques bring also the benefit of real-time imaging to direct the probe to the region of interest.
ARFI is commonly available in two forms, point shear wave elastography (pSWE) and two-
dimensional shear wave elastography (2D-SWE). Both ARFI techniques allow LSM also in patients
with advanced liver cirrhosis who present with ascites. Furthermore, ARFI methods have
demonstrated an excellent diagnostic performance in predicting CSPH and the presence of
oesophageal varices (Cassinotto 2015, Elkrief 2015, Morishita 2014, Thiele 2020).
Magnetic resonance elastography (MRE) is considered a gold standard in quantitative elastography.
This technique allows measurement of tissue stiffness during clinical MRI exams by encoding the
propagation of shear waves into the MR phase signal. MRE has shown an excellent ability to detect
liver fibrosis and cirrhosis (Singh 2016, Singh 2015). Furthermore, some blood biomarkers were
identified as non-invasive markers of portal hypertension, but their diagnostic power seems to be
less robust in comparison with LSM. On the other hand, the blood biomarkers may serve for the
rapid diagnosis and further research in this field is needed (Bruha 2016, Simbrunner 2020).
The wide clinical experience showed that LS represents a unique parameter reflecting morphological
(fibrosis) and circulatory changes associated with the progression of chronic liver disease. It is also
obvious that the LS value consists of two components: static (fibrosis) and dynamic (portal
hypertension). Liver fibrosis is generally accepted as the driving factor of liver dysfunction and portal
hypertension; two human studies (Calvaruso 2012, Nielsen 2014) showed that in the cirrhotic liver,
the correlation between liver collagen content (collagen proportionate area, CPA) and portal
hypertension (HVPG) is weaker than the correlation between LS and HVPG in the aforementioned
trials. Therefore, it seems likely that in cirrhotic patients, the main component constituting the LS
value is portal hypertension, not collagen content. This hypothesis is supported by experiments on an
artificial liver model or animal livers (Yang 2017, Yarpuzlu 2014, Yin 2013).
The aim of our study was to assess the contribution of static and dynamic component to LS in
patients with advanced liver cirrhosis. To achieve it, we conducted a study in liver transplant
recipients. The study design allowed us to assess the collagen content in the explanted liver by two
independent laboratory methods. LS and HVPG were assessed in the pre-transplant period.
Furthermore, to refine the non-invasive estimation of HVPG, we searched for blood biomarkers
specific for portal hypertension independent of liver fibrosis.
Methods
Patients and study design
This prospective study included 81 patients who underwent liver transplantation for liver cirrhosis of
various aetiology between October 2016 and July 2018 at our Transplant centre and before liver
transplantation had participated in the first part of the clinical study on non-invasive predictors of
portal hypertension (Frankova 2021). Briefly, 109 liver transplant candidates with liver cirrhosis of
various aetiology were included in the clinical study and completed the first part of the study
protocol which included liver stiffness measurement, direct HVPG measurement by liver vein
catheterisation and blood sampling for biomarkers assessment. All the study participants were
evaluated as liver transplant candidates according to the standard criteria (European Association for
the Study of the Liver. Electronic address 2016) and 92 of them were enrolled into the waiting list.

Eighty-three of them underwent liver transplantation and in 81 of them the explanted liver was
available for the assessment of the collagen content. The aim of the second part of the study was in
detail described in the previous section. Patients with portal vein thrombosis, transjugular
intrahepatic portosystemic shunt (TIPS), hepatorenal syndrome requiring vasoactive drugs
administration or renal replacement therapy, severe bacterial infection or sepsis, pulmonary
hypertension, variceal bleeding in the last 4 weeks, hepatocellular carcinoma outside of the Milan
criteria (Mazzaferro 1996) and ongoing alcohol abuse were not considered for the participation in
the study and none of them was included. The study was approved by local Institutional Review
Board (IRB of Institute for Clinical and Experimental Medicine and Thomayer's Hospital, Prague). All
patients signed the informed consent with the participation in study and the explanted liver
assessment.
Blood sampling
The study subjects were in a sitting position for at least 5 min (but not >10 min.) before and during
sampling. Venous blood was taken between 8 and 10 a.m. The Vacuette system (VACUETTE® TUBE 8
mL Z Serum Separator Clot Activator cat. No. 455071, and VACUETTE® 9 ml K3 EDTA Plasma
Separator cat. No. 455036, both from Greiner Bio-One, Kremsmünster, Austria) was used together
with 21-gauge needles (Greiner Bio-One). Separation of blood corpuscles was done within 60 min
after sampling at 3000 g for 10 min (centrifuge Beckman Allegra, Beckman Coulter, Indianapolis, IN).
Several serum and plasma aliquots of 500 μL were prepared within 60 min after centrifugation.
CryoKing tubes from Biologix Group Limited, Jinan, China, cat. No. 89–3101, were used to store
serum and plasma aliquots at −80°C until analysis.
Analytical methods
Serum concentrations of hyaluronic acid (HA), Amino-Terminal Propeptide of Type III Procollagen
(PIIINP), and Tissue Inhibitor of Matrix Metalloproteinase 1 (TIMP-1) were measured by the ADVIA
Centaur® HA assay, lot 25,215,019, the ADVIA Centaur® PIIINP assay, lot 26,290,023, and the ADVIA
Centaur® TIMP-1 assay, lot 28,900,016, respectively (Siemens Healthineers, Erlangen, Germany).
ADVIA Centaur ELF calibrator was used for calibration of HA, PIIINP, and TIMP-1 assays and ADVIA
Centaur ELF quality control materials (three levels) were used as assay controls. Repeatability
(within-run CV) assessed as declared by the manufacturer was < 5.6, < 4.2, and < 3.3% for HA, PIIINP
and TIMP-1, respectively. Intermediate precisions (between-run CVs) were < 3.2, < 5.1, and < 5.5%.
The respective measurement ranges for HA, PIIINP, and TIMP-1 were 1.6–1000, 0.5–150, and 3.5–
1300 ng/ml. Traceability was not provided by the manufacturer. Limits of detection of HA, PIIINP, and
TIMP-1 were 1.6, 0.5 and 3.5 ng/ml. All measurements were performed in one run during one day by
the same laboratory technician using a Centaur CP immunochemistry analyzer (Siemens
Healthineers). The Enhanced Liver Fibrosis (ELF) was calculated according to the Centaur CP formula:
0.846 x ln (HA) + 0.735 x ln (PIIINP) + 0.391 x ln (TIMP-1) + 2.494.
Interleukin-6 (IL-6), Vascular Cell Adhesion Molecule 1 (VCAM-1), Interleukin-1 Receptor Antagonist
(IL-1ra/IL-1F3), Osteopontin and Tumour Necrosis Factor alpha (TNFα) were assessed in plasma
samples obtained from the study subjects according to the manufacturer's instructions using the
assays No. HS600B, DVC00, DRA00B, DOST00, and HSTA00E, respectively, all purchased from R&D
Systems, Minneapolis, MN. The absorbance was measured on a Synergy™ 2 Multi-Detection
Microplate Reader (BioTek Instruments, Winooski, VT).
HVPG measurement

The radiologist performing HVPG measurements was blinded to elastography results. HVPG was
determined by catheterization of the hepatic veins. An open-end zero-side holes 5F multipurpose
angiographic catheter (Cordis, Santa Clara, CA) was inserted through a 6F sheath (Super Arrow-Flex
Percutaneous Sheath Introducer Set, Arrow International brand of Teleflex, Wayne, PA) using the
transjugular route. Iodinated radiological contrast medium was injected into the right or middle
hepatic vein to confirm the position of the catheter in a wedged position by flouroscopy. The
pressure was measured five times to demonstrate reproducibility and the mean value was used for
further calculations. HVPG was calculated as the difference between wedged and free hepatic
venous pressures.
Liver stiffness (LS) measurement
After an overnight fasting, 2D-SWE was performed using the Aixplorer® ultrasound system
(Supersonic Imagine S.A., Aix-en-Provence, France) with an abdominal 3.5 MHz curved array probe
(SC6-1). The examinations were performed ± 7 days HVPG measurement. The operator was not
aware of HVPG results when performing 2D-SWE. All patients were in the supine position and the
right arm maximally abducted and LS measurements were performed on the right lobe of the liver
through the intercostal spaces. RT-SWE were acquired using a 3.5 x 2.5 cm box, more than 2 cm
under the liver capsule and avoiding large vessels. During the examination the patient was requested
to hold breath as needed. After obtaining a stable and homogenous elastographic image inside the
box, a region of interest (ROI) was selected using the Q-box tool and placed in the most
homogeneous area and the median values of LS within the ROI was displayed and registered. The
diameter of the Q-box was set > 15 mm. Three elastographic images from different liver areas were
obtained in all patients and the mean value was used for further calculations.
Non-invasive predictors of portal hypertension
The MELD score (Model for End-Stage Liver Disease) is a composite predictor of survival in patients
with cirrhosis calculated from total serum bilirubin, serum creatinine and the international
normalized ratio (INR). MELD score was originally invented to predict short-term survival in cirrhotic
patients (Kamath 2007). Later studies showed that MELD score correlates with MR elastography
results, presence of varices and mortality in patients with variceal bleeding (Conejo 2018, Hoffman
2020) and is currently used to prioritize liver transplantation (Kamath 2007, Wiesner 2003, Wiesner
2001).
LSPS (Liver Spleen Platelets Score) is also a composite predictor combining LS, platelets count and
spleen diameter (Berzigotti 2013). LSPS was calculated as described previously: [LS (in kiloPascals) x
spleen diameter (in centimetres)]/platelet count ratio (x109/L). LSPS was superior to LS alone for
identification of patients with CSPH in a study by Berzigotti (Berzigotti 2013).
VCAM-1 is an inflammatory biomarker correlating most significantly with HVPG in the study (Buck
2014). Osteopontin, acting as a key component of bone matrix and multifunctional cytokine, also
correlated well with HVPG in humans (Bruha 2016).
The ELF score was shown to correlate with the stage of liver fibrosis in liver diseases of various
aetiologies (Miele 2017, Parkes 2011, Parkes 2010). Therefore, we decided to evaluate ELF score and
its individual components as potential marker(s) of portal hypertension.
Collagen proportionate area (CPA) evaluation
Four tissue blocks measuring 15 x 15 x 2 mm were prepared from each liver explant and routinely
processed for histological evaluation. Two 4 µm-thick sections histochemically stained by Picro-Sirius
Red (PSR) technique to visualize collagen were prepared from each paraffin block. Analysis of collagen
proportionate area (CPA) was performed by histomorphometry using a 3DHistech Pannoramic Desk II
DW digital slide scanner (3DHistech Kft., Budapest, Hungary) and Nikon NIS-Elements AR 3.2
morphometric program (Nikon, Tokyo, Japan). Whole sections were scanned with 60x objective in
transmitted light. Total tissue area was determined by thresholding in intensity mode. Subsequently,
PSR-stained areas occupied by collagen were separated using Red, Green, and Blue (RGB) thresholding.
The CPA percentage was expressed as the proportion of the collagen areas highlighted by PSR to the
total tissue section surface.
Hydroxyproline to total Amino Acids ratio (HP/AA)
Colorimetric hydroxyproline assay detecting 3-hydroxy, 4-hydroxy and 5-hydroxyproline species was
performed as described (Lunova 2014). Briefly, approximately 1 g of liver tissue sample was
deparaffinized and mechanically homogenized to powder. Fifty mg of liver powder was then
hydrolyzed in 6 N HCL at 110°C for 18 hours, filtered to remove the debris and 50 µl of each sample
was evaporated by speed vacuum centrifugation. The pellets or standards (trans-4-hydroxy-L-proline,
Sigma) were dissolved in 50 μl of distilled water, mixed with 56 mM chloramine – T trihydrate (Sigma,
Saint Louis, MO) in acetate - citrate buffer (pH = 6.5) and incubated for 25 min at room temperature.
After that, Ehrlich solution (Sigma) was added to form the desired chromophore at 65°C during 30 min
incubation. Absorbance was measured at 570 nm by using the Synergy™ 2 Multi-Detection Microplate
Reader (BioTek Instruments, Winooski, VT).
To determine total amino acids in liver samples, Ninhydrin reaction was used in pursuance of the
manufacturer's recommendations. 50 µl aliquots of the filtered hydrolyzed liver samples (see
hydroxyproline assay) were dried by vacuum centrifugation and then dissolved in distilled water. The
samples or 40–1400 nM of amino acids (AA-S-18, Sigma) were mixed with Ninhydrin reagent solution
(Sigma) in ratio 2:1, respectively, and incubated 10 min at 100°C. Then the samples and standards were
brought to room temperature and further mixed with 95% ethanol (Sigma) in ratio 3:5, respectively.
After that, absorbance was measured at 570 nm using the Synergy™ 2 Multi-Detection Microplate
Reader (BioTek).
Statistical analysis
Statistical analyses were performed using the SigmaPlot 11.0 (Systat Software Inc., San Jose, CA) or
JMP 11.0.0 software (2013, SAS Institute Inc.). Clinical characteristics were analysed in a descriptive
way and reported as mean ± standard deviation, or median and range, as appropriate. Where
assumptions of normal distributions were not met, Shapiro-Wilk test was used to evaluate the
normal distribution of data. Spearman's test was used for correlations among continuous variables.
Medians were compared using t-test or Mann-Whitney test, as appropriate. Similarly, multiple
comparisons were done by one way ANOVA or Kruskal-Wallis test. Statistical significance was defined
as p value < 0.05 for all calculations.
Results
Patient characteristics
Eighty-one consecutive patients were prospectively enrolled in the study. All patients had advanced
liver cirrhosis of various aetiologies and were potential candidates for liver transplantation. All
enrolled patients underwent blood draw for biomarkers, LS and HVPG measurement, both
examinations were included in the pre-transplant screening protocol. All 81 patients underwent
thereafter liver transplantation and CPA and HP/AA were assessed in the explanted liver. The median
period between study recruitment and liver transplantation was 105 days (range 10–769 days). All
patients received the graft from the heart-beating donors after brain death, age of the donors ranged
from 21 to 81 years. None of the organ donors was from a vulnerable population and none of the
donors was registered in the National Registry of people opposed to the post-mortem withdrawal of
tissues and organs. The aetiology of liver cirrhosis is shown in the Table 1. The patients were divided
into two subgroups according to the Child-Pugh classification of liver dysfunction: patients classified
as Child-Pugh A (18/81, 22.2%) and patients with Child-Pugh class B and C (63/81, 77.8%). The
measured HVPG values were from 6 to 31 mm Hg. Only 7 (8.6%) patients had HVPG lower than 10
mm Hg; the overwhelming majority 74 (91.4%) had CSPH, i.e. HVPG ≥ 10 mm Hg. There were 34 of 81
patients treated with carvedilol (non-selective β-blocker), all 34 patients had a low daily dose of 6.25
mg (3.125 mg twice daily). Only 3 patients were given atorvastatin at a daily dose of 20 mg, none of
the 3 patients on atorvastatin received carvedilol concomitantly. The detailed characteristics of the
patients are presented in Tables 1 and 2.
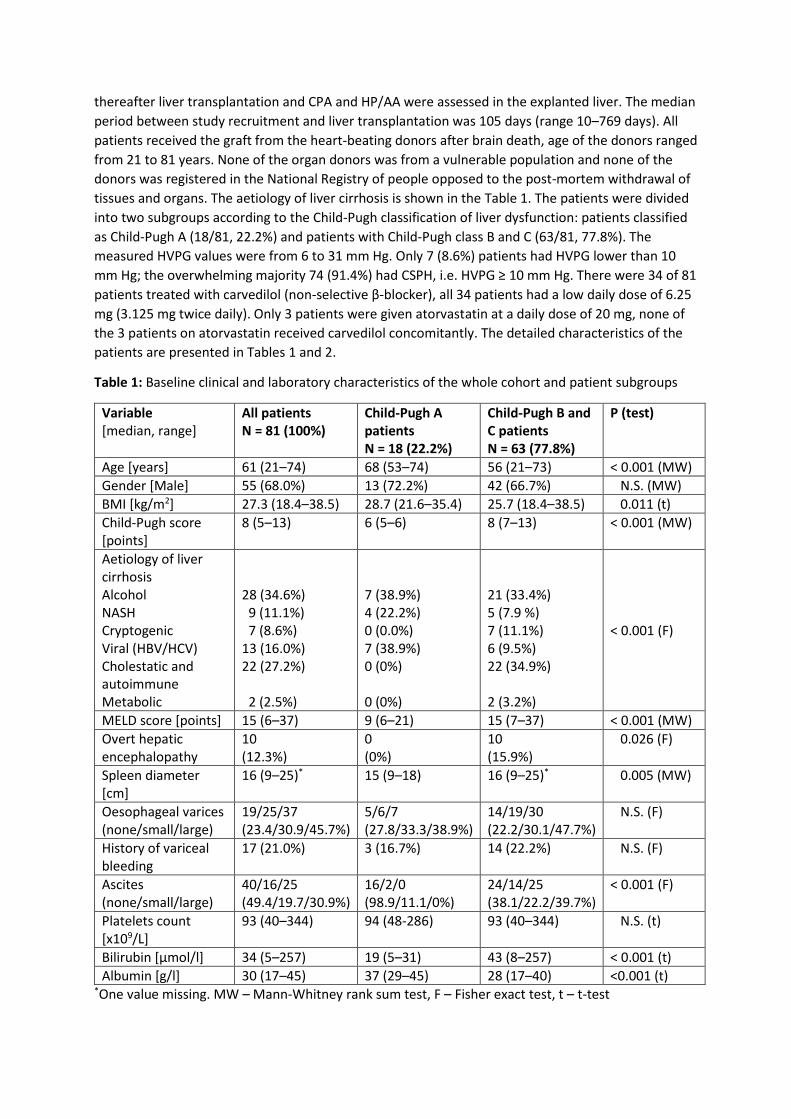
Table 1: Baseline clinical and laboratory characteristics of the whole cohort and patient subgroups
Variable [median, range]
All patients N = 81 (100%)
Child-Pugh A patients N = 18 (22.2%)
Child-Pugh B and C patients N = 63 (77.8%)
P (test)
Age [years] 61 (21–74) 68 (53–74) 56 (21–73) < 0.001 (MW)
Gender [Male] 55 (68.0%) 13 (72.2%) 42 (66.7%) N.S. (MW)
BMI [kg/m2] 27.3 (18.4–38.5) 28.7 (21.6–35.4) 25.7 (18.4–38.5) 0.011 (t)
Child-Pugh score [points]
8 (5–13) 6 (5–6) 8 (7–13) < 0.001 (MW)
Aetiology of liver cirrhosis Alcohol NASH Cryptogenic Viral (HBV/HCV) Cholestatic and autoimmune Metabolic
28 (34.6%) 9 (11.1%) 7 (8.6%) 13 (16.0%) 22 (27.2%) 2 (2.5%)
7 (38.9%) 4 (22.2%) 0 (0.0%) 7 (38.9%) 0 (0%) 0 (0%)
21 (33.4%) 5 (7.9 %) 7 (11.1%) 6 (9.5%) 22 (34.9%) 2 (3.2%)
< 0.001 (F)
MELD score [points] 15 (6–37) 9 (6–21) 15 (7–37) < 0.001 (MW)
Overt hepatic encephalopathy
10 (12.3%)
0 (0%)
10 (15.9%)
0.026 (F)
Spleen diameter [cm]
16 (9–25)* 15 (9–18) 16 (9–25)* 0.005 (MW)
Oesophageal varices (none/small/large)
19/25/37 (23.4/30.9/45.7%)
5/6/7 (27.8/33.3/38.9%)
14/19/30 (22.2/30.1/47.7%)
N.S. (F)
History of variceal bleeding
17 (21.0%) 3 (16.7%) 14 (22.2%) N.S. (F)
Ascites (none/small/large)
40/16/25 (49.4/19.7/30.9%)
16/2/0 (98.9/11.1/0%)
24/14/25 (38.1/22.2/39.7%)
< 0.001 (F)
Platelets count [x109/L]
93 (40–344) 94 (48-286) 93 (40–344) N.S. (t)
Bilirubin [μmol/l] 34 (5–257) 19 (5–31) 43 (8–257) < 0.001 (t)
Albumin [g/l] 30 (17–45) 37 (29–45) 28 (17–40) <0.001 (t) *One value missing. MW – Mann-Whitney rank sum test, F – Fisher exact test, t – t-test

Table 2: Liver stiffness, HVPG, blood predictors of HVPG and fibrosis, and liver collagen content. All
comparisons between Child-Pugh A patients and Child-Pugh B and C patients were done by Mann
Whitney Rank Sum test.
Variable [median, range]
All patients N = 81 (100%)
Child-Pugh A patients N = 18 (22.2%)
Child-Pugh B and C patients N = 63 (77.8%)
P
Liver stiffness [kPa] 30.0 (11.7–56.6) 19.5 (13.3–39.8) 33.2 (11.7–56.6) <0.001
HVPG [mm Hg] 17 (6–31) 14 (8–20) 18 (6–31) <0.001
LSPS [points] 4.9 (0.6–27.9)* 3.2 (0.8–8.8) 5.5 (0.6–27.9)* 0.006
ELF score 12.6 (10.1–15.6) 11.8 (10.2–13.0) 12.7 (10.1–15.6) <0.001
Osteopontin [ng/ml] 150 (52–439)**
109 (64–169)
177 (52–439)**
<0.001
VCAM-1 [ng/ml] 2906 (579–10268)*
1833 (579–4509)
3378 (1134–10268)*
<0.001
TIMP-1[ng/ml] 475 (219–1834) 316 (219–514) 528 (226–1834) <0.001
PIIINP [ng/ml] 21.8 (6.3–71.6) 18.0 (11.3–33.6) 25.5 (6.3–71.6) 0.01
Hyaluronic acid [ng/ml]
564 (43–6872)
350 (43–1269)
700 (57–6872)
0.013
Hydroxyproline/amino acids [ng/nmol]
0.77 (0.21–2.07)
0.53 (0.21–1.11)
0.89 (0.37–2.07)
<0.001
Collagen area [%] 23.4 (4.5–50.2) 18.4 (4.5–36.2) 24.4 (8.2–50.2) 0.028 *one sample missing, **two samples missing.
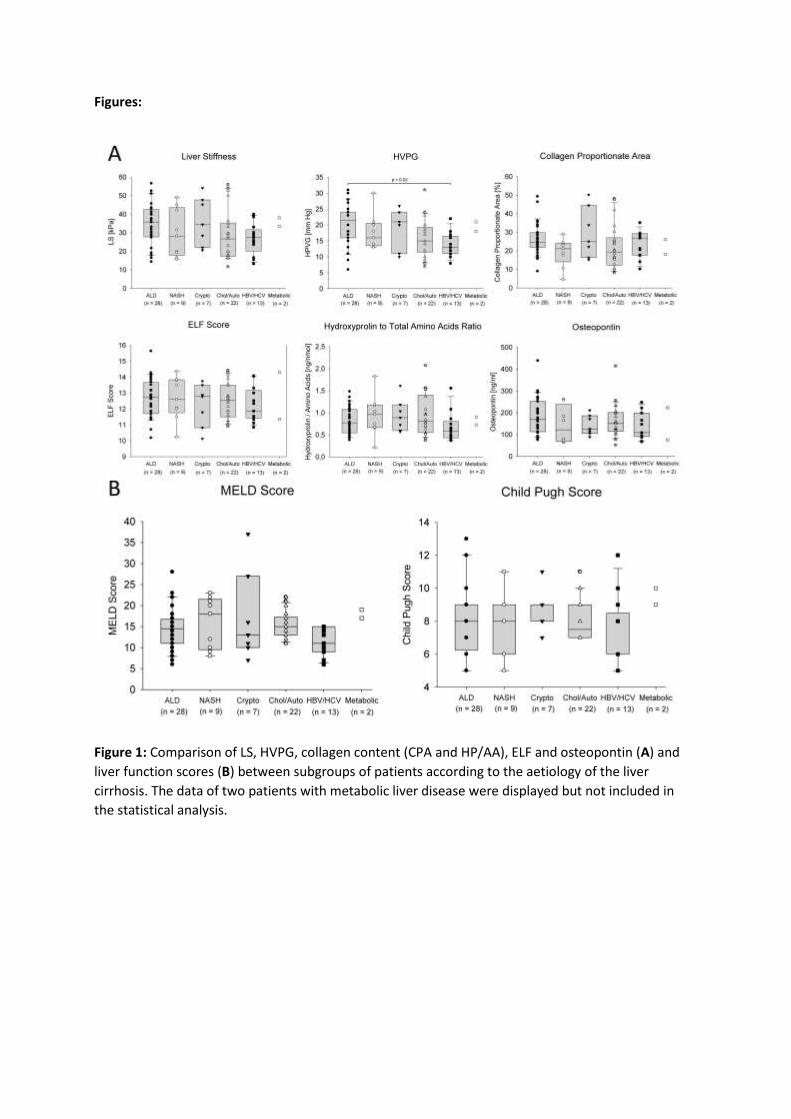
The variables were compared between the subgroups of patients according to the aetiology of liver
cirrhosis. There were no significant differences found between the subgroups in LS, CPA, HP/AA, ELF
score, osteopontin (Figure 1A), and MELD and Child-Pugh scores (Figure 1B). Only HVPG was
significantly higher in the subgroup of patients with alcoholic liver disease than in the subgroup of
patients with viral aetiology of liver cirrhosis (Figure 1A).
Correlations of HVPG and collagen content with their non-invasive markers
As the next step, correlations between LS, HVPG, liver collagen content (expressed as CPA or HP/AA)
and non-invasive blood biomarkers of liver fibrosis and portal hypertension were calculated. The
obtained Spearman's non-parametric correlation coefficients are presented in Table 3. The strongest
correlation with LS was achieved for HVPG, the correlations with CPA, HP/AA and osteopontin were
weaker. The regression lines for these correlations are displayed in Figure 2. It is evident that the
lines have a different slope and HVPG increases well with LS whereas CPA or HP/AA increases more
slowly. The correlation of LS with CPA or HP/AA was almost identical since both variables reflect liver
collagen content. Accordingly, CPA and HP/AA showed a good correlation between each other (r =
0.574; p < 0.001). Interestingly, HVPG, LS, LSPS, all associated with portal hypertension rather than
collagen content showed better correlation with CPA than with HP/AA. On the other hand, ELF score
and its components showed a better correlation with HP/AA than with CPA. Osteopontin showed a
good correlation with LS and HVPG but it did not correlate well with CPA and HP/AA. Therefore,
osteopontin represents the most specific blood biomarker of portal hypertension from the tested
set. Similarly, LSPS correlated well with LS and HVPG better than with CPA. Administration of the low
dose of carvedilol did not improve the correlation between LS and HVPG (r = 0.6050, CI 95% 0.3262–
0.7870, p = 0.0002 for subgroup on carvedilol; r = 0.7325, CI 95% 0.5580–0.8450, p < 0.0001 for
subgroup without carvedilol). The impact of statin administration could not be assessed because of
low number of treated patients.

Table 3: Correlation between HVPG, LS, collagen content (CPA or HP/AA) and their non-invasive markers.
Variable HVPG Liver stiffness CPA Hydroxyproline/Amino
Acids
Spearman's r p Spearman's r p Spearman's r p Spearman's r p
Liver stiffness [kPa] 0.719 < 0.001 N.A. N.A. 0.441 < 0.001 0.414 < 0.001
LSPS [points]* 0.419 < 0.001 0.481 < 0.001 0.303 0.006 0.126 N.S.
MELD score [points] 0.216 N.S. 0.413 < 0.001 0.073 N.S. 0.234 0.034
Spleen diameter [cm] 0.113 N.S. 0.059 N.S. 0.005 N.S. 0.047 N.S.
Platelets [x109/l] 0.008 N.S. 0.140 N.S. -0.181 N.S. 0.042 N.S.
Osteopontin [ng/ml]** 0.404 < 0.001 0.390 < 0.001 0.071 N.S. 0.188 N.S.
VCAM-1 [ng/ml]* 0.352 0.002 0.443 < 0.001 0.317 0.004 0.236 0.035
TIMP-1 [ng/ml] 0.346 0.002 0.471 < 0.001 0.235 0.004 0.340 0.002
ELF score [points] 0.271 0.015 0.337 0.002 0.347 0.002 0.470 < 0.001
HA [ng/ml] 0.203 N.S. 0.305 0.006 0.321 0.004 0.449 < 0.001
PIIINP [ng/ml] 0.183 N.S. 0.203 N.S. 0.252 0.023 0.407 < 0.001
HP/AA [ng/nmol] 0.327 0.003 0.414 < 0.001 0.574 < 0.001 N.A. N.A.
CPA [%] 0.324 0.003 0.441 < 0.001 N.A. N.A. 0.574 < 0.001 *one sample missing, **two samples missing, N.A. not applicable, N.S. not significant

Modelling of a composite predictive factor
LS, considered as a dependent variable, and HVPG, CPA, HP/AA together with other studied non-
invasive predictors considered as independent variables, were analysed by the multiple linear
regression (Table 4). The strongest association was found between LS and HVPG (p < 0.0001). A
weaker association was found between LS and CPA (p = 0.0188) and even weaker association was
found between LS and osteopontin (p = 0.0241). The stepwise modelling showed only a minimal
increase in r2 after addition of CPA to HVPG (0.5073 vs. 0.5513) and further addition of osteopontin
increased r2 only to 0.5795. The stepwise modelling showed that major contribution to the LS value
formation had HVPG and the contribution of CPA and osteopontin were minimal. The derived
formula expressing LS value formation is:
LS = –0.41 + (1,19 x HVPG) + (0,26 x CPA) + (0.03 x osteopontin),
or, after removal of osteopontin, impact of which on LS is low:
LS = 2.48 + (1.29 x HVPG) + (0.26 x CPA)
Table 4: Multiple linear regression analysis.
Stepwise multiple linear regression
Dependent variable LS
Independent variables p value
HVPG [mm Hg] < 0.0001
CPA [%] 0.0069
HP/Aminoacids [ng/nmol] 0.7795
ELF score [points] 0.8659
Hyaluronic acid [ng/ml] 0.9113
PIIINP [ng/ml] 0.4730
TIMP-1 [ng/ml] 0.3691
Osteopontin (ng/ml) 0.0278
VCAM-1 [ng/ml] 0.6735
Discussion
The data obtained in our cohort of patients with advanced liver cirrhosis and 93% proportion of
patients with CSPH strongly suggest that LS is determined predominantly by HVPG whereas
contribution of liver collagen content to LS is less variable and relatively low. This conclusion is
independently supported by four previously published studies with similar study design – HVPG
measurement by hepatic vein catheterization and CPA assessment. Three of the studies were
conducted on patients after liver transplantation for chronic HCV infection, the fourth study was
done on liver transplant candidates with liver cirrhosis of various aetiologies. The proportions of non-
cirrhotic and cirrhotic patients and the proportion of cirrhotic patients with and without CSPH were
different across the studies. The highest proportion of patients with CSPH was in our cohort which
included only cirrhotic patients. This allowed us to compare the relationship between CPA and HVPG
across the studies (Table 5). Based on this comparison we realized that correlation between CPA and
HVPG becomes weaker with increasing proportion of cirrhotic patients with CSPH in the study
cohort.

Table 5: Correlation of CPA with HVPG across the published studies
Publication Calvaruso
2009
Isgro
2013
Calvaruso
2012
Nilesen
2014
Current study
Patients population
HCV post LT HCV post LT HCV post LT Mixed
aetiology liver cirrhosis
Various aetiology of
liver cirrhosis
Liver tissue specimen aquisition
Transjugular biopsy
Transjugular biopsy
Transjugular biopsy
Explanted liver
Explanted liver
Patients total, N 250* 63 62 41 81
Patients with CSPH, N, (%)
21 (8%) 7 (18%) 13 (30%) 31 (76%) 74 (91%)
CPA vs. HVPG, Spearman's r, (p)
0.61 (p < 0.001)
0.41 (p = 0.01)
0.37 (p = 0.017)
0.537 (p < 0.001)
0.324 (p = 0.003)
*250 measurements in 115 patients
It is also apparent that correlation between CPA and HVPG in patients after liver transplantation was
generally weaker than in the non-transplanted subjects and decreased with the proportion of
patients with CSPH in the cohort. The same trend was evident from the comparison of the data
presented in (Nielsen 2014) with our study.
Another two studies focused on correlation between CPA and LS; the correlation was weaker in the
study with higher proportion of patients with cirrhosis. Buzzetti et al. (Buzzetti 2019) evaluated 76
non-cirrhotic patients with NASH and the Spearman's r was 0.73 whereas in the non-transplanted
HCV and HBV subgroups in the study by Calvaruso et al. (Calvaruso 2012), the Spearman's r was 0.59
and 0.61, respectively, and the proportion of patients with cirrhosis was 18 and 11%, respectively.
The Spearman's r in our cohort of patients with liver cirrhosis was 0.441. Our results thus comply
with the concept explaining worsening of portal hypertension by intrahepatic angiogenesis in
patients with advanced liver cirrhosis (Thabut and Shah 2010).
Our conclusion is further supported by the recent animal study indicating that formalin treated
porcine liver showed increased stiffness and portal hypertension in the ex vivo model (Yang 2017).
Treatment of the liver with formalin modelled the changes in the liver collagen structure leading to
the increase of portal pressure. Another animal study showed that in the perfused bovine liver start
both: new collagen fibres production and tissue and vessels remodelling (Yarpuzlu 2014).
In addition to CPA, we also assessed the HP/AA ratio as a collagen content marker in the explanted
liver as an alternative assuming that HP/AA assessment might be superior for evaluation of liver
collagen content. Accordingly, a recent MRI animal study showed good correlation of HP with the
extracellular space in the liver (Luetkens 2018). The HP/AA ratio showed the same correlation with
HVPG as CPA and somewhat weaker correlation with LS. Contrarily, multiple linear regression
identified only CPA to be the variable associated with LS. The fact that HP/AA correlated with the ELF
score better than CPA is not surprising because ELF score is a composite parameter calculated from
blood levels of three biomarkers associated with collagen turn-over. Based on these data, we
speculate that CPA reflects not only liver collagen content but also collagen density and remodelling
whereas the HP/AA is just an indicator of collagen content.
The design of our study allowed us to assess collagen content in substantially larger samples of the
tissue than might have been obtained by transjugular liver biopsy performed together with HVPG
measurement. On the other hand, this approach might have been associated with a methodological

bias owing to the time period between LS and HVPG measurement and collagen content assessment
in the explanted liver. However, in chronic liver diseases, the period between disease onset and
advanced liver cirrhosis development takes years or decades whereas the interval between LS and
HVPG measurement and LT took only a couple of weeks.
We conclude that our study brought new insight into pathophysiology and relevance of LS in patients
with advanced liver cirrhosis. Correct interpretation of the LS value is important for understanding
liver pathology and appropriate clinical decisions.
Conflict of interest
There is no conflict of interest.
Acknowledgement
The project was supported by Ministry of Health of the Czech Republic, grant No. 16-27546A. We express our gratitude to Lucie Budisova for her excellent technical assistance and Helena Pitelkova for the clinical coordination of the project.
Author Contributions:
JaS and JuS and MJ contributed to the study concept and design. SF, JaS, MJ and MJ wrote the draft. JaS, JuS, SF and MJ were involved in data interpretation. Statistical analyses were performed by VL, SF, ML and MJ. ML, MJ and MN carried out sample analyses. HG performed liver stiffness measurement. JK and EK performed HVPG measurement. SF, RS, were involved in patient enrolment and clinical data acquisition. ES evaluated CPA. All authors reviewed and approved the final version of the manuscript.
References
ABRALDES JG, VILLANUEVA C, BANARES R, ARACIL C, CATALINA MV, GARCI APJC, BOSCH J, SPANISH COOPERATIVE GROUP FOR PORTAL H, VARICEAL B: Hepatic venous pressure gradient and prognosis in patients with acute variceal bleeding treated with pharmacologic and endoscopic therapy. J Hepatol 48: 229-36, 2008.
BERZIGOTTI A, BOSCH J: Pharmacologic management of portal hypertension. Clin Liver Dis 18: 303-17, 2014.
BERZIGOTTI A, SEIJO S, ARENA U, ABRALDES JG, VIZZUTTI F, GARCIA-PAGAN JC, PINZANI M, BOSCH J: Elastography, spleen size, and platelet count identify portal hypertension in patients with compensated cirrhosis. Gastroenterology 144: 102-111 e1, 2013.
BOSCH J, ABRALDES JG, BERZIGOTTI A, GARCIA-PAGAN JC: The clinical use of HVPG measurements in chronic liver disease. Nat Rev Gastroenterol Hepatol 6: 573-82, 2009.
BRUHA R, JACHYMOVA M, PETRTYL J, DVORAK K, LENICEK M, URBANEK P, SVESTKA T, VITEK L: Osteopontin: A non-invasive parameter of portal hypertension and prognostic marker of cirrhosis. World J Gastroenterol 22: 3441-50, 2016.
BUCK M, GARCIA-TSAO G, GROSZMANN RJ, STALLING C, GRACE ND, BURROUGHS AK, PATCH D, MATLOFF DS, CLOPTON P, CHOJKIER M: Novel inflammatory biomarkers of portal pressure in compensated cirrhosis patients. Hepatology 59: 1052-9, 2014.

BUZZETTI E, HALL A, EKSTEDT M, MANUGUERRA R, GUERRERO MISAS M, COVELLI C, LEANDRO G, LUONG T, KECHAGIAS S, MANESIS EK, PINZANI M, DHILLON AP, TSOCHATZIS EA: Collagen proportionate area is an independent predictor of long-term outcome in patients with non-alcoholic fatty liver disease. Aliment Pharmacol Ther 49: 1214-1222, 2019.
CALVARUSO V, BURROUGHS AK, STANDISH R, MANOUSOU P, GRILLO F, LEANDRO G, MAIMONE S, PLEGUEZUELO M, XIROUCHAKIS I, GUERRINI GP, PATCH D, YU D, O'BEIRNE J, DHILLON AP: Computer-assisted image analysis of liver collagen: relationship to Ishak scoring and hepatic venous pressure gradient. Hepatology 49: 1236-44, 2009.
CALVARUSO V, DHILLON AP, TSOCHATZIS E, MANOUSOU P, GRILLO F, GERMANI G, PATCH D, O'BEIRNE J, BURROUGHS AK: Liver collagen proportionate area predicts decompensation in patients with recurrent hepatitis C virus cirrhosis after liver transplantation. J Gastroenterol Hepatol 27: 1227-32, 2012.
CASSINOTTO C, CHARRIE A, MOURIES A, LAPUYADE B, HIRIART JB, VERGNIOL J, GAYE D, HOCQUELET A, CHARBONNIER M, FOUCHER J, LAURENT F, CHERMAK F, MONTAUDON M, DE LEDINGHEN V: Liver and spleen elastography using supersonic shear imaging for the non-invasive diagnosis of cirrhosis severity and oesophageal varices. Dig Liver Dis 47: 695-701, 2015.
CONEJO I, GUARDASCIONE MA, TANDON P, CACHERO A, CASTELLOTE J, ABRALDES JG, AMITRANO L, GENESCA J, AUGUSTIN S: Multicenter External Validation of Risk Stratification Criteria for Patients With Variceal Bleeding. Clin Gastroenterol Hepatol 16: 132-139 e8, 2018.
ELKRIEF L, RAUTOU PE, RONOT M, LAMBERT S, DIOGUARDI BURGIO M, FRANCOZ C, PLESSIER A, DURAND F, VALLA D, LEBREC D, VILGRAIN V, CASTERA L: Prospective comparison of spleen and liver stiffness by using shear-wave and transient elastography for detection of portal hypertension in cirrhosis. Radiology 275: 589-98, 2015.
EUROPEAN ASSOCIATION FOR THE STUDY OF THE LIVER. ELECTRONIC ADDRESS EEE: EASL Clinical Practice Guidelines: Liver transplantation. J Hepatol 64: 433-485, 2016.
FRANKOVA S, LUNOVA M, GOTTFRIEDOVA H, SENKERIKOVA R, NEROLDOVA M, KOVAC J, KIESLICHOVA E, LANSKA V, URBANEK P, SPICAK J, JIRSA M, SPERL J: Liver stiffness measured by two-dimensional shear-wave elastography predicts hepatic vein pressure gradient at high values in liver transplant candidates with advanced liver cirrhosis. PLoS One 16: e0244934, 2021.
FRIEDRICH-RUST M, ONG MF, MARTENS S, SARRAZIN C, BOJUNGA J, ZEUZEM S, HERRMANN E: Performance of transient elastography for the staging of liver fibrosis: a meta-analysis. Gastroenterology 134: 960-74, 2008.
GARCIA-TSAO G, GROSZMANN RJ, FISHER RL, CONN HO, ATTERBURY CE, GLICKMAN M: Portal pressure, presence of gastroesophageal varices and variceal bleeding. Hepatology 5: 419-24, 1985.
GROSZMANN RJ, GARCIA-TSAO G, BOSCH J, GRACE ND, BURROUGHS AK, PLANAS R, ESCORSELL A, GARCIA-PAGAN JC, PATCH D, MATLOFF DS, GAO H, MAKUCH R, PORTAL HYPERTENSION COLLABORATIVE G: Beta-blockers to prevent gastroesophageal varices in patients with cirrhosis. N Engl J Med 353: 2254-61, 2005.
HOFFMAN DH, AYOOLA A, NICKEL D, HAN F, CHANDARANA H, BABB J, SHANBHOGUE KP: MR elastography, T1 and T2 relaxometry of liver: role in noninvasive assessment of liver function and portal hypertension. Abdom Radiol (NY) 45: 2680-2687, 2020.
ISGRO G, CALVARUSO V, ANDREANA L, LUONG TV, GARCOVICH M, MANOUSOU P, ALIBRANDI A, MAIMONE S, MARELLI L, DAVIES N, PATCH D, DHILLON AP, BURROUGHS AK: The relationship between transient elastography and histological collagen proportionate area for assessing fibrosis in chronic viral hepatitis. J Gastroenterol 48: 921-9, 2013.
KAMATH PS, KIM WR, ADVANCED LIVER DISEASE STUDY G: The model for end-stage liver disease (MELD). Hepatology 45: 797-805, 2007.
KENNEDY P, WAGNER M, CASTERA L, HONG CW, JOHNSON CL, SIRLIN CB, TAOULI B: Quantitative Elastography Methods in Liver Disease: Current Evidence and Future Directions. Radiology 286: 738-763, 2018.

LEBREC D, DE FLEURY P, RUEFF B, NAHUM H, BENHAMOU JP: Portal hypertension, size of esophageal varices, and risk of gastrointestinal bleeding in alcoholic cirrhosis. Gastroenterology 79: 1139-44, 1980.
LI Y, HUANG YS, WANG ZZ, YANG ZR, SUN F, ZHAN SY, LIU XE, ZHUANG H: Systematic review with meta-analysis: the diagnostic accuracy of transient elastography for the staging of liver fibrosis in patients with chronic hepatitis B. Aliment Pharmacol Ther 43: 458-69, 2016.
LUETKENS JA, KLEIN S, TRABER F, SCHMEEL FC, SPRINKART AM, KUETTING DLR, BLOCK W, USCHNER FE, SCHIERWAGEN R, HITTATIYA K, KRISTIANSEN G, GIESEKE J, SCHILD HH, TREBICKA J, KUKUK GM: Quantification of Liver Fibrosis at T1 and T2 Mapping with Extracellular Volume Fraction MRI: Preclinical Results. Radiology 288: 748-754, 2018.
LUNOVA M, GOEHRING C, KUSCUOGLU D, MUELLER K, CHEN Y, WALTHER P, DESCHEMIN JC, VAULONT S, HAYBAECK J, LACKNER C, TRAUTWEIN C, STRNAD P: Hepcidin knockout mice fed with iron-rich diet develop chronic liver injury and liver fibrosis due to lysosomal iron overload. J Hepatol 61: 633-41, 2014.
MAZZAFERRO V, REGALIA E, DOCI R, ANDREOLA S, PULVIRENTI A, BOZZETTI F, MONTALTO F, AMMATUNA M, MORABITO A, GENNARI L: Liver transplantation for the treatment of small hepatocellular carcinomas in patients with cirrhosis. N Engl J Med 334: 693-9, 1996.
MCCONNELL M, IWAKIRI Y: Biology of portal hypertension. Hepatol Int 12: 11-23, 2018. MIELE L, DE MICHELE T, MARRONE G, ANTONIETTA ISGRO M, BASILE U, CEFALO C, BIOLATO M,
MARIA VECCHIO F, LODOVICO RAPACCINI G, GASBARRINI A, ZUPPI C, GRIECO A: Enhanced liver fibrosis test as a reliable tool for assessing fibrosis in nonalcoholic fatty liver disease in a clinical setting. Int J Biol Markers 32: e397-e402, 2017.
MORISHITA N, HIRAMATSU N, OZE T, HARADA N, YAMADA R, MIYAZAKI M, YAKUSHIJIN T, MIYAGI T, YOSHIDA Y, TATSUMI T, KANTO T, TAKEHARA T: Liver stiffness measurement by acoustic radiation force impulse is useful in predicting the presence of esophageal varices or high-risk esophageal varices among patients with HCV-related cirrhosis. J Gastroenterol 49: 1175-82, 2014.
NIELSEN K, CLEMMESEN JO, VASSILIADIS E, VAINER B: Liver collagen in cirrhosis correlates with portal hypertension and liver dysfunction. APMIS 122: 1213-22, 2014.
PARKES J, GUHA IN, RODERICK P, HARRIS S, CROSS R, MANOS MM, IRVING W, ZAITOUN A, WHEATLEY M, RYDER S, ROSENBERG W: Enhanced Liver Fibrosis (ELF) test accurately identifies liver fibrosis in patients with chronic hepatitis C. J Viral Hepat 18: 23-31, 2011.
PARKES J, RODERICK P, HARRIS S, DAY C, MUTIMER D, COLLIER J, LOMBARD M, ALEXANDER G, RAMAGE J, DUSHEIKO G, WHEATLEY M, GOUGH C, BURT A, ROSENBERG W: Enhanced liver fibrosis test can predict clinical outcomes in patients with chronic liver disease. Gut 59: 1245-51, 2010.
PROCOPET B, BERZIGOTTI A, ABRALDES JG, TURON F, HERNANDEZ-GEA V, GARCIA-PAGAN JC, BOSCH J: Real-time shear-wave elastography: applicability, reliability and accuracy for clinically significant portal hypertension. J Hepatol 62: 1068-75, 2015.
RIPOLL C, GROSZMANN R, GARCIA-TSAO G, GRACE N, BURROUGHS A, PLANAS R, ESCORSELL A, GARCIA-PAGAN JC, MAKUCH R, PATCH D, MATLOFF DS, BOSCH J, PORTAL HYPERTENSION COLLABORATIVE G: Hepatic venous pressure gradient predicts clinical decompensation in patients with compensated cirrhosis. Gastroenterology 133: 481-8, 2007.
SANDRIN L, FOURQUET B, HASQUENOPH JM, YON S, FOURNIER C, MAL F, CHRISTIDIS C, ZIOL M, POULET B, KAZEMI F, BEAUGRAND M, PALAU R: Transient elastography: a new noninvasive method for assessment of hepatic fibrosis. Ultrasound Med Biol 29: 1705-13, 2003.
SHAHEEN AA, WAN AF, MYERS RP: FibroTest and FibroScan for the prediction of hepatitis C-related fibrosis: a systematic review of diagnostic test accuracy. Am J Gastroenterol 102: 2589-600, 2007.
SHI KQ, FAN YC, PAN ZZ, LIN XF, LIU WY, CHEN YP, ZHENG MH: Transient elastography: a meta-analysis of diagnostic accuracy in evaluation of portal hypertension in chronic liver disease. Liver Int 33: 62-71, 2013.

SILVA-JUNIOR G, BAIGES A, TURON F, TORRES F, HERNANDEZ-GEA V, BOSCH J, GARCIA-PAGAN JC: The prognostic value of hepatic venous pressure gradient in patients with cirrhosis is highly dependent on the accuracy of the technique. Hepatology 62: 1584-92, 2015.
SIMBRUNNER B, MARCULESCU R, SCHEINER B, SCHWABL P, BUCSICS T, STADLMANN A, BAUER DJM, PATERNOSTRO R, EIGENBAUER E, PINTER M, STATTERMAYER AF, TRAUNER M, MANDORFER M, REIBERGER T: Non-invasive detection of portal hypertension by enhanced liver fibrosis score in patients with different aetiologies of advanced chronic liver disease. Liver Int 40: 1713-1724, 2020.
SINGH S, VENKATESH SK, LOOMBA R, WANG Z, SIRLIN C, CHEN J, YIN M, MILLER FH, LOW RN, HASSANEIN T, GODFREY EM, ASBACH P, MURAD MH, LOMAS DJ, TALWALKAR JA, EHMAN RL: Magnetic resonance elastography for staging liver fibrosis in non-alcoholic fatty liver disease: a diagnostic accuracy systematic review and individual participant data pooled analysis. Eur Radiol 26: 1431-40, 2016.
SINGH S, VENKATESH SK, WANG Z, MILLER FH, MOTOSUGI U, LOW RN, HASSANEIN T, ASBACH P, GODFREY EM, YIN M, CHEN J, KEAVENY AP, BRIDGES M, BOHTE A, MURAD MH, LOMAS DJ, TALWALKAR JA, EHMAN RL: Diagnostic performance of magnetic resonance elastography in staging liver fibrosis: a systematic review and meta-analysis of individual participant data. Clin Gastroenterol Hepatol 13: 440-451 e6, 2015.
STEBBING J, FAROUK L, PANOS G, ANDERSON M, JIAO LR, MANDALIA S, BOWER M, GAZZARD B, NELSON M: A meta-analysis of transient elastography for the detection of hepatic fibrosis. J Clin Gastroenterol 44: 214-9, 2010.
STEFANESCU H, RUSU C, LUPSOR-PLATON M, NICOARA FARCAU O, FISCHER P, GRIGORAS C, HORHAT A, STANCU O, ARDELEAN A, TANTAU M, BADEA R, PROCOPET B: Liver Stiffness Assessed by Ultrasound Shear Wave Elastography from General Electric Accurately Predicts Clinically Significant Portal Hypertension in Patients with Advanced Chronic Liver Disease. Ultraschall Med 2019.
TALWALKAR JA, KURTZ DM, SCHOENLEBER SJ, WEST CP, MONTORI VM: Ultrasound-based transient elastography for the detection of hepatic fibrosis: systematic review and meta-analysis. Clin Gastroenterol Hepatol 5: 1214-20, 2007.
THABUT D, SHAH V: Intrahepatic angiogenesis and sinusoidal remodeling in chronic liver disease: new targets for the treatment of portal hypertension? J Hepatol 53: 976-80, 2010.
THIELE M, HUGGER MB, KIM Y, RAUTOU PE, ELKRIEF L, JANSEN C, VERLINDEN W, ALLEGRETTI G, ISRAELSEN M, STEFANESCU H, PISCAGLIA F, GARCIA-PAGAN JC, FRANQUE S, BERZIGOTTI A, CASTERA L, JEONG WK, TREBICKA J, KRAG A: 2D shear wave liver elastography by Aixplorer to detect portal hypertension in cirrhosis: An individual patient data meta-analysis. Liver Int 40: 1435-1446, 2020.
TSOCHATZIS EA, GURUSAMY KS, NTAOULA S, CHOLONGITAS E, DAVIDSON BR, BURROUGHS AK: Elastography for the diagnosis of severity of fibrosis in chronic liver disease: a meta-analysis of diagnostic accuracy. J Hepatol 54: 650-9, 2011.
WIESNER R, EDWARDS E, FREEMAN R, HARPER A, KIM R, KAMATH P, KREMERS W, LAKE J, HOWARD T, MERION RM, WOLFE RA, KROM R, UNITED NETWORK FOR ORGAN SHARING LIVER DISEASE SEVERITY SCORE C: Model for end-stage liver disease (MELD) and allocation of donor livers. Gastroenterology 124: 91-6, 2003.
WIESNER RH, MCDIARMID SV, KAMATH PS, EDWARDS EB, MALINCHOC M, KREMERS WK, KROM RA, KIM WR: MELD and PELD: application of survival models to liver allocation. Liver Transpl 7: 567-80, 2001.
YANG C, YIN M, GLASER KJ, ZHU X, XU K, EHMAN RL, CHEN J: Static and dynamic liver stiffness: An ex vivo porcine liver study using MR elastography. Magn Reson Imaging 44: 92-95, 2017.
YARPUZLU B, AYYILDIZ M, TOK OE, AKTAS RG, BASDOGAN C: Correlation between the mechanical and histological properties of liver tissue. J Mech Behav Biomed Mater 29: 403-16, 2014.
YIN M, KOLIPAKA A, WOODRUM DA, GLASER KJ, ROMANO AJ, MANDUCA A, TALWALKAR JA, ARAOZ PA, MCGEE KP, ANAVEKAR NS, EHMAN RL: Hepatic and splenic stiffness augmentation assessed

with MR elastography in an in vivo porcine portal hypertension model. J Magn Reson Imaging 38: 809-15, 2013.
YOU MW, KIM KW, PYO J, HUH J, KIM HJ, LEE SJ, PARK SH: A Meta-analysis for the Diagnostic Performance of Transient Elastography for Clinically Significant Portal Hypertension. Ultrasound Med Biol 43: 59-68, 2017.
Figures:
Figure 1: Comparison of LS, HVPG, collagen content (CPA and HP/AA), ELF and osteopontin (A) and
liver function scores (B) between subgroups of patients according to the aetiology of the liver
cirrhosis. The data of two patients with metabolic liver disease were displayed but not included in
the statistical analysis.

Figure 2: Regression lines representing relation between LS and CPA (A), HVPG (B), HP/ AA (C) and
osteopontin (D).