portfolio budget statements 2010-11 budget … · portfolio budget statements 2010-11. budget...
TRANSCRIPT

PORTFOLIO BUDGET STATEMENTS 2010-11 BUDGET RELATED PAPER NO. 1.17 RESOURCES, ENERGY AND TOURISM PORTFOLIO
BUDGET INITIATIVES AND EXPLANATIONS APPROPRIATIONS SPECIFIED BY OUTCOMES AND PROGRAMS BY AGENCY

© Commonwealth of Australia 2010
ISBN 978-1-921516-72-6
This work is copyright. Apart from any use as permitted under the Copyright Act 1968, no part may be reproduced by any process without prior written permission from the Commonwealth. Requests and inquiries concerning reproduction and rights should be addressed to the:
Commonwealth Copyright Administration Attorney-General’s Department 3-5 National Circuit Canberra ACT 2600
Website: www.ag.gov.au/cca
Printed by Canprint Communications Pty Ltd
THE HON MARTIN FERGUSON AM MP
MINISTER FOR RESOURCES AND ENERGY
MINISTER FOR TOURISM
PARLIAMENT HOUSE
CANBERRA 2600
President of the Senate Australian Senate Parliament House CANBERRA ACT 2600 Speaker House of Representatives Parliament House CANBERRA ACT 2600
Dear Mr President Dear Mr Speaker
I hereby submit Portfolio Budget Statements in support of the 2010-11 Budget for the Resources, Energy and Tourism portfolio.
These statements have been developed, and are submitted to the Parliament, as a statement on the outcomes for the portfolio.
I present these statements to provide accountability to the Parliament and, through it, the public.
Yours sincerely
Martin Ferguson

Abbreviations and conventions
The following notation may be used:
- nil .. not zero, but rounded to zero na not applicable (unless otherwise specified) $m $ million
Figures in tables and in the text may be rounded. Figures in text are generally rounded to one decimal place, whereas figures in tables are generally rounded to the nearest thousand. Discrepancies in tables between totals and sums of components are due to rounding.
Enquiries
Should you have any enquiries regarding this publication please contact Enabling Services, Chief Financial Officer, Department of Resources, Energy and Tourism on (02) 6243 7020.
A copy of this document can be located on the Australian Government Budget website at: http://www.budget.gov.au, and at: http://www.ret.gov.au.
iv

v
USER GUIDE TO THE
PORTFOLIO BUDGET STATEMENTS

USER GUIDE
The purpose of the 2010-11 Portfolio Budget Statements (PB Statements) is to inform Senators and Members of Parliament of the proposed allocation of resources to Government outcomes by agencies within the portfolio. Agencies receive resources from the annual appropriations acts, special appropriations (including standing appropriations and special accounts), and revenue from other sources.
A key role of the PB Statements is to facilitate the understanding of proposed annual appropriations in Appropriation Bills No. 1 and No. 2 2010-11. In this sense the PB Statements are Budget related papers and are declared by the Appropriation Acts to be ‘relevant documents’ to the interpretation of the Acts according to section 15AB of the Acts Interpretation Act 1901.
The PB Statements provide information, explanation and justification to enable Parliament to understand the purpose of each outcome proposed in the Bills.
As required under section 12 of the Charter of Budget Honesty Act 1998, non-general government sector entities are not consolidated into the Commonwealth general government sector fiscal estimates and accordingly, these entities are not reported in the PB Statements.
vi

CONTENTS
Portfolio Overview ........................................................................................................ 1 Resources, Energy and Tourism Portfolio Overview ...................................................... 3
Agency Resources and Planned Performance .......................................................... 9 Department of Resources, Energy and Tourism...........................................................11
Geoscience Australia ....................................................................................................53 National Offshore Petroleum Safety Authority ..............................................................77
Tourism Australia ..........................................................................................................97
Australian Solar Institute .............................................................................................127
Glossary .....................................................................................................................145
vii


1
PORTFOLIO OVERVIEW


Portfolio Overview
RESOURCES, ENERGY AND TOURISM PORTFOLIO
OVERVIEW
MINISTER AND PORTFOLIO RESPONSIBILITIES
The Hon Martin Ferguson AM MP is the Minister for Resources and Energy and the Minister for Tourism. The Minister is responsible for improving the strength, competitiveness and sustainability of the resources, energy and tourism sectors. These sectors are key drivers of the Australian economy underpinning the competitiveness of regions, industries and business across the economy and are at the forefront of the economic and environmental challenges facing Australia.
The portfolio comprises:
The Department of Resources, Energy and Tourism (a Department of State under the Financial Management and Accountability Act 1997 (FMA Act)) ;
Geoscience Australia (a prescribed agency under the FMA Act);
The National Offshore Petroleum Safety Authority (a statutory agency established under the provisions of the Offshore Petroleum and Greenhouse Gas Storage Act 2006 and, for the purposes of governance arrangements, a prescribed agency under the FMA Act);
Tourism Australia (a statutory agency established under the Tourism Australia Act 2004 and subject to the provisions of the Commonwealth Authorities and Companies Act 1997 (CAC Act)); and
Australian Solar Institute (a wholly-owned Commonwealth company that forms part of the Clean Energy Initiative, and subject to the provisions of the CAC Act).
The Department of Resources, Energy and Tourism plays an important role in assisting the Australian Government to achieve its outcome of enhancing Australia’s economic prosperity, by providing high quality advice and programs to achieve improved productivity, competitiveness, security and sustainability of the resources, energy and tourism industries. The Department works closely with state and territory governments, international governments, and the private sector, including major corporations and business associations, to achieve this outcome.
3

Portfolio Overview
Geoscience Australia is custodian of the geographic and geological data and knowledge of the nation. Geoscience Australia provides first class geoscientific information and knowledge that enables the Australia Government and community to make informed decisions about the exploitation of resources, the management of the environment, the safety of critical infrastructure, and the resultant wellbeing of all Australians. Geoscience Australia also encompasses the Office of Spatial Data Management which coordinates the implementation of the Australian Government’s policy on spatial data access and pricing.
The National Offshore Petroleum Safety Authority (NOPSA) is responsible for the delivery of world class health and safety regulation for the Australian offshore petroleum industry. In addition, NOPSA is responsible for the promotion of the occupational health and safety of persons engaged in offshore petroleum operations in Australian Government and state and territory coastal waters. The primary objectives for NOPSA include: improving safety outcomes across the Australian offshore petroleum industry; ensuring health and safety regulation of the offshore petroleum industry is provided to standards that are equal to the best in the world; and reducing the regulatory burden on the offshore petroleum industry, which operates across multiple jurisdictions, by delivering a consistent and comprehensive health and safety regime.
Tourism Australia is a statutory authority whose three key objectives are to: facilitate tourism industry and market development through strategic insights; increase distribution of Australian tourism product and facilitation of niche events and regional tourism growth; and to facilitate consumer travel demand stimulation. To meet these objectives it promotes Australia as a travel destination internationally and domestically. Using a broad mix of consumer and trade marketing, in partnership with state and territory tourism organisations, industry and commercial partners, Tourism Australia aims to increase the economic benefits of tourism to Australia by building demand and increasing visitation and visitor spend to and throughout the country. Through its 13 offices Tourism Australia targets leisure, business events and working holiday travellers across 26 countries. Through its research and trade development activities Tourism Australia also aims to foster a sustainable and quality-focussed tourism industry in Australia.
The Australian Solar Institute Limited (ASI) was registered as a company limited by guarantee under the CAC Act on 10 August 2009. The ASI aims to drive collaborative, focused research and development that will have a major impact on the efficiency and cost-effectiveness of solar technologies. It will also disseminate the results and learning’s from solar research for the benefit of the Australian and global solar communities and the Australian public and will act as a catalyst and champion for Australia's leadership strengths in solar research and development.
4

Portfolio Overview
More comprehensive information on activities undertaken by the Resources, Energy and Tourism portfolio is available from the following web sites:
Department of Resources, Energy and Tourism http://www.ret.gov.au
Geoscience Australia http://www.ga.gov.au National Offshore Petroleum Safety Authority http://www.nopsa.gov.au Tourism Australia
http://www.tourism.australia.com
Australian Solar Institute http://www.australiansolarinstitute.com.au
5

Portfolio Overview
Figure 1: Resources, Energy and Tourism portfolio structure and outcomes
Department of Resources, Energy and TourismPortfolio Secretary
Mr Drew Clarke
Outcome 1: The improved strength, competitiveness and sustainability of the resources, energy and tourism industriesto enhance Australia's prosperity through implementation of
government policy and programs.
Portfolio MinisterMinister for Resources and Energy
Minister for TourismThe Hon Martin Ferguson AM MP
Tourism AustraliaManaging Director
Mr Andrew McEvoy
Outcome 1: Increase demand for Australia as a destination, strengthen the travel distribution system, and contribute
to the development of a sustainable tourism industry through consumer marketing, trade development and
research activities.
National Offshore Petroleum Safety Authority
Chief Executive OfficeMs Jane Cutler
Outcome 1: An Australian oil and gas industry that properly controls the health and safety risks to the w orkforce at its
offshore petroleum operations.
Australian Solar InstituteExecutive DirectorMr Mark Tw idell
Outcome 1: Encourage innovation and cost effective developments in solar energy technologies to accelerate commercial deployment through
know ledge building and collaborative research, development and support for
Australian industries and research institutions.
Geoscience AustraliaActing Chief Executive Officer
Dr Chris Pigram
Outcome 1: Informed government, industryand community decisions on the economic, social and environmental management of the nation's natural resources through
enabling access to geoscientif ic and spatial information.
6

Portfolio Overview
7
PORTFOLIO RESOURCES
Table 1 shows the total new resources provided to the portfolio in the 2010-11 budget year, by agency.
Table 1: Portfolio Resources 2010-11 Receipts Total
Bill No. 1 Bill No. 2 Special$'000 $'000 $'000 $'000 $'000
Department of Resources,Energy and TourismAdministered appropriations 800,051 - 16,560 2,848 819,459
Departmental appropriations 84,724 928 - 9,501 95,153
Total: 914,612
Geoscience AustraliaAdministered appropriations - - - - -Departmental appropriations 122,778 2,940 - 857 126,575Total: 126,575
National OffshorePetroleum SafetyAuthorityAdministered appropriations - - - - -Departmental appropriations 200 - - 12,971 13,171Total: 13,171
Tourism AustraliaAdministered appropriations - - - - -Departmental appropriations 122,920 13,181 - - 136,101
Total: 136,101
Australian Solar InstituteAdministered appropriations - - - - -Departmental appropriations - - - 29,628 29,628Total: 29,628
Portfolio total 1,220,087
Less amounts transferred within portfolio
Resources available within portfolio: 1,085,348
- (134,739)
Appropriation
(147,920) (13,181) -


9
AGENCY RESOURCES AND PLANNED PERFORMANCE
Department of Resources, Energy and Tourism .....................................................11
Geoscience Australia..................................................................................................53
National Offshore Petroleum Safety Authority ........................................................77
Tourism Australia........................................................................................................97
Australian Solar Institute..........................................................................................127


11
Department of Resources, Energy and Tourism
Agency resources and planned performance
DEPARTMENT OF RESOURCES, ENERGY AND TOURISM
Section 1: Agency overview and resources.............................................................13 1.1 Strategic Direction Statement.........................................................................13 1.2 Agency Resource Statement..........................................................................14 1.3 Budget Measures............................................................................................16
Section 2: Outcomes and planned performance .....................................................18 2.1 Outcomes and performance information ........................................................18
Section 3: Explanatory tables and budgeted financial statements .......................38 3.1 Explanatory tables ..........................................................................................38 3.2 Budgeted Financial Statements......................................................................41
12

Department of Resources, Energy and Tourism Budget Statements
DEPARTMENT OF RESOURCES, ENERGY AND TOURISM
Section 1: Agency overview and resources
1.1 STRATEGIC DIRECTION STATEMENT
The resources, energy and tourism sectors are key drivers of the Australian economy underpinning the competitiveness of regions, industries and businesses across the economy. These sectors are at the forefront of the economic and environmental challenges facing Australia, accounting for over 15 per cent of Australia’s GDP, over 60 per cent of Australia’s export earnings and over 40 per cent of Australia’s energy use.
The purpose of the Department of Resources, Energy and Tourism is to enhance Australia’s economic prosperity by improving the productivity, competitiveness, security and sustainability of the resources, energy and tourism sectors through the provision of high quality policy advice and program delivery services for the Australian Government.
The strategic direction for the Department is structured around four key areas: strategic policy development; enhancing productivity and international competitiveness; enhancing environmental and social sustainability; and enhancing national security. These issues cut across all sectors in the portfolio, and the key priorities and proposed mechanisms for addressing these areas are detailed in each program’s objectives on the following pages.
The specific actions include:
• facilitating exploration and the sustainable development of petroleum and mineral resources;
• facilitating a competitive downstream fuels market;
• developing and implementing effective legal and regulatory regimes for the resources sector;
• promoting more competitive and efficient energy markets;
• improving the resilience and security of energy systems;
• fostering clean energy technologies and improving industrial energy efficiency;
• furthering Australia’s interests in international forums and markets;
13

Department of Resources, Energy and Tourism Budget Statements
• facilitating growth in international tourism to Australia; and
• facilitating the development of a competitive and sustainable tourism industry.
1.2 AGENCY RESOURCE STATEMENT
Table 1.1 shows the total resources from all sources. The table summarises how resources will be applied by outcome and by administered and departmental classification.
Table 1.1: Department of Resources, Energy and Tourism Resource Statement — Budget Estimates for 2010-11 as at Budget May 2010
Estimate Proposed Total Actualof prior + at Budget = estimate available
year amounts appropriation
$'000 $'000 $'000 $'000
available in2010-11 2010-11 2010-11 2009-10
Ordinary annual services1
Departmental appropriationPrior year departmental
2 appropriation-
3,472 3,472 -
19,957 81,252 101,209 83,062Departmental appropriations31 Relevant agency receipts3
- - - -
19,957 84,934 104,891 83,062
Administered expenses800,051 800,051 675,530122,920 122,920 141,622
- 922,971 922,971 817,152
otal ordinary annual services A 19,957 1,007,905 1,027,862 900,214
Expenses not requiring appropriation
- 210 210 -
Total
Outcome 1 - Payments to CAC Act bodies - Total
T
Other services4
Departmental non-operatingEquity Injections - 928 928 -Previous years outputs - - - 2,330
- 928 928 2,330
Payments to CAC Act bodies -
non-operatingTotal - 13,181 13,181 2,330
Total other services B - 14,109 14,109 2,330
Total available annual appropriations 19,957 1,022,014 1,041,971 902,544
- 13,181 13,181 -
TotalAdministered non-operating
14

Department of Resources, Energy and Tourism Budget Statements
Table 1.1: Department of Resources, Energy and Tourism ResourceBudget Estimates for 2010-11 as at Budget May 2010 (continued)
Statement —
Estimate Proposed Total Actualof prior + at Budget = estimate available
year amounts appropriationavailable in
2010-11 2010-11 2010-11 2009-10
Cartier Islands
1,500 1,500
$'000 $'000 $'000 $'000
Special appropriations
- Offshore Petroleum and Greenhouse Gas Storage Act 2006 - Ashmore and
- 1,500
- Offshore Petroleum and Greenhouse Gas Storage Act 2006 - Offshore Petroleum Fees
- 15,000 15,000 20,000
- Offshore Minerals Act 1994 - Offshore Minerals Act (Fees)
- 60 60
Total special appropriations C - 16 21,560
60
,560 16,560
otal appropriations excluding Special Accounts
T
Special Accounts5Opening balance 63,921 - 63,921 60,322
Appropriation receipts6- 485,977 485,977 393,347
Appropriation receipts
- other agencies7
Non-appropriation receipts to
Total Special Account D 63,921 498,326 562,247 465,266
83,878 1,536,900 1,620,778 1,389,370
above and credited to special
through annual appropriations
2 998,700 854,401
Special Accounts
Total resourcingA+B+C+DLess appropriations drawn from
annual or special appropriations
accounts and/or CAC Act bodies
Total net resourcing for RET 83,878 914,821 Appropriation Bill (No.1) 2010-112 Estimated adjusted balance carried from previous year for annual appropriations3 s31 Relevant Agency receipts - estimate4 Appropriation Bill (No.2) 2010-115 Estimated opening balance for special accounts (less ‘Special Public Money’ held in accounts like
Other Trust Monies (OTM) and Services for other Governmentaccounts). For further information on special accounts see T
and Non-agency Bodies (SOG)able 3.1.2.
Appropriation receipts from other agencies credited to RET's special accounts
er note: All figures are GST exclusive.
- (622,078) (622,078) (534,969)
Appropriation receipts from RET's annual and special appropriations for 2009-10 included above.
- 8,434 8,434 7,532
3,915 3,915 4,065
924,10419,957 1,038,574 1,058,531
-
7
6
Read
15

Department of Resources, Energy and Tourism Budget Statements
Third party payments from and on behalf of other agencies 2010-11 2009-10
$'000 $'000
Receipts received from other agencies for the provision of services
(disclosed above within Appropriation receipts - other agencies)
Payments made to CAC Act bodies within the Portfolio
3,915 4,065
136,101 141,622 - Tourism Australia
EASURES
are detailed in Budget Paper No. 2 and are summarised below.
010-11 Budget measures
1.3 BUDGET M
Budget measures relating to the Department
Table 1.2: Agency 2
Program 2009-10 2010-11 2011-12 2012-13 2013-14000 $'000 $'000 $'000 $'000
Departmental expenses 3,472 900 - - - - -
- 2,120 1,178 1,258 685735
ement with
- - - - - tal - - - - -
na Approved Destinationtatus Scheme - continuation
Departmental expenses - 1,014 1,011 1,018 1,026Total - 1,014 1,011 1,018 1,026
otal expense measuresAdministered - 100 50 50 50
3,472 4,034 2,189 2,276 1,7113,472 4,134 2,239 2,326 1,761
lliance - not proceed with membership
Administered expenses (15,000) - - - - (15,000) - - - -
Prepared on a Government Financial Statistics (fiscal) basis
4
2
$'Expense measures
Montara - Commission of Inquiry 2
Total 3,472 900 -
onNational Tourism AccreditatiFramework - Establishment
Administered expenses - 100 50 50 50Departmental expenses
4
Total - 2,220 1,228 1,308
Enhancing Australia's EngagIndia
Departmental expenses2, 3, 4
To
ChiS
T
DepartmentalTotal
Saving measures
FutureGen A
Total
Geoscience Australia - additional resourcing
Administered expenses - (5,000) (24,344) (25,769) (10,180)Total - (5,000) (24,344) (25,769) (10,180)
2
16

Department of Resources, Energy and Tourism Budget Statements
Tab 1
le .2: Agency 2010-11 Budget measures (continued)
Program 2009-10 2010-11 2011-12 2012-13 2013-14$'000 $'000 $'000 $'000 $'000
algamated mediation ces for the Franchising Code of
the Horticulture Code of the Oilcode and the Produce ery Industry Code of Conduct
mental expenses - (125) (130) (134) (137)- (125) (130) (134) (137)
ollution Reduction Scheme –
2
dministered expenses (20,500) - - - - (20,500) - - - -
ving measures
Departmental - (125) (130) (134) (137)Total (35,500) (5,125) (24,474) (25,903) (10,317)
Capital measures
Montara - Commission of Inquiry
Enhanced and amserviConduct,Conduct,and Groc
DepartTotal
Carbon P
deferral1
ATotal
Total saAdministered (35,500) (5,000) (24,344) (25,769) (10,180)
Departmental capital 928 - - - - otal 928 - - - -
al) basis
2
3
T
Total capital measuresDepartmental 928 - - - -
Total 928 - - - -
Prepared on a Government Financial Statistics (fisc
1. This is the impact on RET of the measure Carbon Pollution Reduction Scheme – deferral. The Climate Change and Energy Efficiency portfolio is the lead.
17

Department of Resources, Energy and Tourism Budget Statements
Section 2: Outcomes and planned performance
.1 OUTCOMES AND PERFORMANCE INFORMATION
overnment outcomes are the intended results, impacts or consequences of actions by e Government on the Australian community. Commonwealth programs are the
rimary vehicle by which government agencies achieve the intended results of their utcome statements. Agencies are required to identify the programs which contribute Government outcomes over the Budget and forward years.
ach outcome is described below together with its related programs, specifying the erformance indicators and targets used to assess and monitor the performance of the
Department in achieving Government outcomes.
2
Gthpoto
Ep
Outcome 1: The improved strength, competitiveness and sustainability of the Resources, Energy and Tourism industries to enhance Australia's prosperity through implementation of government policy and programs.
Outcome 1 Strategy
The key performance indicator utilised to measure the achievement of the outcome is the contribution of the resources, energy and tourism sectors to the Gross Domestic
The Department has four programs:
1. Assistance to the State and Territory Governments for Resources and
2. Resources Related Initiatives and Management;
he Department supports the achievement of the outcome and its indicators by improving the strength, competitiveness and sustainability of the
g by stakeholders.
Product.
Energy;
3. Energy Related Initiatives and Management; and
4. Tourism Related Initiatives and Management.
Through these programs t
resources, energy and tourism sectors through the provision of high quality advice, services and access to fundin
18

Department of Resources, Energy and Tourism Budget Statements
Outcome 1 Strategy (continued)
Specific areas being targeted by the Department in the current and future years include:
• renewable, efficient, low emission and clean energy;
• carbon capture and storage;
• energy security;
competitive and efficient energy markets;
a National Long-Term Tourism Strategy and a National Tourism Accreditation Framework; and
• ergy and tourism sectors.
rview of the total expenses for Outcome 1, by program.
•
•
international relationships in the resources, en
Outcome Expense and Resource Statement
Table 2.1 provides an ove
Table 2.1: Budgeted Expenses and Resources for Outcome 1 Outcome 1: The improved strength, competitiveness and sustainability of the Resources, Energy and Tourism industries to enhance Australia's prosperity through implementation of
2009-10 2
government policy and programs.
Estim
010-11
ated Estimatedactual expenses
expenses$'000 $'000
Ordinary annual services (Appropriation Bill No. 1) 1,850 1,850
263,125 296,081Ordinary annual services (Appropriation Bill No. 1) - credited to special accounts
222,621 185,648
mental expensesOrdinary annual services (Appropriation Bill No. 1) 29,853 26,784Expenses not requiring appropriation in the Budget year 139 139Total for Program 2 515,738 508,652
Program 1: Assistance to State and Territory Governments for Resources and Energy
Administered expensesOrdinary annual services (Appropriation Bill No. 1) 40 40Special appropriations 21,560 16,560
Departmental expenses
Total for Program 1 23,450 18,450
Program 2: Resources Related Initiatives and ManagementAdministered expenses
Ordinary annual services (Appropriation Bill No. 1)
Depart
ote: Departmental appropriation splits and totals are indicative estimates and may change in the course of
year as government priorities change. Nthe budget
19

Department of Resources, Energy and Tourism Budget Statements
Table 2.1: Budgeted Expenses and Resources for Outcome 1 (continued) Outcome 1: The improved strength, competitiveness and sustainability of the Resources, Energy and Tourism industries to enhance Australia's prosperity through implementation of government policy and programs.
2009-10 2010-11
Estimated Estimatedactual expenses
expenses$'000 $'000
Program 3: Energy Related Initiatives and ManagementAdministered expenses
Ordinary annual services (Appropriation Bill No. 1) 24,715 16,343
Ordinary annual services (Appropriation Bill No. 1) - credited to special accounts
151,983 299,559
Departmental expensesOrdinary annual services (Appropriation Bill No. 1)Special Accounts
34,222 31,5859,593 9,501
Expenses not requiring appropriation in the Budget year 153 153220,666 357,141
88Total for Program 4 171,146 147,421
OutcomAdminist
OrdinaPayme ation Bill No. 1) 141,622 122,920Special appropriations 21,560 16,560O a spe
DepartmOrdinary annual No. 1) 86,759 81,252SE
Total ex 931,000 1,031,664
Average
Total for Program 3
Program 4: Tourism Related Initiatives and ManagementAdministered expenses
Ordinary annual services (Appropriation Bill No. 1) 8,602 3,380Payment to CAC Act agencies (Appropriation Bill No. 1) 141,622 122,920
Departmental expensesOrdinary annual services (Appropriation Bill No. 1) 20,834 21,033Expenses not requiring appropriation in the Budget year 88
e 1 Totals by appropriation typeered Expensesry annual services (Appropriation Bill No. 1) 296,482 315,844nt to CAC Act agencies (Appropri
rdin ry annual services (Appropriation Bill No. 1) - credited to cial accounts
374,604 485,207
ental expenses services (Appropriation Bill
pecial Accounts 9,593 9,501xpenses not requiring appropriation in the Budget year 380 380
penses for Outcome 1
2009-10 2010-11 Staffing Level (number) 440 440 artmental appropriation splits and totals are indicative estimates and may change in the course of t year as government prioriti
Note: Depthe budge es change.
20

Department of Resources, Energy and Tourism Budget Statements
Co intr butions to Outcome 1
Program 1: s and Assistance to State and Territory Governments for ResourceEnergy
Program 1 Objectives
• Lead development and implementation of the Australian Government’s resources policy to drive investment and development of the sector through the
istent, effective and efficient legislative and regulatory
- working with state and territory governments to promote consistent, effective ulatory regimes for the petroleum and minerals industries
capture and storage. The program aims to optimise the hrough
improvements to the regulatory regime in consultation with state and territory governments;
- optimising royalty revenue from petroleum and mineral resources and provide funding for state and territory governments to administer petroleum activities in the Commonwealth offshore areas. The program aims to efficiently and effectively administer offshore petroleum royalties, offshore petroleum fees (including Ashmore and Cartier Island fees) and uranium royalties in the Northern Territory (NT);
- improving communication, consultation and action across jurisdictions promoting the progressive and sustainable development of the Australian mining, minerals and petroleum industries; and
– promoting a consistent and effective framework for mine and offshore petroleum safety to improve safety outcomes and to provide an efficient regulatory regime for industry.
promotion of consregimes. Related activities include:
and efficient regand for carbonenvironment for investment in petroleum and mineral activities t
Program 1 Expenses
• The program expenditure is expected to remain constant from 2010-11 into the out-years. The program support costs are also expected to remain constant as the policy and revenue collection associated with the programs transferred to the Treasury remains the responsibility of the department.
21

Department of Resources, Energy and Tourism Budget Statements
Program 1 Expenses 2009-10 2010-11 2011-12 2012-13 2013-14Revised Budget Forward Forward Forward
('000) budget year 1 year 2 year 3Annual administered expenses:
- Petroleum Royalties Administration 40 40 40 40 40
Special Appropriations:
- Offshore Petroleum and Greenhouse Gas Storage Act 2006 - Offshore Petroleum Fees
20,000 15,000 15,000 15,000 15,000
- Offshore Petroleum and Greenhouse
Fees) 60 60 60 60 60
850 1,850 1,850 1,850 1,850
Gas Storage Act 2006 - Ashmore and Cartier Islands
1,500 1,500 1,500 1,500 1,500
- Offshore Minerals Act 1994 (
Annual departmental expenses:
- Program support 1,
Total program expenses 23,450 18,450 18,450 18,450 18,450
22

Department of Resources, Energy and Tourism Budget Statements
Program 1 Deliverables
• Legal and regulatory regimes for the resources sector are developed, reviewed and/or implemented including:
– revising institutional arrangements for offshore petroleum administration;
– streamlining and consolidation of offshore petroleum regulations;
– implementation of legislative regime for Commonwealth radioactive waste
d storage (CCS) regulations and guidelines to complement legislation.
• Efficient and effective delivery of administration of petroleum and uranium
– collection, payment and reconciliation of uranium royalties for the NT and
• Improvement of communication, consultation and action with state and territory governments through:
– progressing the work program under the Ministerial Council on Mineral and Petroleum Resources (MCMPR), including the MCMPR Reform Working Group, to improve MCMPR governance and reporting arrangements and to promote a more focused forward work program;
– development of the National Mine Safety Framework, including consistent mine safety draft legislation across all jurisdictions; and
– consulting with the Western Australian (WA) Government to establish a regulatory regime which is world's best practice for uranium mines and to consider regulatory streamlining options through the Uranium Council.
– implementation of royalty regime for new uranium mines in the NT;
management;
– implementation of agreed amendments to the Oilcode regulations; and
– development of carbon capture an
royalties and offshore petroleum and mineral fees:
offshore petroleum royalties and fees in accordance with regulatory requirements.
23

Department of Resources, Energy and Tourism Budget Statements
Program 1 Key Performance Indicators
me for offshore petroleum and minerals g resource management, safety and
of a national regulator for offshore petroleum and implementation of best practice regulatory principles in all jurisdictions.
fety Framework developed according to agreed timetable.
• Amendment of Oilcode regulations.
ith government policy.
forums such as the Uranium Council.
in a timely manner and in accordance with all regulatory and financial management requirements.
• Maintenance of effective regulatory regiexploration and production, addressinenvironment.
• Establishment
• National Mine Sa
• Implementation of Uranium Royalty (Northern Territory) Act 2009.
• Implementation of new legislative framework for radioactive waste management in accordance w
• Progress with the WA regulatory regime for uranium mines, including through
• Revenue is collected and disseminated
• Progress against the MCMPR's strategic priorities.
24

Department of Resources, Energy and Tourism Budget Statements
Program 2: Resources Related Initiatives and Management
Program 2 Objectives
• Develop and maintain Australian Government policy and programs in relation to resources industries. The key objective of the program is to enhance Australia's economic prosperity by ensuring that Australia maintains its international competitiveness and responds to increasing globalisation and technology
- driving the sustainable discovery and development of petroleum resources
itioning the resources sector for sustained growth and employment;
development in the Joint Petroleum Development Area and protect Australian rights and obligations
facilitate a competitive downstream fuels market;
maximise the safety and environmental security of the waste;
and implementation of low emissions technologies for fossil fuels domestically and internationally to facilitate a
f alternative fuels to enhance Australia’s energy security;
international engagement to advance Australia’s resources
development of the resource sector contributes to the Australian
digenous objectives and reforms.
developments of the resources industry. Related activities include:
and ensuring that the Australian Government’s broader investment framework is conducive to pos
- working with stakeholders to encourage petroleum
under the Timor Sea Treaty;
- developing and implementing sound policy frameworks to
- developing and implementing a long-term solution to the management of Australia’s radioactive waste to
– supporting the development
cost-effective transition to a lower carbon economy;
- promoting the development o
- pursuing active interests, including promoting investment in the resources sector; and
– working with stakeholders and other government agencies to ensure the
Government’s In
rogram 2 Expenses P
• The program expenditure reduces in the out-years as a result of the finalisation of some current program components.
25

Department of Resources, Energy and Tourism Budget Statements
Program 2 Expenses 2009-10 2010-11 2011-12 2012-13 2013-14Revised Budget Forward Forward Forward
('000) budget year 1 year 2 year 3Annual administered expenses:
- Ethanol Production Subsidy 154,556 183,300 - - -
- Establishment of the National Offshore Petroleum Regulatory Authority
1,047 7,298 1,048 - -
- Global Carbon Capture and Storage Institute
100,000 100,000 100,000 100,000 -
- Radioactive Waste Management 6,483 4,443 3,097 - -
- Rum Jungle 39 40 25 16 -
- Syntroleum Depreciation 1,000 1,000 1,000 1,000 1,000
Clean Energy Initiative Special Account:1
Initiative87,621 102,850 74,900 34,800 17,630
Annual departmental expenses:
enses 515,738 508,652 417,263 367,645 138,202
Special account expenses:
- Carbon Capture and Storage Flagships
135,000 82,798 209,599 208,160 98,731
- National Low Emissions Coal
- Program support 29,992 26,923 27,594 23,669 20,841
Total program exp 1. The expenses from this special account are funded by administered appropriations from RET.
26

Department of Resources, Energy and Tourism Budget Statements
Program 2 Deliverables • Provision of accurate, timely and effective policy advice to the Minister and
Government on resources sector issues.
ness of NOPSA,
cations for offshore petroleum and mineral titles and
ium and controlled ores export permits and approvals.
• Support for Australian Commissioners to the Timor Sea Joint Commission and
stream fuel initiatives.
Ethanol Production Grants Program.
expansion of the resources sector.
• Management of the Commonwealth’s funding agreement with the Global
ent against the agreed work plan and approval of future work plans.
lement low emissions technologies, such as CCS, including:
through the Australian National Low Emissions Coal Research and
– delivery of the CCS Flagships Program element of the Clean Energy
ion of the work of the Carbon Storage Taskforce;
• Implementation of government responses to Independent Review of the National Offshore Petroleum Safety Authority, Better practice and the effectiveand Marine Issues (Bills/Agostini) and the Montara Commission of Inquiry.
• Timely processing of applipromotion of offshore petroleum acreage release.
• Timely processing of uran
Sunrise Commission.
• Implementation of the Australian Government's response to the Oilcode review and other down
• Administration of alternative fuels programs including the Second Generation Biofuels Research and Development Program and the
• Identify and addressing impediments to the development and
Carbon Capture and Storage Institute (GCCSI), including review of GCCSI reporting of achievem
• Work with stakeholders to develop and imp
– implementation of the National Low Emission Coal Research Program
Development Ltd (ANLEC R&D);
Initiative;
– continued support to the National Low Emissions Coal Council including incorporat
27

Department of Resources, Energy and Tourism Budget Statements
Program 2 Deliverables (continued) – continued development and implementation of projects under the
National Low Emissions Coal Initiative (NLECI);
– a supportive legislative and regulatory regime for geo-sequestration and the consequential award of exploration rights for greenhouse gas acreage in offshore waters;
– management of funds for the Otway Basin Geosequestration Pilot Project, the ANLEC R&D, and other NLECI projects; and
– continued support and Australian leadership in responding to international carbon capture and storage road mapping priorities, carbon dioxide reuse, capacity building and knowledge sharing activities, and measures to overcome barriers to carbon capture and
l engagement on resources sector issues.
alian Government’s Indigenous agenda.
storage deployment.
• Effective internationa
• High quality advice on secondary taxation issues, and effective engagement with the states and territories.
• Effective engagement between the resources sector and the Austr
28

Department of Resources, Energy and Tourism Budget Statements
Program 2 Key Performance Indicators
• Maintenance of effective regulatory regime for offshore petroleum and minerals
regulatory regimes for exports of uranium and
port fuels
enting low emissions technologies for fossil fuels such as CCS, and enabling a supporting regulatory environment.
• International work programs are progressed in a timely manner following ateral consultations.
on secondary taxation engaged on issues relevant to royalty
administration.
• Expansion of activities under the Memorandum of Understanding between the Australian Government and the Minerals Council of Australia through initiatives developed under Working in Partnership.
exploration and production, addressing resource management, safety and environment.
• Maintenance of effective controlled ores.
• Management of the Australian Government's alternative transprogram, in accordance with policy objectives.
• Satisfactory progress in developing and implem
• Delivery of programs in accordance with announced timeframes and guidelines.
multilateral and bil
• Accurate and timely advice to the Australian Governmentissues and states and territories are
29

Department of Resources, Energy and Tourism Budget Statements
Program 3: Energy Related Initiatives and Management
he Solar Flagships Program
ion and
d electricity disruptions.
ra to advance the development of efficient,
Program 3 Objectives
• Implement the Clean Energy Initiative, including tand the Australian Centre for Renewable Energy (ACRE), to support the research, development and demonstration of low emission technologies.
• Lead the implementation of the Australian Government’s energy market reform agenda to deliver competitive and efficient energy markets.
• Work with industry to improve industrial energy efficiency to reduce the cost of adjusting to a low carbon economy.
• Foster the research, development and deployment of clean energy technologies, to facilitate the transition to a lower carbon economy.
• Contribute to development and implementation of climate change and other environment policies, particularly in relation to technology and clean energy, to ensure policies and frameworks enhance environmental outcomes.
• Build resilience in the energy sector through critical infrastructure protecteffective emergency response arrangements that minimise the impact of liquid fuel, gas an
• Develop, implement and assess policies to improve domestic energy market reliability, adequacy and resilience.
• Engage with international fotransparent and competitive global and regional energy markets and deliver investment in the energy sector.
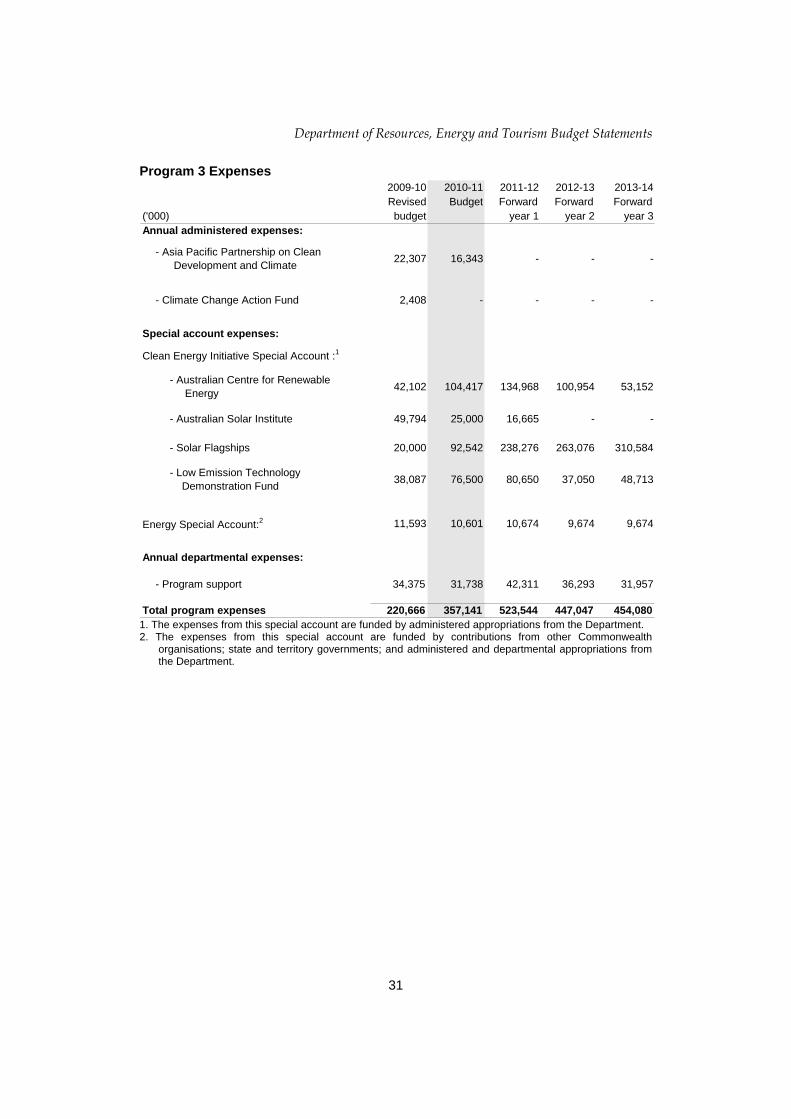
Program 3 Expenses
• The program expenditure increases in each year to 2011-12, and reduces slightly from 2012-13 as a result of the finalisation of some current program components.
30
Department of Resources, Energy and Tourism Budget Statements
Program 3 Expenses 2009-10 2010-11 2011-12 2012-13 2013-14Revised Budget Forward Forward Forward
('000) budget year 1 year 2 year 3
Development and Climate22,307 16,343 - - -
2,408 - - - -
- Australian Centre for Renewable ergy
42,102 104,417 134,968 100,954 53,152
- Australian Solar Institute 49,794 25,000 16,665 - -
Energy Special Account:2 11,593 10,601 10,674 9,674 9,674
Annual administered expenses:
- Asia Pacific Partnership on Clean
- Climate Change Action Fund
Special account expenses:
Clean Energy Initiative Special Account :1
En
- Solar Flagships 20,000 92,542 238,276 263,076 310,584
- Low Emission Technology Demonstration Fund
38,087 76,500 80,650 37,050 48,713
Annual departmental expenses:
- Program support 34,375 31,738 42,311 36,293 31,957
Total program expenses 220,666 357,141 523,544 447,047 454,080
ritory governments; and administered and departmental appropriations from
the Department.
1. The expenses from this special account are funded by administered appropriations from the Department.
2. The expenses from this special account are funded by contributions from other Commonwealthorganisations; state and ter
31

Department of Resources, Energy and Tourism Budget Statements
Program 3 Deliverables
• Provision oAustralian G
f accurate, timely and effective policy advice to the Minister and overnment on energy related issues.
ip Program (APP).
shment of ACRE.
• Strengthen Australia's energy security objectives and promote more competitive ralian Government
• Contribute to the establishment of the gas Short Term Trading Market.
• Contribute to the development of a national framework for smart metering, and
ery of cy Opportunities Program.
• Support the development and demonstration of clean and renewable energy .
cooperation and
he development of Australia's international and domestic climate change policies.
).
• Progress of work program under the MCE, including through the Standing Committee of Officials.
• Efficient and effective delivery of the Solar Flagships Program and ACRE elements of the Clean Energy Initiative.
• Efficient and effective implementation of other energy sector programs, including the Low Emission Technology Demonstration Fund, and Asia Pacific Partnersh
• Establi
and efficient markets through the implementation of Austinitiatives.
• Contribute to the establishment of the National Energy Customer Framework.
smart grids through the Smart Grid, Smart Cities Program.
• Identify and address impediments to the investigation and implementation of pportunities for industry, including through the delivenergy efficiency o
the Energy Efficien
technologies and energy storage
• Provision of secretariat support to the Ministerial Council on Energy (MCE).
• Promotion and contribution to international energy marketemergency management.
• Contribute through broader Australian Government process to t
• Represent the Australian Government within the International Renewable cy (IRENAEnergy Agen
32

Department of Resources, Energy and Tourism Budget Statements
Program 3 Key Performance Indicators
• Identification of critical infrastructure protection issues for dissemination to the
• Progress on Energy Market Reform agenda as set by the Council of Australian Governments and the Ministerial Council on Energy.
• Support for the ACRE Board in delivering its advice to the Australian Government on renewable energy and enabling technologies.
• Delivery of programs in accordance with announced timeframes and guidelines.
• Increase business expenditure on research, development and demonstration in energy technologies.
• Support research and development of innovative solar energy technologies through the Australian Solar Institute (ASI).
• Identification and implementation of energy efficiency opportunities in accordance with the provisions of the Energy Efficiency Opportunities Act 2006.
• Implemented processes to establish effective liquid fuel emergency management, including administration of the Liquid Fuel Emergency Act 1984.
• Timely and effective delivery of projects under the APP Program.
• Incorporated Australian Government policy priorities in the outcome of key international energy reforms.
• Progress with the establishment of the International Renewable Energy Agency (IRENA) and the adoption of IRENA activity priorities which are consistent with Australian Government priorities.
energy sector.
33

Department of Resources, Energy and Tourism Budget Statements
Program 4: Tourism Related Initiatives and Management
pressures and is vulnerable to factors beyond its direct influence.
– working with government agencies to support adequate planning and
competitiveness of the tourism sector;
he tourism industry to improve the quality of Australia’s tourism products and services;
– working collaboratively with stakeholders to support the development of sustainable Indigenous tourism businesses;
– actively engaging with government agencies to ensure that the Government’s labour and skills policies contribute to a sustainable and productive tourism industry;
– working with relevant partners to improve the resilience of the tourism industry and its capacity to adapt to changing circumstances; and
– facilitating the provision of research and statistics to support business investment and guide tourism policy development.
Program 4 Objectives
• The Australian tourism industry is diverse in nature and is characterised by a prevalence of small and medium enterprises and a high level of labour intensity. The industry is facing a challenging environment with intense competitive
• The key objective of this program is to lead the development and implementation of the Australian Government’s tourism policy to maintain and promote a competitive tourism sector.
• This program seeks to strengthen and stimulate growth in the tourism industry through the following activities:
– facilitating growth of domestic and international tourism;
– working with relevant partners to address regulatory barriers to tourism;
management of border security, transport linkages and safety to enhance tourism security;
– working with other government agencies and stakeholders to ensure that infrastructure development contributes to the
– promoting the development of innovative products, services or systems within t
34

Department of Resources, Energy and Tourism Budget Statements
Program 4 Expenses
• Administered expenditure on TQUAL Grants is currently scheduled to decrease with the expected cessation of the program in 2010-11.
Program 4 Expenses 2009-10 2010-11 2011-12 2012-13 2013-14Revised Budget Forward Forward Forward
('000) budget year 1 year 2 year 3Annual administered expenses:
8,602 3,280 - - -
Framework - Establishment - 100 50 50 50
- Payment to CAC Act body2 141,622 122,920 133,385 135,067 137,016
Annual departmental expenses:
- Program Support 20,922 21,121 22,075 18,935 16,673
Total program expenses 171,146 147,421 155,510 154,052 153,739
- TQUAL Grants1
- National Tourism Accreditation
1. Formerly known as the Australian Tourism Development Program (ATDP). 2. Represents payments made to Tourism Australia.
35

Department of Resources, Energy and Tourism Budget Statements
Program 4 Deliverables
• Provision of accurate, timely and effective policy advice to the MinistAustralian Government on tourism related issues.
er and
vernment’s National Long-Term Tourism Strategy (the Strategy) to improve the productive capacity of the tourism industry, including delivery of initial outputs for specific working groups as outlined in the Strategy work programs and agreed by the Tourism Ministers’ Council (TMC).
• Strategic support for the Australian Standing Committee on Tourism and the TMC, to assist the TMC to oversee and lead the implementation of the Strategy.
• Implementation of a National Tourism Accreditation Framework, working with relevant partners to improve the quality of tourism products and services.
• Delivery of an enhanced China (Approved Destination Status) Scheme, to ensure a quality tourism experience for Chinese group leisure tourists.
• Improved access by overseas visitors to Australian consumer protection.
• Delivery of the TQUAL Grants Program, and other tourism related programs, as required.
• Enhanced national tourism research agenda informing policy development and industry investment decisions through the production and dissemination of tourism research and analysis.
• Production and dissemination of tourism forecasts and surveys for inbound, domestic and outbound markets, to provide a comprehensive source of information on the characteristics and travel patterns of international and domestic tourists.
• Development of policy initiatives to support Indigenous tourism and engagement with relevant partners to support Indigenous tourism development in selected regions.
• Engagement with key stakeholders to ensure that tourism interests are taken into account in broader context of Australian Government policy development and implementation, including in relation to labour and skills, infrastructure development, and regulatory issues that impact tourism.
• Implementation of the Australian Go
36

Department of Resources, Energy and Tourism Budget Statements
Program 4 Deliverables (continued)
• Engagement in multilateral and bilateral forums to influencefor the Australian tourism industry.
beneficial outcomes
s to influence beneficial outcomes for the Australian tourism industry.
• Engagement with Tourism Australia on governance and program issues.
• Coordination and management of the National Tourism Incident Response Plan.
• Engagement in air services negotiation
Program 4 Key Performance Indicators
• Extent to which tourism interests are considered and reflected in the broader context of Australian Government policy development and implementation, including in relation to labour skills, investment, infrastructure development and regulatory issues that impact tourism.
• Delivery of the Strategy work programs and outputs in accordance with frameworks and timeframes agreed by Tourism Ministers.
• Delivery and industry-wide dissemination of strategically focused tourism research and analysis that effectively supports policy and industry development, including through an annual Tourism Research Outlook Conference and State of Industry Report.
• Delivery of programs, including China (Approved Destination Status) Scheme and TQUAL Grants Program, in accordance with announced timeframes and guidelines.
• Level of stakeholder satisfaction, as measured through the Annual Stakeholder Satisfaction Survey and other feedback mechanisms.
37
Department of Resources, Energy and Tourism Budget Statements
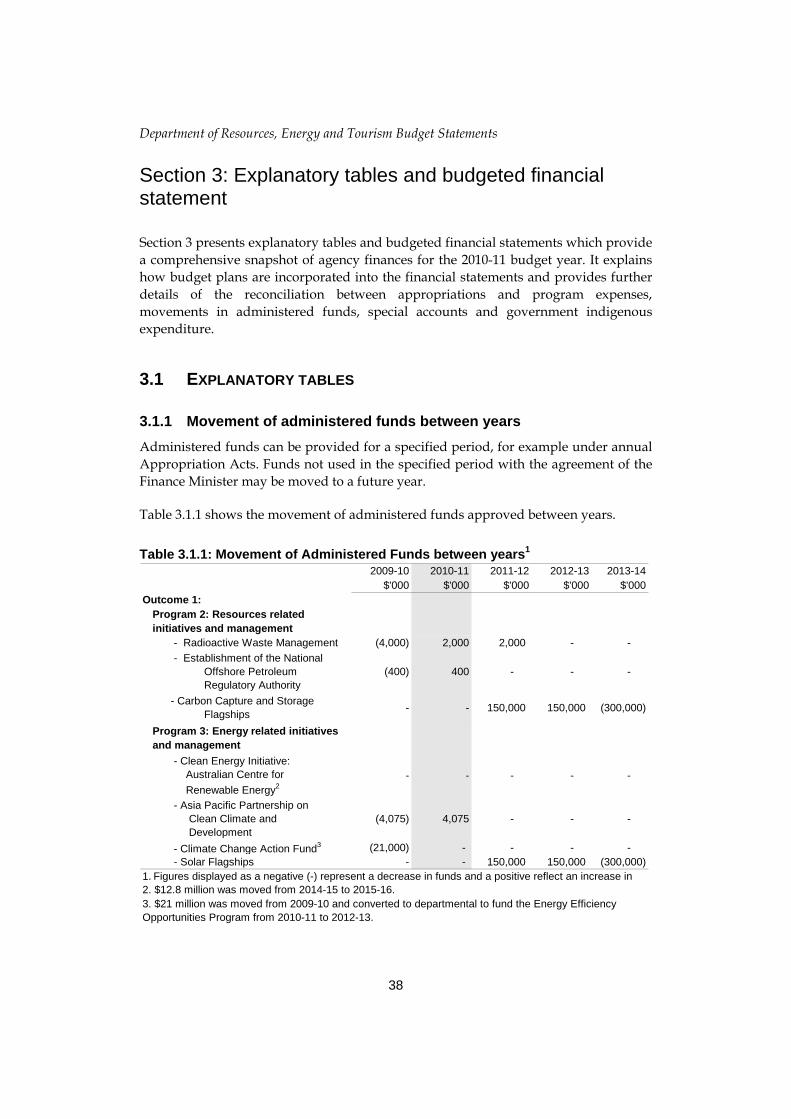
Sect on 3: Explanatory tables and budgeted fii nancial
ion 3 presents explanatory tables and budgeted financial statements which provide a comprehensive snapshot of agency finances for the 2010-11 budget year. It explains how budget plans are incorporated into the financial statements and provides further details of the reconciliation between appropriations and program expenses, movements in administered funds, special accounts and government indigenous expenditure.
3.1 EXPLANATORY TABLES
3.1.1 Movement of administered funds between years
Administered funds can be provided for a specified period, for example under annual Appropriation Acts. Funds not used in the specified period with the agreement of the Finance Minister may be moved to a future year.
Table 3.1.1 shows the movement of administered funds approved between years.
Table 3.1.1: Movement of Administered Funds between years1
statement
Sect
2009-10 2010-11 2011-12 2012-13 2013-14$'000 $'000 $'000 $'000 $'000
Outcome 1: Program 2: Resources related initiatives and management - Radioactive Waste Management (4,000) 2,000 2,000 - -
- Establishment of the National Offshore Petroleum Regulatory Authority
(400) 400 - - -
- Carbon Capture and Storage Flagships
- - 150,000 150,000 (300,000)
Program 3: Energy related initiatives and management
- Clean Energy Initiative: Australian Centre for
Renewable Energy2- - - - -
- Asia Pacific Partnership on Clean Climate and Development
(4,075) 4,075 - - -
- Climate Change Action Fund3 (21,000) - - - - - Solar Flagships - - 150,000 150,000 (300,000)
2. $12.8 million was moved from 2014-15 to 2015-16. 1. Figures displayed as a negative (-) represent a decrease in funds and a positive reflect an increase in
3. $21 million was moved from 2009-10 and converted to departmental to fund the Energy Efficiency Opportunities Program from 2010-11 to 2012-13.
38

Department of Resources, Energy and Tourism Budget Statements
Table 3.1.1: Movement of Administered Funds between years (continued)1
2009-10 2010-11 2011-12 2012-13 2013-14$'000 $'000 $'000 $'000 $'000
Outcome 1: Program 4: Tourism related initiatives and management - TQUAL Grants (100) 100 - - -
Total Movement ofAdministered Funds
4. Figures displayed as a negative (-) represent a decrease in funds and a positive reflect an increase in funds.
(600,000)(29,575) 6,575 302,000 300,000
3.1.2 Special Accounts
Special Accounts provide a means to set aside and record amounts used for specified purposes. Special Accounts can be created by a Finance Minister’s Determination under the FMA Act or under separate enabling legislation.
Table 3.1.2 shows the expected additions (receipts) and reductions (payments) for each account used by the Department of Resources, Energy and Tourism.
Table 3.1.2: Estimates of Special Account Flows and Balances Opening Closingbalance Receipts Payments Adjustments balance2010-11 2010-11 2010-11 2010-11 2010-112009-10 2009-10 2009-10 2009-10 2009-10
Outcome $'000 $'000 $'000 $'000 $'0001 54,389 2,848 - - 57,237
52,385 2,004 - - 54,389
1 9,532 11,371 (11,371) - 9,532 7,937 12,913 (11,318) - 9,532
1 - - - - - - - - - -
1 - 484,107 (484,107) - - - 390,027 (390,027) - -
1 - - - - - - - - - -
Total 201
Total S200
BuildinPortfo
Ranger Rehabilit
Energ
Servicand T
Clean
Speci
S ounts 0 t estimate
s9 e actual
tr und - Energy li c ccount (A)
ation (A)
y ial Account (D)
e ther Entities ru (D)
E y tive
al u )1
66,769
60,322 404,944 (401,345) - 63,921
63,921 498,326 (495,478) - pec-11 peci-10
g Auso Spe
Spec
s for Ost Moneys
nerg
Acco
ial ABudal Aesti
ccgeccount
mat
alia Fial A
Initia
nt (A
1 d payments figures for 2009-10 includes carry-over funding from 2008-09 of $17.423 million. (A) = Administered (D) = De
. The rece
par
ipts
tme
an
ntal
39

Department of Resources, Energy and Tourism Budget Statements
3.1.3 Australian Government Indigenous Expenditure
Table 3.1.3: Australian Government Indigenous Expenditure Outcome Other Total Program
Bill Bill Special
Appropriations
TotalNo. 1 No. 2 approp approp
$'000 $'000 $'000 $'000Department of Resources, Energy and Tourism
Outcome 1
Indigenous Communities/Mining Industry Working in Partnership ProgramDepartmental 2010-11 500 - - 500 - 500 2Departmental 2009-10 500 - - 500 - 500Total outcome 2010-11 500 - - 500 - 500Total outcome 2009-10 500 - - 500 - 500
Total AGIE 2010-11 500 - - 500 - 500
Total AGIE 2009-10 500 - - 500 - 500
$'000 $'000
40

Department of Resources, Energy and Tourism Budget Statements
3.2 BUDGETED FINANCIAL STATEMENTS
3.2.1 Differences in agency resourcing and financial statements
The differences between the agency resourcing and financial statements relate primarily to the recognition of special account information. The Ranger Rehabilitation special account is currently not recorded in the financial statements due to its nature.
3.2.2 Analysis of budgeted financial statements
The financial framework upon which the financial statements are based has not changed significantly since the 2009-10 Budget.
The main changes noted in the departmental financial statements relate to a reduction in the departmental appropriation in 2010-11 from 2009-10. There are a number of factors causing this reduction including initiatives concluding, and program management funds being reduced due the program management cycle.
The main changes noted in the administered financial statements relate to the following:
• expenditure increasing in each year to 2011-12 due to the funding profiles of the programs under the Clean Energy Initiative being heavily weighted in these years;
• expenditure decreasing from 2012-13 onwards due to the cessation of funding to the Australian Solar Institute and the GCCSI; and
• the approved movement of funds between financial years due to the reprioritisation of the Department’s priorities. These movements can be found in Table 3.1.1.
41

Department of Resources, Energy and Tourism Budget Statements
3.2.3 Budgeted financial statements tables
Table 3.2.1 Comprehensive Income Statement (Showing Net (for the period ended 30 June)
Cost of Services)
Estimated Budget Forward Forward Forwardactual estimate estimate estimate estimate
2009-10 2010-11 2011-12 2012-13 2013-14
$'000 $'000S
3 32,805 27,737 8 44,922 40,564
,000 1,000 1,000 1,000 1,000 170 170* 170* 170* 170*
otal expenses 96,732 91,133 91,981 78,897 69,471
O
Gains210 210 210 210 210
Total gains 210 210 210 210 210
services 86, 81,422* 82,097* 69,013* 59,587*
Revenue from Government 86, 81,252 81,927 68,843 59,417
Surplus (Deficit) ( (170) (170) (170) (170) Surplus (Deficit) attributable to
the Australian Government
Total comprehensive income attributable to the Australian
$'000 $'000 $'000EXPEN ESEmployee benefits 43,770 38,350 40,76 Supplier expenses 51,792 51,613 50,04 Grants 1 Depreciation and amortisation T
LESS: OWN-S URCE INCOMERevenue
Sale of goods and rendering of services 9,593 9,501 9,674 9,674 9,674
Total revenue 9,593 9,501 9,674 9,674 9,674
Other
Total own-source income 9,803 9,711 9,884 9,884 9,884
Net cost of (contribution by)
929
759
170)
Government (170) (170)* (170)* (170)* (170)*
*Note: Reconciliation of operating result attributable to the agency2009-10 2010-11 2011-12 2012-13 2012-13
$'000 $'000 $'000 $'000 $'000Operating result attributable to the
Australian Government
plus non-appropriated expensesdepreciation and amortisation expenses
Operating result attributable to theAgency
170
(170) (170)* (170)* (170)* (170)*
-
(170) (170) (170) (170) (170)
170 170 170 170
- - - -
Prepared on Australian Accounting Standards basis.
42

Department of Resources, Energy and Tourism Budget Statements
3.2.3 Budgeted financial statements tables (continued)
Table 3.2.2: Budgeted departmental balance sheet (as at 30 June) Estimated
tualBudget Forward Forward Forward
ac estimate estimate estimate estimate2009-10 2010-11 2011-12 2012-13 2013-14
$' $'000 $'000 $'000 $'000ASSETSFinancial assets
Cash and equivalents 562 562 562 562Trade and other receivables 24, 25,786 25,786 25,786 25,786
Total financial assets 25, 26,348 26,348 26,348 26,348
Non-financial assetsBuildings 1,558Property, plant 1,938Intangibles 983Prepayments 189 189 189 189
Total non-financial assets 5, 5,178 5,008 4,838 4,668Total assets 30, 31,526 31,356 31,186 31,016
LIABILITIESPayables
Other 16, 16,894 16,894 16,894 16,894Total payables 16, 16,894 16,894 16,894 16,894
ProvisEmpl 2,490
Total prov 490Total liabilities 29,384 29,384 29,384
1,384 2,142 1,972 1,802 1,632
EQUITY*Parent entity interest
Contributed equity 3,371 4,299 4,299 4,299 4,299Retained surplus
(accumulated deficit)Total equity 1,384 2,142 1,972 1,802 1,632
(2,667) (1,987) (2,157) (2,327) (2,497)
000
562858420
1,558 1,558 1,558 1,558 and equipment 2,618 2,448 2,278 2,108
983 983 983 983189348768
894894
ionsoyee provisions 12,490 12,490 12,490 12,490 1
isions 12,490 12,490 12,490 12,490 12,29,384 29,384
Net assets
* 'Equity' is the residual interest in assets after deduction of liabilities. Prepared on Australian Accounting Standards basis.
43

Department of Resources, Energy and Tourism Budget Statements
3.2.3 Budgeted financial statements tables (continued)
Table 3.2.3: Departmental statement of changes in equity — summary of movement (Budget year 2010-11)
Retained Asset Other Contributed Totalearnings revaluation reserves equity/ equity
reserve capital$'000 $'000 $'000 $'000 $'000
Opening balance as at 1 July 2010Balance carried forward from
previous periodAdjusted opening balance (1,987) - - 3,371 1,384
Surplus (deficit) for the period (170) - - - (170)
Total comprehensive incomerecognised directly in equity
Transactions with ownersContributions by owners
Appropriation (equity injection) - - - 928 928Sub-total transactions with owners - - - 928 928
Estimated closing balanceas at 30 June 2011
1,384
(2,157) - - 4,299 2,142
(1,987) -
3,371 1,214
-
(2,157) - -
3,371
Prepared on Australian Accounting Standards basis.
44

Department of Resources, Energy and Tourism Budget Statements
3.2.3 Budgeted financial statements tables (continued)
Table 3.2.4: Budgeted departmental statement of cash flows (for the period ended 30 June)
Estimated Budget Forward Forward Forwardactual estimate estimate estimate estimate
2009-10 2010-11 2011-12 2012-13 2013-14$'000 $'000 $'000 $'000 $'000
OPERATING ACTIVITIES receCash ived
Go nd services 9,593 9,501 9,674 9,674 9,674ods a
useploy
Suppliers 51,582 51,403 49,838 44,712 39,150Other 1,000 1,000 1,000 1,000 1,000
Total cash used 96,352 90,753 91,601 78,517 69,108Net cash from (used by)
operating activities
INVESTING ACTIVITIESCash used
Purchase of property, plant and equipment
Total cash used 1,778 - - - -Net cash from (used by)
investing activities
FINANCING ACTIVITIESCash received
Capital Injections 850 928 - - -Total cash received 850 928 - - -Net cash from (used by)
financing activities
Net increase (decrease)in cash heldCash and cash equivalents at the
beginning of the reporting periodCash and cash equivalents at the
end of the reporting period
562
-
562
562 562 562 562 562
562 562 562
-
-
- - - - -
850 928 -
-
(1,778) - -
-
-
-
1,778 - - - -
928 (928)
Appropriations 87,687 80,324 81,927 68,843 59,434l casTota h received 97,280 89,825 91,601 78,517 69,108
Cash dEm ees 43,770 38,350 40,763 32,805 28,958
Prepared on Australian Accounting Standards basis.
45

Department of Resources, Energy and Tourism Budget Statements
46
3.2.3 Budgeted financial statements tables (continued)
Table 3.2.5: Departmental Capital Budget Statement Estimated Budget Forward Forward Forward
actual estimate estimate estimate estimate2009-10 2010-11 2011-12 2012-13 2013-14
$'000 $'000 $'000 $'000 $'000CAPITAL APPROPRIATIONS
Capital budget - Bill 1 (DCB) 850 - - - - Equity injections - Bill 2 - 928 - - - Previous years' outputs - Bill 2 2,330 - - - -
Total capital appropriations 3,180 928 - - -
Total new capital appropriationsRepresented by:
Purchase of non-financial assets 850 - - - - Other Items 2,330 928 - - -
Total Items 3,180 928 - - -
PURCHASE OF NON-FINANCIALASSETS
Funded internally from
departmental resourcesTOTAL 1,778 - - - -
RECONCILIATION OF CASHUSED TO ACQUIRE ASSETSTO ASSET MOVEMENT TABLE
Total purchases 1,778 - - - - Total cash used to
acquire assets
-
1,778 - - - -
1,778 - - -
Prepared on Australian Accounting Standards basis.

47
Departm
ent of Resources, E
nergy and Tourism
Budget Statem
ents
47
3.2.3 Bud te ti
Table 3.2.6: M
geted financial sta
Statement of Asset
ments tables (con
ovements (2010-11) Buildings Other
eq$'000
nt andpment$'000 $'000
plaui
00$' 0As at 1 July 20Gross book valu 71Accumulated de
and impairmeOpening net b 15
Depreciation/am
10e preciation/amortisation nt
ook balance
ortisation expense
1,636
1,558
-
3,035 1,046
2,618 983
5,
5,
7
9
(170) - (170)
As at 30 June 2Gross book valu 71Accumulated de
and impairme
Closing net bo 98
28
58
1,636
1,558
(78)
(78)
3,035 1,046
2,448 983
(417) (63)
(587) (63)
5,
4,
(7
(5
7
9
)
)
011epreciation/amortisationnt
ok balance Prepared on Aus d
tralian Accounting Standar s basis.
nued)
perty, Intangiblespro otaT l

Department of Resources, Energy and Tourism Budget Statements
3.2.3 Budgeted financial statements tables (continued)
Table 3.2.7: Schedule of budgeted income and expenses administered on behalf of Government (for the period ended 30 June)
Estimated Budget Forward Forward Forwardactual estimate estimate estimate estimate
2009-10 2010-11 2011-12 2012-13 2013-14
Taxation revenue
- 12,500 6,369 - -
3,556Total revenues administered
on behalf of Government
21,600 16,600 16,600 16,600 16,600Supplier expenses 10,072 11,542 3,931 16 -
1,053,7311,318,085 1,158,470 1,078,313 1,144,944
$'000 $'000 $'000 $'000 $'000INCOME ADMINISTERED ON
BEHALF OF GOVERNMENTRevenue
Other 175 175 175 175 175Total taxation revenue 175 175 175 175 175
Non-taxation revenueIndustry contributionsInterest and dividends 15,167 24,495 24,739 24,999 25,276Royalties and fees 1,301,143 1,119,700 1,045,430 1,118,170 1,026,680Other 1,600 1,600 1,600 1,600 1,600
Total non-taxation revenue 1,317,910 1,158,295 1,078,138 1,144,769 1,05
on behalf of Government
Total income administered1,318,085 1,158,470 1,078,313 1,144,944 1,053,731
EXPENSES ADMINISTERED ONBEHALF OF GOVERNMENTGrants 659,974 788,469 856,347 744,090 527,860Royalties and fees
Depreciation and amortisation 1,000 1,000 1,000 1,000 1,000CAC Act body payment item 141,622 122,920 133,385 135,067 137,016
Total expenses administeredon behalf of Government
682,476834,268 940,531 1,011,263 896,773
Prepared on Australian Accounting Standards basis.
48

Department of Resources, Energy Tourism Budget Statements
3.2.3 Budgeted financial statements tables (continued)
Table 3.2.8: Schedule of budgeted assets and liabilities administered on behalf of Government (as at 30 June)
Estimated Budget Forward Forward Forwardactual estimate estimate estimate estimate
2009-10 2010-11 2011-12 2012-13 2013-14000
Receivables 52,524 48,829 44,890 40,691 36,215381,410 394,591 381,410 381,410 381,410124,675 124,675 124,675 124,675 124,675
141 141 141 141 141Property, plant and equipment 88 88 88 88 88
84 2,084 1,0842,313 1,313
LIABILITIES ADMINISTERED ON BEHALF OF GOVERNMENT
PayablesGrants 44,989 44,989 44,989 44,989 44,989Other 5,637 5,637 5,637 5,637 5,637
Total payables 50,626 50,626 50,626 50,626 50,626Total liabilities administered
on behalf of Government
543,613
50,626 50,626 50,626 50,626 50,626
408 554,288 549,089
$'000 $'000 $'000 $'000 $'ASSETS ADMINISTERED ON
BEHALF OF GOVERNMENTFinancial assets
Investments Other
Total financial assets 558,609 568,095 550,975 546,776 542,300
Non-financial assetsLand and buildings
Intangibles 5,084 4,084 3,05,313 4,313 3,313Total non-financial assets
Total assets administered on behalf of Government
563,922 572,
Prepared on Australian Accounting Standards basis.
49

Department of Resources, Energy and Tourism Budget Statements
3.2.3 Budgeted financial statements tables (continued)
Table 3.2.9: Schedule of budgeted administered cash flows (for the period ended 30 June)
Estimated Budget Forwardactual estimate estimate
Forward Forwardestimate estimate
20,800 20,800399 1,119,770 1,028,280
Grants, royalties and fees 690,133 812,429 872,947 760,690 544,460
922,141 707,844 from (used by)
operating activities 481,350 215,244 64,111 244,972 367,779
ecrease) in held
Cash and cash equivalents atbeginning of reporting period
Cash from Official Public Account for:- Appropriations 534,445 596,293 280,573 278,101 179,034- Special Accounts 332,502 380,790 756,058 644,040 528,810
Cash to Official Public Account for:- Appropriations 1,348,297 1,179,146 1,100,742 1,167,113 1,075,623 and cash equivalents at end
of reporting period
367,779
- - - - -
- - - - -
481,350 202,063 64,111 244,972
2009-10 2010-11 2011-12 2012-13 2013-14$'000 $'000 $'000 $'000 $'000
OPERATING ACTIVITIESCash received
Taxes 175 175 175 175 175Interest and dividends 11,700 20,800 20,800Royalties and fees 1,302,743 1,133,800 1,053,GST received 34,679 24,371 26,368 26,368 26,368
Total cash received 1,349,297 1,179,146 1,100,742 1,167,113 1,075,623
Cash used
Suppliers 1,513 4,182 3,931 16 -GST paid 34,679 24,371 26,368 26,368 26,368
CAC Act body payment item 141,622 122,920 133,385 135,067 137,016
Total cash used 867,947 963,902 1,036,631Net cash
INVESTING ACTIVITIESCash used
CAC Act body investments - 13,181 - - -Total cash used - 13,181 - - -Net cash from (used by)
investing activities - (13,181) - - -
Net increase (d cash
Cash
repared on Australian Accounting Standards basis. P
50

Department of Resources, Energy Tourism Budget Statements
51
les (continued) 3.2.3 Budgeted financial statements tab
Table 3.2.10: Schedule of Asset Movements - Administered Buildings Other Intangibles Total
property,
plant and
equipment
$'000 $'000 $'000 $'000
As at 1 July 2010
Gross book value 154 149 15,000 15,303Accumulated depreciation/amortisation and
impairment
Opening net book balance 141 88 5,084 5,313
Other movements
Depreciation/amortisation expense - -
As at 30 June 2011
Gross book value 154 149 15,000 15,303Accumulated depreciation/amortisation and
impairment
Closing net book balance 141 88 4,084 4,313
(1,000) (1,000)
(13) (61) (10,916) (10,990)
(13) (61) (9,916) (9,990)
Prepared on Australian Accounting Standards basis.
3.2.4 Notes to the financial statements
Accounting Policy
The agency budget statements have been prepared on an accrual accounting basis in accordance with:
• the Finance Minister's Orders; and
• the Australian Accounting Standards and Interpretations issued by the Australian Accounting Standards Board (AASB).


53
Geoscience Australia
Agency resources and planned performance


55
.......................................57 1.1 Strategic Direction Statement.........................................................................57 .2 Agency Resource Statement..........................................................................59 .3 Budget Measures............................................................................................60
Section 2: Outcomes and planned performance .....................................................61 2.1 Outcomes and performance information ........................................................61
Section 3: Explanatory tables and budgeted financial statements .......................65 3.1 Explanatory tables ..........................................................................................65 3.2 Budgeted Financial Statements...................................................................... 67
GEOSCIENCE AUSTRALIA
Section 1: Agency overview and resources......................
11


Geoscience Australia Budget Statements
GEOSCIENCE AUSTRALIA
Section 1: Agency overview and resources
1.1 STRATEGIC DIRECTION STATEMENT
Australia assists the Australian Government and the community to make informed decisions about the discovery and development of mineral and energy
crit ture. Geoscience Australia also encompasses the Office of Spatial Data Management which is responsible for coordinating the implementation of the
ation systems, and conducting regional
Offshore activities focus on providing pre-competitive data and information to assist in identifying prospective frontier basins for petroleum exploration, and the geological storage of carbon dioxide, in Australia’s offshore jurisdiction. Activities undertaken also include mapping and documentation of Australia’s maritime boundaries, including assessment under the UN Convention on the Law of the Sea. It also includes studies of the marine environment using seabed mapping techniques and determining estuarine water quality and health. These studies assist natural resource management.
Spatial information activities focus on providing key spatial information of Australia with an emphasis on defining the National Geospatial Reference System as the fundamental coordinate system against which all measurements of position are made, and supporting response to rapid and slow onset hazards, the detection of change, the requirements for emergency management, natural risk assessment and marine zone management. Activities undertaken also include coordination of the implementation of the Australian Government’s policy on spatial data access and pricing.
Geoscience
resources; management of the environment; community safety and protection of ical infrastruc
Australian Government’s policy on spatial data access and pricing.
Geoscience Australia’s activities cover three broad areas: onshore, offshore and spatial information.
Onshore activities focus on enhancing mineral and energy resource exploration and environmental land-use planning. This will be met through the production of geoscience maps, databases and informgeological and mineral and energy systems research. Activities undertaken also include: contributing to safer communities and critical infrastructure protection; and the maintenance of fundamental gravity, geomagnetic and seismic networks.
57

Geoscience Australia Budget Statements
Geoscience Australia will receive additional resourcing of $65.3 million over the forward estimates period. The resourcing will strengthen the agency’s role in relation
ge elivering its current work program.
Key priorities for Geoscience Australia in 2010-11 will be to:
1. Promote the petroleum prospectivity of Australia. In particular, provide scientific and technical support to Government for the 2011 offshore petroleum acreage release which includes the Perth Basin;
2. As part of the Offshore Energy Security Program, complete interpretation of data from south-west frontiers of Western Australia to assess hydrocarbon potential, and complete the assessment of the petroleum potential of remote eastern frontier basins;
3. As part of the Onshore Energy Security Program, acquire and interpret regional geological, geochemical and geophysical datasets to better assess Australia’s potential for new petroleum, geothermal, uranium and thorium resources;
4. Provide technical advice to Government in relation to uranium, thorium and petroleum prospectivity development/geothermal energy and groundwater;
5. Identify and document regions for geological storage of carbon dioxide to support Climate Change adaptation, including offshore acreage release and assessment including working with States/NT to acquire pre-competitive data for storage;
6. In association with the Attorney-General’s Department, continue developing the Critical Infrastructure Protection Modelling and Analysis capability and apply it to analyse tasks addressing interdependencies and potential failures for the Energy, Banking & Finance, Communications, Water and Transport sectors;
7. Deliver the agreed program for national topographical mapping;
8. Deliver a national ground control point dataset at 2.5 metre resolution and reference images, allowing any remotely sensed image to be accurately and consistently geo-referenced, anywhere on the Australian continent; and
9. Operate and maintain national real time observatory networks to support community safety.
Information on Geoscience Australia’s programs and activities is available on the agency’s website at http://www.ga.gov.au
to carbon capture and storage, support the Government in meeting its climate chanpolicies and assist the agency in d
.
58

Geoscience Australia Budget Statements
1.2 AGENCY RESOURCE STATEMENT
Table 1.1 shows the total resources from all sources. The table summarises how lied by outcome and by administered and departmental
r Geoscience Australia for
Table 1.1: Geoscience Australia Resource Statement — Budget Estimates for
resources will be appascl sification. The total departmental appropriation fo
2010-11 is $116.221 million.
2010-11 as at Budget May 2010 Estimate Proposed Total Actual
of prior + at Budget = eyear amounts
stimate availableappropriation
available in2010-11 2010-11 2010-11 2009-10
$'000 $'000 $'000 $'000Ordinary annual services1
Departmental appropriationDepartmental appropriation2
- 116,201 116,201 130,058s31 Relevant agency receipts3
- 39,736 39,736 39,034Total - 155,937 155,937 169,092
Administered expensesUN Grants-in-aid - 20 20 20
Total - 20 20 20
Total ordinary annual services A - 155,957 155,957 169,112
Total available annual appropriations - 155,957 155,957 169,112
Total appropriations excluding Special Accounts - 155,957 155,957 169,112
Special AccountsOpening balance4
- 1,009 1,009 1,009Appropriation receipts - 20 20 20
Total Special Account B - 1,029 1,029 1,029
Total resourcingA+BLess appropriations drawn from
annual or special appropriations aboveand credited to special accountsand/or CAC Act bodies through annual appropriations
Total net resourcing for Geoscience Australia - 156,966 156,966 170,1211 Appropriation Bill (No.1) 2010-112 Includes an amount of $6.577m in 2010-11 for the Departmental Capital Budget (refer to table
3.2.5 for further details). For accounting purposes this amount has been designated as contributions by owners'3 s31 Relevant Agency receipts - estimate4 Estimated opening balance for special accounts (less ‘Special Public Money’ held in accounts like
Other Trust Monies (OTM) and Services for other Government and Non-agency Bodies (SOG)accounts). For further information on special accounts see Table 3.1.2.Reader note: All figures are GST exclusive.
- (20) (20) (20)
- 156,986 156,986 170,141
59

Geoscience Australia Budget Statements
1.3 B DGET MEASURES U
Budget Paper No. 2
Table 1.2: Geoscience Australia 2010-11 Budget measures
Budget measures relating to Geoscience Australia are detailed inlow. and are summarised be
Program 2009-10 2010-11 2011-12 2012-13 2013-14$'000 $'000 $'000 $'000 $'000
Expense measures
Geoscience Australia - additional resourcing 1
Departmental expenses - 5,000 24,344 25,769 10,180 Total - 5,000 24,344 25,769 10,180
Total expense measuresDepartmental - 5,000 24,344 25,769 10,180
Total - 5,000 24,344 25,769 10,180 Prepared on a Government Financial Statistics (fiscal) basis.
60

Geoscience Australia Budget Statements
Sect on 2: Outcomes and planned performani ce
.1 OUTCOMES AND PERFORMANCE INFORMATION
Government outcomes are the intended results, impacts or consequences of actions by the Government on the Australian community. Commonwealth programs are the primary vehicle by which government agencies achieve the intended results of their outcome statements. Agencies are required to identify the programs which contribute to Government outcomes over the Budget and forward years.
Each outcome is described below together with its related programs, specifying the performance indicators and targets used to assess and monitor the performance of Geoscience Australia in achieving Government outcomes.
2
Outcome 1: Informed government, industry and community decision on the economic, social and environmental management of the nation’s natural resources through enabling access to geoscientific and spatial information.
Outcome 1 Strategy
Geoscience Australia assists the Government and the community it serves to make appropriate and informed decisions about the use of resources, and also the management of the environment, community safety and protection of critical infrastructure. This is done by undertaking geoscientific research and maintaining, developing and allowing, and encouraging access to our fundamental geoscientific data.
61

Geoscience Australia Budget Statements
Outcome Expense and Resource Statement
Table 2.1 provides an overview of the total expenses for Outcome 1, by program.
Table 2.1: Budgeted Expenses and Resources for Outcome 1
Outcome 1: Informed government, industry and community decisions on the economic, social and environmental management of the nation's natural resources through enabling access to geoscientific and spatial information.
2009-10 2010-11
Estimated Estimatedactual expenses
expenses$'000 $'000
Program 1: Geoscientific and spatial information servicesAdministered expenses
Ordinary annual services (Appropriation Bill No. 1) 20 20Departmental expenses
Ordinary annual services (Appropriation Bill No. 1) 130,058 116,201Revenues from independent sources (s31) 39,034 39,736
Total for Program 1 169,112 155,957
Outcome 1 Totals by appropriation typeAdministered Expenses
Ordinary annual services (Appropriation Bill No. 1) 20 20Departmental expenses
Ordinary annual services (Appropriation Bill No. 1) 130,058 116,201Revenues from independent sources (s31) 39,034 39,736
Total expenses for Outcome 1 169,112 155,957
2009-10 2010-11Average Staffing Level (number) 706 678 Note: Departmental appropriation splits and totals are indicative estimates and may change in the course of the budget year as government priorities change.
62

Geoscience Australia Budget Statements
Contributions to Outcome 1
Program 1: Geoscientific and spatial information services
Program 1 objective
Geoscience Australia assists the Government and the community it serves to make appropriate and informed decisions about the use of resources, and also the
mental geoscientific data.
management of the environment, community safety and protection of criticalinfrastructure. This is done by undertaking geoscientific research and maintaining, developing and allowing, and encouraging access to our funda
Program 1 Expenses
It is anticipated that employee and supplier expenditure will contract over the forward years as appropriation funding declines.
Program 1 Expenses 2009-10 2010-11 2011-12 2012-13 2013-14Revised Budget Forward Forward Forward
('000) budget year 1 year 2 year 3
Annual administered expenses:Grants 20 20 20 20 2
Annual departmental expenses:Employees 72,008 80,382 78,992 84,326 64,248Suppliers 89,732 75,232 74,852 71,895 76,934
Expenses not requiring appropriation inthe Budget year 7,365 7,670 7,002 6,232 5,999
Total program expenses 169,125 163,305 160,865 162,472 147,201
0
Program 1 Deliverables
Informed government, industry and community decisions on the economic, social and environmental management of the nation’s natural resources through enabling access to geoscientific and spatial information.
63

Geoscience Australia Budget Statements
Contributions to Outcome 1 (continued)
Program 1 Key Performance Indicators
• Technical advice provided to the government is used in policy development and
• Information provided to minerals, petroleum and energy sector influences p
Geoscience Australia information for environmental, economic
• Stewardship of the geographic and geological data and knowledge of the nation
decision making.
ex loration companies’ behaviour.
• Stakeholders useand social purposes.
is enhanced.
64

Geoscience Australia Budget Statements
Section 3: Explanatory tables and budgeted financial statements
Section 3 presents explanatory tables and b geted financial statements which provide a comprehensive snapshot of agency finances for the 2010-11 budget year. It explains how budget plans are incorporated into th ancial statements and provides further details of the reconciliation between tions and program expenses, movements in administered funds, special accounts and government indigenous expenditure.
3.1 EXPLANATORY TABLES
3.1
Geo d 2010-11.
3.1.2 Special Accounts
Special Accounts provide a means to set aside and record amounts used for specified purposes. Special Accounts can be create by a Finance Minister’s Determination under the FMA Act or under separate enabling legislation. Table 3.1.2 shows the expected additions (receipts) and reducti s (payments) for each account used by Geoscience
Table
ud
e finappropria
.1 Movement of administered funds between years
science Australia has no movement in administered funds between 2009-10 an
d
on Australia.
3.1.2: Estimates of Special Account Flows and Balances Openingbalance Receipts Pay
Closingments Adjustments balance
2010-11 2010-11 2010-11 2010-11 2010-112009-10 2009-10 2009-10 2009-10 2009-10
Outcome $'000 $'000 $'000 $'000 $'000
99 282 (282) - 99
99 282 (282) - 910
910 575 (575) - 910
910 575 (575) - 910
Total Special Accounts 2010-11 Budget estimate 1,009 857 (857) - 1,009
Total Special Accounts2009-10 estimate actual 1,009 857 (857) - 1,009
1 Joint Australian U.S. Geological and Geophysical Special Account - s20 FMA Act (A)
Australia New Zealand Land Information - s20 FMA Act (A)
1
(A) = Administered (D) = Departmental
65

Geoscience Australia Budget Statements
3.1.2 Special Accounts (continued)
FMA Act Section 20 Determination 2009/33 abolished the Australian Geological Survey Organisation (AGSO) Special Account. This Determination varied the AGSO Account to allow its balance to be credited to the new Joint Australian U.S. Geological and Geophysical Special Account.
FMA Act Section 20 Determination 2009/34 established the Joint Australian U.S. Geological and Geophysical Special Account. This Determination established a special account for Geoscience Australia to manage funds used to pay the operating costs of the Joint Australian U.S. Geological and Geophysical Research Station (JGGRS) at Alice Springs.
3.1.3 Australian Government Indigenous Expenditure
The 2010-11 Australian Government Indigenous Statement is not applicable because Geoscience Australia has no indigenous specific expenses.
66

Geoscience Australia Budget Statements
3.2 B
3.2.1 Differences in agency nancial statements
2 A
l rev$13.158 million from 2009-10 which was offset by new funding to sustain geoscientific activities and additional revenues from externally funded projects. A review of Geoscience Australia’s programs and funding will be undertaken in 2010-11.
Total expenses for 2010-11 are budgeted at $163.284 million.
Employee benefits and supplier expenses comprise the largest components of expenditure at $80.382 million and $75.232 million respectively. Both components have been impacted by an increase in estimated employee numbers in 2010-11 from the previous estimates round as a consequence of the factors detailed above.
The total budgeted deficit for 2010-11 is $7.337 million. This amount represents depreciation and amortisation expenditure which is no longer funded following the implementation of the Commonwealth’s net cash appropriation framework.
Budgeted Assets and Liabilities
Geoscience Australia’s budgeted total asset position for 2010-11 is $84.702 million.
Budgeted total liabilities for 2010-11 are $45.361 million, an increase of $1.784 million over the estimated actual position for 2009-10.
Employee provisions continue to be Geoscience Australia’s primary liability, increasing to $28.722 million in 2010-11.
Budgeted capital expenditure
Planned capital expenditure for Geoscience Australia for 2010-11 is $9.517 million. This is comprised of estimated capital of $6.577 million funded from the departmental capital budget and $2.940 million funded from equity injections.
UDGETED FINANCIAL STATEMENTS
resourcing and fi
No significant differences exist between Geoscience Australia’s agency resourcing and lfinancia statements.
3.2. nalysis of budgeted financial statements
Departmental
Budgeted Income and Expenses
Geoscience Australia has a balanced budget for 2009-10 and 2010-11.
Tota enues for 2010-11 are budgeted at $155.947 million. This reflects a decrease of
67

Geoscience Australia Budget Statements
3.2.2 Analysis of budgeted financial statements (continued)
Administered
Budgeted Income and Expenses
Geoscience Australia will make one payment on behalf of government in 2010-11 being a grant of $0.020 million to the International Geological Correlation Program.
Budgeted Assets and Liabilities
In addition, Geoscience Australia administers two Special Accounts. These include the following:
- the Joint Australian U.S. Geological and Geophysical (JGGRS) Account; and
- the Australian New Zealand Land Information Account (ANZLIC).
The JGGRS Special Account was established in 2009-10 following the abolition of the Australian Geological Survey Organisation Special Account as described above.
The budgeted total administered asset position for 2010-11 of $0.910 million is unchanged from the estimated actual position for 2009-10 and represents the cash holdings of the ANZLIC Special Account.
The budgeted total administered liabilities for 2010-11 of $0.910 million is unchanged from the estimated actual position for 2009-10 and represents the cash holdings of the ANZLIC Special Account.
68

Geoscience Australia Budget Statements
3.2.3 B
Table 3.2.1 Comprehensive Inco wing Net Cost of Services) (for the period ended 30 June)
udgeted financial statements tables
me Statement (Sho
Estimated Budget Forward Forward Forwardactual estimate estimate estimate estimate
2009-10 2010-11 2011-1$'000 $'000 $'00
2 2012-13 2013-140 $'000 $'000
EXPENSESEmployee benefits 72,008 80,382 78,992 84,326 64,248
232 74,852 71,895 76,934 670 7,002 6,232 5,999
Sale of goods and rendering of services 39,034 39,736 40,491 41,261 42,044 39,034 39,736 40,491 41,261 42,044
Gains
13 10 10 10 10 39,047 39,746 40,501 41,271 42,054
Revenue from Government 130,058 116,201 113,750 115,559 99,893
- (7,337) (6,595) (5,623) (5,234)
- (7,337) (6,595) (5,623) (5,234)
2011-12 2012-13 2012-13$'000 $'000 $'000
Operating result attributable to the
Supplier expenses 89,732 75, Depreciation and amortisation 7,365 7, Total expenses 169,105 163,284 160,846 162,453 147,181
LESS: OWN-SOURCE INCOMERevenue
Total revenue
Sale of assets 13 10 10 10 10 Total gainsTotal own-source income
Net cost of (contribution by)
services (130,058) (123,538) (120,345) (121,182) (105,127)
Surplus (Deficit) - (7,337) (6,595) (5,623) (5,234) Surplus (Deficit) attributable to
the Australian Government
Total comprehensive income attributable to the Australian Government
Note: Reconciliation of operating result attributable to the agency2009-10 2010-11
$'000 $'000
Australian Government - (7,337) (6,595) (5,623) (5,234)
plus non-appropriated expensesdepreciation and amortisation expenses - 7,337 6,595 5,623 5,234
Operating result attributable to theAgency - - - - -
Prepared on Australian Accounting Standards basis.
69

Geoscience Australia Budget Statements
3.2.3 Budgeted financial statements tables (continued)
Table 3.2.2: Budgeted departmental balance sheet (as at 30 June)
Estimated Budget Forward Forward Forwardactual estimate estimate estimate estimate
Financial assets
her receivables 32,055 37,526 39,062 41,254 43,2852,848 2,848 2,848 2,848 2,848
10,068 9,427 8,787 8,154 7,544
173 173 173 173 173Other 3,406 3,406 3,406 3,406 3,406
LIABILITIES
56 56 56 56 566,854 6,854 6,854 6,854 6,854
019 42,284Total liabilities 43,578 45,361 46,117 47,929 49,194
37,161 39,341 38,036 37,213 36,356
EQUITY*arent entity interestContributed equity 5,644 15,161 20,451 25,250 29,626Reserves 4,656 4,656 4,656 4,656 4,657Retained surplus 26,861 19,524 12,929 7,307 2,073
(accumulated deficit)al parent entity interest 37,161 39,341 38,036 37,213 36,356
Total equity 37,161 39,341 38,036 37,213 36,356
2009-10 2010-11 2011-12 2012-13 2013-14$'000 $'000 $'000 $'000 $'000
ASSETS
Cash and equivalents 2,820 2,406 2,033 2,263 2,263Trade and otOther
Total financial assets 37,723 42,780 43,943 46,365 48,396
Non-financial assetsLand and buildingsProperty, plant and equipment 28,021 27,970 26,687 25,884 24,696Intangibles 1,348 946 1,157 1,160 1,335Inventories
Total non-financial assets 43,016 41,922 40,210 38,777 37,154Total assets 80,739 84,702 84,153 85,142 85,550
PayablesSuppliersOther
Total payables 6,910 6,910 6,910 6,910 6,910
ProvisionsEmployee provisions 26,938 28,721 29,477 31,289 32,554Other 9,730 9,730 9,730 9,730 9,730
Total provisions 36,668 38,451 39,207 41,
Net assets
P
Tot
'Equity' is the residual interest in assets after deduction of liabilities.
Prepared on Australian Accounting Standards basis. *
70

Geoscience Australia Budget Statements
3.2.3 Budgeted financial statements tables (continued)
Table 3.2.3: Departmental statement of changes in equity — summary of movement (Budget year 2010-11)
Retained Asset Other Contributed Totalearnings revaluation reserves equity/ equity
reserve capital
4,656 - 5,644 37,161
)
uity 19,524 4,656 - 5,644 29,824
Appropriation (equity injection) - - - 2,940 2,940
capital budget) - - - 6,577 6,577Sub-total transactions with owners - - - 9,517 9,517Estimated closing balance
as at 30 June 2011 19,524 4,656 - 15,161 39,341
$'000 $'000 $'000 $'000 $'000Opening balance as at 1 July 2010
Balance carried forward from 26,861 4,656 - 5,644 37,161previous period
Adjusted opening balance 26,861
Surplus (deficit) for the period (7,337) - - - (7,337
Total comprehensive incomerecognised directly in eq
Transactions with ownersContributions by owners
Appropriation (departmental
Prepared on Australian Accounting Standards basis.
71

Geoscience Australia Budget Statements
3.2.3 Budgeted financial statements tables (continued)
(for the period ended 30 June) Table 3.2.4: Budgeted departmental statement of cash flows
Estimated Budget Forward Forward Forwardactual estimate estimate
2009-10 2010-11 2011-12estimate estimate2012-13 2013-14
$'000 $'000 $'000 $'000 $'000
(3,354) (373) 230 -
Purchase of property, plant and equipment 10,204 6,577 5,290 4,799 4,376
10,204 6,577 5,290 4,799 4,376
5,290 4,799 4,376
Net increase (decrease)in cash held - (414) (373) 230 - Cash and cash equivalents at the
beginning of the reporting period 2,820 2,820 2,406 2,033 2,263Cash and cash equivalents at the
end of the reporting period 2,820 2,406 2,033 2,263 2,263
OPERATING ACTIVITIESCash received
Goods and services 39,047 39,746 40,501 41,271 42,055Appropriations 139,280 110,731 112,215 113,366 97,862
Total cash received 178,327 150,477 152,716 154,637 139,917
Cash usedEmployees 70,841 78,598 77,104 81,616 63,265Suppliers 89,732 75,233 75,985 72,791 76,652
Total cash used 160,573 153,831 153,089 154,407 139,917Net cash from (used by)
operating activities 17,754
INVESTING ACTIVITIES
Cash used
Total cash usedNet cash from (used by)
investing activities (10,204) (6,577) (5,290) (4,799) (4,376)
FINANCING ACTIVITIESCash received
Contributed equity (7,550) 9,517 5,290 4,799 4,376Total cash received (7,550) 9,517 5,290 4,799 4,376Net cash from (used by)
financing activities (7,550) 9,517
Prepared on Australian Accounting Standards basis.
72

Geoscience Australia Budget Statements
73
les (continued) 3.2.3 Budgeted financial statements tab
Table 3.2.5: Departmental Capital Budget Statement Estimated Budget Forward Forward Forward
actual estimate estimate2009-10 2010-11 2011-12
estimate estimate2012-13 2013-14
Capital budget - Bill 1 (DCB) - 6,577 5,290 4,799 4,376 Equity injections - Bill 2 - 2,940 - - -
Total capital appropriations - 9,517 5,290 4,799 4,376
Total new capital appropriationsRepresented by:
Purchase of non-financial assets - 6,577 5,290 4,799 4,376 Other Items - 2,940 - - -
Total Items - 9,517 5,290 4,799 4,376
PURCHASE OF NON-FINANCIALASSETS
$'000 $'000 $'000 $'000 $'000CAPITAL APPROPRIATIONS
1Funded by capital appropriation - DCB - 6,577 5,290 4,799 4,376
Funded internally from
departmental resources2
TOTAL 10,204 6,577 5,290 4,799 4,376
RECONCILIATION OF CASHUSED TO ACQUIRE ASSETSTO ASSET MOVEMENT TABLE
Total purchases 10,204 6,577 5,290 4,799 4,376 Total cash used to
acquire assets 10,204 6,577 5,290 4,799 4,376
- 10,204 - - -
Prepared on Australian Accounting Standards basis.

Geoscience Australia Budget Statements
3.2.3 Budgeted financial statements tables (continued)
Table 3.2.6: Statement of Asset Movements (2010-11) Buildings Other property, Intangibles Total
plant andequipment
$'000 $'000 $'000 $'000A
2Accu
1,348 39,437
CAPITAL ASSET ADDITIONSE
annual services - 5,816 761 6,577
Total additions - 5,816 761 6,577
O
s at 1 July 2010Gross book value 14,891 52,659 13,002 80,55
mulated depreciation/amortisation and impairment
Opening net book balance 10,068 28,021
stimated expenditure onnew or replacement assets
By purchase - appropriation ordinary
ther movementsDepreciation/amortisation expense (640) (5,867) (1,163) (7,670)Othe ents r movem (1) - -
As at 30 June 201114,890 58,475 13,763 87,129
ortisation
Closing net book balance 9,427 27,970 946 38,344
(4,823) (24,638) (11,654) (41,115)
(5,463) (30,505) (12,817) (48,785)
-
Gross book valueAccumulated depreciation/am
and impairment
Prepared s. on Australian Accounting Standards basi
74

Geoscience Australia Budget Statements
3.2.3 Budgeted financial statements tables (continued)
Table 3.2.7: Schedof Government (for th
ule of budgeted income and expenses administered on behalf e period ended 30 June)
Estimated Budget Forward Forward Forwardactual estimate estimate estimate estimate
2009-10 2010-11 2011-12 2012-13 2013-14$'000 $'000 $'000 $'000 $'000
INCOME ADMINISTERED ONBEHALF OF GOVERNMENT
ue
20 20 20 20 2020 20 20 20 20
Total income administeredon behalf of Government 20 20 20 20 20
EXPENSES ADMINISTERED ONBEHALF OF GOVERNMENTGrants 20 20 20 20 20
otal expenses administeredon behalf of Government 20 20 20 20 20
RevenTaxation revenue
OtherTotal taxation revenue
T
Prepared on Australian Accounting Standards basis.
able 3.2.8: Schedule of budgeted assets and liabilities administered on behalf f Government (as at 30 June)
To
Estimated Budget Forward Forward Forwardactual estimate estimate estimate estimate
2009-10 2010-11 2011-12 2012-13 2013-14$'000 $'000 $'000 $'000
ASSETS ADMINISTEBEHALF OF GOVE
$'000RED ON RNMENT
Financial assets
OVERNMENTPayables
Other 910 910 910 910 910910 910 910 910 910
on behalf of Government 910 910 910 910 910
Cash and cash equivalents 910 910 910 910 910
Total financial assets 910 910 910 910 910
Total assets administered
on behalf of Government 910 910 910 910 910
LIABILITIES ADMINISTERED ON BEHALF OF G
Total payablesTotal liabilities administered
Prepared on Australian Accounting Standards basis.
75

Geoscience Australia Budget Statements
76
tatements tables (continued) 3.2.3 Budgeted financial s
Table 3.2.9: Schedule of budgeted administered cash flows (for the period ended 30 June)
Estimated Budget Forward Forward Forwardactual estimate estimate estimate estimate
$'000 $'000 $'000 $'000 $'000
Cash received20 20
20 20 20 20 20
20 20 20 20 20
20 20
Net increase (decrease) in cash held - - - - -
0 910 910 910Cash and cash equivalents at end
r 910
2009-10 2010-11 2011-12 2012-13 2013-14
OPERATING ACTIVITIES
Other 20 20 20
Total cash received
Cash usedGrant payments
Total cash used 20 20 20
Net cash from (used by) operating activities - - - - -
Cash and cash equivalents atbeginning of reporting period 910 91
of repo ting period 910 910 910 910Prepared on Australian Accounting Standards basis.
3.2.4 Notes to the financial statements
Accounting Policy
The agency budget statements have been prepared on an accord ith:
accrual accounting basis in ance w
• the Finance Minister's Orders; and
• the Australian Accounting Standards and Interpretations issued by the Australian Accounting Standards Board (AASB).
The Analysis of Budgeted Financial Statements at pages 75 to 76 provides an overview of the key elements of Geoscience Australia’s financial statement, including variations in major aggregates from 2009-10 to 2010-11.

National Offshore Petroleum Safety Authority
Agency resources and planned performance
77


79
es.............................................................81 .1 Strategic Direction Statement.........................................................................81
Agency Resource Statement..........................................................................83 1.3 Budget Measures............................................................................................83
Section 2: Outcomes and planned performance .....................................................84 2.1 Outcomes and performance information ........................................................84
Section 3: Explanatory tables and budgeted financial statements .......................88 3.1 Explanatory tables ..........................................................................................88 3.2 Budgeted Financial Statements......................................................................89
NATIONAL OFFSHORE PETROLEUM SAFETY
AUTHORITY
Section 1: Agency overview and resourc11.2


NOPSA Budget Statements
NATIONAL OFFSHORE PETROLEUM SAFETY
.1 STRATEGIC DIRECTION STATEMENT
The National Offshore Petroleum Safety Authority (NOPSA) regulates the health and afety of the Australian offshore petroleum industry through the Offshore Petroleum and
Greenhouse Gas Storage Act 2006.
OPSA’s legislated functions include:
• To promote the occupational health and safety of persons engaged in offshore
ligations
hat affect, or have the potential to affect, the occupational health and safety of persons engaged in offshore petroleum operations;
• To advise persons on occupational health and safety matters relating to offshore petroleum operations;
To make reports and recommendations to Ministers; and
To cooperate with a whole of government approach.
OPSA will continue to focus on its primary functions of ensuring compliance and promotion of health and safety within the offshore petroleum industry. Compliance
ill be achieved through safety case assessment and inspections of facilities, supported by investigations and, where appropriate, enforcement action. Promotion of
ccupational health and safety will be achieved by encouraging industry safety leadership, the sharing of good practice, highlighting lessons learned, and supporting
e industry’s health and safety representatives.
AUTHORITY
Section 1: Agency overview and resources
1
s
N
petroleum operations;
• To develop and implement effective monitoring and enforcement strategies to secure compliance by persons with their occupational health and safety obunder the Act and the regulations;
• To investigate accidents, occurrences and circumstances t
•
•
N
w
o
th
81

NOPSA Budget Statements
In particular, NOPSA’s work priorities will clude:
• Liaison with government and industry stakeholders on proposals for the integration of technical integrity of off ore pipelines, wells and well operations management into NOPSA’s remit;
• Enforcement actions as appropriate ar rom the Montara petroleum release incident on 21 August 2009;
• Response to matters arising from the recommendations of the various inquiries and reviews;
• Continued recruitment effort to focus on improved capability as a Regulator and refine internal processes;
• Upgrades to the NOPSA website to improve access by operators to relevant regulatory information;
• Emphasising the importance of industry leadership to emphasise a high level of managerial control around the precursors to major accident events; and
• Assistance to operators to improve the quality and rigor of their safety cases and diving project plans.
Australia’s offshore oil and gas industry is facing a period of unprecedented growth together with the challenges of major new technologies, the aging of existing facilities and increasing demand for skilled and experienced people. Unless carefully managed these challenges may impact on the safety performance of the industry.
in
sh
ising f
82

NOPSA Budget Statements
83
1.2 AGENCY RESOURCE STATEMENT
Table 1.1 shows the total resources from all sources. The table summarises how resources will be applied by outcome d by administered and departmental classification.
Resources are provided primarily by industry, through safety case levies which are determined by industry activity level an are estimated to be $14.526 million in 2010-11. In addition, NOPSA’s approp tion receipts for interest equivalency payments are estimated at $0.200 million.
Table 1.1: Nation Statement — Budget Estimates
an
d ria
al Offshore Petroleum Safety Authority Resource for 2010-11 as at Budget May 2010
Estimate Proposed Totaof r + at Budget = estimat
l Actuale available
year amo s appropriationavailabl n
201 1 2010-11 2010-11 2009-10
$' 0 $'000 $'000 $'000
Special Accounts
Opening balance1 1, 5 - 1,555 5,773
Appropriation receipts2 200 200 -
Non-
SpecTotal S 4,741
Total net resourcing for NOPSA 14,726 14,741
priounte i
0-1
00
55
-
appropriation receipts to
ial Accountspecial Account A 1,555 13,171 14,726 1
1,555 13,1711 Estimated opening balance for sp ey’ held in accounts like
Other Trust Monies (OTM) and Services for other Government and Non-agency Bodies (SOG)accounts). For further information on special accounts see Table 3.1.2.
ecial accounts (less ‘Special Public Mon
Appropriation Bill (No.1) 2010-11
8,968 - 12,971 12,971
2
1.3 BUDGET MEASURES
NOPSA does not have any new budget measures in 2010-11.

NOPSA Budget Statements
Section 2: Outcomes and planned performance
2.1 OUTCOMES AND PERFORMANCE INFORMATION
Government outcomes are the intended results, impacts or consequences of actions by the Government on the Australian community. Commonwealth programs are the primary vehicle by which government agencies achieve the intended results of their outcome statements. Agencies are required to identify the programs which contribute to Government outcomes over the Budget and forward years.
Each outcome is described below together with its related programs, specifying the performance indicators and targets used to assess and monitor the performance of NOPSA in achieving Government outcomes.
Outcome 1: An Australian oil and gas industry that properly controls the health and safety risks to the workforce at its offshore petroleum operations.
Outcome 1 Strategy
NOPSA regulates the Australian offshore petroleum industry to assist it to reduce health and safety risks to an acceptable level. It provides assurance to the government and the community as to whether industry is doing enough to ensure safety on their facilities. It conducts inspections and audits to determine compliance with requirements and undertakings and in the event of accidents or incidents NOPSA investigates and takes appropriate enforcement action.
84

NOPSA Budget Statements
Outcome Expense and R
Table 2.1 provides an overview of the total expenses for outcome 1, by program.
esource Statement
Table 2.1: Budgeted Expenses and Resources for Outcome 1 Outc 1: An Australian oil and gas industry that properly controls ome
ealthtion
ram agem
effective monitoring, investigation and enforcement.
Departmental expensesRevenues from independent sources (s31) 14,255 15,639Expenses not requiring appropriation in the Budget year 24 24
Total for Program 1.1 14,279 15,663
Outcome 1 Totals by appropriation typeDepartmental expenses
Revenues from independent sources (s31) 14,255 15,639Expenses not requiring appropriation in the Budget year 24 24
Total expenses for Outcome 1 14,279 15,663
2009-10 2010-11Average Staffing Level (number) 55 62
the h and safety risks to the workforce at its offshore petroleum opera s.
2009-10 2010-11
Estimated Estimatedactual expenses
expenses$'000 $'000
Prog 1: Regulatory oversight of Operators' Safety Cases, Safety man ent systems and operational practices coupled with
Note: Departmental appropriation splits and totals are indicative estimates and may change in the course of the budget year as government priorities change.
85
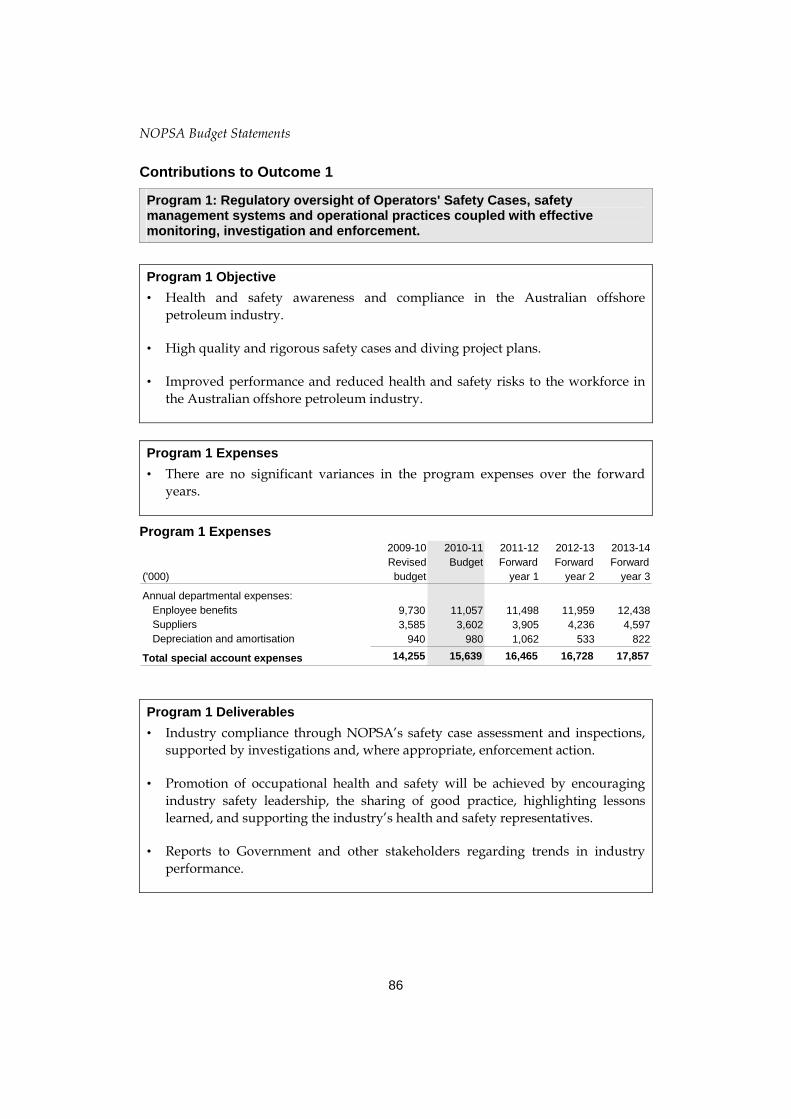
NOPSA Budget Statements
Contributions to Outcome 1
Program 1: Regulatory oversight of Operators' Safety Cases, safety management systems and operational practices coupled with effective monitoring, investigation and enforcement.
Program 1 Objective
• Health and safety awareness and compliance in the Australian offshore petroleum industry.
• High quality and rigorous safety cases and diving project plans.
• Improved performance and reduced health and safety risks to the workforce in the Australian offshore petroleum industry.
Program 1 Expenses
• There are no significant variances in the program expenses over the forward years.
Program 1 Expenses 2009-10 2010-11 2011-12 2012-13 2013-14Revised Budget Forward Forward Forward
('000) budget year 1 year 2 year 3
Annual departmental expenses:Enployee benefits 9,730 11,057 11,498 11,959 12,438Suppliers 3,585 3,602 3,905 4,236 4,597Depreciation and amortisation 940 980 1,062 533 822
Total special account expenses 14,255 15,639 16,465 16,728 17,857
Program 1 Deliverables
• Industry compliance through NOPSA’s safety case assessment and inspections, supported by investigations and, where appropriate, enforcement action.
• Promotion of occupational health and safety will be achieved by encouraging industry safety leadership, the sharing of good practice, highlighting lessons learned, and supporting the industry’s health and safety representatives.
• Reports to Government and other stakeholders regarding trends in industry performance.
86

NOPSA Budget Statements
Program 1 Deliverables 2009-10 2010-11 2011-Revised Budget Forw
budget yea
14,255 15,639 16,4
12 2012-13 2013-14ard Forward Forward
Deliverables r 1 year 2 year 3
petroleum industry. 16,728 17,857
Ensuring compliance and promotion of health and safety within the offshore 65
ts.
aints, undertaken consistently and in accordance with legislative requirement and relevant Government standards.
Program 1 Key Performance Indicators
• Maintenance of effective interaction with industry, workforce and other authorities through NOPSA’s national program initiative, participation in health and safety events and ad-hoc working groups, as required.
• Assessment of safety cases, pipeline safety management plans and diving safetymanagement systems undertaken consistently and in accordance with legislative requiremen
• Inspections and investigations of accidents, dangerous occurrences and compl
Program 1 Key Performance Indicators
2009-10 2010-11 2011-12 2012-13 2013-14Key Performance Revised Budget Forward Forward ForwardIndicators budget target year 1 year 2 year 3
Total resources for key performance indicators
14,255 15,639 16,465 16,728 17,857
87

NOPSA Budget Statements
Section 3: Explanatory tables and budgeted financial statements
Section 3 presents explanatory tables and budgeted financial statements which provide a comprehensive snapshot of agency finances for the 2010-11 budget year. It explains how budget plans are incorporated into the financial statements and provides further details of the reconciliation between appropriations and program expenses, movements in administered funds, special accounts and government indigenous expenditure.
3.1 EXPLANATORY TABLES
3.1.1 Movement of administered funds between years
This statement is not applicable because NOPSA has no administered funding.
3.1.2 Special Accounts
Special Accounts provide a means to set aside and record amounts used for specified purposes. Special Accounts can be created by a Finance Minister’s Determination under the FMA Act or under separate enabling legislation.
Table 3.1.2 shows the expected additions (receipts) and reductions (payments) for each account used by the NOPSA.
Table 3.1.2: Estimates of Special Account Flows and Balances Opening Closingbalance Receipts Payments Adjustments balance2010-11 2010-11 2010-11 2010-11 2010-112009-10 2009-10 2009-10 2009-10 2009-10
Outcome $'000 $'000 $'000 $'000 $'000
1,555 13,171 (14,251) - 475
5,773 8,968 (13,186) - 1,555
Total Special Accounts 2010-11 Budget estimate
475 (14,251) -
National Offshore Petroleum Safety Account - section 682 Offshore Petroleum and Greenhouse Gas Storage Act 2006
1
13,171 1,555
Total Special Accounts2009-10 estimate actual
(13,186) - 1,555 5,773 8,968
(A) = Administered (D) = Departmental
3.1.3 Australian Government Indigenous Expenditure
The 2010-11 Australian Government Indigenous Statement is not applicable because the NOPSA has no indigenous specific expenses.
88

NOPSA Budget Statements
3.2 BUDGETED FINANCIAL STATEMENTS
3.2.1 Differences in agency resourcing and financial statements
NOPSA has no significant differences between the resource information presented in the Budget Papers and in the Portfolio Budget Statements as a result of differences between whole of government level financial reporting (under Australian Accounting Standard 1049) and entity level financial reporting.
3.2.2 Analysis of budgeted financial statements
red level of
d by the Department of
At current levels of regulatory programs, a suite of emerging significant cost pressures anticipated through various inquiries and the increasing level of industry activity that is not subject to levy, it was necessary to recommend annual reviews to the unit value of the safety case levy in consultation with industry. A modest increase from $25,000 to $26,000 in the safety case unit value came into effect from 1 January 2010. Even at that level, it is anticipated that expenditure will exceed revenue over the next three financial years. This will significantly deplete the accumulated retained surplus from $5.671 million to $1.210 million by 2013-14, to provide the desiapproximately 10 per cent of budgeted expenditure that would enable NOPSA to meet any unforeseen expenditure.
NOPSA’s cash balance is also expected to reduce significantly as a result of legislative amendments that took effect on 1 January 2010 changing the timing of levy payments for non-mobile facilities from quarterly in advance to quarterly in arrears. The legislative amendments stemmed from the 2008 Review of Cost Recovery Arrangements and Cost Recovery Impact Statement produceResources Energy and Tourism in September 2009. A reduction of $4.218 million is forecast as at 30 June 2009, from $5.773 million to $1.555 million, and then reaching $0.475 million by June 2011 and remaining at low levels in the forward years.
NOPSA continues to maintain robust financial management to ensure that no cash shortages will be experienced.
89

NOPSA Budget Statements
3.2.3 Budgeted financial statements tables
Table 3.2.1 Comprehensive Income Statement (Showing Net Cost of Services) (for the period ended 30 June)
Estimated Budget Forward Forward Forwardactual estimate estimate estimate estimate
2009-10 2010-11 2011-12 2012-13 2013-14$'000 $'000 $'000 $'000 $'000
EXPENSESEmployee benefitsSupplier expenses
9,730 11,057 11,498 11,959 12,438 3,585 3,602 3,905 4,236 4,597
and amortisation 940 980 1,062 533 822 14,255 15,639 16,465 16,728 17,857
RevenueSale of goods and rendering of services 12,623 13,100 15,200 17,500 17,500
30 80
,530 17,580
Total own-source income 12,823 13,140 15,210 17,530 17,580
DepreciationTotal expenses
LESS: OWN-SOURCE INCOME
Interest 200 40 10
Total revenue 12,823 13,140 15,210 17
Net cost of (contribution by)
services (1,432) (2,499) (1,255) 802 (277)
Revenue from Government - 200 - - -
Surplus (Deficit) (1,432) (2,299) (1,255) 802 (277)
Surplus (Deficit) attributable to the Australian Government (1,432) (2,299) (1,255) 802 (277)
Prepared on Australian Accounting Standards basis.
90

NOPSA Budget Statements
3.2.3 Budgeted financial statements tables (continued)
Table 3.2.2: Budgeted departmental balance sheet (as at 30 June)
Estimated Budget Forward Forward Forwardactual estimate estimate estimate estimate
2009-10 2010-11 2011-12 2012-13 2013-14$'000 $'000 $'000 $'000 $'00
ASSETS0
etsuivalents 1,555 474 362 156 542
Non-financial assets
037 982 1,164 755 600Expenses 837 1,082 1,165 757 600
1,874 2,064 2,329 1,512 1,200
2,263 3,050 3,870 4,720 5,373Total provisions 2,263 3,050 3,870 4,720 5,373
Net assets 5,135 2,836 1,581 2,383 2,106
896 896 896Retained surplus
5,135 2,836 1,581 2,383 2,106
Financial assCash and eqTrade and other receivables 3,331 3,500 3,975 4,550 4,550Other - Prepayments 150 220 250 250 250
Total financial assets 5,036 4,194 4,587 4,956 5,342
Property, plant and equipment 4,236 3,756 3,193 3,659 3,337Total non-financial assets 4,236 3,756 3,193 3,659 3,337
Total assets 9,272 7,950 7,780 8,615 8,679
LIABILITIESPayables
Suppliers 1,Other - Accrued
Total payables
ProvisionsEmployee provisions
Total liabilities 4,137 5,114 6,199 6,232 6,573
EQUITY*Parent entity interest
Contributed equity 896 896
(accumulated deficit)
Total parent entity interest 5,135 2,836 1,581 2,383 2,106
Total equity
1,2104,239 1,940 685 1,487
* 'Equity' is the residual interest in assets after deduction of liabilities. Prepared on Australian Accounting Standards basis.
91

NOPSA Budget Statements
3.2.3 Budgeted financial statements tables (continued)
Table 3.2.3: Departmental statement of changes in equity — summary of movement (Budget year 2010-11)
Retained Asset Other Contributed Totalearnings revaluation reserves equity/ equity
reserve capital$'000 $'000 $'000
4,239 - - 896 5,135
S
lanceas at 30 June 2011
1,940 - - 896 2,836
$'000 $'000Opening balance as at 1 July 2010
Balance carried forward from
previous period 4,239 - - 896 5,135
Adjusted opening balance
urplus (deficit) for the period (2,299) - - - (2,299)
Estimated closing ba
Prepared on Australian Accounting Standards basis.
92

NOPSA Budget Statements
3.2.3 Budgeted financial statements tables (continued)
(for the period ended 30 June) Table 3.2.4: Budgeted departmental statement of cash flows
Estimated Budget Forward Forward Forwardactual estimate estimate estimate estimate
000 $'000 $'000 $'000 $'000PERATING ACTIVITIES
Cash receivedGoods and services 8,768 12,931 14,725 16,925 17,500Interest 200 40 10 30 80Appropriations 200
Total cash received 8,968 13,171 14,735 16,955 17,580
Cash usedEmployees 7,582 9,951 10,348 11,361 11,194
Suppliers 3,400 3,800 4,000 4,800 5,500
Total cash used 10,982 13,751 14,348 16,161 16,694Net cash from (used by)
operating activities (2,014) (580) 387 794 886
INVESTING ACTIVITIESCash used
Purchase of property, plant and equipment 2,204 500 500 1,000 500
Total cash used 2,204 500 500 1,000 500
Net cash from (used by) investing activities (2,204) (500) (500) (1,000) (500)
Net increase (decrease)in cash heldCash and cash equivalents at the
beginning of the reporting periodCash and cash equivalents at the
end of the reporting period
156
386
1,555 475 362 156 542
5,773 1,555 475 362
(4,218) (1,080) (113) (206)
2009-10 2010-11 2011-12 2012-13 2013-14$'
O
Prepared on Australian Accounting Standards basis.
93

NOPSA Budget Statements
3.2.3 Budgeted financial statements tables (continued)
T get Statement able 3.2.5: Departmental Capital BudEstimated Budget Forward Forward Forward
actual estimate estimate estimate estimate2009-10 2010-11 2011-12 2012-13 2013-14
$'000 $'000 $'000 $'000 $'00
PURCHASE OF NON-FINANCIALASSETS
Funded internally from
departmental resources1
TOTAL 2,204 500 500 1,000 500
1. Includes the following sources of funding: - s31 relevant agency receipts
50 2,204 500 500 1,000
0
0
P
Statement of Asset Movements (2010-11)
repared on Australian Accounting Standards basis.
Table 3.2.6: Other property, Total
plant and
Gross book value 6,184 6,184isation
equipment$'000 $'000
As at 1 July 2010
Accumulated depreciation/amortand impairment
Opening net book balance 4,236 4,236
CAPITAL ASSET ADDITIONSEstimated expenditure onnew or replacement assetsBy purchase - other 500 500Total additions 500 500
Other movementsD
6,684 6,684Aand impairmentC
(1,948) (1,948)
(2,928) (2,928)
epreciation/amortisation expense (980) (980)
As at 30 June 2011Gross book value
ccumulated depreciation/amortisation
losing net book balance 3,756 3,756 Prepared on Australian Accounting Standards basis.
94

NOPSA Budget Statements
95
NOPS ve been prepared on an accrual basis, in accordance w rders and Australian Accounting Standards.
The an f the key
3.2.4 Notes to the financial statements
A’s budget statements haith the Finance Minister’s O
alysis of budgeted financial statements provides an overview oelements that could significantly impact NOPSA’s results.


97
es and planned
ce
Tourism Australia
Agency resourcperforman


99
......101 1.2 Agency Resource Statement........................................................................104 1.3 Budget Measures..........................................................................................104
S rmance ...................................................105
.................................... .118
TOURISM AUSTRALIA
Section 1: Agency overview and resources...........................................................101 1.1 Strategic Direction Statement.................................................................
ection 2: Outcomes and planned perfo2.1 Outcomes and performance information ......................................................105
Section 3: Explanatory tables and budgeted financial statements .....................117 3.1 Explanatory tables ........................................................................................117 3.2 Budgeted Financial Statements...............................


Tourism Australia Budget Statements
TOURISM AUSTRALIA
Section 1: Agency overview and resources
estic promotion of Australia as a travel destination.
ctions of Tourism Australia under the Tourism Australia Act 2004 are to:
ntial international travellers of Australia as a in
ential travellers, both international and domestic, of
• Increase the desire of potential travellers, both international and domestic, to travel
• Conduct research into, and analysis, of international travel;
• Communicate effectively with the Australian tourism industry on issues that may affect it; and
• Increase awareness throughout Australia of the contribution of tourism to Australia’s economy, society and environment.
In 2010-11 Tourism Australia’s key contributions to the Australian community will be to increase demand for Australia as a leisure tourism and business events destination; to strengthen the travel distribution system; and to contribute to industry development through targeted stakeholder engagement and the provision of research and strategic insights. These objectives will be realised through the delivery of five marketing sub-programs in 23 key markets around the world. They are:
• Leisure and Consumer Marketing;
• Business Events Australia;
• Industry Development (including Trade Events, Trade Development);
1.1 STRATEGIC DIRECTION STATEMENT
Tourism Australia was established on 1 July 2004 and is responsible for the international and dom
The main fun
• Increase the awareness of potedest ation;
• Increase the awareness of potential domestic travellers of Australia as a place to travel;
• Increase the knowledge of potAustralia;
throughout Australia;
101

Tourism Australia Budget Statements
• Insights and Research; and
• Stakeholder Engagement.
In 2010-11 Tourism Australia anticipates a mixed environment for inbound and domestic tourism as markets move to recovery from the Global Financial Crisis. Whilst the worst of the world recession appears to be over, the residual overhang of losses in wealth, cautious lending and potentially fragile consumer sentiment will continue to constrain recovery. While the Australian tourism industry coped well through the difficult economic environment of 2009/10, both international and
osses the industry adopted
mpaign – ‘There’s nothing like Australia’ – which aims to ensure that potential visitors view Australia as a place where they can
iday.
es a foundation for driving greater alignment
mate outcome remains to rism and other organisations
leisure arrivals
om large markets; (ii) maximise growth potential from medium to small markets; (iii)
mediate results in terms of visitor
ing volume, dispersal and the economic value of our
domestic visitor numbers were down and to minimise lprice discounting strategies.
In response to this environment, Tourism Australia will continue to focus on generating a greater volume of leisure and business events visitors to Australia, whilst growing the dispersal and economic contribution of these visitors. A key driver in this activity will be the new global brand ca
have an incredible hol
In December 2009, the National Long-Term Tourism Strategy was launched by the Minister for Tourism. The strategy reaffirms Tourism Australia’s role in the demand side of tourism marketing and providand linkages between supply and demand for the Australian tourism industry. Although Tourism Australia’s remit will be slightly expanded and strengthened in all areas of industry development and online distribution, its ultiincrease demand while working closely with state toufocussed on supply issues.
To drive focus and effective allocation of resources, Tourism Australia will continue toemploy a dedicated market categorisation approach to: (i) maximisefrmaximise dispersal and tourism inbound economic value; and (iv) develop markets for future growth.
Within this approach, Tourism Australia will continue to target the global market of ‘Experience Seekers’ and in particular ‘First Time Experience Seekers’, while tailoring global marketing strategies to deliver more imnumbers. To help build Australia’s appeal and drive growth in visitor numbers during 2010-11, Tourism Australia will focus on segments in the ‘Experience Seeker’ target market, including demographic and travel type segments.
With continuing focus on promotvisitors, Tourism Australia will continue tactical marketing activities with the ability to make an impact on leisure and business travellers in an increasingly competitive marketplace. A cornerstone of this approach is ensuring maximum state and territory government and private sector investment through partnership initiatives. Digital will remain a key channel, enabling Tourism Australia to drive messages and information
102

Tourism Australia Budget Statements
across markets and segments. Social networking, public relations and word of mouth
associations sector and rationalisation of activity in the corporate meeting and incentive sectors. In short, Tourism Australia’s focus in
sociations sector compared with .
t tourism is increased and that the capabilities of those who sell
imised. Tourism Australia will continue to build the capability of travel agents to ensure they are knowledgeable and confident sellers of Australia and Australian experiences; and that trade events and trade missions are managed to provide an opportunity for Australian tourism product sellers to showcase their products and connect with international buyers.
Tourism Australia will assist the development of a sustainable tourism industry through stakeholder engagement and provision of research and insights to assist strategic decision-making in a challenging and constantly changing market environment. This includes consumer behaviour research; specialised consumer and marketing performance and research insights; analysis of industry and aviation conditions; and, monitoring and evaluation of Tourism Australia strategies and programs against defined key performance indicators.
Tourism Australia will continue to incorporate activities that develop and promote Indigenous tourism experiences through Tourism Australia’s broader programs, to result in a higher profile for Australian Indigenous culture and ways to experience it, as well as greater representation for Indigenous tourism businesses and product in domestic and international markets.
also remain important channels.
The Business Events sector was significantly impacted by the Global Financial Crisis, with the association meetings sector holding up more strongly than the corporate meetings and incentives sector in 2009-10. This experience has resulted in a refining of Tourism Australia’s approach in the business events sector in 2010-11 which will involve a targeted approach in the
2010-11 has shifted to greater emphasis on the as2009-10
As Australia represents less than one per cent of total world travel, it is essential thathe profile of Australianand distribute Australian product is max
103

Tourism Australia Budget Statements
1.2 A ENCY RESOURCES STATEMENT G
s. The table summarises how lied by outcome and by administered and departmental
Table 1.1: Tourism Australia Resource Statement — Budget Estimates for 2010-11 as at Budget May 2010
Table 1.1 shows the total resources from all sourceresources will be appclassification.
Estimate Proposed Total Actualof prior + at Budget = estimate available
year amounts appropriationavailable in
Source 2010-11 2010-11 2010-11 2009-10
$'000 $'000 $'000 $'000
Opening balance/Reserves at bank - 13,181 13,181 12,321
REVENUE FROM GOVERNMENTOrdinary annual services¹
Outcome 1 - Increase demand for Australia as a destination, strengthen the travel distribution system and contribute to the development of a sustainable tourism industry through consumer marketing, trade development and research activities.
- 122,920 122,920 141,622
Total ordinary annual services - 122,920 122,920 141,622
Total annual appropriations - 122,920 122,920 141,622
Total funds from Government - 122,920 122,920 141,622
FUNDS FROM OTHER SOURCESInterest - 1,000 1,000 1,506Other - 18,204 18,204 18,008Total - 19,204 19,204 19,514
Total net resourcing for Tourism Australia
- 155,305 155,305 173,457
1 Appropriation Bill (No.1) 2010-11Reader note: All figures are GST exclusive.
1.3 BUDGET MEASURES
Tourism Australia does not have any new budget measures in 2010-11.
104

Tourism Australia Budget Statements
Sect on 2: Outcomes and planned performani ce
ND PERFORMANCE INFORMATION
overnment outcomes are the intended results, impacts or consequences of actions by e Government on the Australian community. Commonwealth programs are the
rimary vehicle by which government agencies achieve the intended results of their utcome statements. Agencies are required to identify the programs which contribute Government outcomes over the Budget and forward years.
ach outcome is described below together with its related programs, specifying the erformance indicators and targets used to assess and monitor the performance of
Australia in achieving Government outcomes.
2.1 OUTCOMES A
Gthpoto
EpTourism
Outcome 1: Increase demand for Australia as a destination, strengthen the travel distribution system and contribute to the development of a sustainable tourism industry through consumer marketing, trade development and research activities.
Outcome 1 Strategy
number of key strategies will be used by Tourism Australia across three main rograms and five subprogram areas to increase demand for Australia as a
nation, strengthen the travel distribution system and contribute to the evelopment of a sustainable tourism industry for Australia.
. 1 Industry Development
al Long-Term Tourism Strategy describes a broadened role for Tourism ustralia in industry development. Tourism Australia will participate in working roups established to implement the strategy. While Tourism Australia has existing dustry development activity that aligns with the strategy, there are also new areas of
ctivity which have been incorporated into Tourism Australia’s strategy for 2010-11. ne of new and existing activity that will be implemented in 2010-11 follows:
New areas
he marketing of the Framework through its launch phase planned for
entation
• Distribution of quality Australian products – participating in the National Long-Term Tourism Strategy Working Group to determine how best to get Australia’s tourism products online, and how to build industry capability around digital marketing and distribution.
Apdestid
1
The NationAginaAn outli
• Building product quality through accreditation – leading tccreditation National Tourism A
July 2010, and then for ongoing implem
105

Tourism Australia Budget Statements
1. 1 Industry Development (continued)
Existing areas
• Indigenous Tourism Development – continuing to promote and improve demand for Indigenous tourism experiences;
• Australia’s National Landscapes – promoting the best of Australia’s National Landscapes through a collaborative program with Parks Australia;
• Insights and Research – providing Tourism Australia, government and industry stakeholders with strategic insights and research relevant to their needs to drive industry sustainability and strategy development; and
• Stakeholder Engagement – building awareness, understanding and alignment around Tourism Australia strategies across government and industry through a formalised and cohesive approach.
1.2 Strengthening the travel distribution system
Tourism Australia will target the distributors and sellers of Australian tourism product in Australia and overseas to increase their knowledge and capability in selling Australia, facilitate the growth of business between Australian tourism product and the distribution network, as well as motivate and inspire consumers through quality content. This will be achieved through:
• Trade Development – building the capability of the travel industry to confidently sell Australia, including training of travel agents through the Aussie Specialist Program; account management of distributors; providing Australian destination and product content to the distribution system and making direct connections with travel agents through familiarisation visits and trade events; and
• Trade Events – managing and participating in a range of trade events in Australia and overseas that promote Australia as a destination for leisure and business events travel.
1.3 Increasing demand for Australia as a destination
Tourism Australia will build Australia’s reputation and profile as an exciting and desirable leisure and business events destination to drive demand and growth in visitor numbers, through:
• Leisure Consumer Marketing – inspiring ‘First Time Experience Seekers’ to come to Australia; and
• Business Events Australia – leveraging the business events sector’s capacity to deliver high yielding visitors who also return as repeat visitors.
106

Tourism Australia Budget Statements
1.3 Increasing demand for Australia as a destination (continued)
Tourism Australia’s target audiences for leisure tourism in 2010-11 are the ‘First Time Experience Seekers’ in the following markets where Tourism Australia undertakes leisure consumer marketing activity:
• Large markets: USA, Japan, United Kingdom, China;
• Medium and small markets: Korea, India, Indonesia, Malaysia, Hong Kong, Taiwan, Canada, France;
• Dispersal and Tourism Inbound Economic Value markets: Italy, Germany, Netherlands, Ireland, Switzerland; and
• Markets for future growth: Vietnam and Latin America (Brazil and Argentina) .
Tourism Australia will also continue to target ‘Repeat Experience Seeker’ visitors in New Zealand and Singapore, as well as within Australia.
To build demand and drive visitation during 2010-11, Tourism Australia will target sub-segments of the ‘Experience Seeker’ audience, including youth and family demographic groups; and Working Holiday Visa and honeymoon travel categories.
In the business events market, Tourism Australia will target corporate and incentive buyers in the corporate meetings, incentives and association meetings sector. Business Events Australia will rationalise its activity in the corporate meeting and incentive markets, while increasing its emphasis in the association market.
107

Tourism Australia Budget Statements
Outcome Expense and Resource Statement
Table 2.1 provides an overview of the total expenses for Outcome 1, by program.
s and Resources for Outcome 1 Table 2.1: Budgeted Expense
Outcome 1: Increase demand for Australia as a destination, strengthen the travel distribution system and contribute to the development of a sustainable tourism indus
2009-10 2010-11try through consumer
marketing, trade development and research activities.
Estimated Estimated
Program 1.2: Strengthen the travel distribution system
17,725 15,634
rogram 1.3: Increase demand for AustraliaRevenue from Government
Ordinary annual services (Appropriation Bill No. 1) 113,298 98,336Revenues from industry sources 15,416 15,171
Total for Program 1.3 128,714 113,507
tcome 1 Totals by resource typerom Government
Ordinary annual services (Appropriation Bill No. 1) 141,622 122,920 from industry sources 19,514 19,204
Total expenses for Outcome 1 161,136 142,124
2009-10 2010-11verage Staffing Level (number) 208 205
actual expensesexpenses
$'000 $'000Program 1.1: Industry DevelopmentRevenue from Government
Ordinary annual services (Appropriation Bill No. 1) 12,746 11,063
Revenues from industry sources 1,951 1,920
Total for Program 1.1 14,697 12,983
Revenue from GovernmentOrdinary annual services (Appropriation Bill No. 1) 15,578 13,521
Revenues from industry sources 2,147 2,113
Total for Program 1.2
P
OuRevenue f
Revenues
A ote: Departmental appropriation splits and totals are indicative estimates and may change in the course of
the budget year as government priorities change.
N
108

Tourism Australia Budget Statements
Contributions to Outcome 1
Program 1.1: Industry Development
Program 1.1 Objective
Tourism Australia will support initiatives as outlined in the National Long-Term Tourism Strategy, promote Indigenous tourism development and Australia’s national landscapes, ensure that key stak olders are informed and equipped with strategic insights to make effective decisions to achieve sustainable growth and that stakeholders are aware of, understand an align with Tourism Australia strategies. Understanding key developments, trends and behaviours of potential travellers, visitor compet ll provid cross government and industry.
eh
d
behaviour and the industry and aviation sectors is critical for the itiveness and sustainability of Australian tourism. Tourism Australia wi
e a formalised and cohesive app oach to engaging stakeholders ar
Program 1.1 Expenses
The program expenses relating to Indus development are expected to remain fairly consistent over the forward years.
try
Program 1.1 Expenses 2009-10 2010-11Revised Budget
2011-12 2012-13 2013-14Forward Forward Forward
('000) budget year 1 year 2 year 3
Program support 14,697 12,983 14,429 14,580 14,756
Total program expenses 14,697 12,983 14,429 14,580 14,756
Program 1.1 Deliverables
Insights and Research
Undertake tourism research and disseminate insights
• Research and insights which inform and improve strategy development and decision-making across Tourism Australia, government and industry
• Consumer behaviour research
• Specialised consumer and marketing performance research and insights
• Analysis of industry and aviation conditions
109

Tourism Australia Budget Statements
Program 1.1 Deliverables (continued)
• Monitoring and evaluation of Tourism Australia strategies and programs against defined KPIs
• Delivery of an annual Outlook Conference
Stakeholder Engagement
Participation in National Long-Term Tourism Strategy Working Groups
• Investment and Regulatory Reform Working Group
• Destination Management Planning Working Group
• Tourism Access Working Group – incorporating the National Tourism and Aviation Advisory Committee
• Industry Resilience Working Group
• Quality Assurance and Accreditation Working Group – incorporating the Tourism Quality Council of Australia
• Indigenous Tourism Working Group
• Digital Distribution Working Group
• Research Working Group – incorporating the Research and Development Advisory Board
Building product quality through accreditation
• Marketing of the launch of the National Tourism Accreditation Framework
• Ongoing marketing of the National Tourism Accreditation Framework
Promote Indigenous Tourism Development
• Indigenous Tourism Champions Program (in conjunction with Indigenous Business Australia), promoting the top indigenous tourism product in Australia
• A trade and consumer focussed Indigenous tourism website
• Promotion of indigenous experiences through Tourism Australia’s consumer marketing activities
110

Tourism Australia Budget Statements
Program 1.1 Deliverables (continued)
Promote Australia’s National Landscapes
• A destination ralia’s national landscapes
activ
ge Stake
Stak
DedTou
• Tracking and monitoring of stakeholder engagement
marketing framework which focuses on Aust
• oting national landscapes through Tourism Australia’s consumer marketing Promities
Enga holders
• eholder engagement framework to clarify stakeholder groups, membership and roles and responsibilities
• icated communications plan to deliver awareness and understanding of rism Australia strategies
Program 1.1 Key Performance Indicators
2009-10 2010-11 2011-12 2012-13 2013-14Key Performance Revised Budget Forward Forward ForwardIndicators budget target year 1 year 2 year 3Insights and Research
% of stakeholders indicating that Tourism Australia helps their
business.1
Maintain or slight increase
Maintain or slight increase
Maintain or slight increase
Maintain or slight increase
Stakeholder Engagement
% of stakeholders indicating that Tourism Australia helps their
business.1
Maintain or slight increase
Maintain or slight increase
Maintain or slight increase
Maintain or slight increase
75% rate TA functions as excellent, very good or good value to their business
75% rate TA functions as excellent, very good or good value to their business
1. A new measure of stakeholder engagement is being developed.
111

Tourism Australia Budget Statements
Program 1.2: Strengthening the travel distribution system
Program 1.2 Objective
Tourism Australia will work with industry to develop and present products which meet changing consumer needs, engage, educate and strengthen the travel distribution system to ensure products are available to potential travellers and provide platforms for Australian tourism operators to do business with the international travel distribution system. Tourism Australia will work to ensure that travel agents are knowledgeable and confident sellers of Australia and Australian experiences; that trade events and trade missions are coordinated and managed to showcase Australian tourism sellers and products and directly engage international buyers; and, endeavour to increase the penetration of Australian tourism experiences within the distribution system.
Program 1.2 Expenses
The program expenses relating to strengthening the travel distribution system are expected to remain fairly consistent over the forward years.
Program 1.2 Expenses 2009-10 2010-11 2011-12 2012-13 2013-14Revised Budget Forward Forward Forward
('000) budget year 1 year 2 year 3
Program support 17,725 15,634 17,339 17,524 17,738
Total program expenses 17,725 15,634 17,339 17,524 17,738
Program 1.2 Deliverables
Trade Events
• Recruit, assess and accept applications for buyers, sellers and media for trade events
• Coordinate and deliver trade events for Australian tourism businesses to showcase their products and do business with the global distribution network
• Manage Australia’s premier trade event – the Australian Tourism Exchange (ATE) – and profile the Tourism Australia corporate brand and that of industry partners
Trade Development
• Recruitment and training of travel agents through the ‘Aussie Specialist Program’
112

Tourism Australia Budget Statements
Program 1.2 Del
• Deliver product information for Aussie Specialist Program through coordination with state and territory tourism organisations
itional training and development for retail travel agents
rs to be involved in Tourism
iverables (continued)
• Coordination and delivery of specific events to provide add
• Opportunities for Australian tourism operatoAustralia programs and promotions
• Development and distribution of marketing collateral and content for industry partners
Program 1.2 Key Performance Indicators
2009-10 2010-11 2011-12 2012-13 2013-1Key Performance Revised Budget Forward Forward ForwardIndicators budget target year 1 year 2 yearTrade Events
% of stakeholders indicating that TA
helps their business
75% rate TA functions as excellent, very
Maintain or Maintain or Maintain or Maintain or
4
3
.1 good or good value to their
slight increase
slight increase
slight increase
slight increase
business.
Trade DevelopmentNumber of qualified Agents in the Aussie Specialist Program (ASP)
13,000 14,400 15,800 17,200 18,600
1. A new measure of stakeholder engagement is being developed.
113

Tourism Australia Budget Statements
Program 1.3: Increase demand for Australia as a destination
Program 1.3 Objective
Tourism Australia will deliver consumer marketing and business events campaigns and activities which inspire consumers in target markets to travel to Australia,
and to a purchase ine. During 2010 Tourism Australia Nothing Like Australia’ which will
yield and dispersal. To focus activities
he United Kingdom, Europe, Japan and the
overcoming rational barriers to travel (time, distance, cost) and directing travellers to information about Australian products and experiences mechanism such as a travel agent or airllaunched a new brand campaign ‘There’s provide the foundation for all consumer marketing activities. Tourism Australia’s focus during 2010-11 will be to continue to generate a volume of visitors to support industry as they recover from the global economic downturn while continuing to promote Tourism Australia’s objectives for and resources, a dedicated market categorisation approach will be adopted. Tourism Australia will bring balance to its marketing of business events activities by increasing its focus on Association meeting planners while rationalising activity in the corporate meeting and incentives sectors. Business Events activity will be concentrated in short-haul markets such as New Zealand and Asia while maintaining its market activity in tUnited States.
Program 1.3 Expenses
The program expenses relating to increasing demand for Australia gradually increases over the forward years in line with the agency appropriation changes as a result of indexation.
Program 1.3 Expenses 2009-10 2010-11 2011-12 2012-13 2013-14Revised Budget Forward Forward Forward
('000) budget year 1 year 2 year 3
128,763Program support 128,714 113,507 125,858 127,204
Total program expenses 128,714 113,507 125,858 127,204 128,763
Program 1.3 Deliverables
Leisure Consumer Marketing
• Launch and implementation of the new brand campaign – ‘There’s nothing like Australia’
• Cooperative campaigns and activities with industry partners to leverage marketing opportunities which align with the destination Australia brand
114

Tourism Australia Budget Statements
Program 1.3 Deliverables (continued)
• Integrated and compelling marketing to stimulate target markets, including brand advertising and promotions, digital programs, public relations, International Media Hosting Program, media content development, cooperative
ralia.com consumer website
• Search engine marketing to lift Australia.com ranking
nt and applications, including social media
stralia sites, including international media relations, Business Events Australia and domestic
Business Events Australia
• Business-to-business marketing activity to promote Australia as a business events destination, including trade events, buyer and agent familiarisation visits, direct marketing and public relations campaigns, advocacy, marketing toolkit and stakeholder relations.
• Build on consistent Business Events Australia brand messages including Australia’s credentials for social responsibility (CSR)
promotions, consumer events and advocacy programs
• Continued development of the Aust
• Australian story-telling conte
• Development and management of other Tourism Au
Program 1.3 Key Performance Indicators 2009-10 2010-11 2011-12 2012-13 2013-14
Key Performance Revised Budget Forward Forward ForwardIndicators budget target year 1 year 2 year 3
Total: 2,380,100
2,450,900 2,516,800 2,582,700 2,648,600
First Time: 854,800
854,800 854,800 854,800 854,800
Intention Pool
International: Number of travellers intending to visit Australia in the next 12 months (from 5 key markets)
10,777,300 10,992,800 11,208,300 11,423,900 11,639,500
Domestic: Number of travellers intending to travel within Australia in the next twelve months.
12,594,000 12,845,800 13,102,800 13,364,800 13,632,100
Leisure Consumer Marketing 1
Experience Seeker Arrivals
Number of total and first time international 'Experience Seeker' arrivals from TA key markets
1. Range of time periods used across measures based on timing of data availability.
115
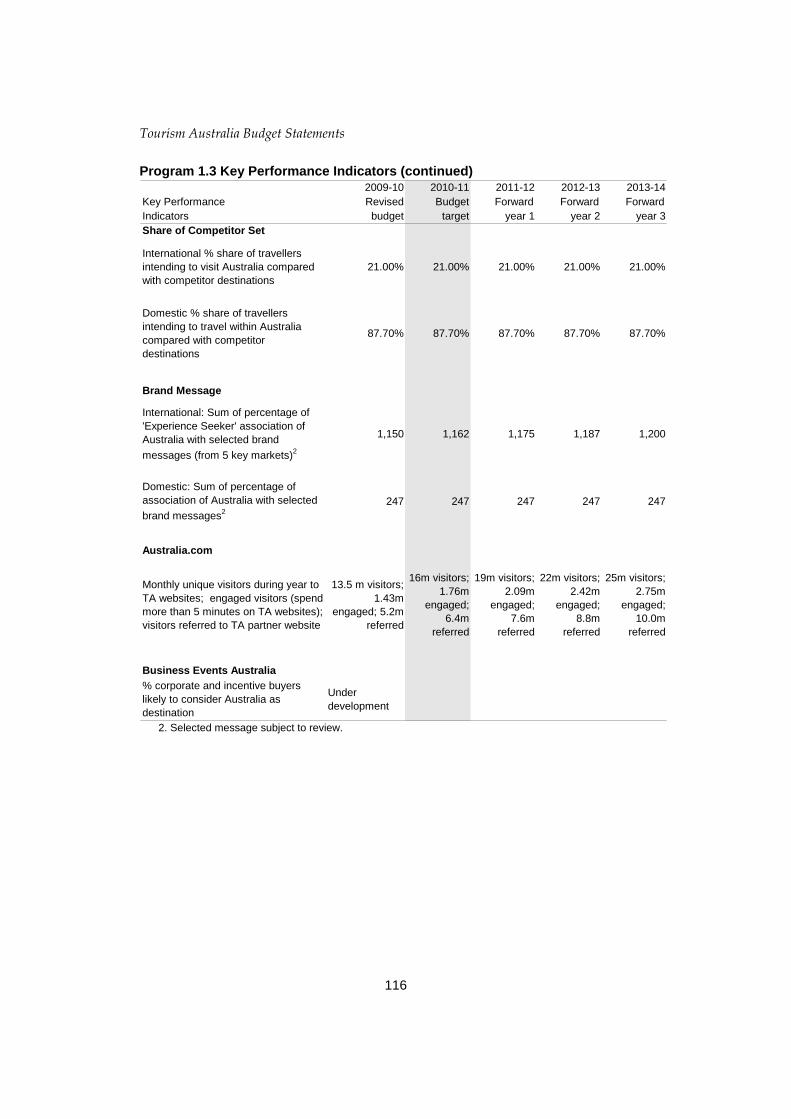
Tourism Australia Budget Statements
116
Program 1.3 Key Performance Indicators (continued) 2009-10 2010-11 2011-12 2
Key Performance Revised Budget Forward FIndicators budget target year 1
012-13 2013-14orward Forwardyear 2 year 3
Share of Competitor Set
with competitor destinations21.00% 21.00%
messages (from 5 key markets)2
,150 1,162 1,175 1,187 1,200
247
ustralia.com
Business Events Australia
% corporate and incentive buyers likely to consider Australia as destination
Under development
19m visitors; 2.09m
22m visitors; 2.42m
d
25m visitors; 2.75m
;
referred
16m visitors; 1.76m
year to 13.5 m visitors;
International % share of travellers intending to visit Australia compared 21.00% 21.00% 21.00%
Domestic % share of travellers intending to travel within Australia compared with competitor destinations
87.70% 87.70% 87.70% 87.70% 87.70%
Brand Message
International: Sum of percentage of 'Experience Seeker' association of Australia with selected brand 1
Domestic: Sum of percentage of association of Australia with selected
brand messages2247 247 247 247
A
engaged; 7.6m
referred
engaged; 8.8m
referre
engaged10.0m
engaged; 6.4m
referred
TA websites; engaged visitors (spend more than 5 minutes on TA websites); visitors referred to TA partner website
1.43m engaged; 5.2m
referred
Monthly unique visitors during
2. Selected message subject to review.
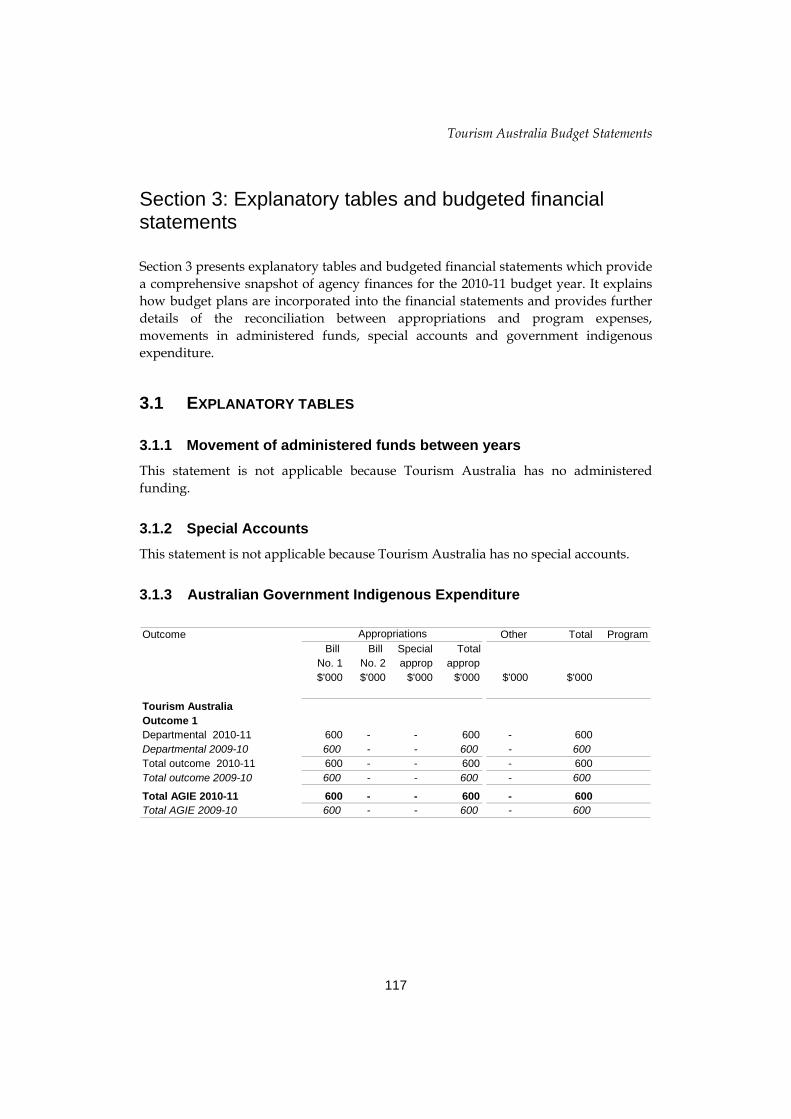
Tourism Australia Budget Statements
Section 3: Explanatory tables and budgeted financial statements
ances for the 2010-11 budget year. It explains ow budget plans are incorporated into the financial statements and provides further
details of the reconciliation between appropriations and program expenses, ovements in administered funds, special accounts and government indigenous
expenditure.
3.1 EXPLANATORY TABLES
3.1.1 Movement of administered funds between years
This statement is not applicable because Tourism Australia has no administered funding.
3.1.2 Special Accounts
This statement is not applicable because Tourism Australia has no special accounts.
3.1.3 Australian Government Indigenous Expenditure
Section 3 presents explanatory tables and budgeted financial statements which provide a comprehensive snapshot of agency finh
m
Outcome Other Total ProgramBill Bill Special Total
No. 1 No. 2 approp approp$'000 $'000 $'000 $'000 $'000 $'000
Tourism AustraliaOutcome 1Departmental 2010-11 600 - - 600 - 600Departmental 2009-10 600 - - 600 - 600Total outcome 2010-11 600 - - 600 - 600Total outcome 2009-10 600 - - 600 - 600
Total AGIE 2010-11 600 - - 600 - 600Total AGIE 2009-10 600 - - 600 - 600
Appropriations
117

Tourism Australia Budget Statements
3.2 BUDGETED FINANCIAL STATEMENTS
3 es in agency resourcing and financial statements
ourism Australia has no significant differences between the resource information p Papers and in the Portfolio Budget Statements as a result of
her sources of $19.204 million. The total revenue decreases by $19.012 million from the 2009-10
The change includes:
• riation has been brought forward to 2009-10 from 2010-11 as
arginally from $19.514 million to $19.204 million primarily relating to interest income; and
index applied to appropriations.
otal expenses are estimated to be $142.124 million, a decrease of $19.012 million from the 2009-10 estimated actual of $161.136 million. The decrease reflects:
lus package;
Increase in depreciation and amortisation costs of $1.485 million relating to full year capitalisation of major intangible assets; and
Full year impact of transfer of Tourism Research Australia to the Department of Resources, Energy and Tourism affecting employee and supplier expenditures.
D
ed with prior period foreign
capital injection.
.2.1 Differenc
Tresented in the Budget
differences between whole of government level financial reporting (under AustralianAccounting Standard 1049) and entity level financial reporting.
3.2.2 Analysis of budgeted financial statements
Departmental – Income Statement
The total operating revenue for 2010-11 is estimated at $142.124 million and is made up of government appropriations of $122.920 million and revenue from ot
estimated actual of $161.136 million.
$9.000 million approppart of tourism stimulus package;
• Revenue from other sources decreases m
• Impact of wage cost
T
• $9.000 million appropriation has been brought forward to 2009-10 from 2010-11 aspart of tourism stimu
•
•
epartmental – Balance Sheet
• Tourism Australia is budgeting a net asset position of $20.779 million which is anincrease of $13.181 million from 2009-10. The increase is primarily due to cashreceived from supplementary funding associatexchange losses. The supplementary funding has been recognised in equity as
118

Tourism Australia Budget Statements
Departmental – Balance Sheet (continued)
• Net assets are projected to remain the same beyond 2010-11.
• Total assets position for 2010-11 of $40.259 million represents an increase of
3.2.3 Budgeted financial statements tables
Table 3.2.1 Comprehensive Income Statement (Showing Net Cost of Services) (
$13.586 million from the 2009-10 projected actual of $26.673 million. The increase isprimarily due to cash received from supplementary funding associated with priorperiod foreign exchange losses.
for the period ended 30 June) Estimated Budget Forward Forward Forward
actual estimate estimate estimate estimate2009-10 2010-11 2011-12 2012-13 2013-14
$'000 $'000 $'000 $'000 $'000
isation 3,243 4,728 4,500 4,500 4,500
161,136 142,124 157,626 159,308 161,257
LESS: N-SOURCE INCOME
f services 421 424 429 429 429
17,780 22,812 22,812 22,812 Total revenue 19,514 19,204 24,241 24,241 24,241 Total own-source income 19,514 19,204 24,241 24,241 24,241
)
rom Government 141,622 122,920 133,385 135,067 137,016
‐ ‐ ‐ ‐ ‐S
Total comprehensive income attributable to the Australian Government ‐ ‐ ‐ ‐ ‐
(137,016) (141,622) (122,920) (133,385) (135,067)
EXPENSESEmployee benefits 28,158 25,464 26,184 27,105 27,913 Supplier expenses 123,118 105,277 120,208 120,969 122,110 Depreciation and amortFinance costs 32 29 33 33 33 Other 6,585 6,626 6,701 6,701 6,701 Total expenses
OWRevenueSale of goods and rendering oInterest 1,506 1,000 1,000 1,000 1,000 Other 17,587
Net cost of (contribution byservices
Revenue f
Surplus (Deficit)rpu lus (Deficit) attributable to the
Australian Government - - - - -
Prepared on Australian Accounting Standards basis.
119

Tourism Australia Budget Statements
3.2.3 Budgeted financial statements tables (continued)
Table 3.2.2: Budgeted departmental balance sheet (as at 30 June)
Estimated Budget Forward Forward Forwardactual estimate estimate estimate estimate
2009-10 2010-11 2011-12 2012-13 2013-14$'000 $'000 $'000 $'000 $'000
ASSETSFinancial assets
Cash and equivalents 10,919 25,602 25,961 26,494 27,4275,006 5,039 5,090 5,090 5,090
1,128 754 854 954 954Property, plant and equipment 376 231 180 200 200
1,504 1,504 1,5049,078 8,678 7,778
Total assets 26,673 40,259 40,684 40,817 40,850
1,170 1,175 1,175 1,175Total payables 13,248 13,687 13,945 14,078 14,078
4,878 4,815 4,950 4,950 4,950949 978 1,010 1,010 1,043
al provisions 5,827 5,793 5,960 5,960 5,993Total liabilities 19,075 19,480 19,905 20,038 20,071
Parent entity interestContributed equity 827 14,008 14,008 14,008 14,008Reserves 1,545 1,545 1,545 1,545 1,545
20,779Total equity 7,598 20,779 20,779 20,779 20,779
5,2266 5,226 5,226 5,226
Trade and other receivablesOther 545 549 555 555 555
Total financial assets 16,470 31,190 31,606 32,139 33,072
Non-financial assetsLand and buildings
Intangibles 7,198 6,589 6,540 6,020 5,120Other 1,501 1,495
Total non-financial assets 10,203 9,069
LIABILITIESPayables
Suppliers 12,075 12,517 12,770 12,903 12,903Other 1,173
ProvisionsEmployee provisionsOther
Tot
Net assets 7,598 20,779 20,779 20,779 20,779
EQUITY*
Retained surplus(accumulated deficit)
5,22
Total parent entity interest 7,598 20,779 20,779 20,779
* 'Equity' is the residual interest in assets after deduction of liabilities. Prepared on Australian Accounting Standards basis.
120

Tourism Australia Budget Statements
3.2.3 Budgeted financial statements tables (continued)
Table 3.2.3: Departmental statement of changes in equity — summary of movement (Budget year 2010-11)
Retained Asset Other Contributed Totalearnings revaluation reserves equity/ equity
reserve capital$'000 $'000 $'000 $'000 $'000
Opening balance as at 1 July 2010Balance carried forward from
previous periodAdjusted opening balance 5,226 1,545 - 14,008 20,779
Surplus (deficit) for the period - - - - -
Estimated closing balanceas at 30 June 2011
1,545 - 14,008 20,779 5,226
5,226 1,545 - 14,008 20,779
Prepared on Australian Accounting Standards basis.
121

Tourism Australia Budget Statements
3.2.3 Budgeted financial statements tables (continued)
Table 3.2.4: Budgeted departmental statement of cash flows (for the period ended 30 June)
Estimated Budget Forward Forward Forwardactual estimate estimate estimate estimate
2009-10 2010-11 2011-12 2012-13 2013-14$'000 $'000 $'000 $'000 $'000
OPERATING ACTIVITIESCash received
Goods and services 17,958 18,127 23,189 23,241 19,362Appropriations 141,622 136,101 133,385 135,067 137,016Interest 1,506 1,000 1,000 1,000 1,000
270 5,270 5,270 5,270 5,270
166,356 160,498 162,844 164,578 162,648
Cash used27,402 27,913
127,273 123,5016,701
158,115Net cash from (used by)
(2,502) 18,283 4,859 4,633 4,533
Purchase of property, plant 4,100 3,600 4,100 3,600
(3,600) (4,500) (4,100) (3,600)
Net increase (decrease)
Cash and cash equivalents at the26,494
(7,602) 14, 3 359 533 933
Other 5,
Total cash received
Employees 28,218 25,807 26,337Suppliers 131,611 107,390 126,410Other 9,029 9,018 5,238 5,270
Total cash used 168,858 142,215 157,985 159,945
operating activities
INVESTING ACTIVITIESCash used
and equipment 5,100 3,600 4,500 Total cash used 5,100 3,600 4,500 Net cash from (used by)
investing activities (5,100)
in cash held68
beginning of the reporting period 12,321 10,919 25,602 25,961Effect of exchange rate movements
on cash and cash equivalents at the beginning of reporting period
Cash and cash equivalents at the end of the reporting period
- 6,200 - - -
27,42710,919 25,602 25,961 26,494
Prepared on Australian Accounting Standards basis.
122

Tourism Australia Budget Statements
123
continued) 3.2.3 Budgeted financial statements tables (
Table 3.2.5: Departmental Capital Budget Statement Estimated Budget Forward Forward Forward
actual estimate estimate estimate estimate2009-10 2010-11 2011-12 2012-13 2013-14
$'000 $'000 $'000 $'000 $'000PITAL APPROPRIATIONS
-
NCIAL
CAEquity injections - Bill 2 - 13,181 - - -
Total capital appropriations - 13,181 - -
PURCHASE OF NON-FINAASSETS
Funded internally fromdepartmental resources2
TOTAL 5,100 3,60 0 4,500 4,100 3,600
otal purchases 5,100 3,600 4,500 4,100 3,600 otal cash used to
r 3,600
4,100 3,600
4,100
5,100 3,600 4,500
RECONCILIATION OF CASHUSED TO ACQUIRE ASSETSTO ASSET MOVEMENT TABLE
TT
acqui e assets 5,100 3,600 4,500
1. Includes the following sources of funding: - s31 relevant agency receipts. Prepared on Australian Accounting Standards basis.

124
Tourism
Australia B
udget Statements
124
3.2.3 Budgeted financial statements tables (continued)
Table 3.2.6: Statement of Asset Movements (2010-11) Buildings Other property, Intangibles Other Total
plant andequipment
$'000 $'000 $'000 $'000 $'000As at 1 July 2010Gross book value 1,966 601 3,610 5,768 11,945 Accumulated depreciation/amortisation
and impairmentOpening net book balance 1,128 376 3,356 3,842 8,702
CAPITAL ASSET ADDITIONSEstimated expenditure on
new or replacement assetsBy purchase or internally developed 500 100 3,000 - 3,600 Total additions 500 100 3,000 - 3,600
Other movementsDepreciation/amortisation expense (874) (245) (1,254) (2,355) (4,728)
(3,243) (838) (225) (254) (1,926)
As at 30 June 2011Gross book value 2,466 701 6,610 5,768 15,545 Accumulated depreciation/amortisation
and impairmentClosing net book balance 754 231 5,102 1,487 7,574
(4,281) (7,971) (1,712) (470) (1,508)
Prepared on Australian Accounting Standards basis.

Tourism Australian Budget Statements
3.2.4 Notes to the fin
T ncial statements have bee in accordance with:
• rders;
• Australian Accounting StandAustralian Accounting Board;
• rgen
Assets and liabilities are recognised in the Balance Sheet when and only when it is p ure economic bli e
Revenues and expenses are recogthe flow or consumption or loss omeasured.
The Analysis of Budgeted Fina ments provides an overview of the key elements of Tourism Australia’s financial statements, including variations in major a of 2009-10
ancial statements
he fina n prepared
Finance Minister’s O
ards and Accounting Interpretations issued by the and
Consensus Views of the U t Issues Group.
robable that futabilities can be reliably measur
enefits will flow and the amounts of the assets or d.
nised in the Income Statement when and only when f economic benefits has occurred and can be reliably
ncial State
ggregates from actual to budget estimate of 2010-11.
125


127
Australian Solar Institute
Agency respe
ources and planned rformance


129
TRAL
Section 1: Agency overview an1.1 Strategic Direction State ......................................................131 1.2 Agency Resource Statement........................................................................133 1.3 Budget Measures..........
Section 2: Outcomes and plann2.1 Outcomes and performa
Section 3: Explanatory tables and budgeted financial statements .....................140 .1 Explanatory tables ........................................................................................140
3.2 Budgeted Financial Statements....................................................................140
AUS IAN SOLAR INSTITUTE
d resources...........................................................131 ment.................
................................................................................133
ed performance ...................................................134 nce information ......................................................134
3


ASI Budget Statements
131
11BAUSTRALIAN SOLAR INSTITUTE
34BSection 1: Agency overview and resources
63B1.1 STRATEGIC DIRECTION STATEMENT
The Australian Solar Institute (ASI) is part of the Government’s Clean Energy Initiative program to develop a suite of cost-effective low emission energy technologies. The role of the ASI is to invest in research and development to accelerate to market innovation in photovoltaic and concentrating solar thermal technologies that have the potential to significantly reduce the cost of solar energy compared to other existing energy sources.
The ASI was incorporated in August 2009 as a wholly-owned Commonwealth company under the Commonwealth Authorities and Companies Act 1997 (CAC Act). The ASI’s primary stakeholders are the Australian Government, Australian universities and research institutions, and the global solar industry. The ASI will foster greater collaboration between solar researchers in Australian universities, research institutions and industry, and help forge strong links with peak overseas solar research organisations.
The ASI will also disseminate the results and learnings from solar research for the benefit of the Australian and global solar communities and the Australian public and will act as a catalyst and champion for Australia's leadership strengths in solar research and development. Skills development and knowledge building are also key focus areas of ASI, including dissemination of the knowledge and insights gained from the Australian Government’s $1.500 billion Solar Flagships program.
Key strategic objectives for ASI over the next five years include:
• Fostering and supporting excellent research and development in Australia to accelerate commercial deployment of photovoltaic and solar thermal technologies;
• Driving research that will have a major impact on the efficiency and cost effectiveness of solar technologies to increase their competitiveness with other stationary energy generation;
• Retaining local and attracting international expertise in solar energy research to Australia;
• Supporting growth in skills and capacity in solar technologies for the domestic and international market;
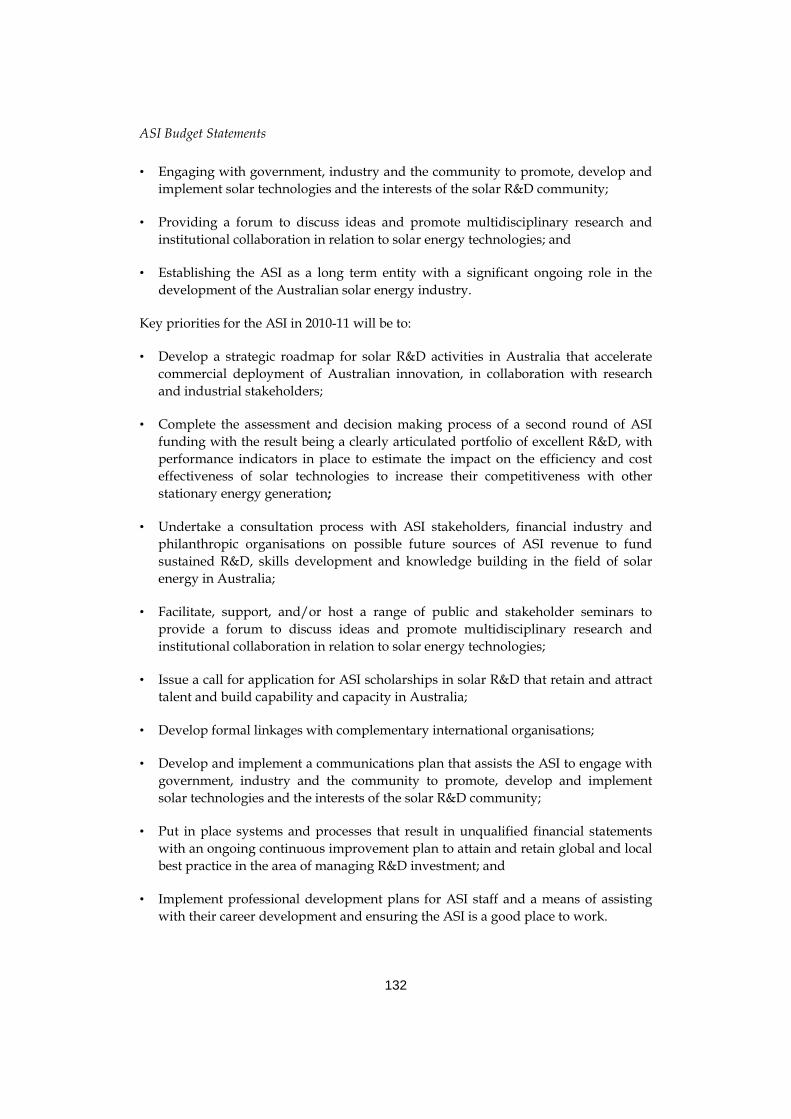
ASI Budget Statements
132
• Engaging with government, industry and the community to promote, develop and implement solar technologies and the interests of the solar R&D community;
• Providing a forum to discuss ideas and promote multidisciplinary research and institutional collaboration in relation to solar energy technologies; and
• Establishing the ASI as a long term entity with a significant ongoing role in the development of the Australian solar energy industry.
Key priorities for the ASI in 2010-11 will be to:
• Develop a strategic roadmap for solar R&D activities in Australia that accelerate commercial deployment of Australian innovation, in collaboration with research and industrial stakeholders;
• Complete the assessment and decision making process of a second round of ASI funding with the result being a clearly articulated portfolio of excellent R&D, with performance indicators in place to estimate the impact on the efficiency and cost effectiveness of solar technologies to increase their competitiveness with other stationary energy generation;
• Undertake a consultation process with ASI stakeholders, financial industry and philanthropic organisations on possible future sources of ASI revenue to fund sustained R&D, skills development and knowledge building in the field of solar energy in Australia;
• Facilitate, support, and/or host a range of public and stakeholder seminars to provide a forum to discuss ideas and promote multidisciplinary research and institutional collaboration in relation to solar energy technologies;
• Issue a call for application for ASI scholarships in solar R&D that retain and attract talent and build capability and capacity in Australia;
• Develop formal linkages with complementary international organisations;
• Develop and implement a communications plan that assists the ASI to engage with government, industry and the community to promote, develop and implement solar technologies and the interests of the solar R&D community;
• Put in place systems and processes that result in unqualified financial statements with an ongoing continuous improvement plan to attain and retain global and local best practice in the area of managing R&D investment; and
• Implement professional development plans for ASI staff and a means of assisting with their career development and ensuring the ASI is a good place to work.

ASI Budget Statements
133
64B1.2 AGENCY RESOURCE STATEMENT
Table 1.1 shows the total resources from all origins. The table summarises how resources will be applied by outcome, and by administered and departmental classification.
Table 1.1: Australian Solar Institute Resource Statement — Budget Estimates for 2010-11 as at Budget May 2010
Estimate Proposed Total Actualof prior + at Budget = estimate available
year amounts appropriationavailable in
Source 2010-11 2010-11 2010-11 2009-10
$'000 $'000 $'000 $'000
Opening balance/Reserves at bank 31,497 - 31,497 -
REVENUE FROM GOVERNMENT
Payments from related entities1
Amounts from the portfolio department - 25,000 25,000 49,460
Total funds from Government - 25,000 25,000 49,460
FUNDS FROM OTHER SOURCES
Interest - 1,175 1,175 496
Total - 1,175 1,175 496
Total net resourcing for ASI 31,497 26,175 57,672 49,956 ASI is not directly appropriated as it is a CAC Act body. Appropriations are made to the Department of Resources, Energy and Tourism, which are then paid to the ASI and are considered 'departmental' for all purposes. 1 Appropriation Bill (No.1) 2010-11
Reader note: All figures are GST exclusive.
65B1.3 BUDGET MEASURES
There are no budget measures relating to the ASI in 2010-11.

ASI Budget Statements
134
35BSection 2: Outcomes and planned performance
66B2.1 OUTCOMES AND PERFORMANCE INFORMATION
Government outcomes are the intended results, impacts or consequences of actions by the Government on the Australian community. Commonwealth programs are the primary vehicle by which government agencies achieve the intended results of their outcome statements. Agencies are required to identify the programs which contribute to Government outcomes over the Budget and forward years.
Each outcome is described below together with its related programs, specifying the performance indicators and targets used to assess and monitor the performance of the ASI in achieving Government outcomes.
Outcome 1: Encourage innovation and cost effective developments in solar energy technologies to accelerate commercial deployment through knowledge building and collaborative research, development and support for Australian industries and research institutions.
136BOutcome 1 Strategy
Provide grant funding and other support to innovative research and development projects, skills development programs, and knowledge building activities.

ASI Budget Statements
135
163BOutcome Expense and Resource Statement
Table 2.1 provides an overview of the total expenses for Outcome 1, by program.
Table 2.1: Budgeted Expenses and Resources for Outcome 1
Outcome 1: Encourage innovation and cost effective developments in solar energy technologies to accelerate commercial deployment through knowledge building and collaborative research, development and support for Australian industries and research institutions.
2009-10 2010-11
Estimated Estimatedactual expenses
expenses$'000 $'000
Program 1: Investment in excellent innovative solar research and development. Revenue from Government
Payment from related entities 9,872 22,134Revenues from other independent sources 99 1,040
Total for Program 1 9,971 23,174
Program 2: Skills development and capacity building within the Australian solar industry.
Revenue from GovernmentPayment from related entities 775 1,317
Revenues from other independent sources 8 62
Total for Program 2 783 1,379
Program 3: Knowledge building and communication throughout the Australian solar industry.
Revenue from GovernmentPayment from related entities 876 1,549
Revenues from other independent sources 9 73
Total for Program 3 885 1,622
Outcome 1 Totals by resource typeRevenue from Government
Payment from related entities 11,523 25,000Revenues from other independent sources 116 1,175
Total expenses for Outcome 1 11,639 26,175
2009-10 2010-11Average Staffing Level (number) 5 5 Note: Departmental appropriation splits and totals are indicative estimates and may change in the course of the budget year as government priorities change.
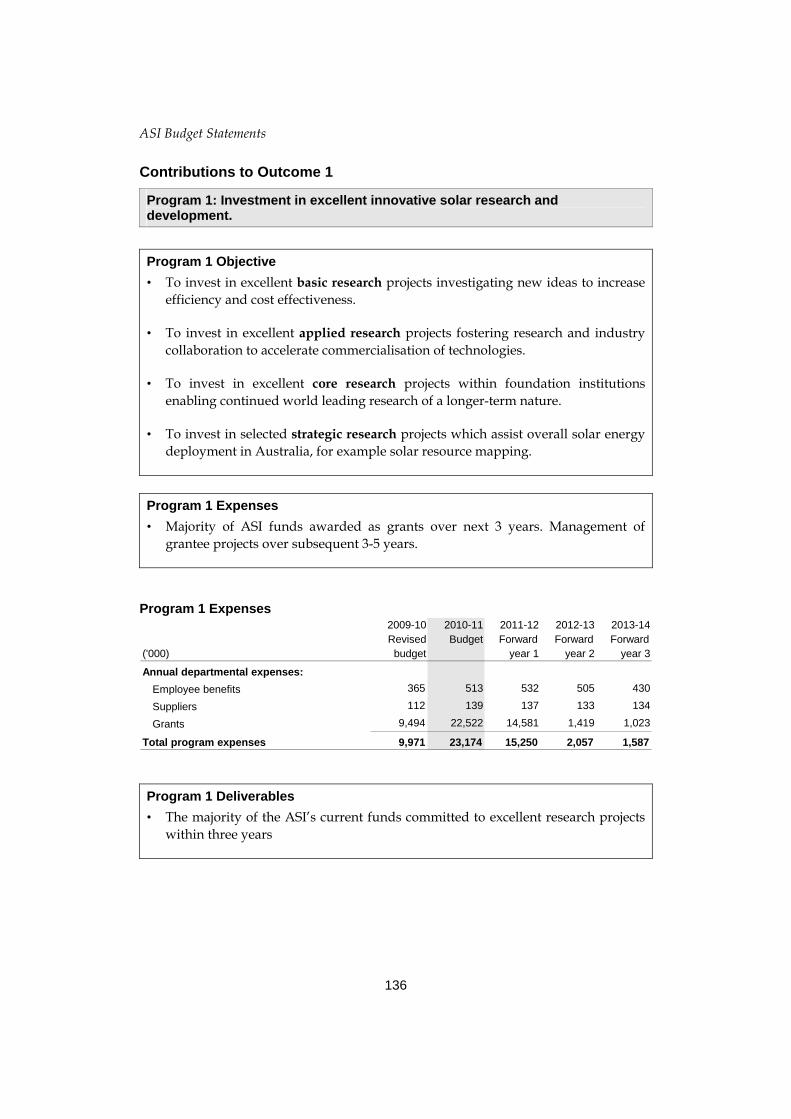
ASI Budget Statements
136
137BContributions to Outcome 1
Program 1: Investment in excellent innovative solar research and development.
Program 1 Objective
• To invest in excellent basic research projects investigating new ideas to increase efficiency and cost effectiveness.
• To invest in excellent applied research projects fostering research and industry collaboration to accelerate commercialisation of technologies.
• To invest in excellent core research projects within foundation institutions enabling continued world leading research of a longer-term nature.
• To invest in selected strategic research projects which assist overall solar energy deployment in Australia, for example solar resource mapping.
Program 1 Expenses
• Majority of ASI funds awarded as grants over next 3 years. Management of grantee projects over subsequent 3-5 years.
Program 1 Expenses 2009-10 2010-11 2011-12 2012-13 2013-14Revised Budget Forward Forward Forward
('000) budget year 1 year 2 year 3
Annual departmental expenses:
Employee benefits 365 513 532 505 430
Suppliers 112 139 137 133 134
Grants 9,494 22,522 14,581 1,419 1,023
Total program expenses 9,971 23,174 15,250 2,057 1,587
Program 1 Deliverables
• The majority of the ASI’s current funds committed to excellent research projects within three years

ASI Budget Statements
137
Program 1 Key Performance Indicators
• Investment in excellent projects identified through a rigorous assessment process informed by the Research Advisory Committee.
• Intellectual property generated with commercialisation potential from a number of ASI projects with royalty return forecasts supported by grantees.
• A suitable return on investment identified and achieved on the portfolio of ASI projects.
• ASI funding leverages additional research and development funding and in-kind contributions from research and development project partners.
Program 2: Skills development and capacity building within the Australian solar industry.
Program 2 Objective
• Retain local expertise, and attract international expertise in solar energy research to Australia.
• Support growth in skills and capacity in solar technologies for the domestic and international market.
Program 2 Expenses
• Majority of ASI funds awarded as grants over next 3 years. Management of grantee projects over subsequent 3-5 years.
Program 2 Expenses 2009-10 2010-11 2011-12 2012-13 2013-14Revised Budget Forward Forward Forward
('000) budget year 1 year 2 year 3
Annual departmental expenses:
Employee benefits 365 513 532 505 430
Suppliers 112 139 137 133 134
Grants 306 727 470 46 33
Total program expenses 783 1,379 1,139 684 597

ASI Budget Statements
138
Program 2 Deliverables
• Implementation of a range of skills development and capacity building programs within next three years.
Program 2 Key Performance Indicators
• Net growth in leading researchers undertaking research in Australia.
• Linkages established with complementary international organisations.
• Funding of postgraduate research in solar energy technologies.
Program 3: Knowledge building and communication throughout the Australian solar industry.
Program 3 Objective
• Engage with government, industry and the community to promote, develop and implement solar technologies and the interests of the solar research and development community.
• Promote multidisciplinary research and institutional collaboration and exchange of information in relation to solar energy technologies.
Program 3 Expenses
• Majority of ASI funds awarded as grants over next 3 years. Management of grantee projects over subsequent 3-5 years.
Program 3 Expenses 2009-10 2010-11 2011-12 2012-13 2013-14Revised Budget Forward Forward Forward
('000) budget year 1 year 2 year 3
Annual departmental expenses:
Employee benefits 365 513 532 505 430
Suppliers 112 139 137 133 134
Grants 408 969 627 61 44
Total program expenses 885 1,621 1,296 699 608

ASI Budget Statements
139
Program 3 Deliverables
• Implementation of a range of appropriate knowledge building and communication activities within next three years.
Program 3 Key Performance Indicators
• Linkages established with complementary international organisations.
• Funding of Australian participation in international solar energy research programs.
• Learnings from Solar Flagships program made available to government, industry, research and the broader community.

ASI Budget Statements
140
36BSection 3: Explanatory tables and budgeted financial statements
Section 3 presents explanatory tables and budgeted financial statements which provide a comprehensive snapshot of agency finances for the 2010-11 budget year. It explains how budget plans are incorporated into the financial statements and provides further details of the reconciliation between appropriations and program expenses, movements in administered funds, special accounts and government indigenous expenditure.
67B3.1 EXPLANATORY TABLES
138B3.1.1 Movement of administered funds between years
This statement is not applicable because the ASI has no administered funding.
139B3.1.2 Special Accounts
This statement is not applicable because the ASI has no special accounts.
140B3.1.3 Australian Government Indigenous Expenditure
The 2010-11 Australian Government Indigenous Statement is not applicable because the ASI has no indigenous specific expenses.
68B3.2 BUDGETED FINANCIAL STATEMENTS
141B3.2.1 Differences in agency resourcing and financial statements
The ASI has no significant differences between the resource information presented in the Budget papers and in the Portfolio Budget Statements as a result of differences between whole of government level financial reporting (under Australian Accounting Standard 1049) and entity level financial reporting.
142B3.2.2 Analysis of budgeted financial statements
The budget estimates and forward estimates contained in these Budget Papers have not substantially changed from the initial five-year program budgets submitted to the Department of Resources, Energy and Tourism upon the establishment of the ASI in early 2010.

ASI Budget Statements
141
143B3.2.3 Budgeted financial statements tables
Table 3.2.1 Comprehensive Income Statement (Showing Net Cost of Services) (for the period ended 30 June)1
Estimated Budget Forward Forward Forwardactual estimate estimate estimate estimate
2009-10 2010-11 2011-12 2012-13 2013-14$'000 $'000 $'000 $'000 $'000
EXPENSESEmployee benefits 1,095 1,540 1,595 1,514 1,290 Supplier expenses 335 418 411 399 401 Grants 10,209 24,217 15,678 1,526 1,100 Total expenses 11,639 26,175 17,684 3,439 2,791
LESS: OWN-SOURCE INCOMERevenueInterest 496 1,175 1,019 3,439 2,791 Total revenue 496 1,175 1,019 3,439 2,791 Total own-source income 496 1,175 1,019 3,439 2,791
Net cost of (contribution by)
services 11,143 25,000 16,665 - -
Revenue from Government 49,460 25,000 16,665 - -
Surplus (Deficit) 38,317 - - - - Surplus (Deficit) attributable to
the Australian Government 38,317 - - - -
Total comprehensive income attributable to the Australian Government 38,317 - - - -
Prepared on Australian Accounting Standards basis.
The surplus funds in 2009-10 are committed to the grants programs across the forward years. The profile is subject to change but currently indicates expenditure of the 2009-10 surplus in the following manner:
2009-10 2010-11 2011-12 2012-13 2013-14$'000 $'000 $'000 $'000 $'000
Expenditure of 2009-10 surplus 38,317 - (13,459) (11,635) (7,597)

ASI Budget Statements
142
144B3.2.3 Budgeted financial statements tables (continued)
Table 3.2.2: Budgeted departmental balance sheet (as at 30 June)
Estimated Budget Forward Forward Forwardactual estimate estimate estimate estimate
2009-10 2010-11 2011-12 2012-13 2013-14$'000 $'000 $'000 $'000 $'000
ASSETSFinancial assets
Cash and equivalents 31,497 39,022 14,920 8,626 3,535Trade and other receivables 9,539 6,086 24,087 30,297 35,239
Total financial assets 41,036 45,108 39,007 38,923 38,774Total assets 41,036 45,108 39,007 38,923 38,774
LIABILITIESPayables
Other 2,519 6,529 425 375 263Total payables 2,519 6,529 425 375 263
ProvisionsEmployee provisions 199 208 210 176 142Other 1 54 55 55 52
Total provisions 200 262 265 231 194
Total liabilities 2,719 6,791 690 606 457
Net assets 38,317 38,317 38,317 38,317 38,317
EQUITY*Parent entity interest
Retained surplus(accumulated deficit)
Total parent entity interest 38,317 38,317 38,317 38,317 38,317Total equity 38,317 38,317 38,317 38,317 38,317
38,31738,317 38,317 38,317 38,317
* 'Equity' is the residual interest in assets after deduction of liabilities. Prepared on Australian Accounting Standards basis.
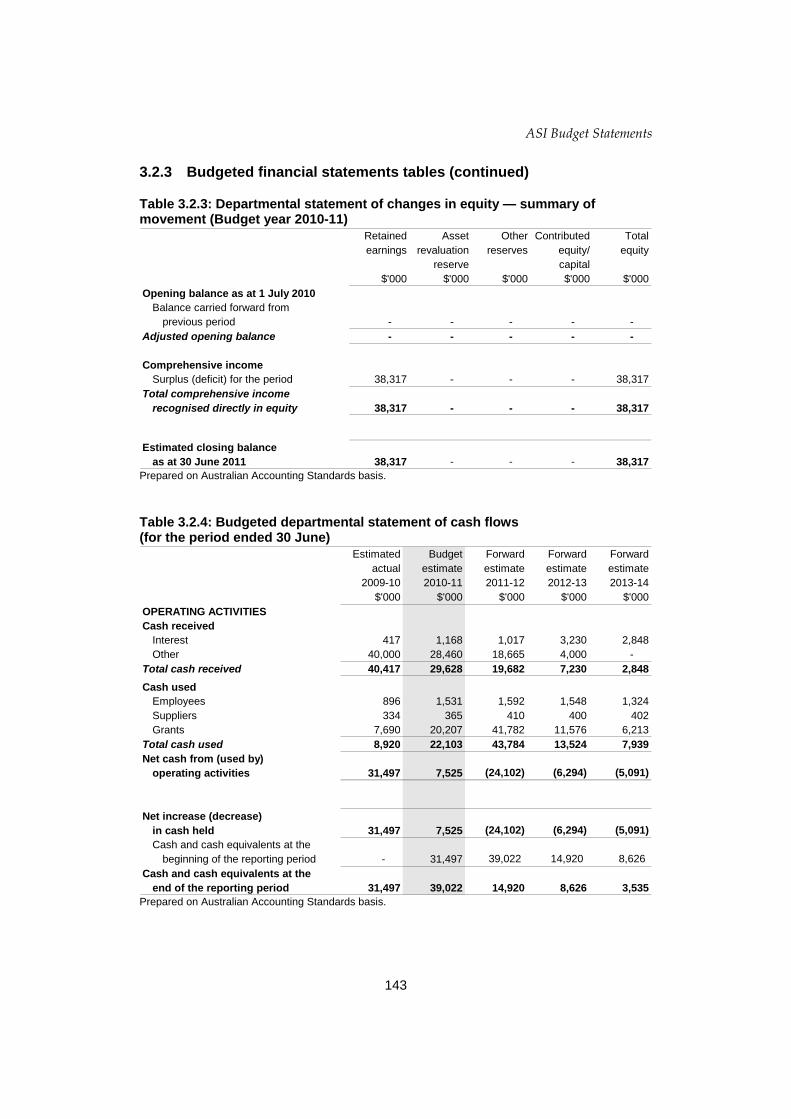
ASI Budget Statements
143
145B3.2.3 Budgeted financial statements tables (continued)
Table 3.2.3: Departmental statement of changes in equity — summary of movement (Budget year 2010-11)
Retained Asset Other Contributed Totalearnings revaluation reserves equity/ equity
reserve capital$'000 $'000 $'000 $'000 $'000
Opening balance as at 1 July 2010Balance carried forward from
previous period - - - - - Adjusted opening balance - - - - -
Comprehensive incomeSurplus (deficit) for the period 38,317 - - - 38,317
Total comprehensive incomerecognised directly in equity 38,317 - - - 38,317
Estimated closing balanceas at 30 June 2011 38,317 - - - 38,317
Prepared on Australian Accounting Standards basis.
Table 3.2.4: Budgeted departmental statement of cash flows (for the period ended 30 June)
Estimated Budget Forward Forward Forwardactual estimate estimate estimate estimate
2009-10 2010-11 2011-12 2012-13 2013-14$'000 $'000 $'000 $'000 $'000
OPERATING ACTIVITIESCash received
Interest 417 1,168 1,017 3,230 2,848Other 40,000 28,460 18,665 4,000 -
Total cash received 40,417 29,628 19,682 7,230 2,848
Cash usedEmployees 896 1,531 1,592 1,548 1,324Suppliers 334 365 410 400 402Grants 7,690 20,207 41,782 11,576 6,213
Total cash used 8,920 22,103 43,784 13,524 7,939Net cash from (used by)
operating activities 31,497 7,525 (24,102) (6,294) (5,091)
Net increase (decrease)in cash held 31,497 7,525 (24,102) (6,294) (5,091) Cash and cash equivalents at the
beginning of the reporting period - 31,497 39,022 14,920 8,626
Cash and cash equivalents at the end of the reporting period 31,497 39,022 14,920 8,626 3,535
Prepared on Australian Accounting Standards basis.

ASI Budget Statements
144
146B3.2.4 Notes to the financial statements
ASI’s budget statements have been prepared on an accrual basis, in accordance with the Finance Minister’s Orders and Australian Accounting Standards.
At the date of preparation of these Budget Papers there are no known current matters, activities, actions, or liabilities that could significantly impact on the projected results.

Portfolio Glossary
145
12BPORTFOLIO GLOSSARY
164BTerm 165BMeaning
Accrual Accounting System of accounting where items are brought to account and included in the financial statements as they are earned or incurred, rather than as they are received or paid.
Accumulated Depreciation The aggregate depreciation recorded for a particular depreciating asset.
Administrative Arrangements Order (AAOs)
The functions and activities of the Government are administered in accordance with AAOs, issued from time to time by the Government and signed by the Governor-General. The AAOs establish the principal matters or government outcomes to be dealt with by each Department of State, and the Acts of Parliament to be administered by each Minister.
Administered Item Appropriation that consists of funding managed on behalf of the Commonwealth. This funding is not at the discretion of the agency and any unspent appropriation is returned to the Consolidated Revenue Fund at the end of the financial year. An administered item is a component of an administered program. It may be a measure but will not constitute a program in its own right.
Additional Estimates Where amounts appropriated at Budget time are insufficient, Parliament may appropriate more funds to portfolios through the Additional Estimates Acts.
Appropriation An amount of public money parliament authorises for spending (i.e. funds to be withdrawn from the Consolidated Revenue Fund). Parliament makes laws for appropriating money under the Annual Appropriation Acts and under Special Appropriations, with spending restricted to the purposes specified in the Appropriation Acts.

Portfolio Glossary
146
166BTerm 167BMeaning
Annual Appropriation Acts of Parliament, which provide appropriation for the government's activities during a specific financial year. Three appropriation Bills are introduced into Parliament in May and comprise the Budget. Further supplementary Bills are introduced later in the financial year as part of the Additional Estimates process. The Parliamentary Departments have their own appropriation Bills.
Capital expenditure Expenditure by an agency on capital projects, for example purchasing a building.
Consolidated Revenue Fund (CRF)
The principal operating fund from which money is drawn to pay for the activities of the Government. Section 81 of the Australian Constitution provides that all revenue raised or monies received by the Executive Government forms one consolidated revenue fund from which appropriation are made for the purposes of the Australian Government.
Departmental Item Resources (assets, liabilities, revenues and expenses) that agency Chief Executive Officers control directly. This includes outsourced activities funded and controlled by the agency. Examples of departmental items include agency running costs, accrued employee entitlements and net appropriations. A departmental item is a component of a departmental program.
Depreciation Apportionment of an asset’s capital value as an expense over its estimated useful life to take account of normal usage, obsolescence, or passage of time.
Estimated Actual Expenses Details the current year’s estimated full final figures as included in the Budget documentation. As the Budget is released in May each year, but the financial year does not close off until 30 June, the current year numbers that are used for comparison with Budget amounts can only be estimates.

Portfolio Glossary
147
168BTerm 169BMeaning
Equity or net assets Residual interest in the assets of an entity after deduction of its liabilities.
Expense Expenses represent the full costs of an activity, that is, the total value of all the resources consumed in producing goods and services or the loss of future economic benefits in the form of reductions in assets or increases in liabilities of the entity. Expenses include cash items such as salary payments as well as expenses that have been incurred, such as accruing employee entitlements that will be paid in the future.
Fair value Valuation methodology: The amount for which an asset could be exchanged or a liability settled between knowledgeable, willing parties in an arm's length transaction.
Measure A new policy or savings decision of the Government with financial impacts. Such proposals are normally made in the context of the annual Budget process.
Operating result Equals revenue less expenses.
Outcomes The Government's objectives in each portfolio area. Outcomes are desired results, impacts or consequences for the Australian community as influenced by the actions of the Australian Government. Actual outcomes are assessments of the end-results or impacts actually achieved.
Output Groups A logical aggregation of agency outputs, where useful, and based either on homogeneity, type of product, business line or beneficiary target group. Aggregation of outputs may also be needed for the provision of adequate information for performance monitoring, or based on a materiality test.
Outputs The goods and services produced by agencies on behalf of government for external organisations or individuals. Outputs also include goods and services for other areas of government external to the agency.
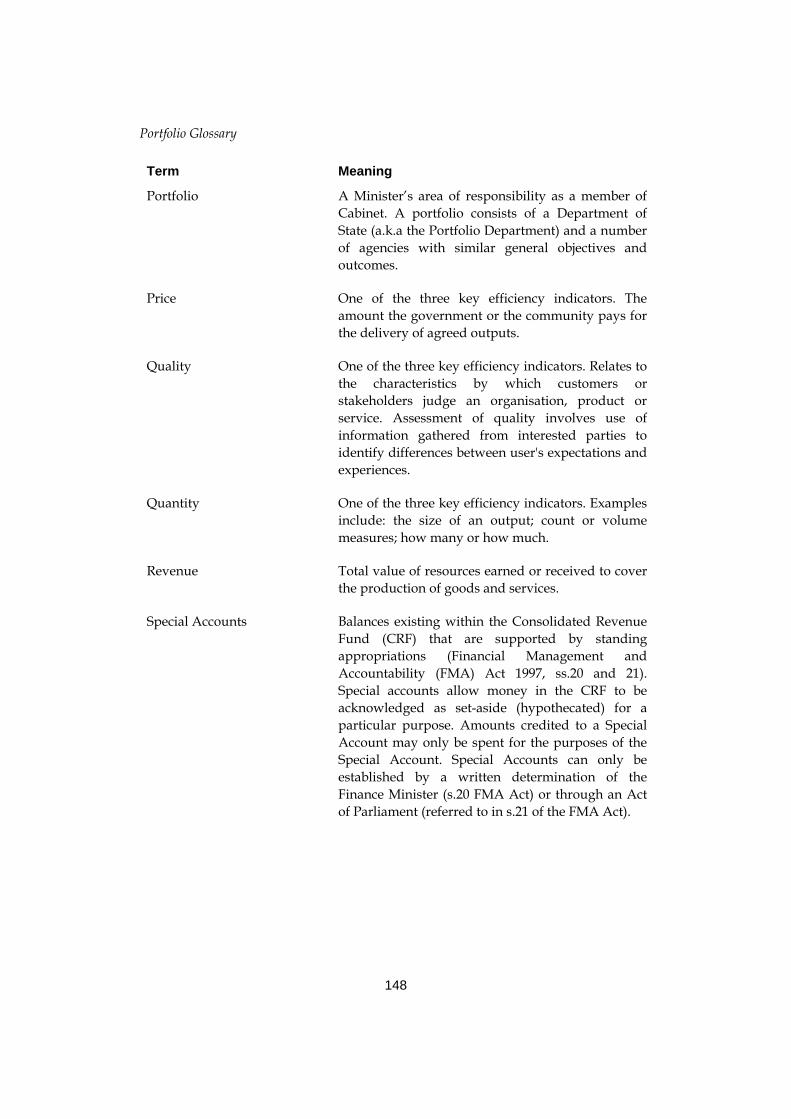
Portfolio Glossary
148
170BTerm 171BMeaning
Portfolio A Minister’s area of responsibility as a member of Cabinet. A portfolio consists of a Department of State (a.k.a the Portfolio Department) and a number of agencies with similar general objectives and outcomes.
Price One of the three key efficiency indicators. The amount the government or the community pays for the delivery of agreed outputs.
Quality One of the three key efficiency indicators. Relates to the characteristics by which customers or stakeholders judge an organisation, product or service. Assessment of quality involves use of information gathered from interested parties to identify differences between user's expectations and experiences.
Quantity One of the three key efficiency indicators. Examples include: the size of an output; count or volume measures; how many or how much.
Revenue Total value of resources earned or received to cover the production of goods and services.
Special Accounts Balances existing within the Consolidated Revenue Fund (CRF) that are supported by standing appropriations (Financial Management and Accountability (FMA) Act 1997, ss.20 and 21). Special accounts allow money in the CRF to be acknowledged as set-aside (hypothecated) for a particular purpose. Amounts credited to a Special Account may only be spent for the purposes of the Special Account. Special Accounts can only be established by a written determination of the Finance Minister (s.20 FMA Act) or through an Act of Parliament (referred to in s.21 of the FMA Act).

Portfolio Glossary
149
172BTerm 173BMeaning
Special Appropriations (including Standing Appropriations)
An amount of money appropriated by a particular Act of Parliament for a specific purpose and number of years. For special appropriations the authority to withdraw funds from the Consolidated Revenue Fund does not generally cease at the end of the financial year.
Standing appropriations are a sub-category consisting of ongoing special appropriations — the amount appropriated will depend on circumstances specified in the legislation.