portfolio budget statements · the purpose of the 2016–17 portfolio budget statements (pb...
TRANSCRIPT

Portfolio Budget Statements 2016–17
Budget Related Paper No. 1.6
Employment Portfolio
Budget Initiatives and Explanations of Appropriations Specified by Outcomes
and Programs by Entity
ii
© Commonwealth of Australia 2016
ISSN 2203–5583 (Print) ISSN 2203–5591 (Online)
This publication is available for your use under a Creative Commons BY Attribution 3.0 Australia licence, with the exception of the Commonwealth Coat of Arms, the Department of Employment logo, photographs, images, signatures and where otherwise stated. The full licence terms are available from http://creativecommons.org/licenses/by/3.0/au/legalcode.
Use of Department of Employment material under a Creative Commons BY Attribution 3.0 Australia licence requires you to attribute the work (but not in any way that suggests that the Department of Employment endorses you or your use of the work).
Department of Employment material used 'as supplied'
Provided you have not modified or transformed Department of Employment material in any way including, for example, by changing the Department of Employment text; calculating percentage changes; graphing or charting data; or deriving new statistics from published Department of Employment statistics—then Department of Employment prefers the following attribution:
Source: The Australian Government Department of Employment
Derivative material
If you have modified or transformed Department of Employment material, or derived new material from those of the Department of Employment in any way, then the Department of Employment prefers the following attribution:
Based on The Australian Government Department of Employment data
Use of the Coat of Arms
The terms under which the Coat of Arms can be used are set out on the It’s an Honour website (see www.itsanhonour.gov.au)
Other uses
Enquiries regarding this licence and any other use of this document are welcome at:
Department of Employment GPO Box 9880 Canberra ACT 2600 Tel: +61 1300 488 064
iii
iv
Abbreviations and conventions
The following notation may be used:
NEC/nec not elsewhere classified
- nil
.. not zero, but rounded to zero
na not applicable (unless otherwise specified)
nfp not for publication
$m $ million
$b $ billion
Figures in tables and in the text may be rounded. Figures in text are generally rounded to one decimal place, whereas figures in tables are generally rounded to the nearest thousand. Discrepancies in tables between totals and sums of components are due to rounding.
Enquiries
Should you have any enquiries regarding this publication please contact Glen Casson, Chief Finance Officer, Department of Employment on 1300 488 064.
Links to Portfolio Budget Statements (including Portfolio Additional Estimates Statements and Portfolio Supplementary Additional Estimates Statements) can be located on the Australian Government Budget website at: www.budget.gov.au.
v
USER GUIDE TO THE
PORTFOLIO BUDGET STATEMENTS
vi
USER GUIDE
The purpose of the 2016–17 Portfolio Budget Statements (PB Statements) is to inform Senators and Members of Parliament of the proposed allocation of resources to government outcomes by entities within the portfolio. Entities receive resources from the annual appropriations acts, special appropriations (including standing appropriations and special accounts), and revenue from other sources.
A key role of the PB Statements is to facilitate the understanding of proposed annual appropriations in Appropriation Bills (No. 1 and No. 2) 2016–17 (or Appropriation (Parliamentary Departments) Bill (No. 1) 2016–17 for the parliamentary departments). In this sense the PB Statements are Budget related papers and are declared by the Appropriation Acts to be ‘relevant documents’ to the interpretation of the Acts according to section 15AB of the Acts Interpretation Act 1901.
The PB Statements provide information, explanation and justification to enable Parliament to understand the purpose of each outcome proposed in the Bills.
As required under section 12 of the Charter of Budget Honesty Act 1998, only entities within the general government sector are included as part of the Commonwealth general government sector fiscal estimates and produce PB Statements where they receive funding (either directly or via portfolio departments) through the annual appropriation acts.
vii
CONTENTS
Portfolio overview ......................................................................................................... 1
Employment portfolio overview ....................................................................................... 3
Entity resources and planned performance ............................................................... 7
Department of Employment ............................................................................................ 9
Asbestos Safety and Eradication Agency ..................................................................... 47
Comcare, the Safety, Rehabilitation and Compensation Commission, and the Seafarers Safety, Rehabilitation and Compensation Authority ..................................... 67
Fair Work Commission .................................................................................................. 97
Fair Work Ombudsman ............................................................................................... 119
Office of the Fair Work Building Industry Inspectorate................................................ 141
Safe Work Australia..................................................................................................... 161
Workplace Gender Equality Agency ........................................................................... 183
Portfolio glossary ...................................................................................................... 205


PORTFOLIO OVERVIEW

Portfolio Overview
3
EMPLOYMENT PORTFOLIO OVERVIEW
Minister and portfolio responsibilities
Senator the Hon Michaelia Cash is responsible for the Employment portfolio, which assists the Australian Government to achieve its objectives for employment.
The Employment portfolio provides advice, support, programs and services to the Australian Government and wider community. The portfolio works with other Australian Government agencies, state and territory governments and a range of service providers to connect people with jobs, workplaces with safety and business with productivity.
The Department of Employment is responsible for national policies and programs that help Australians find and keep employment and work in safe, fair and productive workplaces.
The Asbestos Safety and Eradication Agency is dedicated to working with jurisdictions and affected parties to facilitate a national approach to the eradication, handling and awareness of asbestos.
Comcare, the Safety, Rehabilitation and Compensation Commission, and the Seafarers Safety, Rehabilitation and Compensation Authority contribute to a secure, safer, fairer and more productive Australia. Comcare partners with workers, their employers and unions to keep workers healthy and safe, and reduce the incidence and cost of workplace injury and disease.
The Fair Work Commission is Australia’s national workplace relations tribunal. It is responsible for administering provisions of the Fair Work Act 2009 as well as a range of other functions.
The Fair Work Ombudsman promotes harmonious, productive and cooperative workplace relations and ensures compliance with Commonwealth workplace laws.
The Office of the Fair Work Building Industry Inspectorate is responsible for ensuring compliance with workplace laws in building and construction workplaces and delivering impartial advice to the building and construction industry.
Safe Work Australia is leading the development of policy to improve work health and safety and workers’ compensation arrangements across Australia.
The Workplace Gender Equality Agency is responsible for promoting and improving gender equality in Australian workplaces and administering the Workplace Gender Equality Act 2012.
Portfolio Overview
4
For information on resourcing across the portfolio, please refer to Part 1: Agency Financial Resourcing in Budget Paper No. 4: Agency Resourcing.
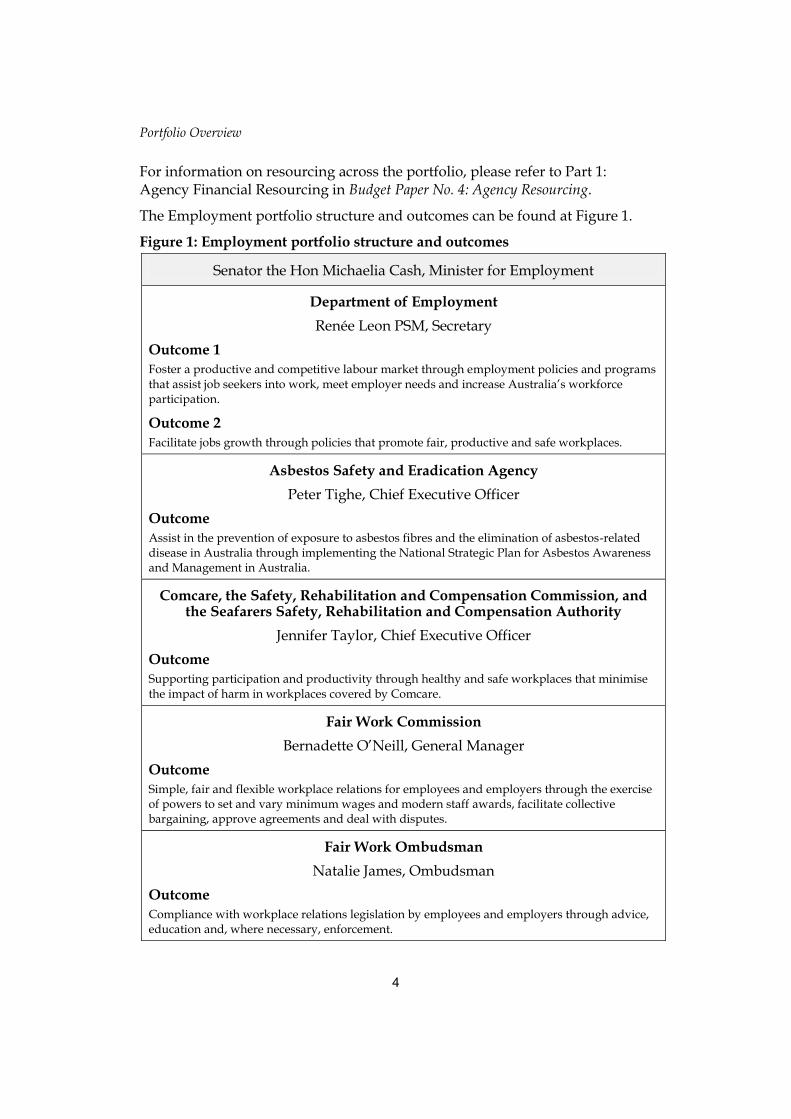
The Employment portfolio structure and outcomes can be found at Figure 1.
Figure 1: Employment portfolio structure and outcomes
Senator the Hon Michaelia Cash, Minister for Employment
Department of Employment
Renée Leon PSM, Secretary
Outcome 1
Foster a productive and competitive labour market through employment policies and programs that assist job seekers into work, meet employer needs and increase Australia’s workforce participation.
Outcome 2
Facilitate jobs growth through policies that promote fair, productive and safe workplaces.
Asbestos Safety and Eradication Agency
Peter Tighe, Chief Executive Officer
Outcome
Assist in the prevention of exposure to asbestos fibres and the elimination of asbestos-related disease in Australia through implementing the National Strategic Plan for Asbestos Awareness and Management in Australia.
Comcare, the Safety, Rehabilitation and Compensation Commission, and the Seafarers Safety, Rehabilitation and Compensation Authority
Jennifer Taylor, Chief Executive Officer
Outcome
Supporting participation and productivity through healthy and safe workplaces that minimise the impact of harm in workplaces covered by Comcare.
Fair Work Commission
Bernadette O’Neill, General Manager
Outcome
Simple, fair and flexible workplace relations for employees and employers through the exercise of powers to set and vary minimum wages and modern staff awards, facilitate collective bargaining, approve agreements and deal with disputes.
Fair Work Ombudsman
Natalie James, Ombudsman
Outcome
Compliance with workplace relations legislation by employees and employers through advice, education and, where necessary, enforcement.

Portfolio Overview
5
Figure 1: Employment portfolio structure and outcomes (continued)
Office of the Fair Work Building Industry Inspectorate
Nigel Hadgkiss APM, Director
Outcome
Enforce workplace relations laws in the building and construction industry and ensure compliance with those laws by all participants in the building and construction industry through the provision of education, assistance and advice.
Safe Work Australia
Michelle Baxter, Chief Executive Officer
Outcome
Healthier, safer and more productive workplaces through improvements to Australian work health and safety and workers’ compensation arrangements.
Workplace Gender Equality Agency
Libby Lyons, Director
Outcome
Promote and improve gender equality in Australian workplaces including the provision of advice and assistance to employers and the assessment and measurement of workplace gender data.

7
ENTITY RESOURCES AND PLANNED PERFORMANCE
Department of Employment ......................................................................................... 9
Asbestos Safety and Eradication Agency ................................................................ 47
Comcare, the Safety, Rehabilitation and Compensation Commission, and the Seafarers Safety, Rehabilitation and Compensation Authority................ 67
Fair Work Commission ............................................................................................... 97
Fair Work Ombudsman ............................................................................................. 119
Office of the Fair Work Building Industry Inspectorate ........................................ 141
Safe Work Australia .................................................................................................. 161
Workplace Gender Equality Agency ....................................................................... 183


Department of Employment
Entity resources and planned performance

11
DEPARTMENT OF EMPLOYMENT
Section 1: Entity overview and resources ................................................................ 13
1.1 Strategic direction statement .......................................................................... 13
1.2 Entity resource statement ............................................................................... 15
1.3 Budget measures ............................................................................................ 18
Section 2: Outcomes and planned performance ..................................................... 20
2.1 Budgeted expenses and performance for Outcome 1 .................................... 21
2.2 Budgeted expenses and performance for Outcome 2 .................................... 28
Section 3: Budgeted financial statements ................................................................ 34
3.1 Budgeted financial statements........................................................................ 34
3.2 Budgeted financial statements tables ............................................................. 35


Department of Employment Budget Statements
13
DEPARTMENT OF EMPLOYMENT
Section 1: Entity overview and resources
1.1 STRATEGIC DIRECTION STATEMENT
Employment is central to national economic strength and wellbeing. The purpose of the Department of Employment is to provide policy advice and deliver programs that further the Australian Government’s agenda to create more jobs, increase productivity and foster safe and fair workplaces.
The department has two Outcomes:
Foster a productive and competitive labour market through employment policies and programs that assist job seekers into work, meet employer needs and increase Australia’s workforce participation.
Facilitate jobs growth through policies that promote fair, productive and safe workplaces.
To achieve these outcomes, the major priorities in 2016–17 include:
lifting young people’s employability skills and providing them with real work experience by implementing a suite of measures under the Government’s Youth Employment Package, central to which is the Youth Jobs PaTH which includes employability skills training, internship placements, the Youth Bonus wage subsidy and the employer mobilisation strategy to encourage participation in the initiative by employers
delivering efficient and effective employment services, helping more job seekers find and keep a job, through the continued implementation of jobactive
encouraging more businesses to employ eligible job seekers, helping expand businesses and boost the economy, including through improved wage subsidies and reducing red tape for employers
encouraging entrepreneurship and self-employment among young people, including through the expansion of the New Enterprise Incentive Scheme to assist up to 8600 participants each year start and manage their own small business by providing nationally-accredited training, mentoring and business advice and other support
supporting young people and parents to prepare for employment through the continued delivery of the Transition to Work service, Empowering YOUth initiatives and ParentsNext

Department of Employment Budget Statements
14
providing work-like experiences for job seekers, improving job prospects and developing employability skills, while contributing to community activities through the National Work Experience Programme and Work for the Dole
strengthening the job seeker compliance framework so that it provides the necessary incentive for job seekers to comply with their mutual obligation requirements
developing policies to improve workforce participation opportunities for all Australians, specifically young people, mature-age people, Indigenous Australians, women and parents
assisting workers who have unpaid employment entitlements when they are made redundant by the liquidation or bankruptcy of their employer
working cooperatively and productively to ensure an effective, productive and fair national workplace relations system
contributing to higher productivity through implementation of national approaches to workplace health and safety and workers’ compensation laws, as well as advising government on reforms to improve the Comcare workers’ compensation scheme
providing legal and policy advice on the operation of the national workplace relations system
engaging with relevant international forums to promote Australia’s national interests and inform domestic policies
identifying and implementing opportunities to contribute to the government’s deregulation agenda by reducing unnecessary compliance burdens and leading cultural change.
The unemployment rate—particularly amongst young people—and future changes in the nature of the workplace and workforce participation are ongoing challenges for the department. Development of evidence-based policies and the formulation of long-term strategies to shape the future of Australia’s labour force will assist the department to meet these challenges.
Further information about the activities of the Department of Employment can be found at www.employment.gov.au and in the Department of Employment Corporate Plan 2015–2019.
Budget measures for 2016–17 for the department are presented in Table 1.2.

Department of Employment Budget Statements
15
1.2 ENTITY RESOURCE STATEMENT
Table 1.1 shows the total funding from all sources available to the entity for its operations and to deliver programs and services on behalf of the government.
The table summarises how resources will be applied by outcome (government strategic policy objectives) and by administered (on behalf of the government or the public) and departmental (for the entity’s operations) classification.
For more detailed information please refer to Budget Paper No. 4—Agency Resourcing.
Information in this table is presented on a resourcing (i.e. appropriations/cash available) basis, whilst the ‘Budgeted expenses by Outcome X’ tables in Section 2 and the financial statements in Section 3 are presented on an accrual basis.
Table 1.1: Department of Employment resource statement—Budget estimates for 2016–17 as at Budget May 2016
2015–16
Estimated actual
$'000
2016–17
Estimate
$'000
Departmental
Annual appropriations - ordinary annual services (a)
Prior year appropriations available 115,528 111,713
Departmental appropriation (b) (c) 280,305 283,528
s 74 retained revenue receipts (d) 19,604 13,604
Departmental capital budget (e) 27,378 27,310
Annual appropriations - other services - non-operating (f)
Equity injection 15,408 6,253
Total departmental annual appropriations 458,223 442,408
Total departmental resourcing 458,223 442,408
Administered
Annual appropriations - ordinary annual services (a)
Prior year appropriations available (g) 126,664 -
Outcome 1 (h) 1,250,502 1,645,006
Outcome 2 21,672 19,517
Payments to corporate entities (i) 7,727 6,119
Department of Employment Budget Statements
16
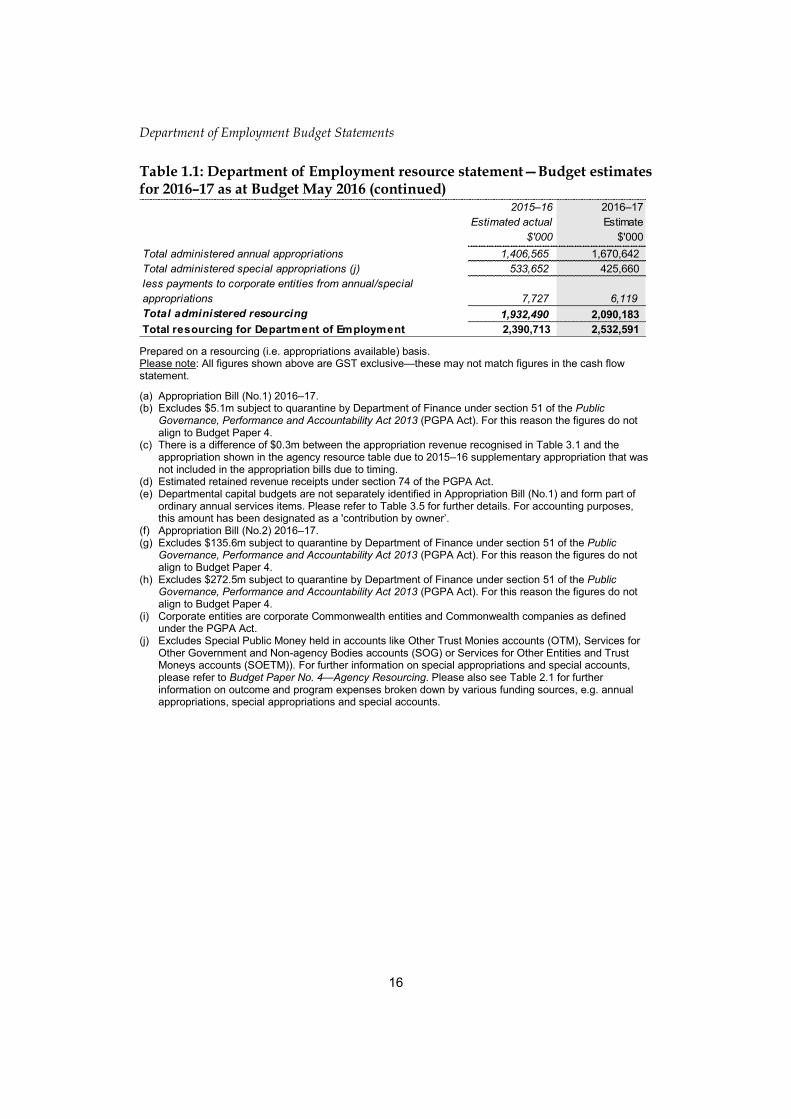
Table 1.1: Department of Employment resource statement—Budget estimates for 2016–17 as at Budget May 2016 (continued)
Prepared on a resourcing (i.e. appropriations available) basis. Please note: All figures shown above are GST exclusive—these may not match figures in the cash flow statement.
(a) Appropriation Bill (No.1) 2016–17. (b) Excludes $5.1m subject to quarantine by Department of Finance under section 51 of the Public
Governance, Performance and Accountability Act 2013 (PGPA Act). For this reason the figures do not align to Budget Paper 4.
(c) There is a difference of $0.3m between the appropriation revenue recognised in Table 3.1 and the appropriation shown in the agency resource table due to 2015–16 supplementary appropriation that was not included in the appropriation bills due to timing.
(d) Estimated retained revenue receipts under section 74 of the PGPA Act. (e) Departmental capital budgets are not separately identified in Appropriation Bill (No.1) and form part of
ordinary annual services items. Please refer to Table 3.5 for further details. For accounting purposes, this amount has been designated as a 'contribution by owner’.
(f) Appropriation Bill (No.2) 2016–17. (g) Excludes $135.6m subject to quarantine by Department of Finance under section 51 of the Public
Governance, Performance and Accountability Act 2013 (PGPA Act). For this reason the figures do not align to Budget Paper 4.
(h) Excludes $272.5m subject to quarantine by Department of Finance under section 51 of the Public Governance, Performance and Accountability Act 2013 (PGPA Act). For this reason the figures do not align to Budget Paper 4.
(i) Corporate entities are corporate Commonwealth entities and Commonwealth companies as defined under the PGPA Act.
(j) Excludes Special Public Money held in accounts like Other Trust Monies accounts (OTM), Services for Other Government and Non-agency Bodies accounts (SOG) or Services for Other Entities and Trust Moneys accounts (SOETM)). For further information on special appropriations and special accounts, please refer to Budget Paper No. 4—Agency Resourcing. Please also see Table 2.1 for further information on outcome and program expenses broken down by various funding sources, e.g. annual appropriations, special appropriations and special accounts.
2015–16
Estimated actual
$'000
2016–17
Estimate
$'000
Total administered annual appropriations 1,406,565 1,670,642
Total administered special appropriations (j) 533,652 425,660
less payments to corporate entities from annual/special
appropriations 7,727 6,119
Total administered resourcing 1,932,490 2,090,183
Total resourcing for Department of Employment 2,390,713 2,532,591
Department of Employment Budget Statements
17
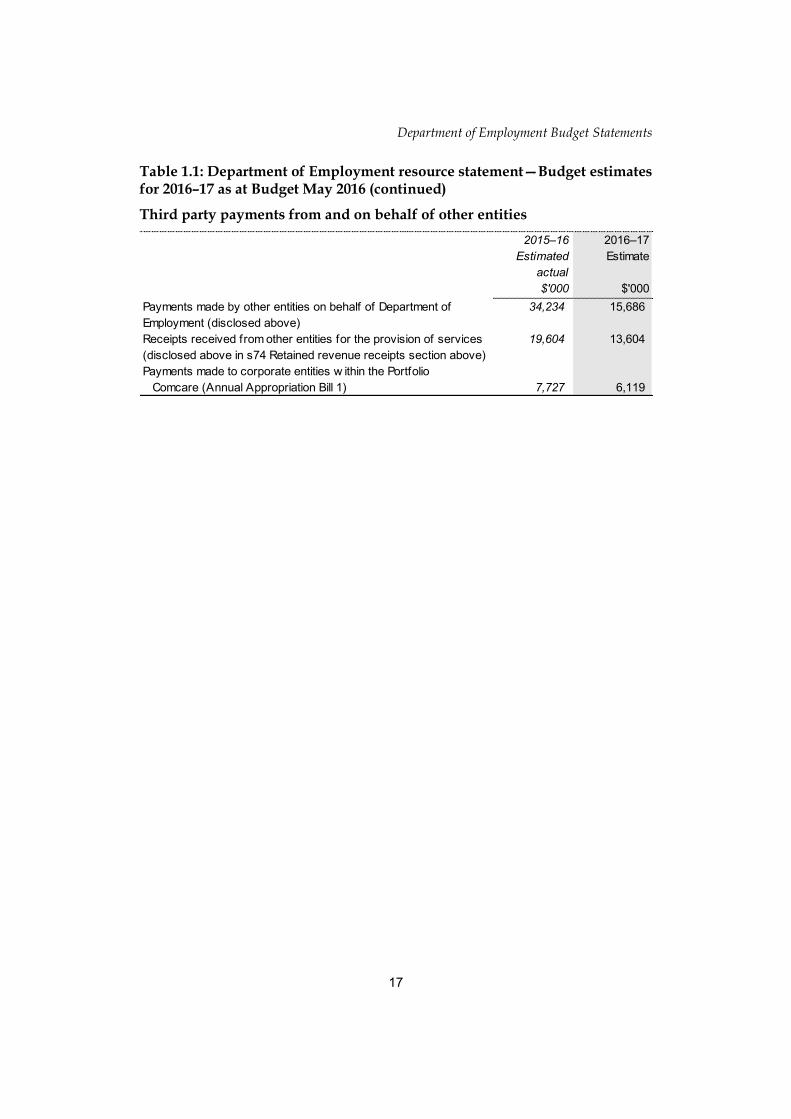
Table 1.1: Department of Employment resource statement—Budget estimates for 2016–17 as at Budget May 2016 (continued)
Third party payments from and on behalf of other entities
2015–16
Estimated
actual
$'000
2016–17
Estimate
$'000
Payments made by other entities on behalf of Department of
Employment (disclosed above)
34,234 15,686
Receipts received from other entities for the provision of services
(disclosed above in s74 Retained revenue receipts section above)
19,604 13,604
Payments made to corporate entities w ithin the Portfolio
Comcare (Annual Appropriation Bill 1) 7,727 6,119

Department of Employment Budget Statements
18
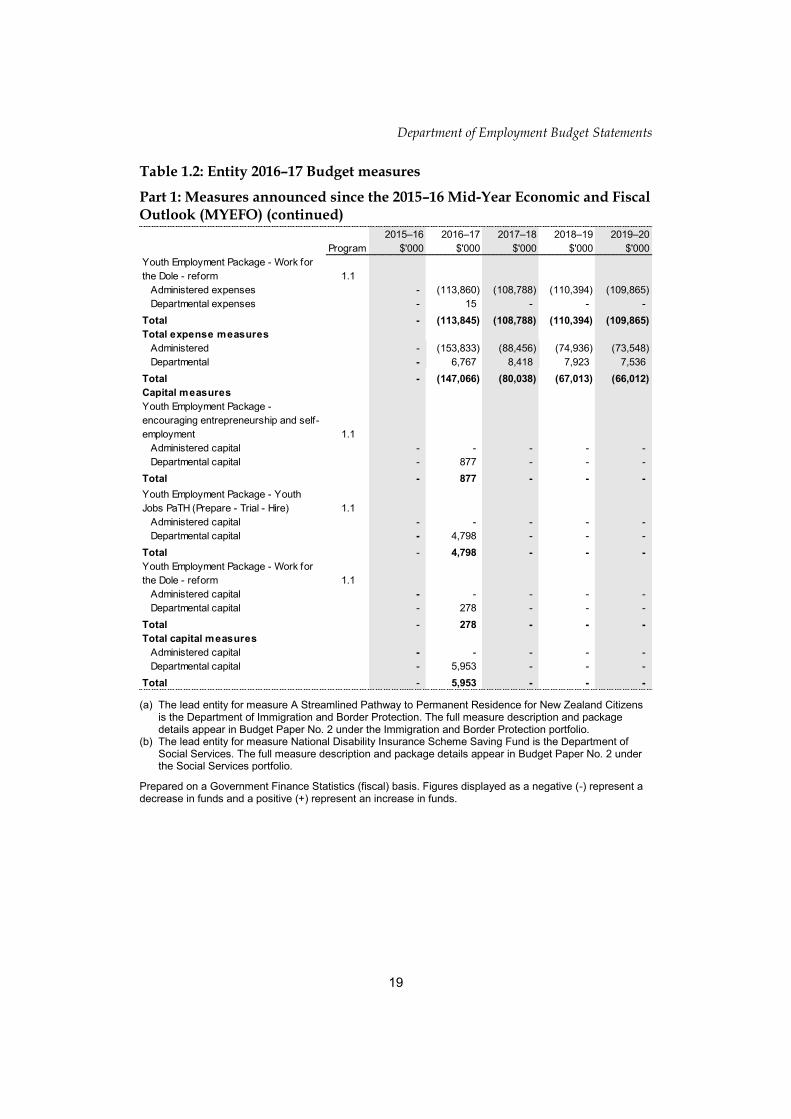
1.3 BUDGET MEASURES
Budget measures in Part 1 relating to the Department of Employment are detailed in Budget Paper No. 2 and are summarised below.
Table 1.2: Entity 2016–17 Budget measures
Part 1: Measures announced since the 2015–16 Mid-Year Economic and Fiscal Outlook (MYEFO)
Program
2015–16
$'000
2016–17
$'000
2017–18
$'000
2018–19
$'000
2019–20
$'000
Revenue measures
Seacare Scheme - cost recovery
arrangements 2.3
Administered revenues - nfp nfp nfp nfp
Departmental revenues - nfp nfp nfp nfp
Total - nfp nfp nfp nfp
Total revenue measures
Administered - nfp nfp nfp nfp
Departmental - nfp nfp nfp nfp
Total - nfp nfp nfp nfp
Expense measures
A Streamlined Pathw ay to Permanent
Residence for New Zealand Citizens (a) 1.1
Administered expenses - - - - 184
Departmental expenses - - - - -
Total - - - - 184
Job Commitment Bonus - cessation 1.1
Administered expenses - (47,677) (63,571) (62,732) (62,178)
Departmental expenses - - (192) (263) (264)
Total - (47,677) (63,763) (62,995) (62,442)
National Disability Insurance Scheme
Savings Fund (b) 1.1
Administered expenses - 124 422 655 613
Departmental expenses - - - - -
Total - 124 422 655 613
Youth Employment Package -
encouraging entrepreneurship and self-
employment 1.1
Administered expenses - 13,503 22,265 22,365 22,568
Departmental expenses - 1,777 1,963 1,663 1,591
Total - 15,280 24,228 24,028 24,159
Youth Employment Package - Youth
Jobs PaTH (Prepare - Trial - Hire) 1.1
Administered expenses - (5,923) 61,216 75,170 75,130
Departmental expenses - 4,975 6,647 6,523 6,209
Total - (948) 67,863 81,693 81,339
Department of Employment Budget Statements
19
Table 1.2: Entity 2016–17 Budget measures
Part 1: Measures announced since the 2015–16 Mid-Year Economic and Fiscal Outlook (MYEFO) (continued)
(a) The lead entity for measure A Streamlined Pathway to Permanent Residence for New Zealand Citizens
is the Department of Immigration and Border Protection. The full measure description and package details appear in Budget Paper No. 2 under the Immigration and Border Protection portfolio.
(b) The lead entity for measure National Disability Insurance Scheme Saving Fund is the Department of Social Services. The full measure description and package details appear in Budget Paper No. 2 under the Social Services portfolio.
Prepared on a Government Finance Statistics (fiscal) basis. Figures displayed as a negative (-) represent a decrease in funds and a positive (+) represent an increase in funds.
Program
2015–16
$'000
2016–17
$'000
2017–18
$'000
2018–19
$'000
2019–20
$'000
Youth Employment Package - Work for
the Dole - reform 1.1
Administered expenses - (113,860) (108,788) (110,394) (109,865)
Departmental expenses - 15 - - -
Total - (113,845) (108,788) (110,394) (109,865)
Total expense measures
Administered - (153,833) (88,456) (74,936) (73,548)
Departmental - 6,767 8,418 7,923 7,536
Total - (147,066) (80,038) (67,013) (66,012)
Capital measures
Youth Employment Package -
encouraging entrepreneurship and self-
employment 1.1
Administered capital - - - - -
Departmental capital - 877 - - -
Total - 877 - - -
Youth Employment Package - Youth
Jobs PaTH (Prepare - Trial - Hire) 1.1
Administered capital - - - - -
Departmental capital - 4,798 - - -
Total - 4,798 - - -
Youth Employment Package - Work for
the Dole - reform 1.1
Administered capital - - - - -
Departmental capital - 278 - - -
Total - 278 - - -
Total capital measures
Administered capital - - - - -
Departmental capital - 5,953 - - -
Total - 5,953 - - -

Department of Employment Budget Statements
20
Section 2: Outcomes and planned performance
Government outcomes are the intended results, impacts or consequences of actions by the Government on the Australian community. Commonwealth programs are the primary vehicle by which government entities achieve the intended results of their outcome statements. Entities are required to identify the programs which contribute to government outcomes over the Budget and forward years.
Each outcome is described below together with its related programs. The following provides detailed information on expenses for each outcome and program, further broken down by funding source.
Note:
From 1 July 2015, performance reporting requirements in the Portfolio Budget Statements sit alongside those required under the enhanced Commonwealth performance framework. It is anticipated that the performance criteria described in Portfolio Budget Statements will be read with broader information provided in an entity’s corporate plans and annual performance statements—included in annual reports from October 2016—to provide an entity’s complete performance story.
Department of Employment Budget Statements
21
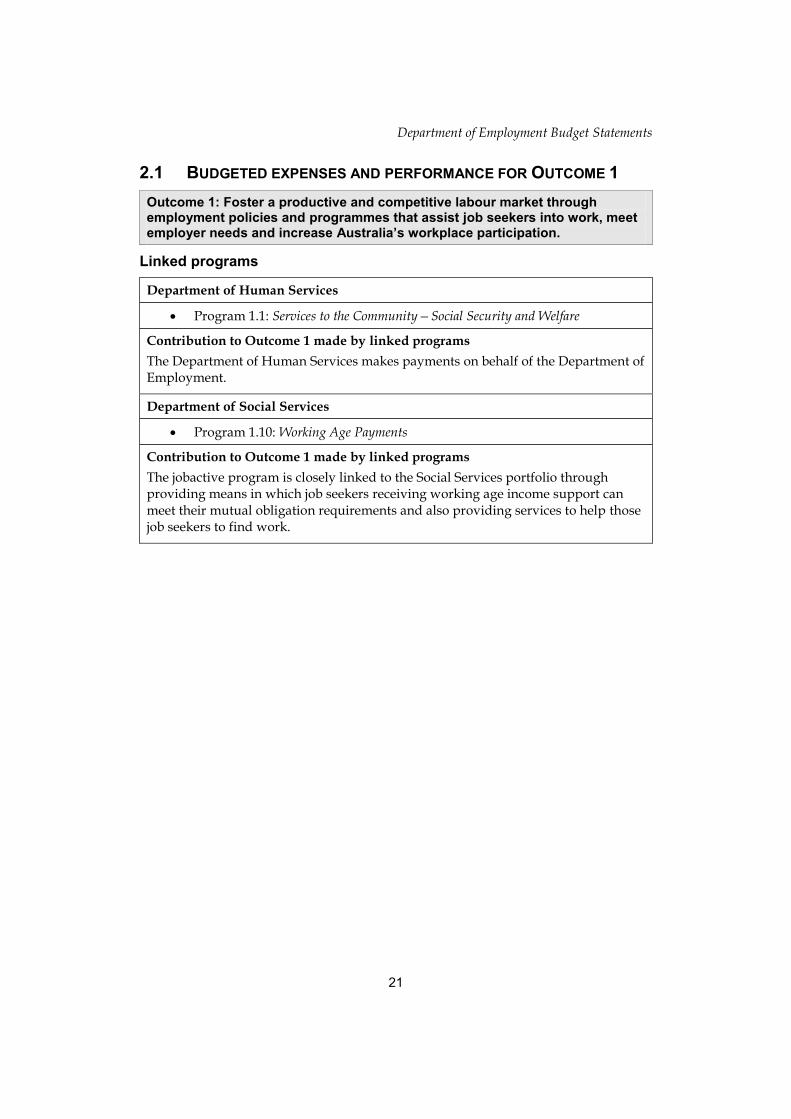
2.1 BUDGETED EXPENSES AND PERFORMANCE FOR OUTCOME 1
Outcome 1: Foster a productive and competitive labour market through employment policies and programmes that assist job seekers into work, meet employer needs and increase Australia’s workplace participation.
Linked programs
Department of Human Services
Program 1.1: Services to the Community—Social Security and Welfare
Contribution to Outcome 1 made by linked programs
The Department of Human Services makes payments on behalf of the Department of Employment.
Department of Social Services
Program 1.10: Working Age Payments
Contribution to Outcome 1 made by linked programs
The jobactive program is closely linked to the Social Services portfolio through providing means in which job seekers receiving working age income support can meet their mutual obligation requirements and also providing services to help those job seekers to find work.

Department of Employment Budget Statements
22
Budgeted expenses for Outcome 1
This table shows how much the entity intends to spend (on an accrual basis) on achieving the outcome, broken down by program, as well as by Administered and Departmental funding sources.
Table 2.1.1: Budgeted expenses for Outcome 1
(a) Estimated expenses incurred in relation to receipts retained under section 74 of the PGPA Act. (b) Expenses not requiring appropriation in the Budget year are made up of depreciation expenses,
amortisation expenses and audit fees. Note: Departmental appropriation splits and totals are indicative estimates and may change in the course of the budget year as government priorities change.
2015–16
Estimated
actual
$'000
2016–17
Budget
$'000
2017–18
Forw ard
estimate
$'000
2018–19
Forw ard
estimate
$'000
2019–20
Forw ard
estimate
$'000
Administered expenses
jobactive 1,180,356 1,506,292 1,584,790 1,599,846 1,601,364
Job Commitment Bonus 34,234 15,686 - - -
Empow ering YOUth Initiatives 10,100 17,600 17,600 5,050 50
ParentsNext 2,721 14,322 21,080 20,191 20,191
Transition to Work 18,541 89,405 96,855 99,618 99,618
Seasonal Worker Programme 1,277 1,701 1,727 1,752 1,780
Mature Age Employment 3,273 - - - -
Administered total 1,250,502 1,645,006 1,722,052 1,726,457 1,723,003
Total expenses for Program 1.1 1,250,502 1,645,006 1,722,052 1,726,457 1,723,003
Administered expenses
Ordinary annual services
(Appropriation Bill No. 1)
1,250,502 1,645,006 1,722,052 1,726,457 1,723,003
Administered total 1,250,502 1,645,006 1,722,052 1,726,457 1,723,003
Departmental expenses
Departmental appropriation 210,229 214,338 217,253 216,747 215,390
s 74 Retained revenue receipts (a) 14,703 10,203 10,203 10,203 10,203
Expenses not requiring appropriation
in the Budget year (b)
18,638 21,556 22,312 22,289 22,298
Departmental total 243,570 246,097 249,768 249,239 247,891
Total expenses for Outcome 1 1,494,072 1,891,103 1,971,820 1,975,696 1,970,894
2015–16 2016–17
Average staffing level (number) 1,273 1,309
Program 1.1: Employment Services
Outcome 1 Totals by appropriation type

Department of Employment Budget Statements
23
Table 2.1.2: Performance criteria for Outcome 1
Table 2.1.2 below details the performance criteria for each program associated with Outcome 1. It also summarises how each program is delivered and where 2016–17 Budget measures have created new programs or materially changed existing programs.
Outcome 1—Foster a productive and competitive labour market through employment policies and programs that assist job seekers into work.
Program 1.1—Employment services
The Australian Government’s employment services system—jobactive—has four key objectives: help job seekers find and keep a job; help job seekers move from welfare to work; help job seekers meet their mutual obligations; and that jobactive organisations deliver quality services. The objectives of Program 1.1 contribute to Outcome 1 by helping job seekers move into employment.
Purpose Our role is to foster a productive and competitive labour market through employment policies and programs that increase workforce participation and facilitate jobs growth.
1
Delivery jobactive services include:
• assisting job seekers to find and keep a job and ensuring employers are provided with job seekers who meet their business needs
• Work for the Dole and the National Work Experience Programme provide job seekers with work-like experience and make a positive contribution to their local community
• New Enterprise Incentive Scheme assists eligible job seekers to start and run a small business
• Harvest Labour Services and the National Harvest Labour Information Service support the requirements of growers in the horticulture industry for harvest workers.
Transition to Work provides intensive assistance to young people who have disengaged from work and study.
The Youth Employment Package delivers a Youth Jobs PaTH for young job seekers under 25 years to improve employment outcomes. This pathway has three elements:
• Prepare: Industry endorsed Employability Skills Training for up to six weeks to develop basic employability skills, including those required to identify and secure sustainable employment.
• Trial: Up to 30,000 internship placements of four to 12 weeks will be offered each year to enable businesses and job seekers to trial their employment fit.
• Hire: An enhanced Youth Bonus wage subsidy of up to $10,000 for job seekers under 25 years with barriers to employment and up to $6,500 for the most job-ready job seekers to support the employment of young people.
The Youth Employment Package also encourages entrepreneurship and self-employment including through expansion of the New Enterprise Incentive Scheme.
1 The Department of Employment’s purpose statement is published within the Department of Employment
Corporate Plan 2015–19.
Department of Employment Budget Statements
24
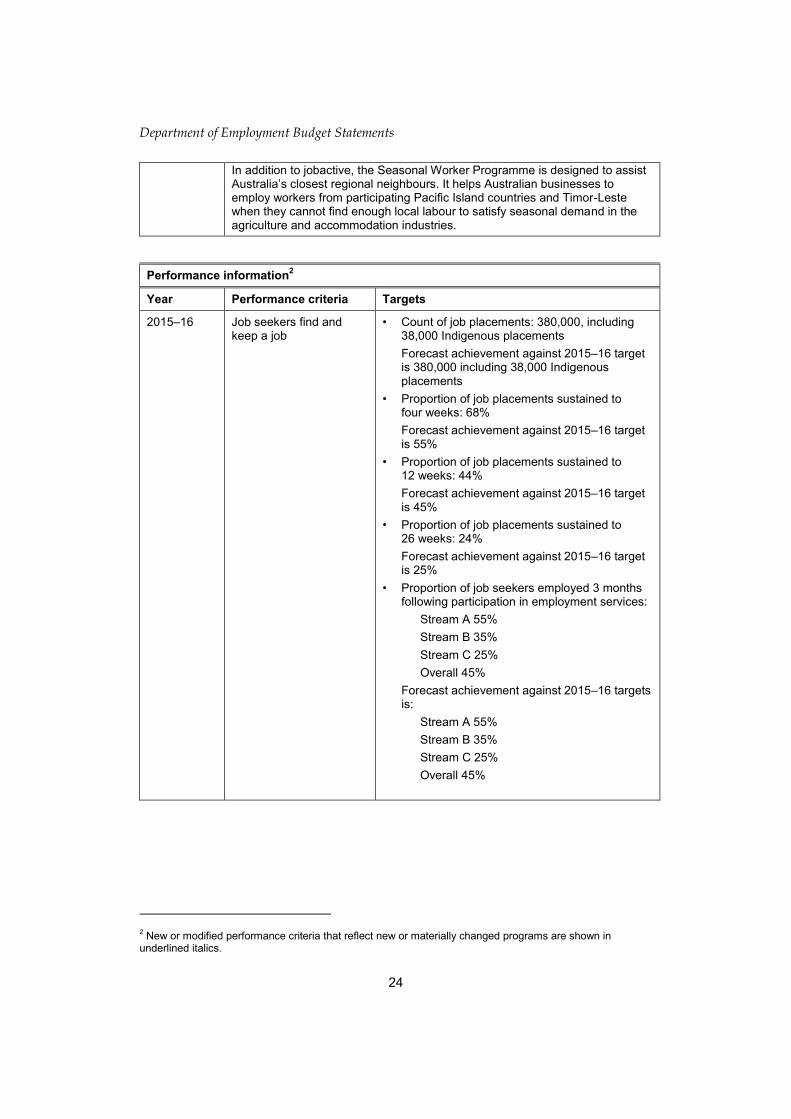
In addition to jobactive, the Seasonal Worker Programme is designed to assist Australia’s closest regional neighbours. It helps Australian businesses to employ workers from participating Pacific Island countries and Timor-Leste when they cannot find enough local labour to satisfy seasonal demand in the agriculture and accommodation industries.
Performance information2
Year Performance criteria Targets
2015–16 Job seekers find and keep a job
• Count of job placements: 380,000, including 38,000 Indigenous placements
Forecast achievement against 2015–16 target is 380,000 including 38,000 Indigenous placements
• Proportion of job placements sustained to four weeks: 68%
Forecast achievement against 2015–16 target is 55%
• Proportion of job placements sustained to 12 weeks: 44%
Forecast achievement against 2015–16 target is 45%
• Proportion of job placements sustained to 26 weeks: 24%
Forecast achievement against 2015–16 target is 25%
• Proportion of job seekers employed 3 months following participation in employment services:
Stream A 55%
Stream B 35%
Stream C 25%
Overall 45%
Forecast achievement against 2015–16 targets is:
Stream A 55%
Stream B 35%
Stream C 25%
Overall 45%
2 New or modified performance criteria that reflect new or materially changed programs are shown in
underlined italics.

Department of Employment Budget Statements
25
Performance information2
Year Performance criteria Targets
2016–17 Job seekers find and keep a job
• Count of job placements: 380,000, including 38,000 Indigenous placements
• Proportion of job placements sustained to four weeks
3: 55%
• Proportion of job placements sustained to 12 weeks: 45%
• Proportion of job placements sustained to 26 weeks
4: 25%
• Proportion of job seekers employed 3 months following participation in employment services:
Stream A 55%
Stream B 35%
Stream C 25%
Overall 45%
2017–18 and beyond
Job seekers find and keep a job
As per 2016–17
2015–16 Job seekers move from welfare to work
• Proportion of job seekers moving off income support, or with reduced reliance on income support, six months after participation in jobactive: 40%
Forecast achievement against 2015–16 target is 40%
• Cost per employment outcome: $25005
Forecast achievement against 2015–16 target is $2500
2016–17 Job seekers move from welfare to work
As per 2015–16
2017–18 and beyond
Job seekers move from welfare to work
As per 2015–16
3 Only job placements which are eligible for a paid four, 12 and 26 week outcome will be included in the respective sustainability measures. 4 The targets for the outcome conversion rate performance measures included in the 2015–16 PBS were based on data under the previous employment services program, Job Services Australia. The outcome conversion rates have been revised incorporating the first nine months of jobactive to produce more meaningful targets that better reflect the objectives of the program. 5 Program costs take into account expenditure such as Employment Fund expenditure, service fees and paid outcomes. The number of employment outcomes is taken from the estimated number of job seekers who are employed three months following participation in the program.

Department of Employment Budget Statements
26
Performance information2
Year Performance criteria Targets
2016–17 Young people move into work or education
• Proportion of placements sustained to a 12 week Employment or Hybrid Outcome
6, or a 26 week
Education Outcome: 45%
• Proportion of placements that are converted to Sustainability Outcomes
7::25%
• Proportion of Transition to Work participants moving off income support, with reduced reliance on income support, or on to Youth Allowance (student) 6 months after participation in the service
8: 28%
2017–18 and beyond
Young people move into work or education
As per 2016–17
2015–16 Job seekers meet their mutual obligations
• Proportion of Work for the Dole participants reporting increased motivation to find a job: 75%
Forecast achievement against 2015–16 target is 75%
• Proportion of jobactive appointments attended (for activity tested job seekers, excluding when job seeker had a valid reason for not attending): 90%
Forecast achievement against 2015–16 target is 90%
• Proportion of job seekers (with Mutual Obligation requirements) actively looking for work: 95%
Forecast achievement against 2015–16 target is 95%
2016–17 Job seekers meet their mutual obligations
As per 2015–16
2017–18 and beyond
Job seekers meet their mutual obligations
As per 2015–16
6 A Hybrid Outcome is 25 hours per week combining Employment and Education. 7 A Sustainability Outcome is 26 weeks of Employment, or 26 weeks combining Employment and Education for 25 hours per week. Only placements which are eligible for a Sustainability Outcome will be included in the sustainability measure. 8 Only participants receiving income support will be included in this measure.
Department of Employment Budget Statements
27
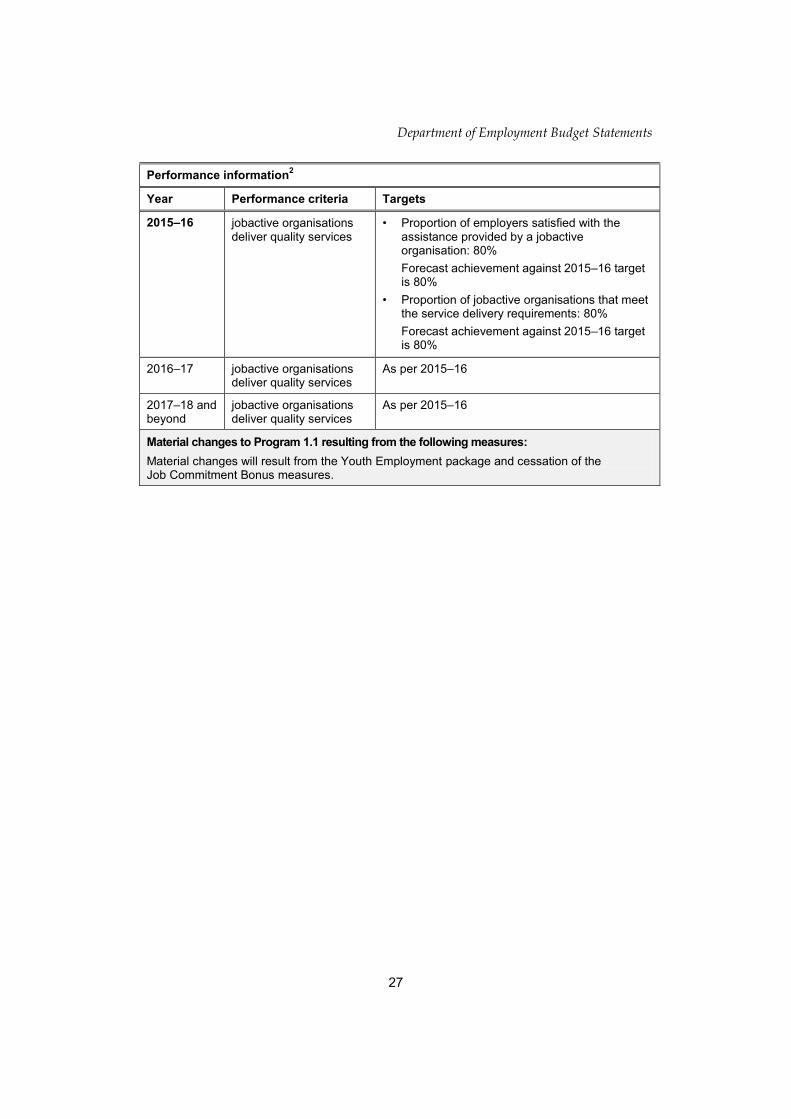
Performance information2
Year Performance criteria Targets
2015–16 jobactive organisations deliver quality services
• Proportion of employers satisfied with the assistance provided by a jobactive organisation: 80%
Forecast achievement against 2015–16 target is 80%
• Proportion of jobactive organisations that meet the service delivery requirements: 80%
Forecast achievement against 2015–16 target is 80%
2016–17 jobactive organisations deliver quality services
As per 2015–16
2017–18 and beyond
jobactive organisations deliver quality services
As per 2015–16
Material changes to Program 1.1 resulting from the following measures:
Material changes will result from the Youth Employment package and cessation of the Job Commitment Bonus measures.
Department of Employment Budget Statements
28
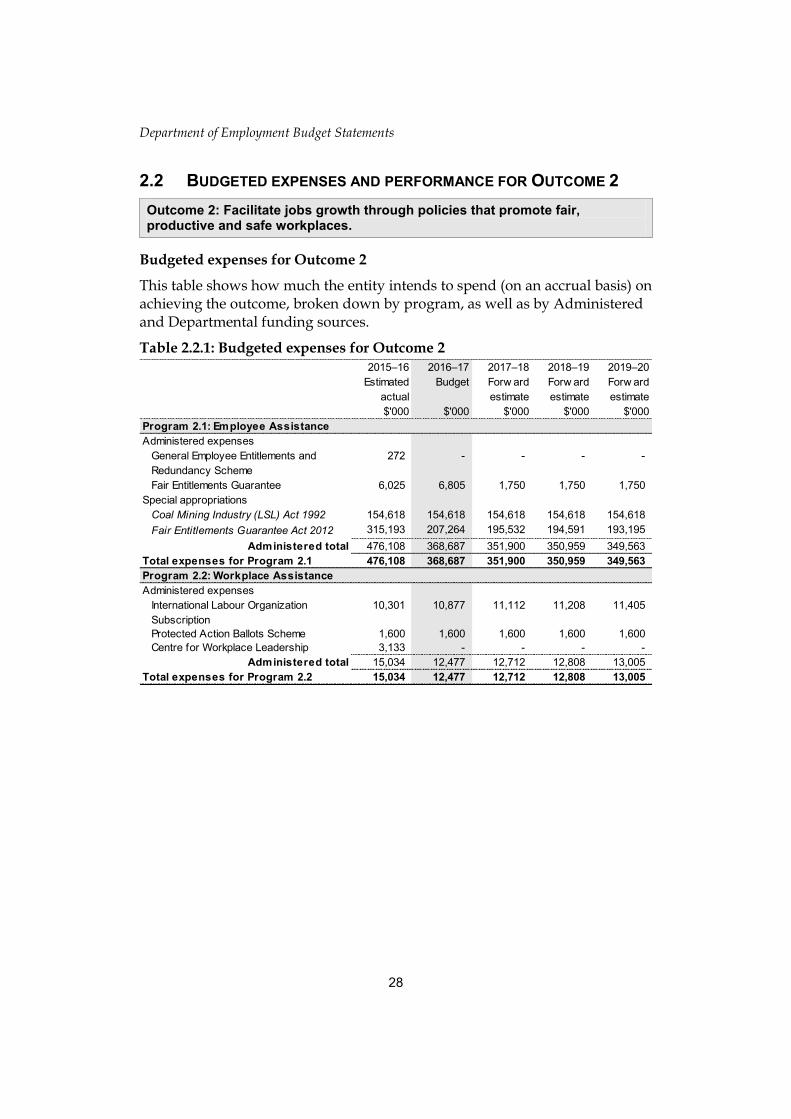
2.2 BUDGETED EXPENSES AND PERFORMANCE FOR OUTCOME 2
Outcome 2: Facilitate jobs growth through policies that promote fair, productive and safe workplaces.
Budgeted expenses for Outcome 2
This table shows how much the entity intends to spend (on an accrual basis) on achieving the outcome, broken down by program, as well as by Administered and Departmental funding sources.
Table 2.2.1: Budgeted expenses for Outcome 2
2015–16
Estimated
actual
$'000
2016–17
Budget
$'000
2017–18
Forw ard
estimate
$'000
2018–19
Forw ard
estimate
$'000
2019–20
Forw ard
estimate
$'000
Administered expenses
General Employee Entitlements and
Redundancy Scheme
272 - - - -
Fair Entitlements Guarantee 6,025 6,805 1,750 1,750 1,750
Special appropriations
Coal Mining Industry (LSL) Act 1992 154,618 154,618 154,618 154,618 154,618
Fair Entitlements Guarantee Act 2012 315,193 207,264 195,532 194,591 193,195
Administered total 476,108 368,687 351,900 350,959 349,563
Total expenses for Program 2.1 476,108 368,687 351,900 350,959 349,563
Administered expenses
International Labour Organization
Subscription
10,301 10,877 11,112 11,208 11,405
Protected Action Ballots Scheme 1,600 1,600 1,600 1,600 1,600
Centre for Workplace Leadership 3,133 - - - -
Administered total 15,034 12,477 12,712 12,808 13,005
Total expenses for Program 2.2 15,034 12,477 12,712 12,808 13,005
Program 2.1: Employee Assistance
Program 2.2: Workplace Assistance

Department of Employment Budget Statements
29
Table 2.2.1: Budgeted expenses for Outcome 2 (continued)
(a) Estimated expenses incurred in relation to receipts retained under section 74 of the PGPA Act. (b) Expenses not requiring appropriation in the Budget year are made up of depreciation expenses,
amortisation expenses and audit fees. Note: Departmental appropriation splits and totals are indicative estimates and may change in the course of the budget year as government priorities change.
2015–16
Estimated
actual
$'000
2016–17
Budget
$'000
2017–18
Forw ard
estimate
$'000
2018–19
Forw ard
estimate
$'000
2019–20
Forw ard
estimate
$'000
Administered expenses
Comcare 7,727 6,119 6,160 6,198 6,241
Special appropriations
Asbestos-related Claims Act 2005 28,637 30,045 28,316 29,787 30,750
Safety, Rehabilitation & Compensation
Act 1998
35,174 33,703 32,517 31,253 29,486
Administered total 71,538 69,867 66,993 67,238 66,477
Total expenses for Program 2.3 71,538 69,867 66,993 67,238 66,477
Administered expenses
Ordinary annual services (Appropriation
Bill No. 1)
29,058 25,401 20,622 20,756 20,996
Special appropriations 533,622 425,630 410,983 410,249 408,049
Administered total 562,680 451,031 431,605 431,005 429,045
Departmental expenses
Departmental appropriation 70,076 69,190 69,612 69,608 69,285
s 74 Retained revenue receipts (a) 4,901 3,401 3,401 3,401 3,401
Expenses not requiring appropriation in
the Budget year (b)
6,369 6,614 6,414 6,248 6,120
Departmental total 81,346 79,205 79,427 79,257 78,806
Total expenses for Outcome 2 644,026 530,236 511,032 510,262 507,851
2015–16 2016–17
Average staffing level (number) 497 498
Program 2.3: Workers' Compensation Payments
Outcome 2 Totals by appropriation type

Department of Employment Budget Statements
30
Table 2.2.2: Performance criteria for Outcome 2
Table 2.2.2 below details the performance criteria for each program associated with Outcome 2. It also summarises how each program is delivered and where 2016–17 Budget measures have created new programs or materially changed existing programs.
Outcome 2—Facilitate jobs growth through policies that promote fair, productive and safe workplaces.
Program 2.1—Employee assistance
Contributes to Outcome 2 through the promotion of fair workplaces by ensuring the protection of employee entitlements in certain circumstances.
Purpose Our role is to foster a productive and competitive labour market through employment policies and programs that increase workforce participation, and facilitate jobs growth through policies that promote fair, productive and safe workplaces.
Delivery To promote fair workplaces by ensuring the protection of employee entitlements in certain circumstances, the program delivers two services:
• Fair Entitlements Guarantee—established under the Fair Entitlements Guarantee Act 2012 to provide financial assistance for certain unpaid employment entitlements when an employee loses their job through the liquidation or bankruptcy of their employer on or after 5 December 2012.
• Coal Mining Industry (Long Service Leave) Administration Act 1992
financing arrangements—under this Act the cost of portable long service leave entitlements is managed through a central fund administered by the Coal Mining Industry (Long Service Leave Funding) Corporation. Monthly levy collection transfers are made from the consolidated revenue fund to the central fund.
Department of Employment Budget Statements
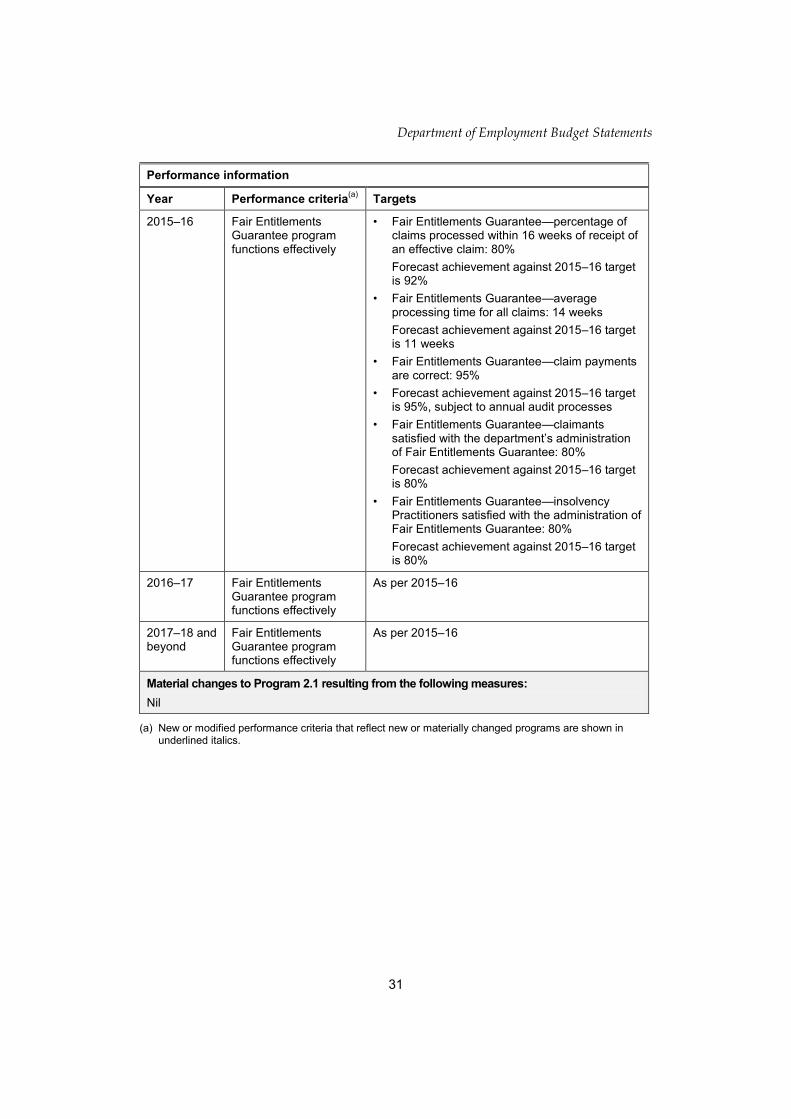
31
Performance information
Year Performance criteria(a)
Targets
2015–16 Fair Entitlements Guarantee program functions effectively
• Fair Entitlements Guarantee—percentage of claims processed within 16 weeks of receipt of an effective claim: 80%
Forecast achievement against 2015–16 target is 92%
• Fair Entitlements Guarantee—average processing time for all claims: 14 weeks
Forecast achievement against 2015–16 target is 11 weeks
• Fair Entitlements Guarantee—claim payments are correct: 95%
• Forecast achievement against 2015–16 target is 95%, subject to annual audit processes
• Fair Entitlements Guarantee—claimants satisfied with the department’s administration of Fair Entitlements Guarantee: 80%
Forecast achievement against 2015–16 target is 80%
• Fair Entitlements Guarantee—insolvency Practitioners satisfied with the administration of Fair Entitlements Guarantee: 80%
Forecast achievement against 2015–16 target is 80%
2016–17 Fair Entitlements Guarantee program functions effectively
As per 2015–16
2017–18 and beyond
Fair Entitlements Guarantee program functions effectively
As per 2015–16
Material changes to Program 2.1 resulting from the following measures:
Nil
(a) New or modified performance criteria that reflect new or materially changed programs are shown in underlined italics.

Department of Employment Budget Statements
32
Outcome 2—Facilitate jobs growth through policies that promote fair, productive and safe workplaces.
Program 2.2—Workplace assistance
Contributes to Outcome 2 and to the Government’s productivity agenda by ensuring the operation of the workplace relations system through initiatives designed to encourage employers and employees to adopt flexible and modern workplace relations.
Purpose Our role is to foster a productive and competitive labour market through employment policies and programs that increase workforce participation, and facilitate jobs growth through policies that promote fair, productive and safe workplaces.
Delivery The department manages the following in delivering Program 2.2:
• Protected Action Ballots Scheme—costs incurred by the Australian Electoral Commission in relation to protected action ballots. A protected action ballot is a statutory prerequisite to protected industrial action under the Fair Work Act.
• International Labour Organization (ILO)—the Australian Government’s annual membership subscription to the ILO. The government works with other member states and representatives from employer and employee organisations to: participate in international policy discussions on labour issues; contribute to technical cooperation in the Asia-Pacific region; report on standards at the national level; and, participate as a member of the ILO Governing Body.
• Australian Government Building and Construction WHS Accreditation Scheme (the Accreditation Scheme)—only companies accredited by the Office of the Federal Safety Commissioner (OFSC) can undertake most Commonwealth-funded building and construction projects. Accreditation requires high quality work health and safety systems and practices which reduces safety incidents and promotes safer workplaces in the building and construction industry.
Performance measures
Year Performance criteria (b)
Targets
2015–16 Commonwealth-funded projects are undertaken by builders accredited by the Office of the Federal Safety Commissioner
• Level of satisfaction of clients with the provision of advice, information, education and promotion of safer workplaces on Australian Government construction sites
(c):
Effective or above
Forecast achievement against 2015–16 target is Effective or above
• Percentage of accreditation applications assessed and contact made with the applicant within 10 working days of initial application for accreditation: 90%
Forecast achievement against 2015–16 target is 90%
Department of Employment Budget Statements
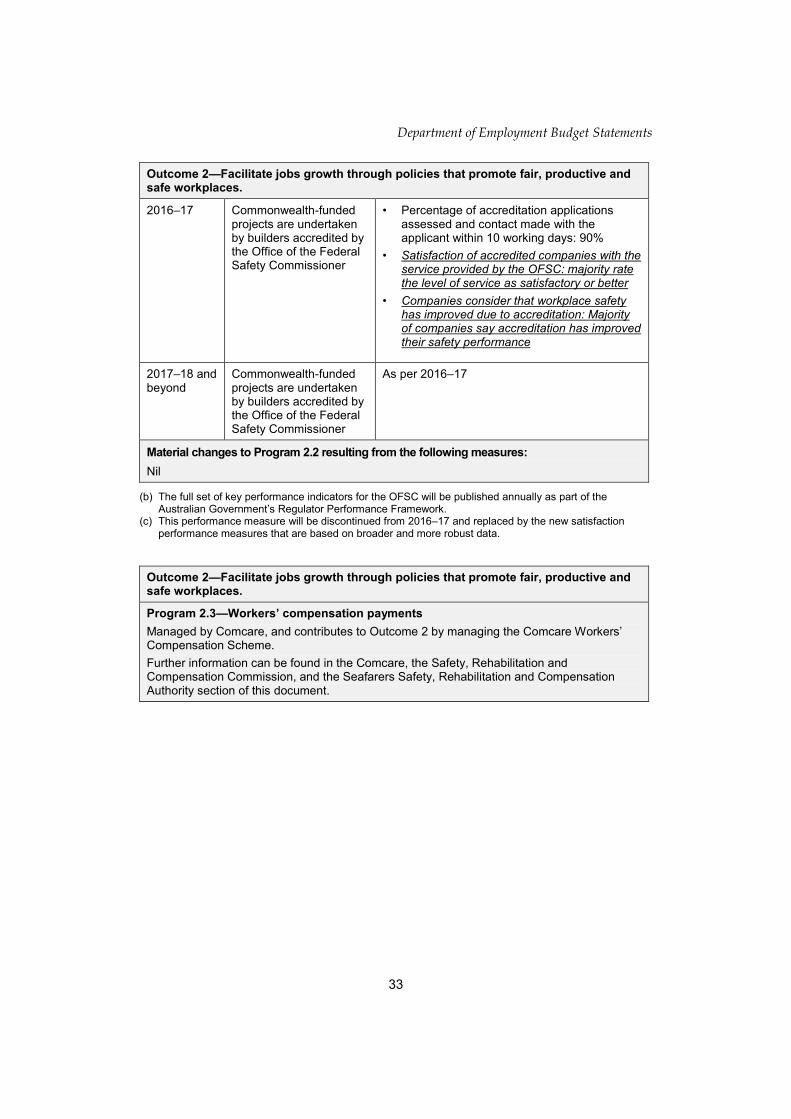
33
Outcome 2—Facilitate jobs growth through policies that promote fair, productive and safe workplaces.
2016–17 Commonwealth-funded projects are undertaken by builders accredited by the Office of the Federal Safety Commissioner
• Percentage of accreditation applications assessed and contact made with the applicant within 10 working days: 90%
• Satisfaction of accredited companies with the service provided by the OFSC: majority rate the level of service as satisfactory or better
• Companies consider that workplace safety has improved due to accreditation: Majority of companies say accreditation has improved their safety performance
2017–18 and beyond
Commonwealth-funded projects are undertaken by builders accredited by the Office of the Federal Safety Commissioner
As per 2016–17
Material changes to Program 2.2 resulting from the following measures:
Nil
(b) The full set of key performance indicators for the OFSC will be published annually as part of the Australian Government’s Regulator Performance Framework.
(c) This performance measure will be discontinued from 2016–17 and replaced by the new satisfaction performance measures that are based on broader and more robust data.
Outcome 2—Facilitate jobs growth through policies that promote fair, productive and safe workplaces.
Program 2.3—Workers’ compensation payments
Managed by Comcare, and contributes to Outcome 2 by managing the Comcare Workers’ Compensation Scheme.
Further information can be found in the Comcare, the Safety, Rehabilitation and Compensation Commission, and the Seafarers Safety, Rehabilitation and Compensation Authority section of this document.

Department of Employment Budget Statements
34
Section 3: Budgeted financial statements
Section 3 presents budgeted financial statements which provide a comprehensive snapshot of entity finances for the 2016–17 budget year, including the impact of budget measures and resourcing on financial statements.
3.1 BUDGETED FINANCIAL STATEMENTS
3.1.1 Differences between entity resourcing and financial statements
There is a difference of $0.3 million between the appropriation revenue recognised in Table 3.1 and the appropriation shown in the agency resource table. 2015–16 supplementary appropriation was not included in the appropriation bills due to timing.
3.1.2 Explanatory notes and analysis of budgeted financial statements
Departmental
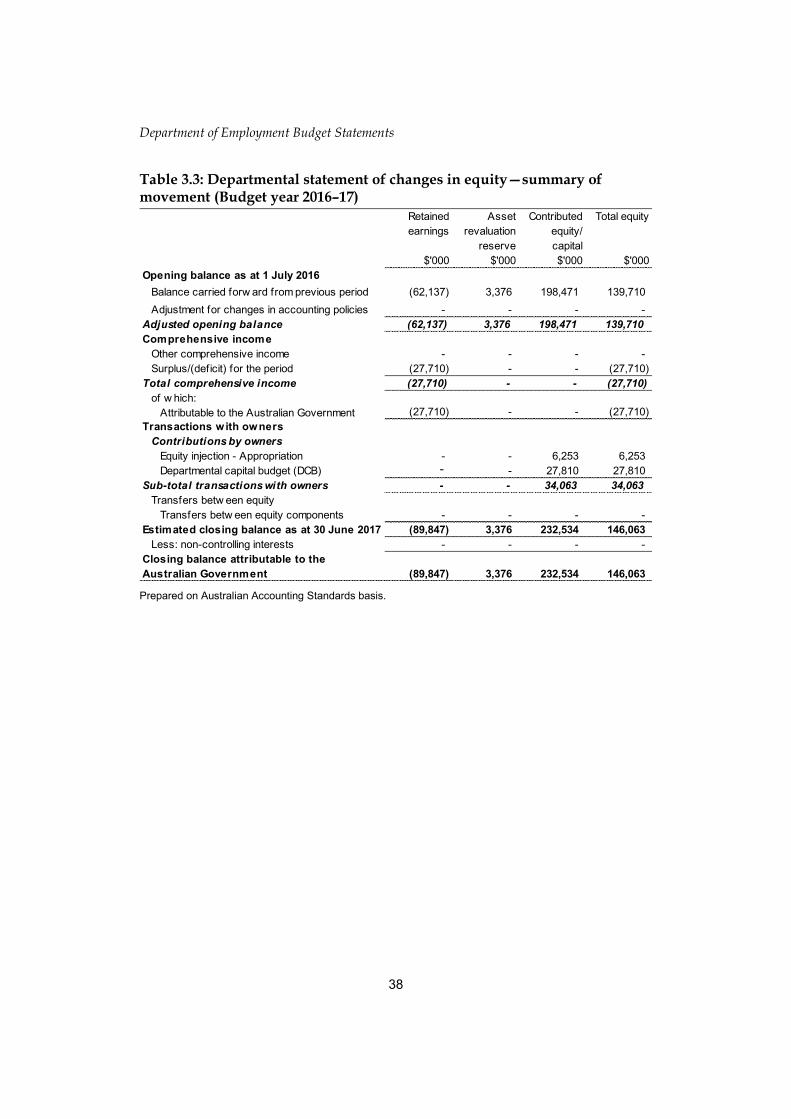
The department is budgeting for an operating loss equal to the unappropriated depreciation and amortisation expense of $27.7 million for the 2016–17 financial year.
Total revenues are estimated to be $284.7 million and total expenses $325.0 million.
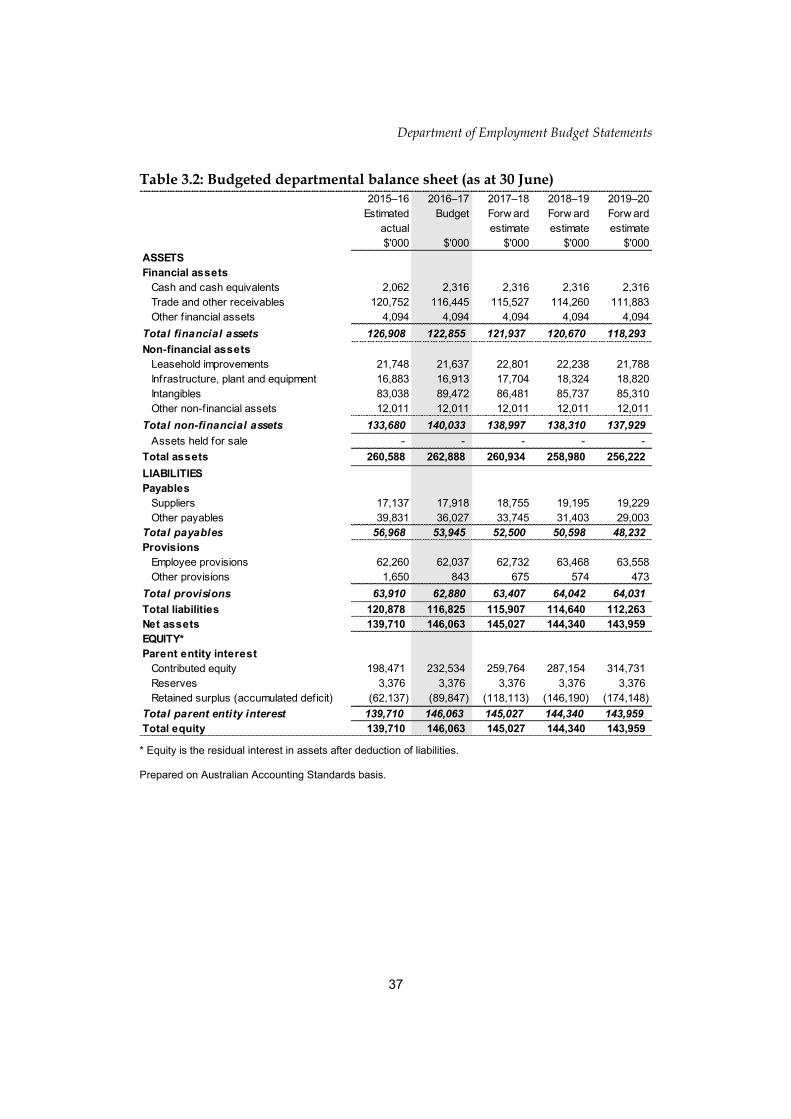
Total assets at the end of the 2016–17 financial year are estimated to be $262.9 million. The majority of the assets represent receivables (appropriations receivables).
Total liabilities for 2016–17 are estimated at $116.8 million. The largest liability item is accrued employee entitlements.
Administered
Administered revenues for the 2016–17 budget year are estimated to be $185.0 million, consistent with the 2015–16 estimated actual.
Administered expenses in 2016–17 are estimated to be $2.1 billion, an increase of $282.9 million from the 2015–16 estimated actual. This increase is attributable to budget measures and revised program parameters.

Department of Employment Budget Statements
35
3.2 BUDGETED FINANCIAL STATEMENTS TABLES
Table 3.1: Comprehensive income statement (showing net cost of services) for the period ended 30 June
2015–16
Estimated
actual
$'000
2016–17
Budget
$'000
2017–18
Forw ard
estimate
$'000
2018–19
Forw ard
estimate
$'000
2019–20
Forw ard
estimate
$'000
EXPENSES
Employee benefits 197,911 208,995 215,407 213,684 213,379
Suppliers 102,712 88,343 85,522 86,735 85,360
Depreciation and amortisation 24,547 27,710 28,266 28,077 27,958
Total expenses 325,170 325,048 329,195 328,496 326,697
LESS:
OWN-SOURCE INCOME
Own-source revenue
Sale of goods and rendering of services 19,604 13,604 13,604 13,604 13,604
External audit 460 460 460 460 460
Total own-source revenue 20,064 14,064 14,064 14,064 14,064
Gains
Other - - - - -
Total gains - - - - -
Total own-source income 20,064 14,064 14,064 14,064 14,064
Net (cost of)/contribution by services 305,106 310,984 315,131 314,432 312,633
Revenue from Government 280,559 283,274 286,865 286,355 284,675
Surplus/(deficit) attributable to the
Australian Government (24,547) (27,710) (28,266) (28,077) (27,958)
OTHER COMPREHENSIVE INCOME
Changes in asset revaluation surplus - - - - -
Total other comprehensive income - - - - -
Total comprehensive income/(loss) (24,547) (27,710) (28,266) (28,077) (27,958)
Total comprehensive income/(loss)
attributable to the Australian
Government (24,547) (27,710) (28,266) (28,077) (27,958)
Department of Employment Budget Statements
36
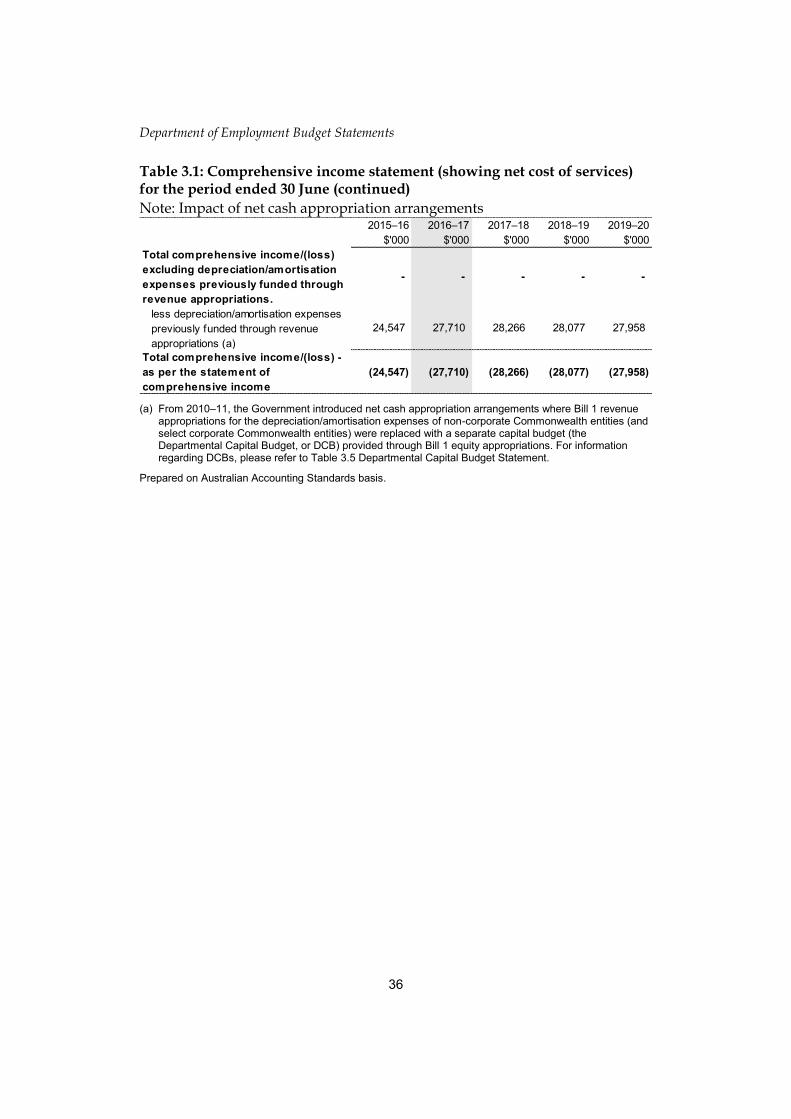
Table 3.1: Comprehensive income statement (showing net cost of services) for the period ended 30 June (continued)
Note: Impact of net cash appropriation arrangements
(a) From 2010–11, the Government introduced net cash appropriation arrangements where Bill 1 revenue
appropriations for the depreciation/amortisation expenses of non-corporate Commonwealth entities (and select corporate Commonwealth entities) were replaced with a separate capital budget (the Departmental Capital Budget, or DCB) provided through Bill 1 equity appropriations. For information regarding DCBs, please refer to Table 3.5 Departmental Capital Budget Statement.
Prepared on Australian Accounting Standards basis.
2015–16
$'000
2016–17
$'000
2017–18
$'000
2018–19
$'000
2019–20
$'000
Total comprehensive income/(loss)
excluding depreciation/amortisation
expenses previously funded through
revenue appropriations.
- - - - -
less depreciation/amortisation expenses
previously funded through revenue
appropriations (a)
24,547 27,710 28,266 28,077 27,958
Total comprehensive income/(loss) -
as per the statement of
comprehensive income
(24,547) (27,710) (28,266) (28,077) (27,958)
Department of Employment Budget Statements
37
Table 3.2: Budgeted departmental balance sheet (as at 30 June)
* Equity is the residual interest in assets after deduction of liabilities. Prepared on Australian Accounting Standards basis.
2015–16
Estimated
actual
$'000
2016–17
Budget
$'000
2017–18
Forw ard
estimate
$'000
2018–19
Forw ard
estimate
$'000
2019–20
Forw ard
estimate
$'000
ASSETS
Financial assets
Cash and cash equivalents 2,062 2,316 2,316 2,316 2,316
Trade and other receivables 120,752 116,445 115,527 114,260 111,883
Other f inancial assets 4,094 4,094 4,094 4,094 4,094
Total financial assets 126,908 122,855 121,937 120,670 118,293
Non-financial assets
Leasehold improvements 21,748 21,637 22,801 22,238 21,788
Infrastructure, plant and equipment 16,883 16,913 17,704 18,324 18,820
Intangibles 83,038 89,472 86,481 85,737 85,310
Other non-financial assets 12,011 12,011 12,011 12,011 12,011
Total non-financial assets 133,680 140,033 138,997 138,310 137,929
Assets held for sale - - - - -
Total assets 260,588 262,888 260,934 258,980 256,222
LIABILITIES
Payables
Suppliers 17,137 17,918 18,755 19,195 19,229
Other payables 39,831 36,027 33,745 31,403 29,003
Total payables 56,968 53,945 52,500 50,598 48,232
Provisions
Employee provisions 62,260 62,037 62,732 63,468 63,558
Other provisions 1,650 843 675 574 473
Total provisions 63,910 62,880 63,407 64,042 64,031
Total liabilities 120,878 116,825 115,907 114,640 112,263
Net assets 139,710 146,063 145,027 144,340 143,959
EQUITY*
Parent entity interest
Contributed equity 198,471 232,534 259,764 287,154 314,731
Reserves 3,376 3,376 3,376 3,376 3,376
Retained surplus (accumulated deficit) (62,137) (89,847) (118,113) (146,190) (174,148)
Total parent entity interest 139,710 146,063 145,027 144,340 143,959
Total equity 139,710 146,063 145,027 144,340 143,959
Department of Employment Budget Statements
38
Table 3.3: Departmental statement of changes in equity—summary of movement (Budget year 2016–17)
Prepared on Australian Accounting Standards basis.
Retained
earnings
$'000
Asset
revaluation
reserve
$'000
Contributed
equity/
capital
$'000
Total equity
$'000
Opening balance as at 1 July 2016
Balance carried forw ard from previous period (62,137) 3,376 198,471 139,710
Adjustment for changes in accounting policies - - - -
Adjusted opening balance (62,137) 3,376 198,471 139,710
Comprehensive income
Other comprehensive income - - - -
Surplus/(deficit) for the period (27,710) - - (27,710)
Total comprehensive income (27,710) - - (27,710)
of w hich:
Attributable to the Australian Government (27,710) - - (27,710)
Transactions with owners
Contributions by owners
Equity injection - Appropriation - - 6,253 6,253
Departmental capital budget (DCB) - - 27,810 27,810
Sub-total transactions with owners - - 34,063 34,063
Transfers betw een equity
Transfers betw een equity components - - - -
Estimated closing balance as at 30 June 2017 (89,847) 3,376 232,534 146,063
Less: non-controlling interests - - - -
Closing balance attributable to the
Australian Government (89,847) 3,376 232,534 146,063
Department of Employment Budget Statements
39
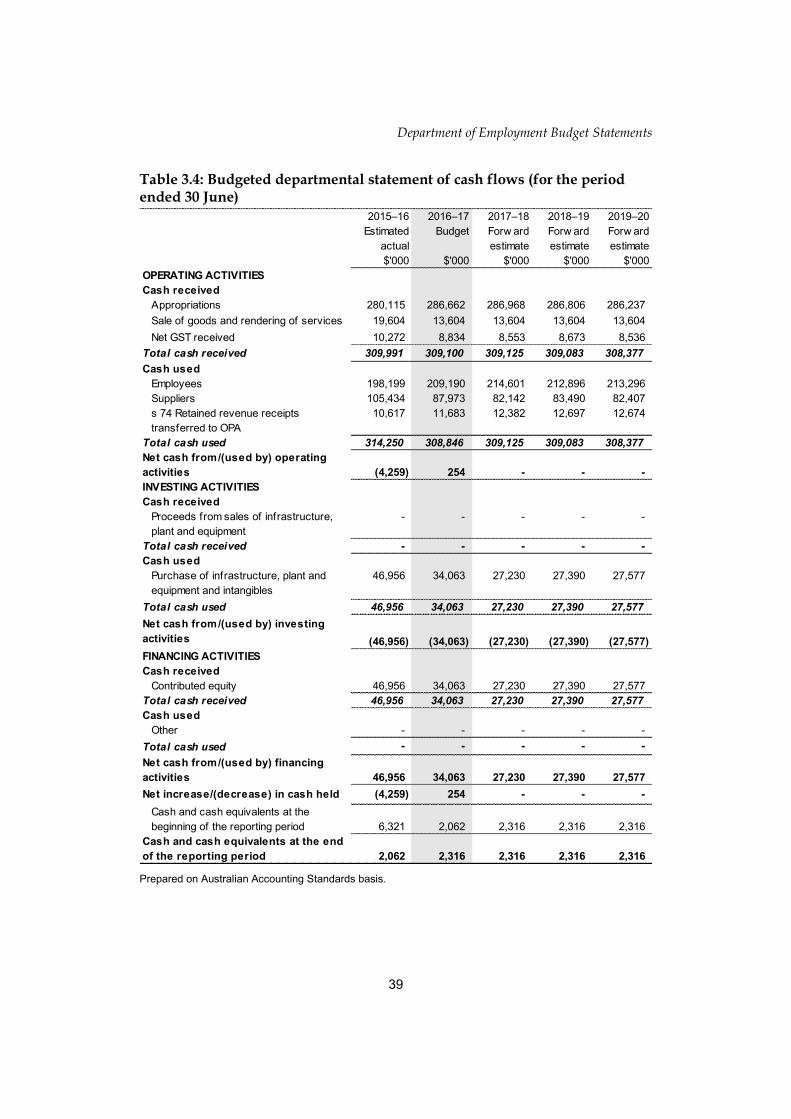
Table 3.4: Budgeted departmental statement of cash flows (for the period ended 30 June)
Prepared on Australian Accounting Standards basis.
2015–16
Estimated
actual
$'000
2016–17
Budget
$'000
2017–18
Forw ard
estimate
$'000
2018–19
Forw ard
estimate
$'000
2019–20
Forw ard
estimate
$'000
OPERATING ACTIVITIES
Cash received
Appropriations 280,115 286,662 286,968 286,806 286,237
Sale of goods and rendering of services 19,604 13,604 13,604 13,604 13,604
Net GST received 10,272 8,834 8,553 8,673 8,536
Total cash received 309,991 309,100 309,125 309,083 308,377
Cash used
Employees 198,199 209,190 214,601 212,896 213,296
Suppliers 105,434 87,973 82,142 83,490 82,407
s 74 Retained revenue receipts
transferred to OPA
10,617 11,683 12,382 12,697 12,674
Total cash used 314,250 308,846 309,125 309,083 308,377
Net cash from/(used by) operating
activities (4,259) 254 - - -
INVESTING ACTIVITIES
Cash received
Proceeds from sales of infrastructure,
plant and equipment
- - - - -
Total cash received - - - - -
Cash used
Purchase of infrastructure, plant and
equipment and intangibles
46,956 34,063 27,230 27,390 27,577
Total cash used 46,956 34,063 27,230 27,390 27,577
Net cash from/(used by) investing
activities (46,956) (34,063) (27,230) (27,390) (27,577)
FINANCING ACTIVITIES
Cash received
Contributed equity 46,956 34,063 27,230 27,390 27,577
Total cash received 46,956 34,063 27,230 27,390 27,577
Cash used
Other - - - - -
Total cash used - - - - -
Net cash from/(used by) financing
activities 46,956 34,063 27,230 27,390 27,577
Net increase/(decrease) in cash held (4,259) 254 - - -
Cash and cash equivalents at the
beginning of the reporting period 6,321 2,062 2,316 2,316 2,316
Cash and cash equivalents at the end
of the reporting period 2,062 2,316 2,316 2,316 2,316

Department of Employment Budget Statements
40
Table 3.5: Departmental capital budget statement (for the period ended 30 June)
(a) Includes both current Bill 2 and prior Act 2/4/6 appropriations and special capital appropriations. (b) Does not include annual finance lease costs. Includes purchases from current and previous years’
Departmental capital budgets (DCBs). Prepared on Australian Accounting Standards basis.
2015–16
Estimated
actual
$'000
2016–17
Budget
$'000
2017–18
Forw ard
estimate
$'000
2018–19
Forw ard
estimate
$'000
2019–20
Forw ard
estimate
$'000
NEW CAPITAL APPROPRIATIONS
Capital budget - Bill 1 (DCB) 27,378 27,310 27,230 27,390 27,577
Equity injections - Bill 2 15,408 6,253 - - -
Total new capital appropriations 42,786 33,563 27,230 27,390 27,577
Provided for:
Purchase of non-financial assets 42,786 33,563 27,230 27,390 27,577
Total items 42,786 33,563 27,230 27,390 27,577
PURCHASE OF NON-FINANCIAL ASSETS
Funded by capital appropriations (a) 15,408 6,253 - - -
Funded by capital appropriation - DCB (b) 31,548 27,810 27,230 27,390 27,577
TOTAL 46,956 34,063 27,230 27,390 27,577
RECONCILIATION OF CASH USED TO
ACQUIRE ASSETS TO ASSET MOVEMENT
TABLE
Total purchases 46,956 34,063 27,230 27,390 27,577
Total cash used to acquire assets 46,956 34,063 27,230 27,390 27,577

Department of Employment Budget Statements
41
Dep
artmen
t abbreviation
Bu
dg
et Statem
ents
Table 3.6: Statement of asset movements (Budget year 2016–17)
(a) Appropriation equity refers to Appropriation Bill (No. 1) 2015–16 for depreciation/amortisation expenses,
DCBs or other operational expenses and equity injections appropriations provided through Appropriation Bill (No. 2) 2015–16, including CDABs.
Prepared on Australian Accounting Standards basis.
Leasehold
improvements
$'000
Infrastructure,
plant and
equipment
$'000
Computer
softw are and
intangibles
$'000
Total
$'000
As at 1 July 2016
Gross book value 34,738 30,687 113,932 179,357
Accumulated depreciation/amortisation
and impairment
(12,990) (13,804) (30,894) (57,688)
Opening net book balance 21,748 16,883 83,038 121,669
Capital asset additions
Estimated expenditure on new or
replacement assets
By purchase - appropriation equity (a) 4,709 3,785 25,569 34,063
Total additions 4,709 3,785 25,569 34,063
Other movements
Depreciation/amortisation expense (4,820) (3,755) (19,135) (27,710)
Total other movements (4,820) (3,755) (19,135) (27,710)
As at 30 June 2017
Gross book value 39,447 34,472 139,501 213,420
Accumulated depreciation/
amortisation and impairment
(17,810) (17,559) (50,029) (85,398)
Closing net book balance 21,637 16,913 89,472 128,022

Department of Employment Budget Statements
42
Dep
artmen
t abbreviation
Bu
dg
et Statem
ents
Table 3.7: Schedule of budgeted income and expenses administered on behalf of Government (for the period ended 30 June)
Prepared on Australian Accounting Standards basis.
2015–16
Estimated
actual
$'000
2016–17
Budget
$'000
2017–18
Forw ard
estimate
$'000
2018–19
Forw ard
estimate
$'000
2019–20
Forw ard
estimate
$'000
EXPENSES
Suppliers 1,125,287 1,329,410 1,375,780 1,374,964 1,384,295
Subsidies 193,420 371,350 377,875 394,631 385,465
Personal benefits 407,078 294,023 294,288 295,088 295,620
Grants 87,397 101,254 105,714 92,779 86,668
Total expenses administered on
behalf of Government 1,813,182 2,096,037 2,153,657 2,157,462 2,152,048
LESS:
OWN-SOURCE INCOME
Own-source revenue
Taxation revenue
Other taxes 154,618 154,618 154,618 154,618 154,618
Total taxation revenue 154,618 154,618 154,618 154,618 154,618
Non-taxation revenue
Recoveries 23,632 23,632 23,632 23,632 23,632
Other revenue 6,753 6,753 6,753 6,753 6,753
Total non-taxation revenue 30,385 30,385 30,385 30,385 30,385
Total own-source revenue
administered on behalf of
Government 185,003 185,003 185,003 185,003 185,003
Total own-sourced income
administered on behalf of
Government 185,003 185,003 185,003 185,003 185,003
Net cost of/(contribution by) services 1,628,179 1,911,034 1,968,654 1,972,459 1,967,045
Surplus/(deficit) (1,628,179) (1,911,034) (1,968,654) (1,972,459) (1,967,045)
OTHER COMPREHENSIVE INCOME
Items not subject of subsequent
Changes in asset revaluation surplus - - - - -
Total other comprehensive income - - - - -
Total comprehensive income/(loss) (1,628,179) (1,911,034) (1,968,654) (1,972,459) (1,967,045)

Department of Employment Budget Statements
43
Dep
artmen
t abbreviation
Bu
dg
et Statem
ents
Table 3.8: Schedule of budgeted assets and liabilities administered on behalf of Government (as at 30 June)
Prepared on Australian Accounting Standards basis.
2015–16
Estimated
actual
$'000
2016–17
Budget
$'000
2017–18
Forw ard
estimate
$'000
2018–19
Forw ard
estimate
$'000
2019–20
Forw ard
estimate
$'000
ASSETS
Financial assets
Taxation receivables 14,002 14,002 14,002 14,002 14,002
Trade and other receivables 18,267 18,267 18,267 18,267 18,267
Other investments 224,658 224,658 224,658 224,658 224,658
Total financial assets 256,927 256,927 256,927 256,927 256,927
Non-financial assets
Other non-financial assets 5,355 5,590 5,590 5,687 5,786
Total non-financial assets 5,355 5,590 5,590 5,687 5,786
Total assets administered on
behalf of Government 262,282 262,517 262,517 262,614 262,713
LIABILITIES
Payables
Suppliers 52,076 52,076 52,076 52,076 52,076
Subsidies 24,974 24,974 24,974 24,974 24,974
Personal benefits 6,691 6,691 6,691 6,691 6,691
Grants - - - - -
Other payables 2,786,628 2,770,844 2,759,665 2,748,765 2,709,024
Total payables 2,870,369 2,854,585 2,843,406 2,832,506 2,792,765
Total liabilities administered on
behalf of Government 2,870,369 2,854,585 2,843,406 2,832,506 2,792,765
Net assets/(liabilities) (2,608,087) (2,592,068) (2,580,889) (2,569,892) (2,530,052)

Department of Employment Budget Statements
44
Dep
artmen
t abbreviation
Bu
dg
et Statem
ents
Table 3.9: Schedule of budgeted administered cash flows (for the period ended 30 June)
Prepared on Australian Accounting Standards basis.
2015–16
Estimated
actual
$'000
2016–17
Budget
$'000
2017–18
Forw ard
estimate
$'000
2018–19
Forw ard
estimate
$'000
2019–20
Forw ard
estimate
$'000
OPERATING ACTIVITIES
Cash received
Taxes 154,618 154,618 154,618 154,618 154,618
Net GST received 112,529 132,941 137,578 137,496 138,430
Other 30,385 30,385 30,385 30,385 30,385
Total cash received 297,532 317,944 322,581 322,499 323,433
Cash used
Grant 79,670 95,135 99,554 86,581 80,427
Subsidies paid 193,420 371,350 377,875 394,631 385,465
Personal benefits 407,078 294,023 294,288 295,088 295,620
Suppliers 1,238,261 1,462,586 1,513,358 1,512,557 1,522,824
Payments to corporate entities 7,727 6,119 6,160 6,198 6,241
Total cash used 1,926,156 2,229,213 2,291,235 2,295,055 2,290,577
Net cash from/(used by) operating
activities (1,628,624) (1,911,269) (1,968,654) (1,972,556) (1,967,144)
Net increase/(decrease) in cash
held (1,628,624) (1,911,269) (1,968,654) (1,972,556) (1,967,144)
Cash and cash equivalents at
beginning of reporting period104 - - - -
Cash from Official Public Account for:
- Appropriations 1,813,553 2,096,302 2,153,687 2,157,589 2,152,177
- GST appropriations 112,529 132,941 137,578 137,496 138,430
Total cash from Official Public
Account 1,926,082 2,229,243 2,291,265 2,295,085 2,290,607
Cash to Official Public Account for:
- Appropriations (185,033) (185,033) (185,033) (185,033) (185,033)
- Return of GST appropriations (112,529) (132,941) (137,578) (137,496) (138,430)
Total cash to Official Public Account (297,562) (317,974) (322,611) (322,529) (323,463)
Cash and cash equivalents at end
of reporting period - - - - -
Department of Employment Budget Statements
45
Dep
artmen
t abbreviation
Bu
dg
et Statem
ents
Table 3.10: Administered capital budget statement (for the period ended 30 June)
The department has no administered capital purchases to report. For this reason Table 3.10 is not presented.
Table 3.11: Statement of administered asset movements (Budget year 2016–17) The department has no administered asset movements to report. For this reason Table 3.11 is not presented.


Dep
artmen
t abbreviation
Bu
dg
et Statem
ents
Asbestos Safety and Eradication Agency
Entity resources and planned performance

49
Dep
artmen
t abbreviation
Bu
dg
et Statem
ents
ASBESTOS SAFETY AND ERADICATION AGENCY
Section 1: Entity overview and resources ................................................................ 51
1.1 Strategic direction statement .......................................................................... 51
1.2 Entity resource statement ............................................................................... 52
1.3 Budget measures ............................................................................................ 53
Section 2: Outcomes and planned performance ..................................................... 54
2.1 Budgeted expenses and performance for Outcome 1 .................................... 55
Section 3: Budgeted financial statements ................................................................ 59
3.1 Budgeted financial statements........................................................................ 59
3.2.1 Budgeted financial statements tables ............................................................. 60


ASEA Budget Statements
51
Dep
artmen
t abbreviation
Bu
dg
et Statem
ents
ASBESTOS SAFETY AND ERADICATION AGENCY
Section 1: Entity overview and resources
1.1 STRATEGIC DIRECTION STATEMENT
The Asbestos Safety and Eradication Agency (ASEA) was established by the Asbestos Safety and Eradication Agency Act 2013. The agency oversees efforts to prevent exposure to asbestos fibres in order to eliminate asbestos-related disease in Australia.
ASEA works with all levels of government and stakeholders to create a nationally consistent approach to asbestos management and awareness to reduce the risks of asbestos-related diseases. ASEA provides a national focus on asbestos issues which go beyond workplace safety to encompass environmental and public health issues. The agency is supported by the Asbestos Safety and Eradication Council, which provides advice and makes recommendations to the agency.
ASEA and the council work towards the achievement of the elimination of asbestos-related diseases in Australia by coordinating the National Strategic Plan for Asbestos Management and Awareness (NSP). ASEA is also responsible for the administration of the National Asbestos Exposure Register.
The agency’s main functions are to:
encourage, coordinate, monitor and report on the implementation of the NSP
review and amend the NSP as required
publish and promote the NSP
provide advice to the Minister about asbestos safety
liaise with Commonwealth, state, territory and local and other governments, agencies or bodies about the implementation of the NSP and asbestos safety
commission, monitor and promote research about asbestos safety.
The elimination of asbestos-related disease is a long-term and complex challenge. The NSP establishes a five year framework for this work. To achieve this, we need first to work towards better understanding the current risk factors and exposure pathways in the Australian community in relation to asbestos. There is no single source of evidence to measure this, and the agency will focus on building a national picture of asbestos risks in Australia. This will inform responses to asbestos management and awareness to deliver behavioural change to reduce current exposure risks.

ASEA Budget Statements
52
Dep
artmen
t abbreviation
Bu
dg
et Statem
ents
1.2 ENTITY RESOURCE STATEMENT
Table 1.1 shows the total funding from all sources available to the entity for its operations and to deliver programs and services on behalf of the government.
The table summarises how resources will be applied by outcome (government strategic policy objectives), and by administered (on behalf of the government or the public) and departmental (for the entity’s operations) classification.
For more detailed information please refer to Budget Paper No. 4—Agency Resourcing.
Information in this table is presented on a resourcing (i.e. appropriations/cash available) basis, whilst the ‘Budgeted expenses by Outcome 1’ table in Section 2 and the financial statements in Section 3 are presented on an accrual basis.
Table 1.1: Asbestos Safety and Eradication Agency resource statement—Budget estimates for 2016–17 as at Budget May 2016
Prepared on a resourcing (i.e. appropriations available) basis. Please note: All figures shown above are GST exclusive—these may not match figures in the cash flow statement.
(a) Appropriation Bill (No.1) 2016–17. (b) Estimated adjusted balance carried forward from previous year. (c) Departmental capital budgets are not separately identified in Appropriation Bill (No. 1) and form part of
ordinary annual services items. Please refer to Table 3.5 for further details. For accounting purposes, this amount is designated as a 'contribution by owner'.
2015–16
Estimated
actual
$'000
2016–17
Estimate
$'000
Departmental
Annual appropriations - ordinary annual services (a)
Prior year appropriations available (b) 5,408 5,431
Departmental appropriation 3,264 4,603
Departmental capital budget (c) - 59
Total departmental annual appropriations 8,672 10,093
Total departmental resourcing 8,672 10,093
Total resourcing for Asbestos Safety and Eradication Agency 8,672 10,093
2015–16 2016–17
Average staffing level (number) 12 12
ASEA Budget Statements
53
Dep
artmen
t abbreviation
Bu
dg
et Statem
ents
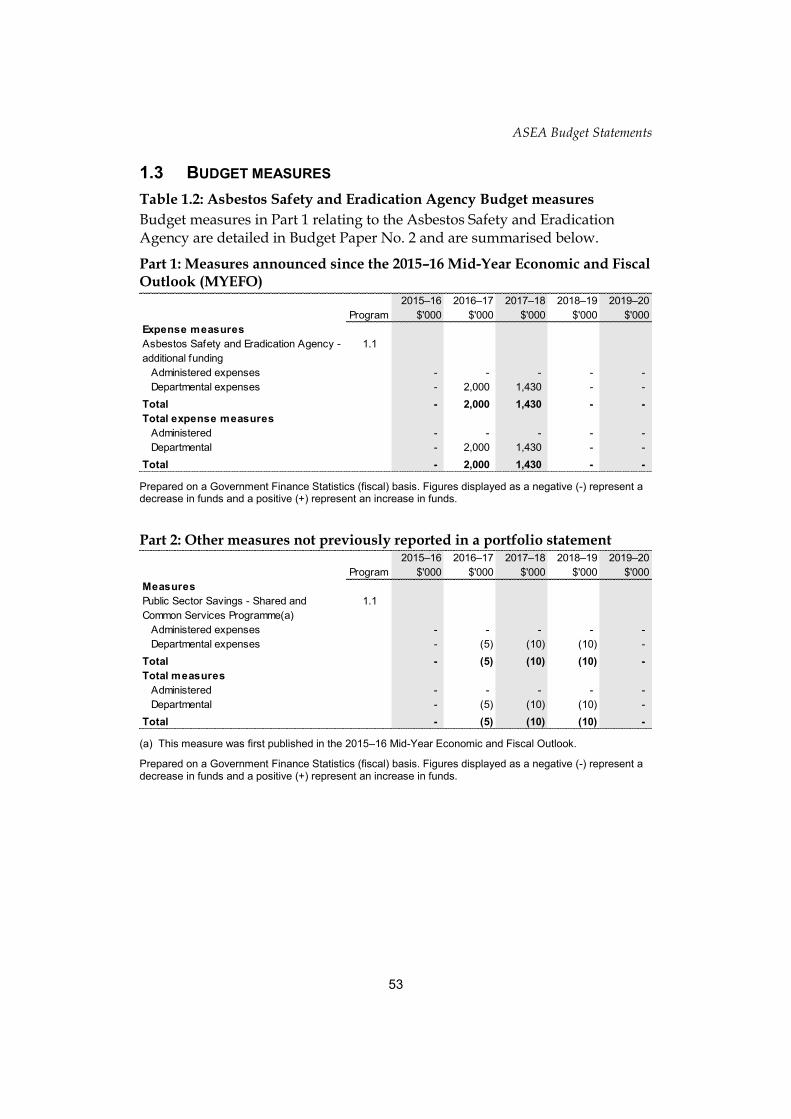
1.3 BUDGET MEASURES
Table 1.2: Asbestos Safety and Eradication Agency Budget measures
Budget measures in Part 1 relating to the Asbestos Safety and Eradication Agency are detailed in Budget Paper No. 2 and are summarised below.
Part 1: Measures announced since the 2015–16 Mid-Year Economic and Fiscal Outlook (MYEFO)
Prepared on a Government Finance Statistics (fiscal) basis. Figures displayed as a negative (-) represent a decrease in funds and a positive (+) represent an increase in funds.
Part 2: Other measures not previously reported in a portfolio statement
(a) This measure was first published in the 2015–16 Mid-Year Economic and Fiscal Outlook.
Prepared on a Government Finance Statistics (fiscal) basis. Figures displayed as a negative (-) represent a decrease in funds and a positive (+) represent an increase in funds.
Program
2015–16
$'000
2016–17
$'000
2017–18
$'000
2018–19
$'000
2019–20
$'000
Expense measures
Asbestos Safety and Eradication Agency -
additional funding
1.1
Administered expenses - - - - -
Departmental expenses - 2,000 1,430 - -
Total - 2,000 1,430 - -
Total expense measures
Administered - - - - -
Departmental - 2,000 1,430 - -
Total - 2,000 1,430 - -
Program
2015–16
$'000
2016–17
$'000
2017–18
$'000
2018–19
$'000
2019–20
$'000
Measures
Public Sector Savings - Shared and
Common Services Programme(a)
1.1
Administered expenses - - - - -
Departmental expenses - (5) (10) (10) -
Total - (5) (10) (10) -
Total measures
Administered - - - - -
Departmental - (5) (10) (10) -
Total - (5) (10) (10) -
ASEA Budget Statements
54
Dep
artmen
t abbreviation
Bu
dg
et Statem
ents
Section 2: Outcomes and planned performance
Government outcomes are the intended results, impacts or consequences of actions by the Government on the Australian community. Commonwealth programs are the primary vehicle by which government entities achieve the intended results of their outcome statements. Entities are required to identify the programs which contribute to government outcomes over the Budget and forward years.
Each outcome is described below together with its related programs. The following provides detailed information on expenses for each outcome and program, further broken down by funding source.
Note:
From 1 July 2015, performance reporting requirements in the Portfolio Budget Statements sit alongside those required under the enhanced commonwealth performance framework. It is anticipated that the performance criteria described in Portfolio Budget Statements will be read with broader information provided in an entity’s corporate plans and annual performance statements—included in Annual Reports from October 2016—to provide an entity’s complete performance story.
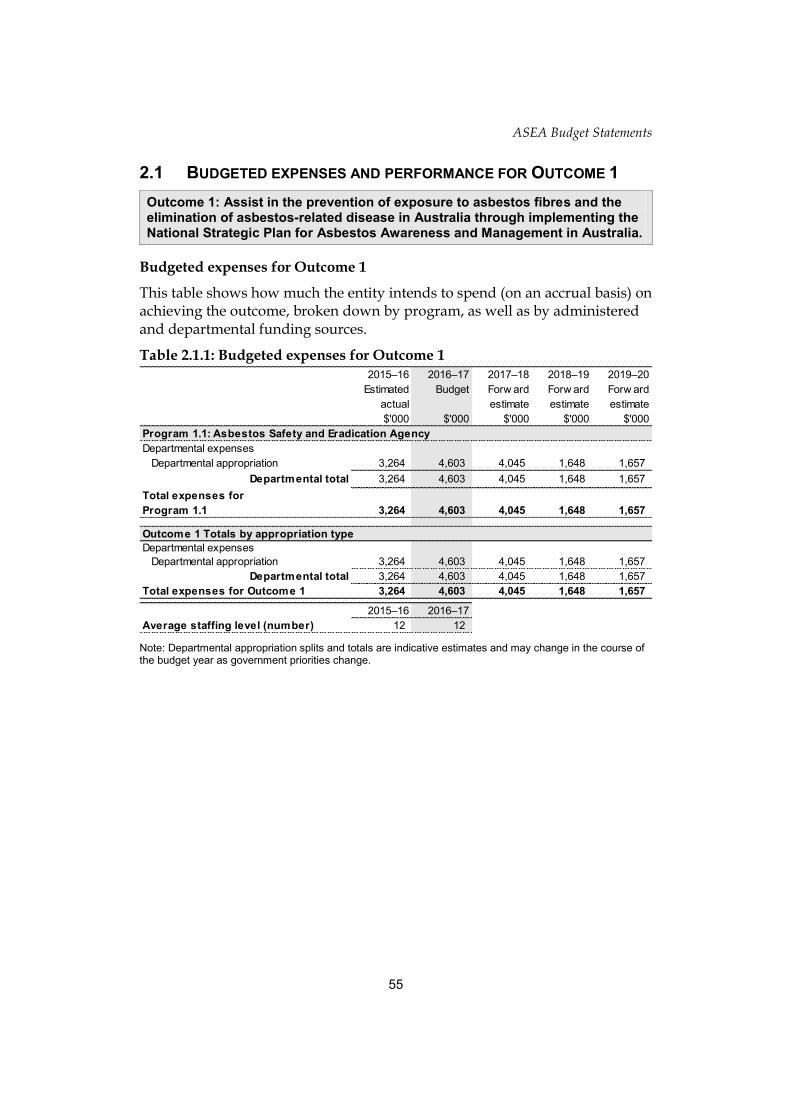
ASEA Budget Statements
55
Dep
artmen
t abbreviation
Bu
dg
et Statem
ents
2.1 BUDGETED EXPENSES AND PERFORMANCE FOR OUTCOME 1
Outcome 1: Assist in the prevention of exposure to asbestos fibres and the elimination of asbestos-related disease in Australia through implementing the National Strategic Plan for Asbestos Awareness and Management in Australia.
Budgeted expenses for Outcome 1
This table shows how much the entity intends to spend (on an accrual basis) on achieving the outcome, broken down by program, as well as by administered and departmental funding sources.
Table 2.1.1: Budgeted expenses for Outcome 1
Note: Departmental appropriation splits and totals are indicative estimates and may change in the course of the budget year as government priorities change.
2015–16
Estimated
actual
$'000
2016–17
Budget
$'000
2017–18
Forw ard
estimate
$'000
2018–19
Forw ard
estimate
$'000
2019–20
Forw ard
estimate
$'000
Departmental expenses
Departmental appropriation 3,264 4,603 4,045 1,648 1,657
Departmental total 3,264 4,603 4,045 1,648 1,657
Total expenses for
Program 1.1 3,264 4,603 4,045 1,648 1,657
Departmental expenses
Departmental appropriation 3,264 4,603 4,045 1,648 1,657
Departmental total 3,264 4,603 4,045 1,648 1,657
Total expenses for Outcome 1 3,264 4,603 4,045 1,648 1,657
2015–16 2016–17
Average staffing level (number) 12 12
Program 1.1: Asbestos Safety and Eradication Agency
Outcome 1 Totals by appropriation type

ASEA Budget Statements
56
Dep
artmen
t abbreviation
Bu
dg
et Statem
ents
Table 2.1.2: Performance criteria for Outcome 1
Table 2.1.2 below details the performance criteria for each program associated with Outcome 1. It also summarises how each program is delivered and where 2016–17 Budget measures have created new programs or materially changed existing programs.
Outcome 1—Assist in the prevention of exposure to asbestos fibres and the elimination of asbestos-related disease in Australia through implementing the National Strategic Plan for Asbestos Awareness and Management in Australia.
Program 1.1—Asbestos Safety and Eradication Agency
The Asbestos Safety and Eradication Agency delivers Outcome 1 through the review, promotion, and coordination of the National Strategic Plan. To meet this objective, the agency commissions, monitors and promotes research about asbestos safety, works collaboratively with regulators, industry, agencies and other bodies across the work, environment, public health and building and construction sectors that work with asbestos and asbestos safety, and the community to improve awareness of asbestos safety.

ASEA Budget Statements
Purposes9 The Asbestos Safety and Eradication Agency’s purpose is to facilitate the
prevention of exposure to asbestos fibres in order to eliminate asbestos-related disease in Australia. This will be primarily achieved through the National Strategic Plan for Asbestos Awareness and Management.
Delivery The deliverables for the Asbestos Safety and Eradication Agency, through the coordination of the implementation of the National Strategic Plan for Asbestos Awareness and Management include:
1. Awareness: Increase public awareness of the health risks posed by working with or being exposed to asbestos.
2. Best practice: Identify and share best practice in asbestos management, education, handling, storage and disposal.
3. Identification: Improve the identification and grading of asbestos and sharing of information regarding the location of asbestos-containing materials (ACMs).
4. Removal: Identify priority areas where ACMs present a risk, the barriers to the safe removal of asbestos and review management and removal infrastructure to estimate the capacity and rate for the safe removal of asbestos.
5. Research: Commission, monitor and promote research into asbestos exposure pathways, prevention and asbestos-related diseases to inform policy options.
6. International leadership: Australia to continue to play a leadership role in a global campaign for a worldwide asbestos ban.
9 The Asbestos Safety and Eradication Agency’s purpose statement is published within the Asbestos Safety
and Eradication Agency Corporate Plan 2015–19.

ASEA Budget Statements
58
Performance information
Year Performance criteria Targets
2015–16 Increase public awareness about asbestos safety.
Effectively coordinate national issues that relate to the plan and asbestos issues.
Identify targeted and practical initiatives to reduce the risks of asbestos-related disease in Australia.
Increase in awareness, coordination and evidence demonstrating progress in relation to the NSP and reduction in asbestos exposure risks.
Assessment: On track
Demonstrated by development of resources, delivery of events, progress tracking of NSP and Asbestos Safety and Eradication Council meetings.
Variation: NSP progress report
expected to be published in November 2016.
2016–17 As per 2015–16 As per 2015–16
2017–18 and beyond
As per 2016–17 As per 2016–17 and outcomes of the first phase of the plan inform the next National Strategic Plan for Asbestos Management and Awareness
Material changes to Program 1.1 resulting from the following measures:
Nil

ASEA Budget Statements
59
Section 3: Budgeted financial statements
Section 3 presents budgeted financial statements which provide a comprehensive snapshot of entity finances for the 2016–17 budget year, including the impact of budget measures and resourcing on financial statements.
3.1 BUDGETED FINANCIAL STATEMENTS
3.1.1 Differences between entity resourcing and financial statements
The Asbestos Safety and Eradication Agency has nil differences to report.
3.1.2 Explanatory notes and analysis of budgeted financial statements
The Asbestos Safety and Eradication Agency is budgeting for zero operating result for the 2016–17 financial year.
Total revenues are estimated to be $4.6 million and total expenses $4.6 million.
Total assets at the end of the 2016–17 financial year are estimated to be $5.9 million. The majority of the assets represent appropriations receivable.
Total liabilities for 2016–17 are estimated at $2.0 million. The largest liability item is supplier payables.

ASEA Budget Statements
60
3.2.1 BUDGETED FINANCIAL STATEMENTS TABLES
Table 3.1: Comprehensive income statement (showing net cost of services) for the period ended 30 June
Prepared on Australian Accounting Standards basis.
2015–16
Estimated
actual
$'000
2016–17
Budget
$'000
2017–18
Forw ard
estimate
$'000
2018–19
Forw ard
estimate
$'000
2019–20
Forw ard
estimate
$'000
EXPENSES
Employee benefits 1,250 1,244 1,256 1,256 1,256
Suppliers 2,014 3,359 2,789 392 401
Total expenses 3,264 4,603 4,045 1,648 1,657
LESS:
OWN-SOURCE INCOME
Own-source revenue
Other - - - - -
Total own-source revenue - - - - -
Total own-source income - - - - -
Net (cost of)/contribution by services (3,264) (4,603) (4,045) (1,648) (1,657)
Revenue from Government 3,264 4,603 4,045 1,648 1,657
Surplus/(deficit) attributable to the
Australian Government - - - - -
Total comprehensive income/(loss) - - - - -
Total comprehensive income/(loss)
attributable to the Australian
Government - - - - -

ASEA Budget Statements
61
Table 3.2: Budgeted departmental balance sheet (as at 30 June)
* Equity is the residual interest in assets after deduction of liabilities.
Prepared on Australian Accounting Standards basis.
2015–16
Estimated
actual
$'000
2016–17
Budget
$'000
2017–18
Forw ard
estimate
$'000
2018–19
Forw ard
estimate
$'000
2019–20
Forw ard
estimate
$'000
ASSETS
Financial assets
Cash and cash equivalents 59 59 59 59 59
Trade and other receivables 5,720 5,739 5,759 5,759 5,759
Total financial assets 5,779 5,798 5,818 5,818 5,818
Non-financial assets
Property, plant and equipment - 59 119 179 239
Total non-financial assets - 59 119 179 239
Total assets 5,779 5,857 5,937 5,997 6,057
LIABILITIES
Payables
Other payables 1,652 1,652 1,652 1,652 1,652
Total payables 1,652 1,652 1,652 1,652 1,652
Interest bearing liabilities
Provisions
Employee provisions 370 389 409 409 409
Total provisions 370 389 409 409 409
Total liabilities 2,022 2,041 2,061 2,061 2,061
Net assets 3,757 3,816 3,876 3,936 3,996
EQUITY*
Parent entity interest
Contributed equity 183 242 302 362 422
Retained surplus (accumulated deficit) 3,574 3,574 3,574 3,574 3,574
Total parent entity interest 3,757 3,816 3,876 3,936 3,996
Total equity 3,757 3,816 3,876 3,936 3,996

ASEA Budget Statements
62
Table 3.3: Departmental statement of changes in equity—summary of movement (Budget year 2016–17)
Prepared on Australian Accounting Standards basis.
Retained
earnings
$'000
Asset
revaluation
reserve
$'000
Contributed
equity/
capital
$'000
Total equity
$'000
Opening balance as at 1 July 2016
Balance carried forw ard from previous period 3,574 - 183 3,757
Adjusted opening balance 3,574 - 183 3,757
Comprehensive income
Other comprehensive income - - - -
Surplus/(deficit) for the period - - - -
Total comprehensive income - - - -
of w hich:
Attributable to the Australian Government - - - -
Transactions with owners
Contributions by owners
Departmental capital budget (DCB) - - 59 59
Sub-total transactions with owners - - 59 59
Transfers betw een equity
Transfers betw een equity components - - - -
Estimated closing balance as at 30 June 2017 3,574 - 242 3,816
Less: non-controlling interests - - - -
Closing balance attributable to the
Australian Government 3,574 - 242 3,816

ASEA Budget Statements
63
Table 3.4: Budgeted departmental statement of cash flows (for the period ended 30 June)
Prepared on Australian Accounting Standards basis.
2015–16
Estimated
actual
$'000
2016–17
Budget
$'000
2017–18
Forw ard
estimate
$'000
2018–19
Forw ard
estimate
$'000
2019–20
Forw ard
estimate
$'000
OPERATING ACTIVITIES
Cash received
Appropriations 3,241 4,584 4,025 1,648 1,657
Total cash received 3,241 4,584 4,025 1,648 1,657
Cash used
Employees 1,227 1,225 1,236 1,256 1,256
Suppliers 2,014 3,359 2,789 392 401
Total cash used 3,241 4,584 4,025 1,648 1,657
Net cash from/(used by) operating
activities - - - - -
INVESTING ACTIVITIES
Cash received
Other - - - - -
Total cash received - - - - -
Cash used
Purchase of property, plant and
equipment and intangibles
- 59 60 60 60
Total cash used - 59 60 60 60
Net cash from/(used by) investing
activities - (59) (60) (60) (60)
FINANCING ACTIVITIES
Cash received
Contributed equity - 59 60 60 60
Total cash received - 59 60 60 60
Cash used
Other - - - - -
Total cash used - - - - -
Net cash from/(used by) financing
activities - 59 60 60 60
Net increase/(decrease) in cash held - - - - -
Cash and cash equivalents at the
beginning of the reporting period 59 59 59 59 59
Cash and cash equivalents at the end
of the reporting period 59 59 59 59 59
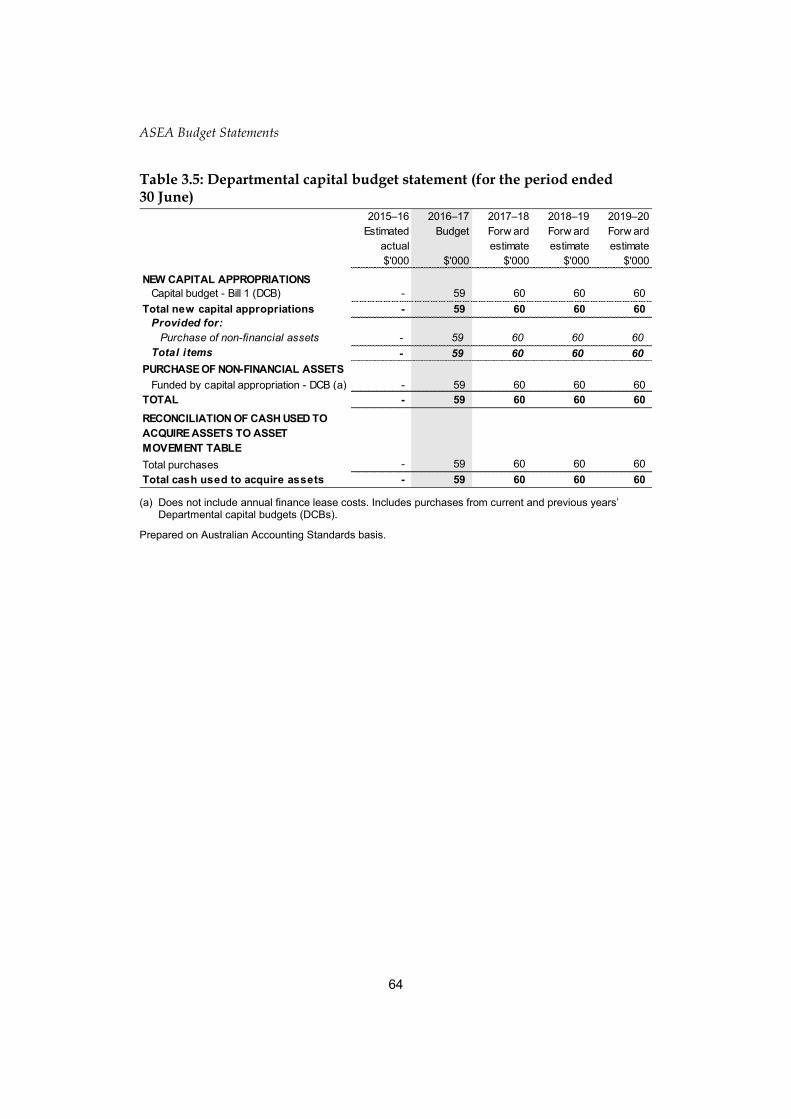
ASEA Budget Statements
64
Table 3.5: Departmental capital budget statement (for the period ended 30 June)
(a) Does not include annual finance lease costs. Includes purchases from current and previous years’
Departmental capital budgets (DCBs).
Prepared on Australian Accounting Standards basis.
2015–16
Estimated
actual
$'000
2016–17
Budget
$'000
2017–18
Forw ard
estimate
$'000
2018–19
Forw ard
estimate
$'000
2019–20
Forw ard
estimate
$'000
NEW CAPITAL APPROPRIATIONS
Capital budget - Bill 1 (DCB) - 59 60 60 60
Total new capital appropriations - 59 60 60 60
Provided for:
Purchase of non-financial assets - 59 60 60 60
Total items - 59 60 60 60
PURCHASE OF NON-FINANCIAL ASSETS
Funded by capital appropriation - DCB (a) - 59 60 60 60
TOTAL - 59 60 60 60
RECONCILIATION OF CASH USED TO
ACQUIRE ASSETS TO ASSET
MOVEMENT TABLE
Total purchases - 59 60 60 60
Total cash used to acquire assets - 59 60 60 60

ASEA Budget Statements
65
Table 3.6: Statement of asset movements (Budget year 2016–17)
(a) 'Appropriation ordinary annual services' refers to funding provided through Appropriation Bill (No.1) 2016–17 for depreciation/amortisation expenses, DCBs or other operational expenses.
Other property,
plant and
equipment
$'000
Total
$'000
As at 1 July 2016
Gross book value - -
Accumulated depreciation/amortisation and impairment - -
Opening net book balance - -
Capital asset additions
Estimated expenditure on new or replacement
assets
By purchase - appropriation ordinary annual services (a) 59 59
Total additions 59 59
Other movements
Depreciation/amortisation expense - -
Total other movements - -
As at 30 June 2017
Gross book value 59 59
Accumulated depreciation/ amortisation and impairment - -
Closing net book balance 59 59
ASEA Budget Statements
66
Table 3.7: Schedule of budgeted income and expenses administered on behalf of Government (for the period ended 30 June)
ASEA has no income and expenses administered on behalf of government. For this reason Table 3.7 is not presented.
Table 3.8: Schedule of budgeted assets and liabilities administered on behalf of Government (as at 30 June)
ASEA has no administered assets and liabilities. For this reason Table 3.8 is not presented.
Table 3.9: Schedule of budgeted administered cash flows (for the period ended 30 June)
ASEA has no administered cash flows. For this reason Table 3.9 is not presented.
Table 3.10: Administered capital budget statement (for the period ended 30 June)
ASEA has no administered capital purchases. For this reason Table 3.10 is not presented.
Table 3.11: Statement of administered asset movements (Budget year 2016–17) ASEA has no administered non-financial assets. For this reason Table 3.11 is not presented.
Comcare, the Safety, Rehabilitation and
Compensation Commission, and the Seafarers Safety,
Rehabilitation and Compensation Authority
Entity resources and planned performance


Comcare Budget Statements
69
COMCARE, THE SAFETY, REHABILITATION AND
COMPENSATION COMMISSION, AND THE SEAFARERS SAFETY, REHABILITATION AND
COMPENSATION AUTHORITY
Section 1: Entity overview and resources ................................................................ 71
1.1 Strategic direction statement .......................................................................... 71
1.2 Entity resource statement ............................................................................... 73
1.3 Budget Measures ............................................................................................ 74
Section 2: Outcomes and planned performance ..................................................... 75
2.1 Budgeted expenses and performance for Outcome 1 .................................... 76
Section 3: Budgeted financial statements ................................................................ 84
3.1 Budgeted financial statements........................................................................ 84
3.2.1 Budgeted financial statements tables ............................................................. 86

Comcare Budget Statements
71
COMCARE, THE SAFETY, REHABILITATION AND
COMPENSATION COMMISSION, AND THE SEAFARERS SAFETY, REHABILITATION AND
COMPENSATION AUTHORITY
Section 1: Entity overview and resources
1.1 STRATEGIC DIRECTION STATEMENT
Comcare supports participation and productivity nationally through healthy and safe workplaces that minimise the impact of harm.
In addition to claims management and regulatory responsibilities, Comcare manages Commonwealth common law liabilities for asbestos compensation. The agency also provides secretariat and related functions to support the Safety, Rehabilitation and Compensation Commission (SRCC) and the Seafarers Safety, Rehabilitation and Compensation Authority (Seacare Authority).
Comcare is ensuring that the delivery of strategic priorities are articulated through its corporate plan, and that Comcare continues to be an efficient and effective regulator, a cost effective national insurer, and an adaptable organisation, demonstrating leadership in identifying and delivering strategies to minimise harm in the workplace.
Comcare’s national strategic priorities in 2016–17 include:
work, health and safety leadership—developing a policy narrative with a focus on productivity and participation, and influencing the workplace wellbeing dialogue through closer engagement with employers, employees, policy makers and researchers
driving innovation and transformation of workplace initiatives through collaboration with stakeholders
targeted regulation—maintaining a focus on harm prevention using a modern model of regulation
leading insurer—delivering robust and transparent premium setting policies and engaging with employers to achieve better outcomes in claims management
fresh approaches—generating and understanding business intelligence to guide policy and operations
successful business—ensuring Comcare’s capability supports the vision and obligations of the organisation.
Comcare Budget Statements
72
Comcare will continue to:
work with employers to deliver best practice in rehabilitation and compensation claims management to achieve early and safe return to work for workers covered by the Comcare scheme. This is achieved using Comcare’s Active Management Model and continuing work on the Health Benefits of Work Initiative.
deliver education, assurance and enforcement to protect the health, safety and welfare of workers covered by the scheme
provide access to compensation for people with asbestos-related diseases where the Commonwealth has a liability through the management of claims.
Comcare is committed to delivering regulation consistent with the Australian Government’s Regulator Performance Framework.
Comcare’s strategic direction and priority actions are clear and in alignment to ensure the coherence, capability and adaptability of an organisation going forward.

Comcare Budget Statements
73
1.2 ENTITY RESOURCE STATEMENT
Table 1.1 shows the total funding from all sources available to Comcare for its operations and to deliver programs and services on behalf of the government.
The table summarises how resources will be applied by outcome (government strategic policy objectives), and by administered (on behalf of the government or the public) and departmental (for the entity’s operations) classification.
For more detailed information please refer to Budget Paper No. 4—Agency Resourcing.
Information in this table is presented on a resourcing (i.e. appropriations/cash available) basis, whilst the ‘Budgeted expenses by Outcome 1’ table in Section 2 and the financial statements in Section 3 are presented on an accrual basis.
Table 1.1: Comcare resource statement—Budget estimates for 2016–17 as at Budget May 2016
Please note: All figures shown above are GST exclusive—these may not match figures in the cash flow statement
(a) Appropriation Bill (No.1) 2016–17. (b) Comcare is not directly appropriated as it is a corporate Commonwealth entity. Grants from its portfolio
department include special appropriations under the Safety, Rehabilitation and Compensation Act 1988 for the payment of pre-premium claims costs and the Asbestos-related Claims (Management of Commonwealth Liabilities) Act 2005 for asbestos-related claims settlements.
2015–16
Estimated actual
$'000
2016–17
Estimate
$'000
Opening Balance/Cash Reserves at 1 July 677,619 797,981
Funds from Government
Annual appropriations - ordinary annual services (a)
Outcome 1 7,727 6,119
Total departmental annual appropriations 7,727 6,119
Amounts Received From Related Entities
Amounts from portfolio department (b) 63,809 63,748
Total amounts received from related entities 63,809 63,748
Total Funds from Government 71,536 69,867
Funds from Industry Sources
Licence Fees 17,249 17,249
Total Funds from Industry Sources 17,249 17,249
Funds from Other Sources
Interest 25,816 29,712
Sale of Goods and Services 1,267 1,773
Regulatory Contributions 18,591 18,613
Workers Compensation Premiums 413,505 405,400
Total Funds from Other Sources 459,179 455,498
Total net resourcing for Comcare 1,225,583 1,340,595
2015–16 2016–17
Average staffing level (number) 626 652

Comcare Budget Statements
74
1.3 BUDGET MEASURES
Part 1: Measures announced since the 2015–16 MYEFO
Prepared on a Government Finance Statistics (fiscal) basis. Figures displayed as a negative (-) represent a decrease in funds and a positive (+) represent an increase in funds.
Part 2 Other measures not previously reported in a portfolio statement
(a) This measure was first published in the 2014–15 Mid-Year Economic and Fiscal Outlook.
Prepared on a Government Finance Statistics (fiscal) basis. Figures displayed as a negative (-) represent a decrease in funds and a positive (+) represent an increase in funds.
Program
2015–16
$'000
2016–17
$'000
2017–18
$'000
2018–19
$'000
2019–20
$'000
Revenue measures
Asbestos Safety Assurance Model -
extension and cost recovery
1.1
Administered revenues nfp nfp nfp nfp nfp
Departmental revenues nfp nfp nfp nfp nfp
Total nfp nfp nfp nfp nfp
Total revenue measures
Administered nfp nfp nfp nfp nfp
Departmental nfp nfp nfp nfp nfp
Total nfp nfp nfp nfp nfp
Expense measures
Asbestos Safety Assurance Model -
extension and cost recovery
1.1
Administered expenses - nfp nfp nfp nfp
Departmental expenses - nfp nfp nfp nfp
Total - nfp nfp nfp nfp
Seacare scheme - cost recovery
arrangements
1.1
Administered expenses - nfp nfp nfp nfp
Departmental expenses - nfp nfp nfp nfp
Total - nfp nfp nfp nfp
Total expense measures
Administered - nfp nfp nfp nfp
Departmental - nfp nfp nfp nfp
Total - nfp nfp nfp nfp
Program
2015–16
$'000
2016–17
$'000
2017–18
$'000
2018–19
$'000
2019–20
$'000
Measures
Public Sector Superannuation
Accumulation Plan administration fees(a)
1.1
Administered expenses - - - - -
Departmental expenses - (61) (61) (61) (61)
Total - (61) (61) (61) (61)
Administered - - - - -
Departmental - (61) (61) (61) (61)
Total - (61) (61) (61) (61)

Comcare Budget Statements
75
Section 2: Outcomes and planned performance
Government outcomes are the intended results, impacts or consequences of actions by the Government on the Australian community. Commonwealth programs are the primary vehicle by which government entities achieve the intended results of their outcome statements. Entities are required to identify the programs which contribute to government outcomes over the Budget and forward years.
Comcare’s outcome is described below, together with its program components, specifying the performance indicators and targets used to assess and monitor the performance of Comcare in achieving government outcomes.
Note:
From 1 July 2015, performance reporting requirements in the Portfolio Budget Statements sit alongside those required under the enhanced commonwealth performance framework. It is anticipated that the performance criteria described in Portfolio Budget Statements will be read with broader information provided in an entity’s corporate plans and annual performance statements—included in Annual Reports from October 2016—to provide an entity’s complete performance story.
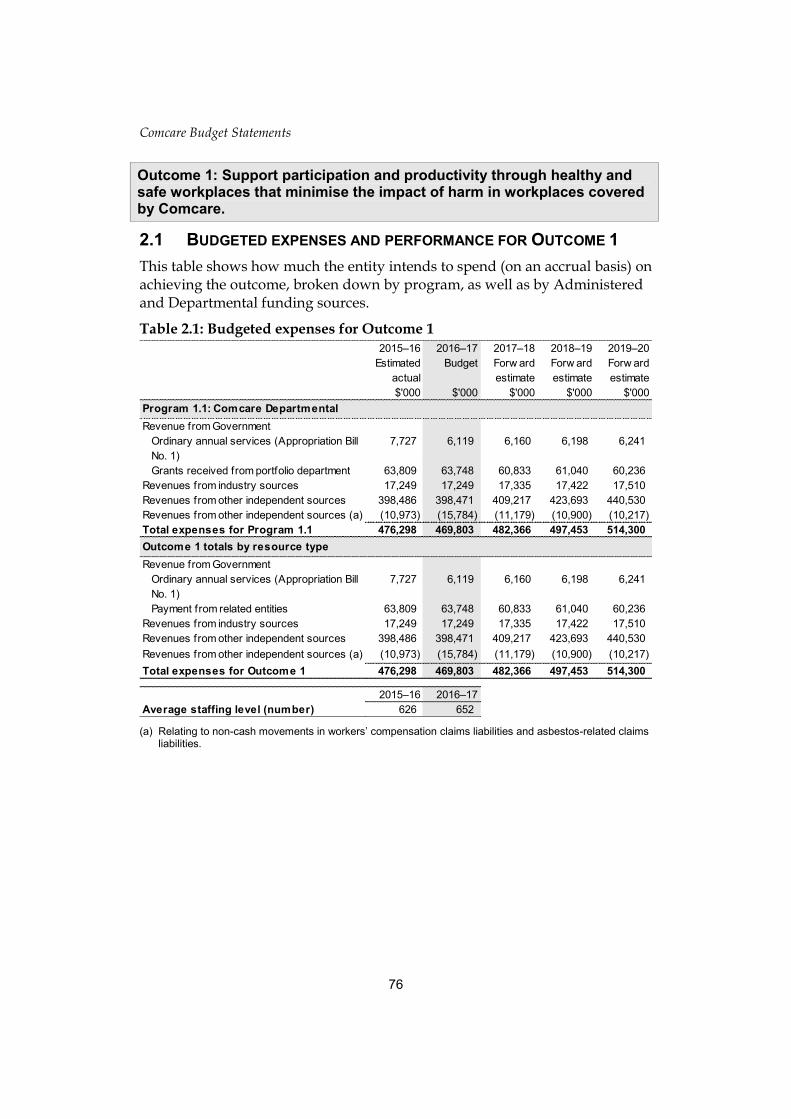
Comcare Budget Statements
76
Outcome 1: Support participation and productivity through healthy and safe workplaces that minimise the impact of harm in workplaces covered by Comcare.
2.1 BUDGETED EXPENSES AND PERFORMANCE FOR OUTCOME 1
This table shows how much the entity intends to spend (on an accrual basis) on achieving the outcome, broken down by program, as well as by Administered and Departmental funding sources.
Table 2.1: Budgeted expenses for Outcome 1
(a) Relating to non-cash movements in workers’ compensation claims liabilities and asbestos-related claims liabilities.
2015–16
Estimated
actual
$'000
2016–17
Budget
$'000
2017–18
Forw ard
estimate
$'000
2018–19
Forw ard
estimate
$'000
2019–20
Forw ard
estimate
$'000
Revenue from Government
Ordinary annual services (Appropriation Bill
No. 1)
7,727 6,119 6,160 6,198 6,241
Grants received from portfolio department 63,809 63,748 60,833 61,040 60,236
Revenues from industry sources 17,249 17,249 17,335 17,422 17,510
Revenues from other independent sources 398,486 398,471 409,217 423,693 440,530
Revenues from other independent sources (a) (10,973) (15,784) (11,179) (10,900) (10,217)
Total expenses for Program 1.1 476,298 469,803 482,366 497,453 514,300
Revenue from Government
Ordinary annual services (Appropriation Bill
No. 1)
7,727 6,119 6,160 6,198 6,241
Payment from related entities 63,809 63,748 60,833 61,040 60,236
Revenues from industry sources 17,249 17,249 17,335 17,422 17,510
Revenues from other independent sources 398,486 398,471 409,217 423,693 440,530
Revenues from other independent sources (a) (10,973) (15,784) (11,179) (10,900) (10,217)
Total expenses for Outcome 1 476,298 469,803 482,366 497,453 514,300
2015–16 2016–17
Average staffing level (number) 626 652
Program 1.1: Comcare Departmental
Outcome 1 totals by resource type

Comcare Budget Statements
77
Table 2.1.2: Program component expenses
2015–16
Estimated
actual
$'000
2016–17
Budget
$'000
2017–18
Forw ard
estimate
$'000
2018–19
Forw ard
estimate
$'000
2019–20
Forw ard
estimate
$'000
Annual departmental expenses:
Annual Appropriation 2,164 739 744 748 753
Expenses not requiring appropriation in the Budget year 26,217 27,373 27,360 27,554 27,487
Total component 1.1 expenses 28,381 28,112 28,104 28,302 28,240
Expenses not requiring appropriation in the Budget year 7,981 8,559 8,557 8,618 8,599
Total component 1.2 expenses 7,981 8,559 8,557 8,618 8,599
Annual departmental expenses:
Annual Appropriation 388 361 364 366 369
Expenses not requiring appropriation in the Budget year 5,650 4,743 4,739 4,773 4,759
Total component 1.3 expenses 6,038 5,104 5,103 5,139 5,128
Annual departmental expenses:
Annual Appropriation 261 207 208 210 211
Expenses not requiring appropriation in the Budget year 404,601 404,523 416,133 431,241 448,821
Total component 1.4 expenses 404,862 404,730 416,341 431,451 449,032
Grants received from portfolio department 35,174 33,703 32,517 31,253 29,486
Expenses not requiring appropriation in the Budget year (31,877) (30,538) (28,900) (26,801) (24,387)
Total component 1.5 expenses 3,297 3,165 3,617 4,452 5,099
Annual departmental expenses:
Annual Appropriation 4,914 4,812 4,844 4,874 4,908
Grants received from portfolio department 28,635 30,045 28,317 29,787 30,750
Expenses not requiring appropriation in the Budget year (7,810) (14,724) (12,517) (15,170) (17,456)
Total component 1.6 expenses 25,739 20,133 20,644 19,491 18,202
Total program expenses 476,298 469,803 482,366 497,453 514,300
1.6. - Asbestos Claims
1.1. - Work Health, Safety and Rehabilitation Regulation
1.2 - Comcare Workers' Compensation Scheme Management
1.3 - SRCC and Seacare Authority Support
1.4. - Premium Claims
1.5. - Pre-Premium Claims

Comcare Budget Statements
78
Table 2.1.3: Performance criteria for Comcare Outcome 1
Table 2.1.3 below details the performance criteria for each program component associated with Outcome 1. It also summarises how each program is delivered.
Outcome 1—Support participation and productivity through healthy and safe workplaces that minimise the impact of harm in workplaces covered by Comcare.
Program Component 1.1—Work Health, Safety and Rehabilitation Regulation
This program component contributes to the outcome by achieving compliance with the SRC Act and the WHS Act and regulations, in addition to leading continuous improvements in work health and safety and rehabilitation outcomes.
Delivery Comcare will undertake high quality compliance activities by creating a regulatory blue print to improve regulatory intelligence and assist in developing risk based regulation whilst providing high quality compliance activities.
Purpose Having a positive impact on reducing injury and harm in the workplace.
Performance information1
Year Performance criteria Targets
2015–16 Achievement of the Australian Work Health and Safety Strategy 2012–2020 targets and initiatives
Compliance with the consistent Approval Framework for Workplace Rehabilitation Providers by workplace rehabilitation program providers approved by Comcare
Achievement of Regulator Performance Framework requirements
Conduct a range of proactive and reactive inspections to ensure compliance with the WHS Act
A range of campaign programs, audits, national seminars and proactive inspections have been delivered
Compliance activities/ inspections have been delivered under the regulatory model. Some instances of non-compliance have been detected and Comcare is taking action against relevant organisations
Comcare has developed and implemented its Regulator Performance Framework
2016–17 As per 2015–16 Percentage number of assessed workplaces and providers demonstrating compliance at the first time of assessment and on subsequent assessments
Qualitative evaluation of the consistency of compliance activities
Percentage number of activities that comply with Comcare’s internal and statutory requirements of investigations, inspections, authorisations and assessments of notifications
2017–18 and beyond
As per 2016–17 As per 2016–17
1 New or modified performance criteria that reflect new or materially changed programs are shown in
underlined italics.
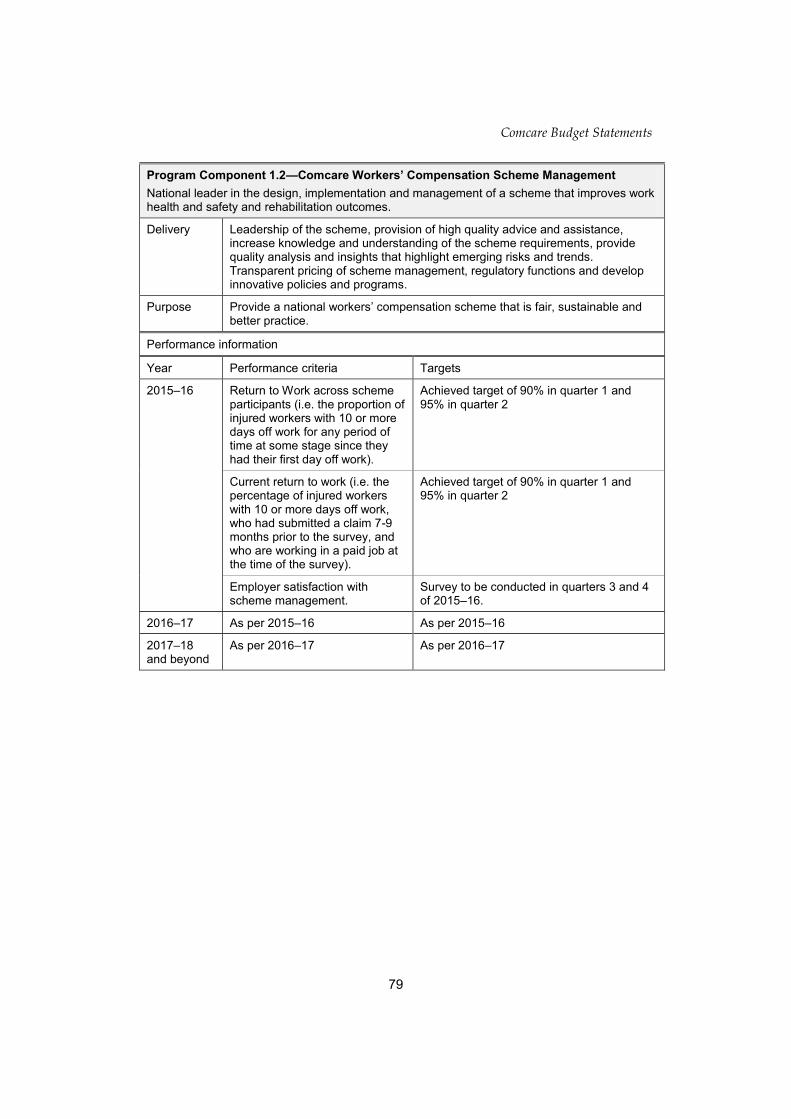
Comcare Budget Statements
79
Program Component 1.2—Comcare Workers’ Compensation Scheme Management
National leader in the design, implementation and management of a scheme that improves work health and safety and rehabilitation outcomes.
Delivery Leadership of the scheme, provision of high quality advice and assistance, increase knowledge and understanding of the scheme requirements, provide quality analysis and insights that highlight emerging risks and trends. Transparent pricing of scheme management, regulatory functions and develop innovative policies and programs.
Purpose Provide a national workers’ compensation scheme that is fair, sustainable and better practice.
Performance information
Year Performance criteria Targets
2015–16 Return to Work across scheme participants (i.e. the proportion of injured workers with 10 or more days off work for any period of time at some stage since they had their first day off work).
Achieved target of 90% in quarter 1 and 95% in quarter 2
Current return to work (i.e. the percentage of injured workers with 10 or more days off work, who had submitted a claim 7-9 months prior to the survey, and who are working in a paid job at the time of the survey).
Achieved target of 90% in quarter 1 and 95% in quarter 2
Employer satisfaction with scheme management.
Survey to be conducted in quarters 3 and 4 of 2015–16.
2016–17 As per 2015–16 As per 2015–16
2017–18 and beyond
As per 2016–17 As per 2016–17

Comcare Budget Statements
80
Program Component 1.3—Safety, Rehabilitation and Compensation Commission and Seafarers Safety, Rehabilitation and Compensation Authority Support.
Providing high quality advice and assistance to the SRCC and the Seacare Authority enabling their responsibilities to be met and deliver the government’s direction.
Delivery Provide advice to the SRCC and the Seacare Authority enabling review and improvement of the framework and content of the regulatory model.
Purpose Support the SRCC and the Seacare Authority to achieve the government’s direction and strategic initiatives.
Performance information
Year Performance criteria Targets
2015–16 SRCC satisfaction of support provided by Comcare.
Satisfied
Seacare Authority satisfaction of support provided by Comcare.
Satisfied
2016–17 As per 2015–16. Percentage and number of Commissioners and Members satisfied with the quality of support provided.
Qualitative evaluation using structured interviews with Commissioners and Members.
2017–18 and beyond
As per 2016–17 As per 2016–17

Comcare Budget Statements
81
Program Component 1.4—Premium Claims
Delivery Responsive, relevant and cost effective services supported by the timely management of workers’ compensation claims.
Purpose The management of all claims and liabilities for the Commonwealth and the ACT Government’s workers’ compensation scheme.
Performance information
Year Performance criteria1 (a) Targets
2015–16 Funding Ratio (i.e. the percentage of premium-related total assets to premium-related liabilities).
Target 75% Achieved 81%
Commonwealth Average premium rate Target 2.04% Achieved to date
Claims continuance rate (i.e. the percentage of claims with four weeks incapacity that continued to 13 weeks or more of incapacity)
Target 57% Achieved to date
Current return to work (i.e. the percentage of injured workers with 10 or more days off work, who had submitted a claim 7-9 months prior to the survey, and who are working in a paid job at the time of the survey)
Target 90% Results available quarter four
Injured worker satisfaction with services as part of the Comcare index
Target 85% Results available in quarter 4
Timeliness of claims determination (i.e. percentage of new claims determined within 20 calendar days for injury claims and 60 days for disease claims)
Target 100% Achieved 88%
Timeliness of determined claims payment (i.e. percentage of non-incapacity items paid or rejected within seven calendar days for reimbursement to employees or trustees, and 28 calendar days for other payments)
Target 100% Achieved 65%
2016–17 Scheme is fully funded by 1 July 2020 (i.e. the percentage of premium-related assets to premium-related liabilities)
Target 85% or higher by 1 July 2017
Scheme liability is reduced by $1 billion by 1 July 2018 Target $2.3 billion or lower by 1 July 2017
Premiums are at an optimal level (ie average premiums as a percentage of payroll)
Target 1.3% or lower by 1 July 2017
Reduced administration costs Target 21% or lower by 1 July 2017
1 New or modified performance criteria that reflect new or materially changed programs are shown in
underlined italics.
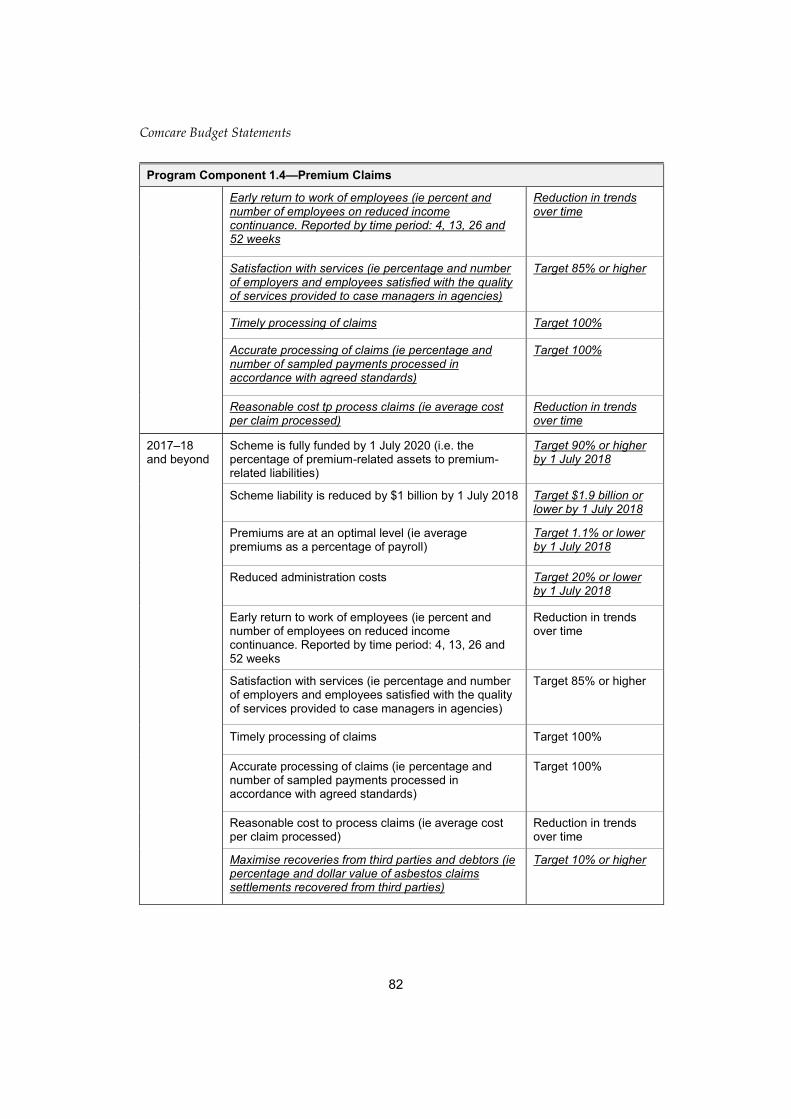
Comcare Budget Statements
82
Program Component 1.4—Premium Claims
Early return to work of employees (ie percent and number of employees on reduced income continuance. Reported by time period: 4, 13, 26 and 52 weeks
Reduction in trends over time
Satisfaction with services (ie percentage and number of employers and employees satisfied with the quality of services provided to case managers in agencies)
Target 85% or higher
Timely processing of claims Target 100%
Accurate processing of claims (ie percentage and number of sampled payments processed in accordance with agreed standards)
Target 100%
Reasonable cost tp process claims (ie average cost per claim processed)
Reduction in trends over time
2017–18 and beyond
Scheme is fully funded by 1 July 2020 (i.e. the percentage of premium-related assets to premium-related liabilities)
Target 90% or higher by 1 July 2018
Scheme liability is reduced by $1 billion by 1 July 2018 Target $1.9 billion or lower by 1 July 2018
Premiums are at an optimal level (ie average premiums as a percentage of payroll)
Target 1.1% or lower by 1 July 2018
Reduced administration costs Target 20% or lower by 1 July 2018
Early return to work of employees (ie percent and number of employees on reduced income continuance. Reported by time period: 4, 13, 26 and 52 weeks
Reduction in trends over time
Satisfaction with services (ie percentage and number of employers and employees satisfied with the quality of services provided to case managers in agencies)
Target 85% or higher
Timely processing of claims Target 100%
Accurate processing of claims (ie percentage and number of sampled payments processed in accordance with agreed standards)
Target 100%
Reasonable cost to process claims (ie average cost per claim processed)
Reduction in trends over time
Maximise recoveries from third parties and debtors (ie percentage and dollar value of asbestos claims settlements recovered from third parties)
Target 10% or higher
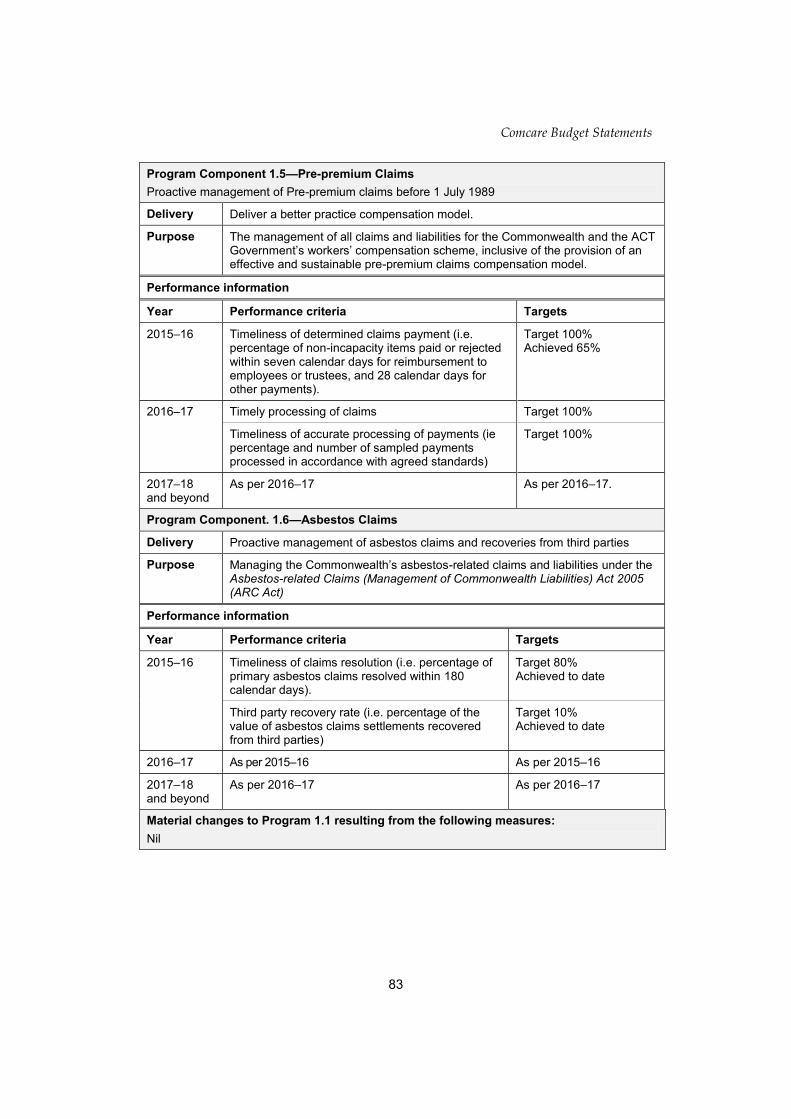
Comcare Budget Statements
83
Program Component 1.5—Pre-premium Claims
Proactive management of Pre-premium claims before 1 July 1989
Delivery Deliver a better practice compensation model.
Purpose The management of all claims and liabilities for the Commonwealth and the ACT Government’s workers’ compensation scheme, inclusive of the provision of an effective and sustainable pre-premium claims compensation model.
Performance information
Year Performance criteria Targets
2015–16 Timeliness of determined claims payment (i.e. percentage of non-incapacity items paid or rejected within seven calendar days for reimbursement to employees or trustees, and 28 calendar days for other payments).
Target 100% Achieved 65%
2016–17 Timely processing of claims Target 100%
Timeliness of accurate processing of payments (ie percentage and number of sampled payments processed in accordance with agreed standards)
Target 100%
2017–18 and beyond
As per 2016–17 As per 2016–17.
Program Component. 1.6—Asbestos Claims
Delivery Proactive management of asbestos claims and recoveries from third parties
Purpose Managing the Commonwealth’s asbestos-related claims and liabilities under the Asbestos-related Claims (Management of Commonwealth Liabilities) Act 2005 (ARC Act)
Performance information
Year Performance criteria Targets
2015–16 Timeliness of claims resolution (i.e. percentage of primary asbestos claims resolved within 180 calendar days).
Target 80% Achieved to date
Third party recovery rate (i.e. percentage of the value of asbestos claims settlements recovered from third parties)
Target 10% Achieved to date
2016–17 As per 2015–16 As per 2015–16
2017–18 and beyond
As per 2016–17 As per 2016–17
Material changes to Program 1.1 resulting from the following measures:
Nil

Comcare Budget Statements
84
Section 3: Budgeted financial statements
Section 3 presents budgeted financial statements which provide a comprehensive snapshot of entity finances for the 2016–17 budget year, including the impact of budget measures and resourcing on financial statements.
3.1 BUDGETED FINANCIAL STATEMENTS
3.1.1 Differences between entity resourcing and financial statements
The difference between the available resources shown in Table 1.1: Comcare resource statement and Table 3.2.1: Comprehensive Income Statement is due to prior year amounts available in 2016–17, and non-cash movements in the value of the workers compensation claims liability and notional interest receipts.
The prior year amounts relate to retained premium funds, which are held to discharge future premium claims liabilities. Table 3.2: Budgeted Departmental Balance Sheet also includes significant financial assets (appropriations receivable) which will fund claim payments over the lifetime of the outstanding claims liabilities.
3.1.2 Explanatory notes and analysis of budgeted financial statements
Income Comcare’s total income in 2016–17 is budgeted at $520.7 million, compared to $529.2 million in 2015–16 (a decrease of $8.5 million, Table 3.1).
Revenue from independent sources, which excludes annual appropriations and other cash and non-cash appropriations received from the portfolio department, is budgeted at $536.5 million for 2016–17 (Table 3.1).
The decrease in revenue is mainly due to the expected reduction in premium revenue. The key factors contributing to a lower level of premium in 2016–17 include a notable reduction in employee numbers, and a lower additional margin in response to an improved funding ratio of the scheme.
Expenses Comcare’s total expenses in 2016–17 are budgeted at $469.8 million, compared to $476.3 million in 2015–16 (a decrease of $6.5 million) mainly due to the decrease in the movement of claims liabilities.
Claims expenses are budgeted to increase by $3.8 million based on projections provided by an independent actuarial assessment. The movement in outstanding claims liabilities is estimated to be $12.5 million less in 2016–17 than in 2015–16 ($32.3 million in 2016–17 compared to $44.8 million in 2015–16, Table 3.1).
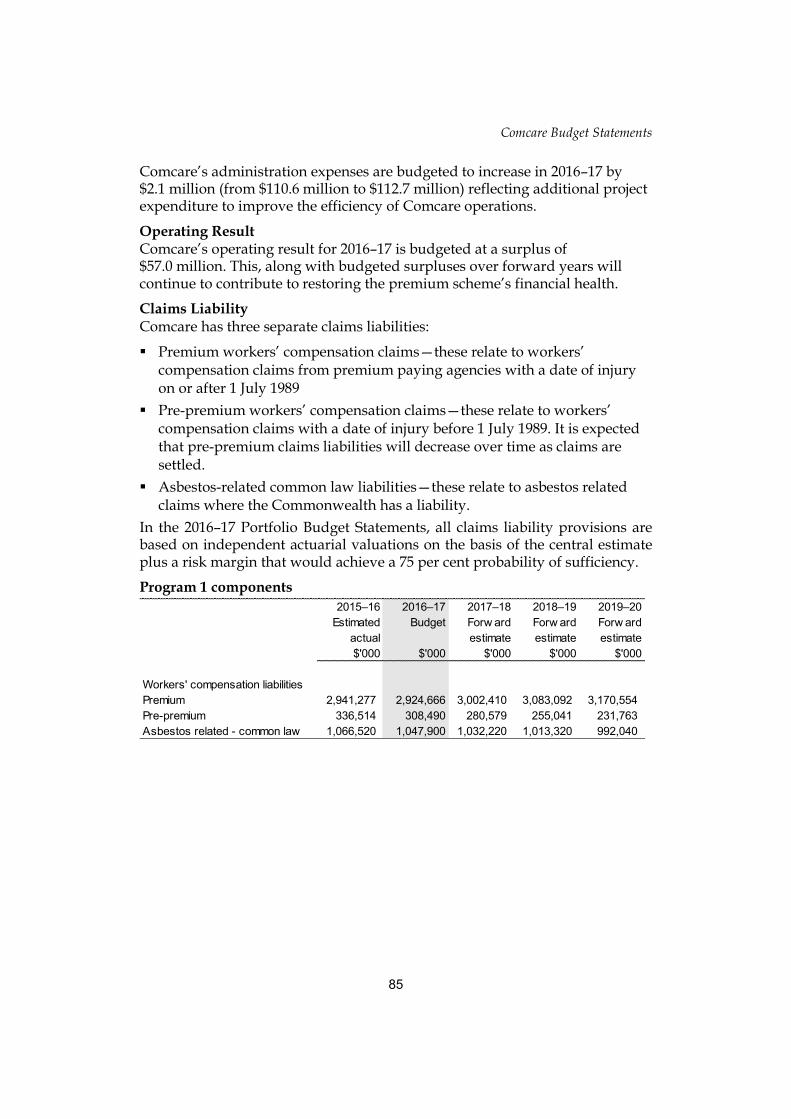
Comcare Budget Statements
85
Comcare’s administration expenses are budgeted to increase in 2016–17 by $2.1 million (from $110.6 million to $112.7 million) reflecting additional project expenditure to improve the efficiency of Comcare operations.
Operating Result Comcare’s operating result for 2016–17 is budgeted at a surplus of $57.0 million. This, along with budgeted surpluses over forward years will continue to contribute to restoring the premium scheme’s financial health.
Claims Liability Comcare has three separate claims liabilities:
Premium workers’ compensation claims—these relate to workers’ compensation claims from premium paying agencies with a date of injury on or after 1 July 1989
Pre-premium workers’ compensation claims—these relate to workers’ compensation claims with a date of injury before 1 July 1989. It is expected that pre-premium claims liabilities will decrease over time as claims are settled.
Asbestos-related common law liabilities—these relate to asbestos related claims where the Commonwealth has a liability.
In the 2016–17 Portfolio Budget Statements, all claims liability provisions are based on independent actuarial valuations on the basis of the central estimate plus a risk margin that would achieve a 75 per cent probability of sufficiency.
Program 1 components
2015–16
Estimated
actual
$'000
2016–17
Budget
$'000
2017–18
Forw ard
estimate
$'000
2018–19
Forw ard
estimate
$'000
2019–20
Forw ard
estimate
$'000
Workers' compensation liabilities
Premium 2,941,277 2,924,666 3,002,410 3,083,092 3,170,554
Pre-premium 336,514 308,490 280,579 255,041 231,763
Asbestos related - common law 1,066,520 1,047,900 1,032,220 1,013,320 992,040
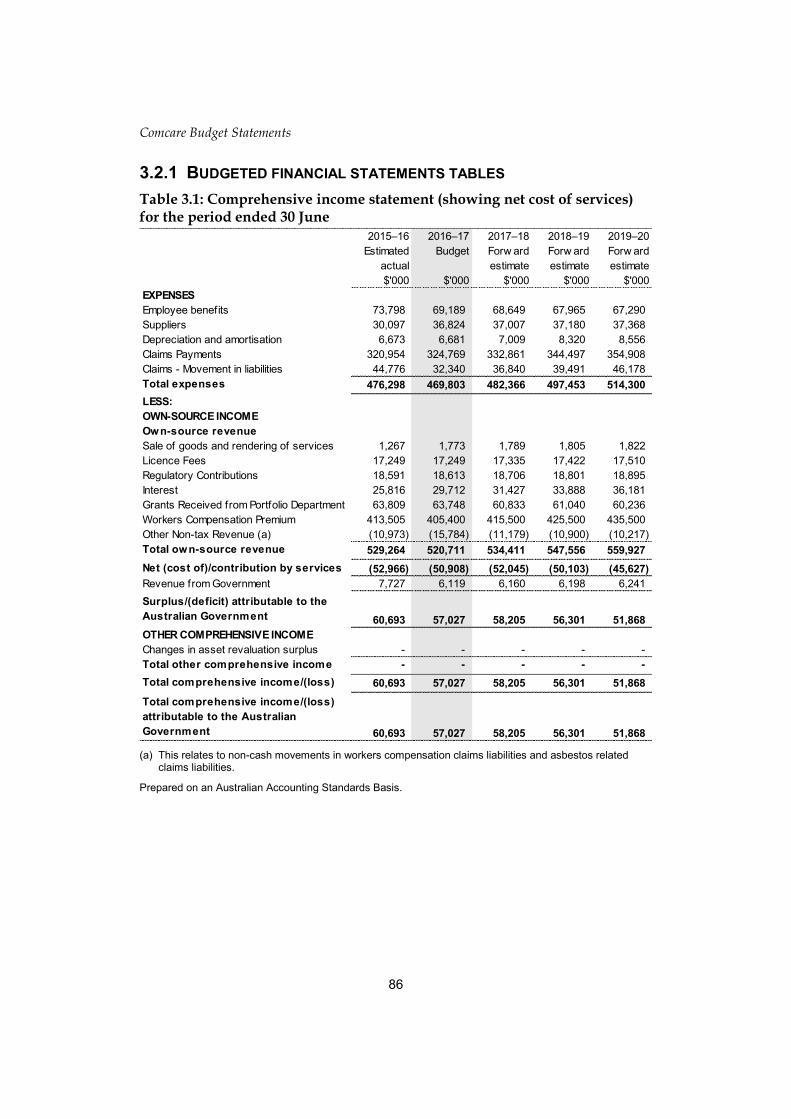
Comcare Budget Statements
86
3.2.1 BUDGETED FINANCIAL STATEMENTS TABLES
Table 3.1: Comprehensive income statement (showing net cost of services) for the period ended 30 June
(a) This relates to non-cash movements in workers compensation claims liabilities and asbestos related
claims liabilities.
Prepared on an Australian Accounting Standards Basis.
2015–16
Estimated
actual
$'000
2016–17
Budget
$'000
2017–18
Forw ard
estimate
$'000
2018–19
Forw ard
estimate
$'000
2019–20
Forw ard
estimate
$'000
EXPENSES
Employee benefits 73,798 69,189 68,649 67,965 67,290
Suppliers 30,097 36,824 37,007 37,180 37,368
Depreciation and amortisation 6,673 6,681 7,009 8,320 8,556
Claims Payments 320,954 324,769 332,861 344,497 354,908
Claims - Movement in liabilities 44,776 32,340 36,840 39,491 46,178
Total expenses 476,298 469,803 482,366 497,453 514,300
LESS:
OWN-SOURCE INCOME
Own-source revenue
Sale of goods and rendering of services 1,267 1,773 1,789 1,805 1,822
Licence Fees 17,249 17,249 17,335 17,422 17,510
Regulatory Contributions 18,591 18,613 18,706 18,801 18,895
Interest 25,816 29,712 31,427 33,888 36,181
Grants Received from Portfolio Department 63,809 63,748 60,833 61,040 60,236
Workers Compensation Premium 413,505 405,400 415,500 425,500 435,500
Other Non-tax Revenue (a) (10,973) (15,784) (11,179) (10,900) (10,217)
Total own-source revenue 529,264 520,711 534,411 547,556 559,927
Net (cost of)/contribution by services (52,966) (50,908) (52,045) (50,103) (45,627)
Revenue from Government 7,727 6,119 6,160 6,198 6,241
Surplus/(deficit) attributable to the
Australian Government 60,693 57,027 58,205 56,301 51,868
OTHER COMPREHENSIVE INCOME
Changes in asset revaluation surplus - - - - -
Total other comprehensive income - - - - -
Total comprehensive income/(loss) 60,693 57,027 58,205 56,301 51,868
Total comprehensive income/(loss)
attributable to the Australian
Government 60,693 57,027 58,205 56,301 51,868
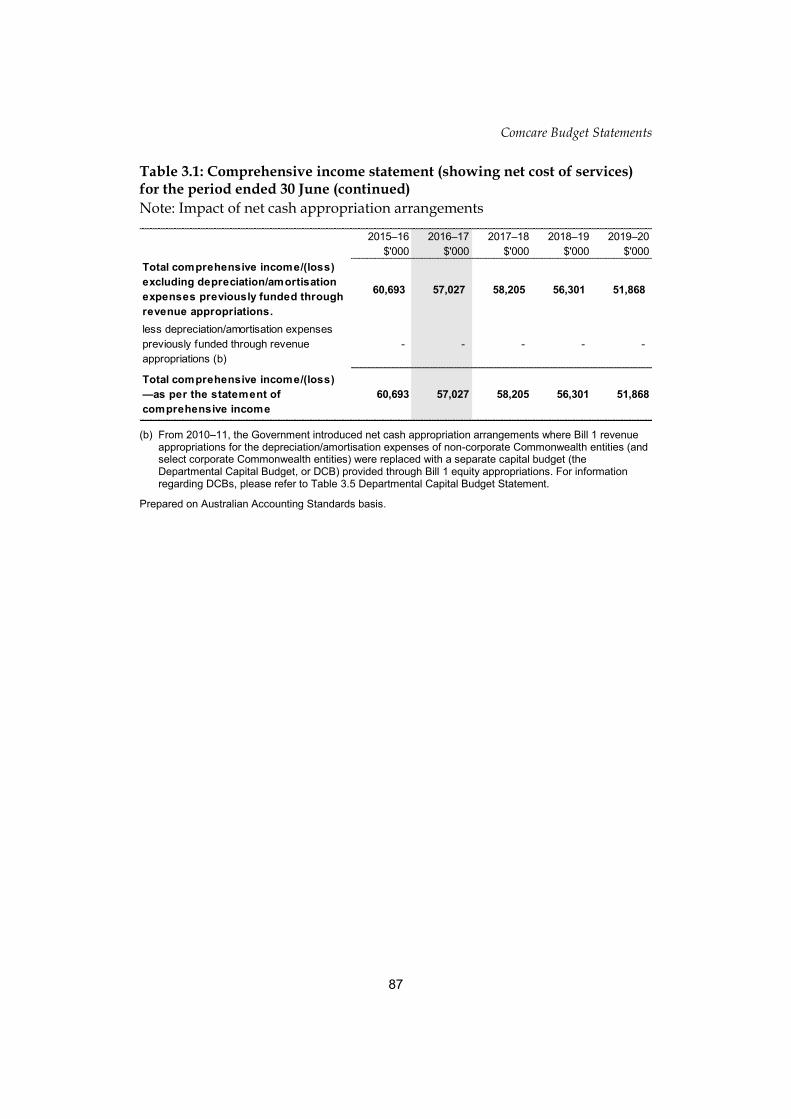
Comcare Budget Statements
87
Table 3.1: Comprehensive income statement (showing net cost of services) for the period ended 30 June (continued)
Note: Impact of net cash appropriation arrangements
(b) From 2010–11, the Government introduced net cash appropriation arrangements where Bill 1 revenue
appropriations for the depreciation/amortisation expenses of non-corporate Commonwealth entities (and select corporate Commonwealth entities) were replaced with a separate capital budget (the Departmental Capital Budget, or DCB) provided through Bill 1 equity appropriations. For information regarding DCBs, please refer to Table 3.5 Departmental Capital Budget Statement.
Prepared on Australian Accounting Standards basis.
2015–16
$'000
2016–17
$'000
2017–18
$'000
2018–19
$'000
2019–20
$'000
Total comprehensive income/(loss)
excluding depreciation/amortisation
expenses previously funded through
revenue appropriations.
60,693 57,027 58,205 56,301 51,868
less depreciation/amortisation expenses
previously funded through revenue
appropriations (b)
- - - - -
Total comprehensive income/(loss)
—as per the statement of
comprehensive income
60,693 57,027 58,205 56,301 51,868
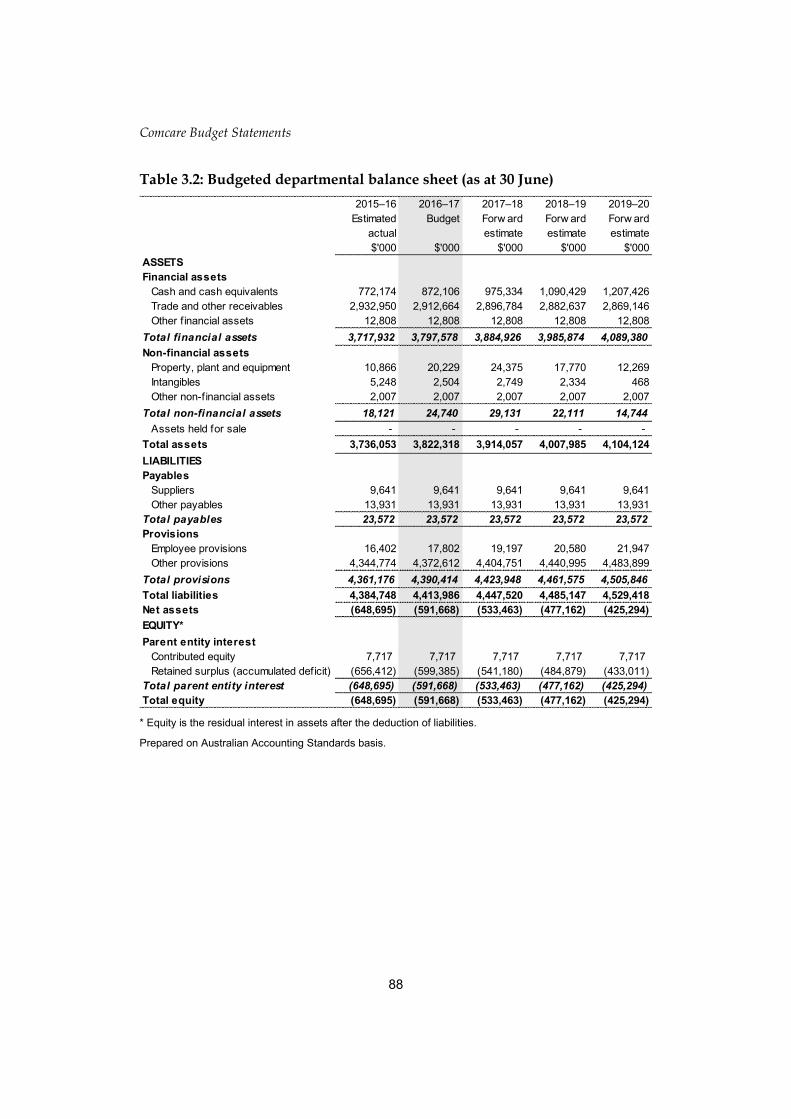
Comcare Budget Statements
88
Table 3.2: Budgeted departmental balance sheet (as at 30 June)
* Equity is the residual interest in assets after the deduction of liabilities.
Prepared on Australian Accounting Standards basis.
2015–16
Estimated
actual
$'000
2016–17
Budget
$'000
2017–18
Forw ard
estimate
$'000
2018–19
Forw ard
estimate
$'000
2019–20
Forw ard
estimate
$'000
ASSETS
Financial assets
Cash and cash equivalents 772,174 872,106 975,334 1,090,429 1,207,426
Trade and other receivables 2,932,950 2,912,664 2,896,784 2,882,637 2,869,146
Other f inancial assets 12,808 12,808 12,808 12,808 12,808
Total financial assets 3,717,932 3,797,578 3,884,926 3,985,874 4,089,380
Non-financial assets
Property, plant and equipment 10,866 20,229 24,375 17,770 12,269
Intangibles 5,248 2,504 2,749 2,334 468
Other non-financial assets 2,007 2,007 2,007 2,007 2,007
Total non-financial assets 18,121 24,740 29,131 22,111 14,744
Assets held for sale - - - - -
Total assets 3,736,053 3,822,318 3,914,057 4,007,985 4,104,124
LIABILITIES
Payables
Suppliers 9,641 9,641 9,641 9,641 9,641
Other payables 13,931 13,931 13,931 13,931 13,931
Total payables 23,572 23,572 23,572 23,572 23,572
Provisions
Employee provisions 16,402 17,802 19,197 20,580 21,947
Other provisions 4,344,774 4,372,612 4,404,751 4,440,995 4,483,899
Total provisions 4,361,176 4,390,414 4,423,948 4,461,575 4,505,846
Total liabilities 4,384,748 4,413,986 4,447,520 4,485,147 4,529,418
Net assets (648,695) (591,668) (533,463) (477,162) (425,294)
EQUITY*
Parent entity interest
Contributed equity 7,717 7,717 7,717 7,717 7,717
Retained surplus (accumulated deficit) (656,412) (599,385) (541,180) (484,879) (433,011)
Total parent entity interest (648,695) (591,668) (533,463) (477,162) (425,294)
Total equity (648,695) (591,668) (533,463) (477,162) (425,294)
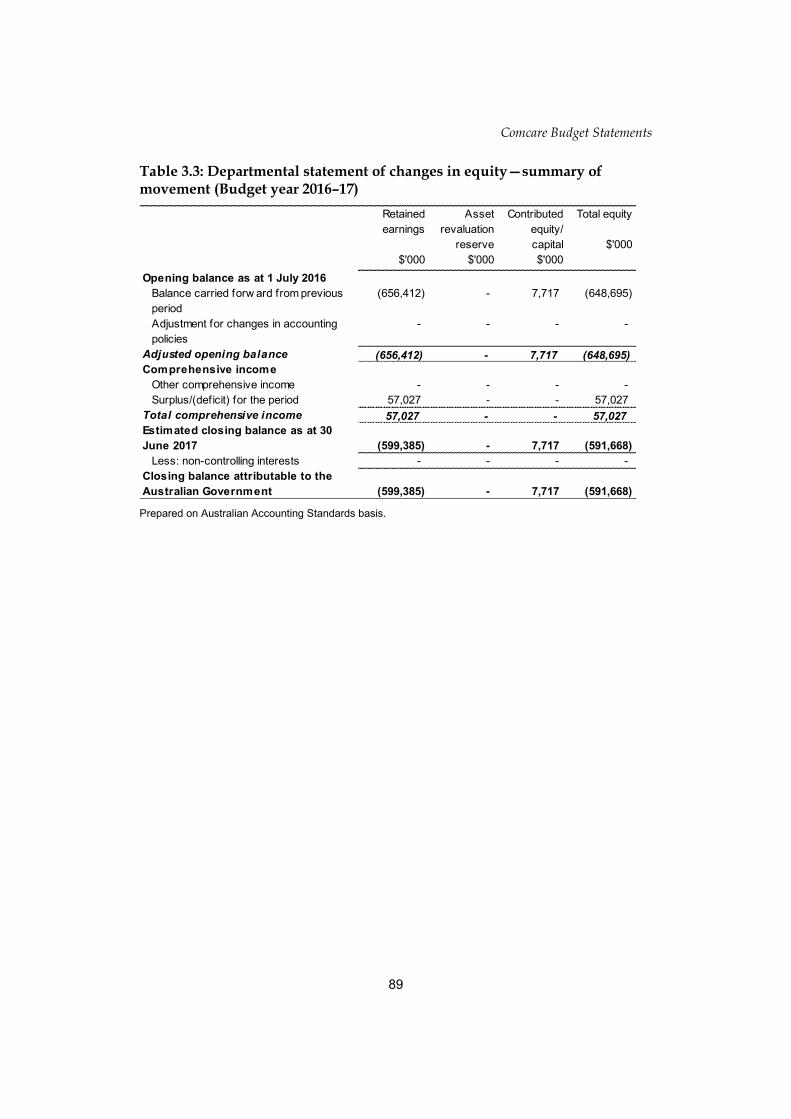
Comcare Budget Statements
89
Table 3.3: Departmental statement of changes in equity—summary of movement (Budget year 2016–17)
Prepared on Australian Accounting Standards basis.
Retained
earnings
$'000
Asset
revaluation
reserve
$'000
Contributed
equity/
capital
$'000
Total equity
$'000
Opening balance as at 1 July 2016
Balance carried forw ard from previous
period
(656,412) - 7,717 (648,695)
Adjustment for changes in accounting
policies
- - - -
Adjusted opening balance (656,412) - 7,717 (648,695)
Comprehensive income
Other comprehensive income - - - -
Surplus/(deficit) for the period 57,027 - - 57,027
Total comprehensive income 57,027 - - 57,027
Estimated closing balance as at 30
June 2017 (599,385) - 7,717 (591,668)
Less: non-controlling interests - - - -
Closing balance attributable to the
Australian Government (599,385) - 7,717 (591,668)
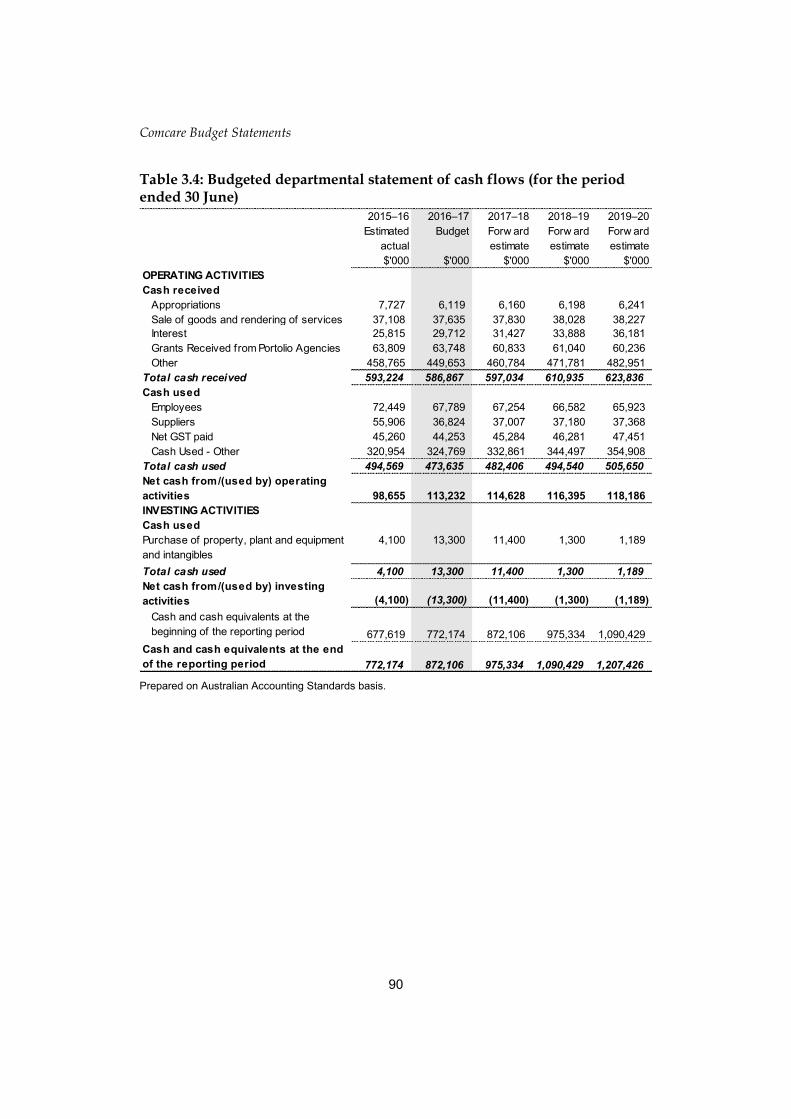
Comcare Budget Statements
90
Table 3.4: Budgeted departmental statement of cash flows (for the period ended 30 June)
Prepared on Australian Accounting Standards basis.
2015–16
Estimated
actual
$'000
2016–17
Budget
$'000
2017–18
Forw ard
estimate
$'000
2018–19
Forw ard
estimate
$'000
2019–20
Forw ard
estimate
$'000
OPERATING ACTIVITIES
Cash received
Appropriations 7,727 6,119 6,160 6,198 6,241
Sale of goods and rendering of services 37,108 37,635 37,830 38,028 38,227
Interest 25,815 29,712 31,427 33,888 36,181
Grants Received from Portolio Agencies 63,809 63,748 60,833 61,040 60,236
Other 458,765 449,653 460,784 471,781 482,951
Total cash received 593,224 586,867 597,034 610,935 623,836
Cash used
Employees 72,449 67,789 67,254 66,582 65,923
Suppliers 55,906 36,824 37,007 37,180 37,368
Net GST paid 45,260 44,253 45,284 46,281 47,451
Cash Used - Other 320,954 324,769 332,861 344,497 354,908
Total cash used 494,569 473,635 482,406 494,540 505,650
Net cash from/(used by) operating
activities 98,655 113,232 114,628 116,395 118,186
INVESTING ACTIVITIES
Cash used
Purchase of property, plant and equipment
and intangibles
4,100 13,300 11,400 1,300 1,189
Total cash used 4,100 13,300 11,400 1,300 1,189
Net cash from/(used by) investing
activities (4,100) (13,300) (11,400) (1,300) (1,189)
Cash and cash equivalents at the
beginning of the reporting period 677,619 772,174 872,106 975,334 1,090,429
Cash and cash equivalents at the end
of the reporting period 772,174 872,106 975,334 1,090,429 1,207,426
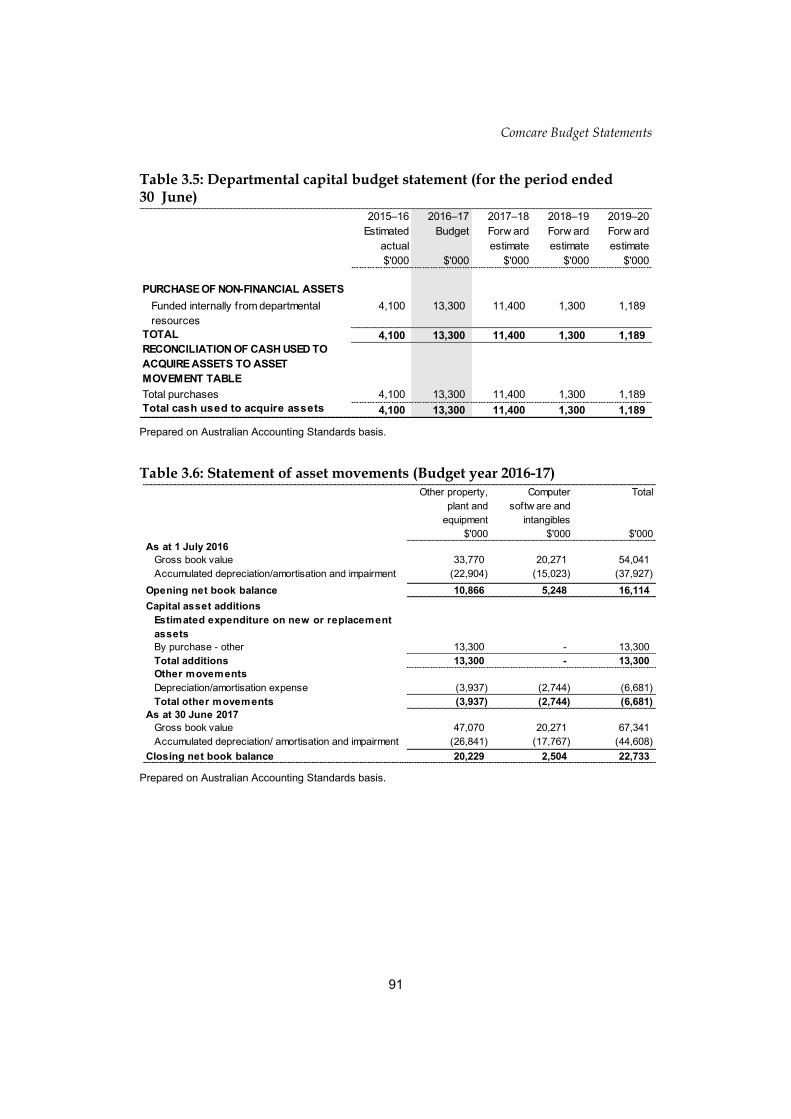
Comcare Budget Statements
91
Table 3.5: Departmental capital budget statement (for the period ended 30 June)
Prepared on Australian Accounting Standards basis.
Table 3.6: Statement of asset movements (Budget year 2016-17)
Prepared on Australian Accounting Standards basis.
2015–16
Estimated
actual
$'000
2016–17
Budget
$'000
2017–18
Forw ard
estimate
$'000
2018–19
Forw ard
estimate
$'000
2019–20
Forw ard
estimate
$'000
PURCHASE OF NON-FINANCIAL ASSETS
Funded internally from departmental
resources
4,100 13,300 11,400 1,300 1,189
TOTAL 4,100 13,300 11,400 1,300 1,189
RECONCILIATION OF CASH USED TO
ACQUIRE ASSETS TO ASSET
MOVEMENT TABLE
Total purchases 4,100 13,300 11,400 1,300 1,189
Total cash used to acquire assets 4,100 13,300 11,400 1,300 1,189
Other property,
plant and
equipment
$'000
Computer
softw are and
intangibles
$'000
Total
$'000
As at 1 July 2016
Gross book value 33,770 20,271 54,041
Accumulated depreciation/amortisation and impairment (22,904) (15,023) (37,927)
Opening net book balance 10,866 5,248 16,114
Capital asset additions
Estimated expenditure on new or replacement
assets
By purchase - other 13,300 - 13,300
Total additions 13,300 - 13,300
Other movements
Depreciation/amortisation expense (3,937) (2,744) (6,681)
Total other movements (3,937) (2,744) (6,681)
As at 30 June 2017
Gross book value 47,070 20,271 67,341
Accumulated depreciation/ amortisation and impairment (26,841) (17,767) (44,608)
Closing net book balance 20,229 2,504 22,733
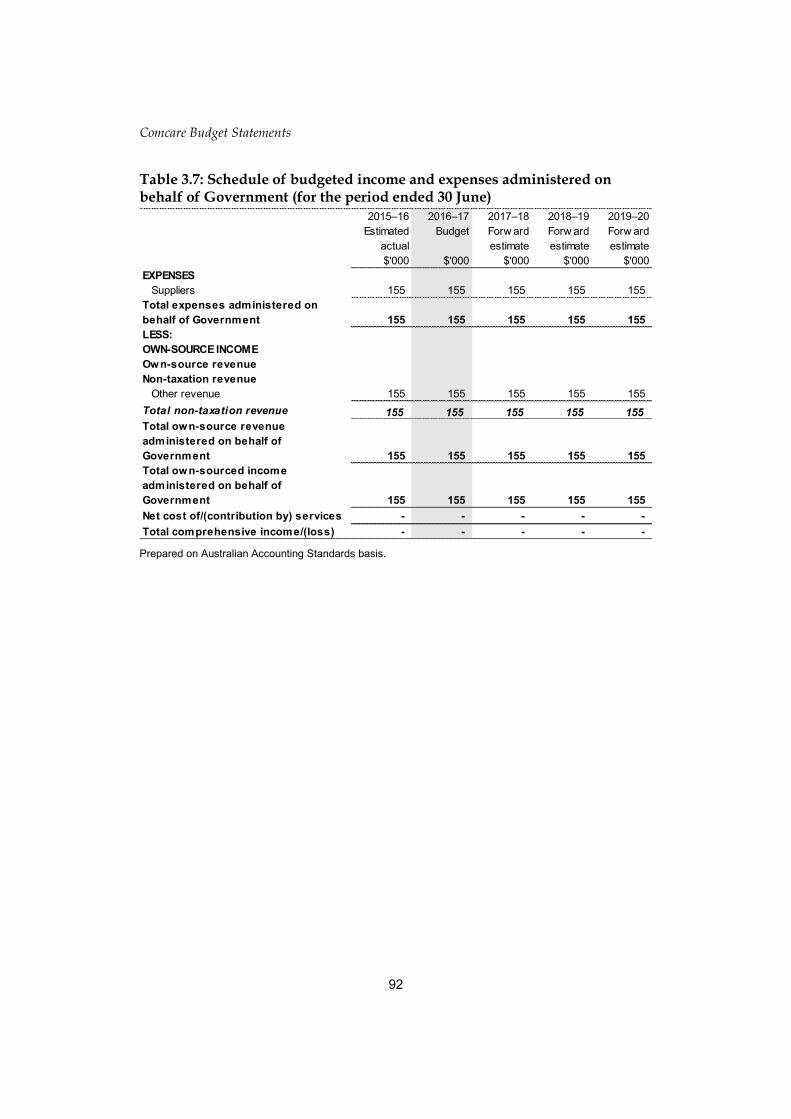
Comcare Budget Statements
92
Table 3.7: Schedule of budgeted income and expenses administered on behalf of Government (for the period ended 30 June)
Prepared on Australian Accounting Standards basis.
2015–16
Estimated
actual
$'000
2016–17
Budget
$'000
2017–18
Forw ard
estimate
$'000
2018–19
Forw ard
estimate
$'000
2019–20
Forw ard
estimate
$'000
EXPENSES
Suppliers 155 155 155 155 155
Total expenses administered on
behalf of Government 155 155 155 155 155
LESS:
OWN-SOURCE INCOME
Own-source revenue
Non-taxation revenue
Other revenue 155 155 155 155 155
Total non-taxation revenue 155 155 155 155 155
Total own-source revenue
administered on behalf of
Government 155 155 155 155 155
Total own-sourced income
administered on behalf of
Government 155 155 155 155 155
Net cost of/(contribution by) services - - - - -
Total comprehensive income/(loss) - - - - -

Comcare Budget Statements
93
Table 3.8: Schedule of budgeted assets and liabilities administered on behalf of Government (as at 30 June)
Prepared on Australian Accounting Standards basis.
Table 3.9: Schedule of budgeted administered cash flows (for the period ended 30 June)
Prepared on Australian Accounting Standards basis.
2015–16
Estimated
actual
$'000
2016–17
Budget
$'000
2017–18
Forw ard
estimate
$'000
2018–19
Forw ard
estimate
$'000
2019–20
Forw ard
estimate
$'000
ASSETS
Financial assets
Taxation receivables 9 9 9 9 9
Trade and other receivables 1,138 1,138 1,138 1,138 1,138
Total financial assets 1,147 1,147 1,147 1,147 1,147
Total assets administered on behalf
of Government 1,147 1,147 1,147 1,147 1,147
LIABILITIES
Payables
Other payables 14 14 14 14 14
Total payables 14 14 14 14 14
Total liabilities administered on behalf
of Government 14 14 14 14 14
Net assets/(liabilities) 1,133 1,133 1,133 1,133 1,133
2015–16
Estimated
actual
$'000
2016–17
Budget
$'000
2017–18
Forw ard
estimate
$'000
2018–19
Forw ard
estimate
$'000
2019–20
Forw ard
estimate
$'000
OPERATING ACTIVITIES
Cash received
Other 155 155 155 155 155
Total cash received 155 155 155 155 155
Cash used
Other 155 155 155 155 155
Total cash used 155 155 155 155 155
Net cash from/(used by) operating
activities - - - - -
Net increase/(decrease) in cash held - - - - -
Cash and cash equivalents at beginning
of reporting period - - - - -
Cash and cash equivalents at end of
reporting period - - - - -

Comcare Budget Statements
94
Table 3.10: Administered capital budget statement (for the period ended 30 June)
Comcare has no administrated capital purchases. For this reason Table 3.10 is not presented.
Table 3.11: Statement of administered asset movements (Budget year 2016-17)
Comcare has no administered non-financial assets. For this reason Table 3.11 is not presented.
3.3 NOTES TO THE FINANCIAL STATEMENTS
Accounting policy
The budgeted financial statements have been prepared in accordance with the requirements of the Public Governance, Performance and Accountability (Financial Reporting) Rule 2015, and the Commonwealth Entities Financial Statement Preparation Guide.
Entity items
Entity assets, liabilities, revenues and expenses are those items that are controlled by Comcare.
Administered assets, liabilities, revenues and expenses relate to the Seafarers Safety, Rehabilitation and Compensation Authority (Seafarers Authority) which collects levies under the Seafarers Rehabilitation and Compensation Levy Collection Act 1992. The Seafarers Authority is controlled by the Government and managed by Comcare.
Comprehensive Income Statement
Revenue from government
Comcare receives an annual appropriation for the management of asbestos related claims, the administration of the Seacare Authority and some of Comcare’s regulatory activities.
Own source revenue
Comcare receives the following own-source revenue:
workers’ compensation premiums
grants received from portfolio department
other non-tax revenue
licence fees
regulatory contributions
interest
sale of goods and rendering of services.
Comcare Budget Statements
95
Workers’ compensation premiums
The premium scheme covers employees of Commonwealth Government agencies and the ACT Government covered by the SRC Act for injuries and illnesses sustained on or after 1 July 1989. Premiums are determined to fully fund the expected scheme liabilities as advised by independent actuaries.
Premiums do not cover liabilities for injuries or illness sustained prior to 1 July 1989. These liabilities are funded by Parliamentary appropriation and are referred to as ‘pre-premium’ liabilities.
Grants received from portfolio department
Grants received from the portfolio department’ represent cash appropriation for the payment of pre-premium claims and administration costs, and asbestos claims costs.
Other non-tax revenue
‘Other non-tax revenue’ is a non-cash appropriation representing:
the notional interest on retained premium funds held with the Australian Government; and
the movement in claims liabilities payable in future years based on independent actuarial assessment.
Administration expenses
Comcare administration expenses include:
employee expenses—includes salaries, superannuation and the net increase in employee entitlements;
suppliers—includes goods and services procured from suppliers;
depreciation and amortisation—property, plant and equipment and intangible assets are depreciated over their useful lives. Leasehold improvements are amortised over the lesser of the estimated useful life of the improvement or the unexpired period of the lease. In all cases, assets are depreciated using the straight line method.
Claims expenses
Comcare recognises two types of claims expenses:
Claims payments—includes workers’ compensation claims payments (premium and pre-premium) and common law settlements for asbestos-related compensation cases.
Movement in liabilities—net movements in outstanding workers’ compensation claims liabilities are recognised as expenses.
Comcare Budget Statements
96
Departmental Balance Sheet
Cash and cash equivalents
Cash and cash equivalents include deposits at call and term deposits with a bank or financial institution.
Trade and other receivables
Other receivables are the combined value of:
pre-premium and asbestos special appropriation receivable
premiums collected by Comcare prior to 1 July 2002 held by the Australian Government plus earned notional interest, in accordance with Section 90C of the SRC Act.
Employee provisions
The provision for employee entitlements encompasses unpaid annual and long service leave. No provision is made for sick leave.
Other provisions
Provision is made for:
outstanding workers’ compensation claims liabilities
asbestos-related common law liabilities.
These estimates have been prepared by independent actuaries. They are based on analysis of the historical development of the relevant claims experience, with allowances for future claim escalation and administration expenses, and are discounted to a present value to allow for the time value of money.
The estimates of outstanding liabilities have been based on independent actuarial valuations on the basis of the central estimate plus the risk margin that would achieve a 75 per cent probability of sufficiency.

Fair Work Commission
Entity resources and planned performance

FWC Budget Statements
99
FAIR WORK COMMISSION
Section 1: Entity overview and resources .............................................................. 101
1.1 Strategic direction statement ........................................................................ 101
1.2 Entity resource statement ............................................................................. 102
1.3 Budget measures .......................................................................................... 104
Section 2: Outcomes and planned performance ................................................... 105
2.1 Budgeted expenses and performance for Outcome 1 .................................. 105
Section 3: Budgeted financial statements .............................................................. 109
3.1 Budgeted financial statements...................................................................... 109
3.2.1 Budgeted financial statements tables ........................................................... 110

FWC Budget Statements
101
FAIR WORK COMMISSION
Section 1: Entity overview and resources
1.1 STRATEGIC DIRECTION STATEMENT
The Fair Work Commission was established by the Fair Work Act 2009 (FW Act). The Commission is the independent national workplace relations tribunal responsible for administering provisions of the FW Act. The Commission also has responsibilities in relation to the registration, recognition and accountability of unions and employer organisations under the Fair Work (Registered Organisations) Act 2009.
The Fair Work Commission consists of a President, Vice Presidents, Deputy Presidents, Commissioners and Expert Panel Members. The Fair Work Commission also has a General Manager and administrative staff.
The Fair Work Commission has the power to make and vary awards, make minimum wage orders, approve agreements, resolve workplace and other disputes, determine unfair dismissal claims, deal with applications for orders to stop or prevent workplace bullying and make orders in relation to matters such as good faith bargaining and industrial action.
The Fair Work Commission is implementing initiatives aimed at further improving fairness and access to justice; accountability; innovation and efficiency; and productivity and engagement with industry. These initiatives are set out in the publication Future Directions II, which is available on the Commission’s website (www.fwc.gov.au).

FWC Budget Statements
102
1.2 ENTITY RESOURCE STATEMENT
Table 1.1 shows the total funding from all sources available to the entity for its operations and to deliver programs and services on behalf of the government.
The table summarises how resources will be applied by outcome (government strategic policy objectives) and by administered (on behalf of the government or the public) and departmental (for the entity’s operations) classification.
For more detailed information please refer to Budget Paper No. 4—Agency Resourcing.
Information in this table is presented on a resourcing (i.e. appropriations/cash available) basis, whilst the ‘Budgeted expenses by Outcome 1’ tables in Section 2 and the financial statements in Section 3 are presented on an accrual basis.

FWC Budget Statements
103
Table 1.1: Fair Work Commission resource statement—Budget estimates for 2016–17 as at Budget May 2016
Prepared on a resourcing (i.e. appropriations available) basis. Please note: All figures shown above are GST exclusive – these may not match figures in the cash flow statement.
(a) Appropriation Bill (No.1) 2016–17. (b) Estimated adjusted balance carried forward from previous year. (c) Estimated Retained revenue receipts under section 74 of the Public Governance, Performance and
Accountability Act 2013. (d) Departmental capital budgets are not separately identified in Appropriation Bill (No.1) and form part of
ordinary annual services items. Please refer to Table 3.5 for further details. For accounting purposes, this amount has been designated as a 'contribution by owner’.
(e) Appropriation Bill (No.2) 2016–17. (f) Repayments not provided for under other appropriations. Amounts received on or before 30 June 2015
were repaid under section 28 of the Financial Management and Accountability Act 1997.
2015–16
Estimated
actual
$'000
2016–17
Estimate
$'000
Departmental
Annual appropriations - ordinary annual services (a)
Prior year appropriations available (b) 39,708 30,789
Departmental appropriation 79,550 76,070
s 74 retained revenue receipts (c) 2,429 2,429
Departmental capital budget (d) 2,418 2,409
Annual appropriations - other services - non-operating (e)
Equity injection - 150
Total departmental annual appropriations 124,105 111,847
Total departmental resourcing 124,105 111,847
Total administered special appropriations (f) 500 500
Total administered resourcing 500 500
Total resourcing for Fair Work Commission 124,605 112,347
2015–16 2016–17
Average staffing level (number) 344 326

FWC Budget Statements
104
1.3 BUDGET MEASURES
Budget measures in Part 1 relating to the Fair Work Commission are detailed in Budget Paper No. 2 and are summarised below.
Table 1.2: Entity 2016–17 Budget measures
Part 1: Measures announced since the 2015–16 Mid-Year Economic and Fiscal Outlook (MYEFO)
Prepared on a Government Finance Statistics (fiscal) basis. Figures displayed as a negative (-) represent a decrease in funds and a positive (+) represent an increase in funds.
Part 2: Other measures not previously reported in a portfolio statement
(a) This measure was first published in the 2015–16 Budget.
Prepared on a Government Finance Statistics (fiscal) basis. Figures displayed as a negative (-) represent a decrease in funds and a positive (+) represent an increase in funds.
Program
2015–16
$'000
2016–17
$'000
2017–18
$'000
2018–19
$'000
2019–20
$'000
Expense measures
Road Safety Remuneration Tribunal -
abolition
1.1
Administered expenses - - - - -
Departmental expenses - (2,445) (2,467) (2,488) (2,510)
Total - (2,445) (2,467) (2,488) (2,510)
Total expense measures
Administered - - - - -
Departmental - (2,445) (2,467) (2,488) (2,510)
Total - (2,445) (2,467) (2,488) (2,510)
Program
2015–16
$'000
2016–17
$'000
2017–18
$'000
2018–19
$'000
2019–20
$'000
Measures
Public Sector Savings - Enterprise
Resource Planning Systems (a)
1.1
Administered expenses - - - - -
Departmental expenses - - (57) (70) (70)
Total - - (57) (70) (70)
Total measures
Administered - - - - -
Departmental - - (57) (70) (70)
Total - - (57) (70) (70)
FWC Budget Statements
105
Section 2: Outcomes and planned performance
Government outcomes are the intended results, impacts or consequences of actions by the Government on the Australian community. Commonwealth programs are the primary vehicle by which government entities achieve the intended results of their outcome statements. Entities are required to identify the programs which contribute to government outcomes over the Budget and forward years.
Each outcome is described below together with its related programs. The following provides detailed information on expenses for each outcome and program, further broken down by funding source.
Note:
From 1 July 2015, performance reporting requirements in the Portfolio Budget Statements sit alongside those required under the enhanced commonwealth performance framework. It is anticipated that the performance criteria described in Portfolio Budget Statements will be read with broader information provided in an entity’s corporate plans and annual performance statements—included in Annual Reports from October 2016—to provide an entity’s complete performance story.
2.1 BUDGETED EXPENSES AND PERFORMANCE FOR OUTCOME 1
Outcome 1: Simple, fair and flexible workplace relations for employees and employers through the exercise of powers to set and vary minimum wages and modern awards, facilitate collective bargaining, approve agreements and deal with disputes.
Budgeted expenses for Outcome 1
This table shows how much the entity intends to spend (on an accrual basis) on achieving the outcome, broken down by program, as well as by Administered and Departmental funding sources.

FWC Budget Statements
106
Table 2.1.1: Budgeted expenses for Outcome 1
(a) Repayments not provided for under other appropriations. Amounts received on or before 30 June 2015
were repaid under section 28 of the Financial Management and Accountability Act 1997. (b) Estimated expenses incurred in relation to receipts retained under section 74 of the Public Governance,
Performance and Accountability Act 2013. (c) Expenses not requiring appropriation in the Budget year are made up of depreciation expenses,
amortisation expenses, and audit fees.
Note: Departmental appropriation splits and totals are indicative estimates and may change in the course of the budget year as government priorities change.
2015–16
Estimated
actual
$'000
2016–17
Budget
$'000
2017–18
Forw ard
estimate
$'000
2018–19
Forw ard
estimate
$'000
2019–20
Forw ard
estimate
$'000
Departmental expenses
Departmental appropriation 79,550 76,070 77,154 78,602 81,132
s 74 Retained revenue receipts (b) 2,429 2,429 2,100 1,800 1,800
Expenses not requiring appropriation in
the Budget year (c)
4,583 2,927 2,927 2,927 2,891
Departmental total 86,562 81,426 82,181 83,329 85,823
Total expenses for Program 1.1 86,562 81,426 82,181 83,329 85,823
Departmental expenses
Departmental appropriation 79,550 76,070 77,154 78,602 81,132
s 74 Retained revenue receipts (b) 2,429 2,429 2,100 1,800 1,800
Expenses not requiring appropriation in
the Budget year (c)
4,583 2,927 2,927 2,927 2,891
Departmental total 86,562 81,426 82,181 83,329 85,823
Total expenses for Outcome 1 86,562 81,426 82,181 83,329 85,823
2015–16 2016–17
Average staffing level (number) 344 326
Program 1.1: Dispute resolution, minimum wage setting, orders and approvals of
agreeements
Outcome 1 Totals by appropriation type
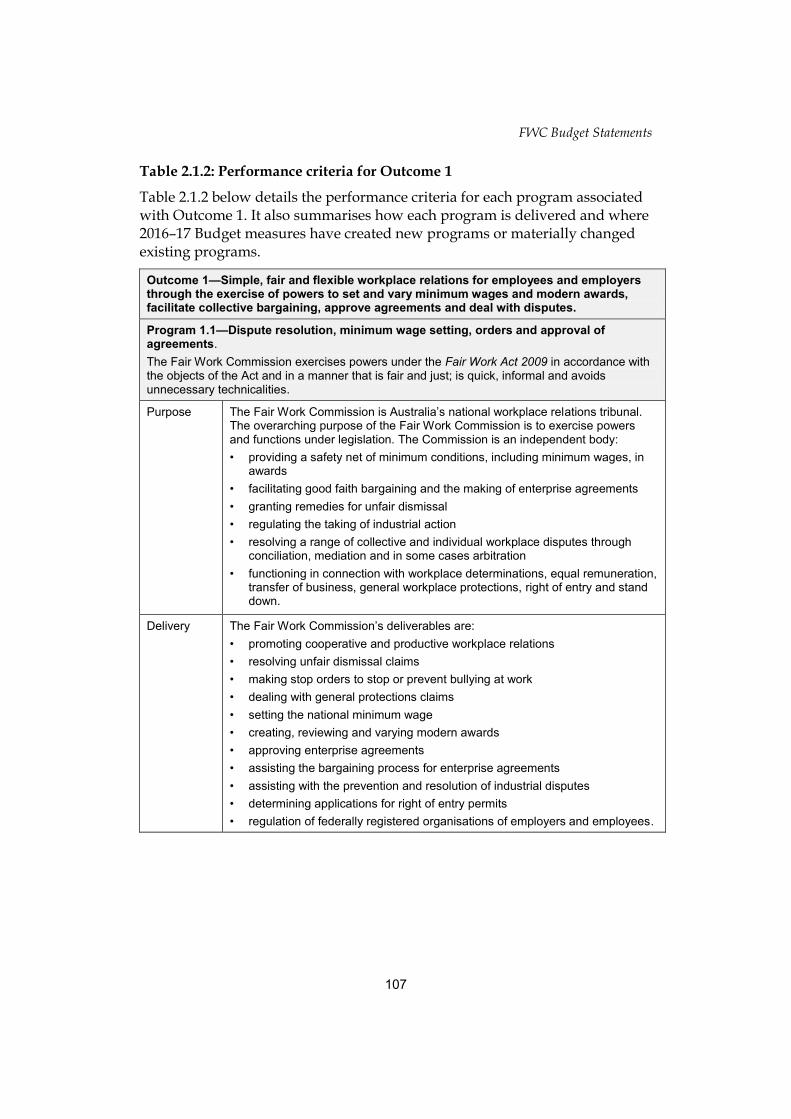
FWC Budget Statements
107
Table 2.1.2: Performance criteria for Outcome 1
Table 2.1.2 below details the performance criteria for each program associated with Outcome 1. It also summarises how each program is delivered and where 2016–17 Budget measures have created new programs or materially changed existing programs.
Outcome 1—Simple, fair and flexible workplace relations for employees and employers through the exercise of powers to set and vary minimum wages and modern awards, facilitate collective bargaining, approve agreements and deal with disputes.
Program 1.1—Dispute resolution, minimum wage setting, orders and approval of agreements.
The Fair Work Commission exercises powers under the Fair Work Act 2009 in accordance with the objects of the Act and in a manner that is fair and just; is quick, informal and avoids unnecessary technicalities.
Purpose The Fair Work Commission is Australia’s national workplace relations tribunal. The overarching purpose of the Fair Work Commission is to exercise powers and functions under legislation. The Commission is an independent body:
• providing a safety net of minimum conditions, including minimum wages, in awards
• facilitating good faith bargaining and the making of enterprise agreements
• granting remedies for unfair dismissal
• regulating the taking of industrial action
• resolving a range of collective and individual workplace disputes through conciliation, mediation and in some cases arbitration
• functioning in connection with workplace determinations, equal remuneration, transfer of business, general workplace protections, right of entry and stand down.
Delivery The Fair Work Commission’s deliverables are:
• promoting cooperative and productive workplace relations
• resolving unfair dismissal claims
• making stop orders to stop or prevent bullying at work
• dealing with general protections claims
• setting the national minimum wage
• creating, reviewing and varying modern awards
• approving enterprise agreements
• assisting the bargaining process for enterprise agreements
• assisting with the prevention and resolution of industrial disputes
• determining applications for right of entry permits
• regulation of federally registered organisations of employers and employees.
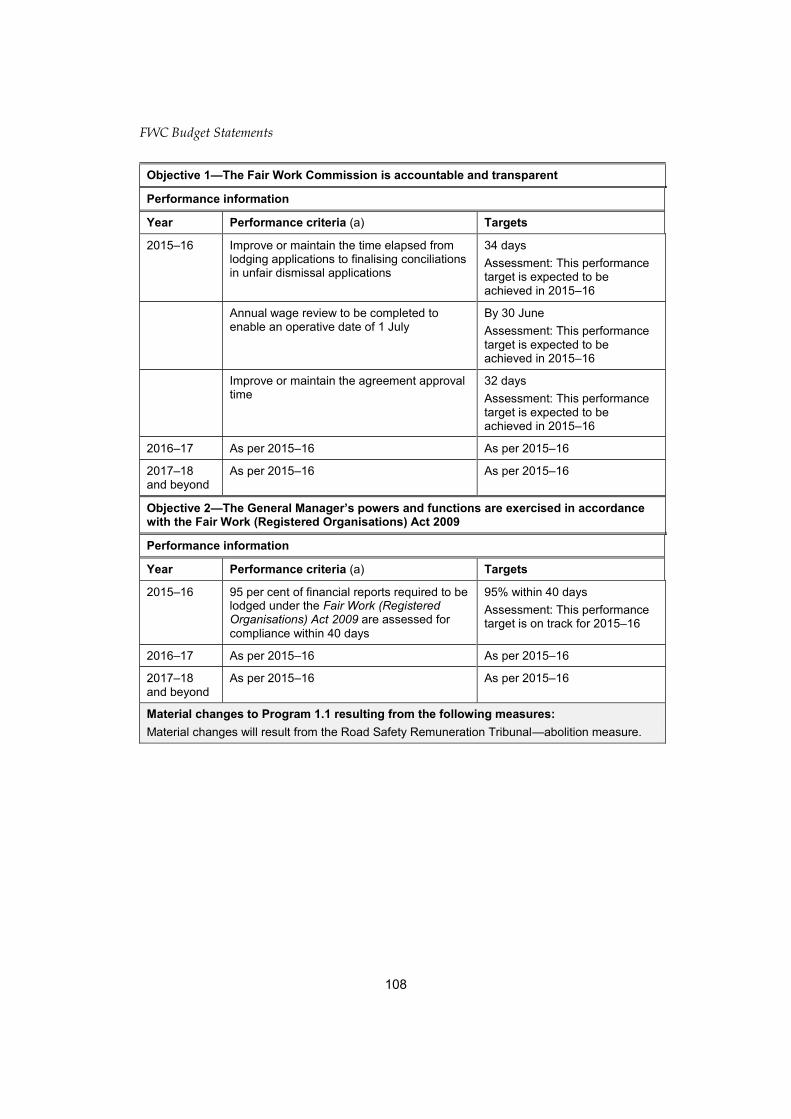
FWC Budget Statements
108
Objective 1—The Fair Work Commission is accountable and transparent
Performance information
Year Performance criteria (a) Targets
2015–16 Improve or maintain the time elapsed from lodging applications to finalising conciliations in unfair dismissal applications
34 days
Assessment: This performance target is expected to be achieved in 2015–16
Annual wage review to be completed to enable an operative date of 1 July
By 30 June
Assessment: This performance target is expected to be achieved in 2015–16
Improve or maintain the agreement approval time
32 days
Assessment: This performance target is expected to be achieved in 2015–16
2016–17 As per 2015–16 As per 2015–16
2017–18 and beyond
As per 2015–16 As per 2015–16
Objective 2—The General Manager’s powers and functions are exercised in accordance with the Fair Work (Registered Organisations) Act 2009
Performance information
Year Performance criteria (a) Targets
2015–16 95 per cent of financial reports required to be lodged under the Fair Work (Registered Organisations) Act 2009 are assessed for
compliance within 40 days
95% within 40 days
Assessment: This performance target is on track for 2015–16
2016–17 As per 2015–16 As per 2015–16
2017–18 and beyond
As per 2015–16 As per 2015–16
Material changes to Program 1.1 resulting from the following measures:
Material changes will result from the Road Safety Remuneration Tribunal—abolition measure.
FWC Budget Statements
109
Section 3: Budgeted financial statements
Section 3 presents budgeted financial statements which provide a comprehensive snapshot of entity finances for the 2016–17 budget year, including the impact of budget measures and resourcing on financial statements.
3.1 BUDGETED FINANCIAL STATEMENTS
3.1.1 Differences between entity resourcing and financial statements
The Fair Work Commission has nil differences to report.
3.1.2 Explanatory notes and analysis of budgeted financial statements
Departmental financial statements
The Fair Work Commission is budgeting for an operating deficit equal to the unappropriated depreciation and amortisation expense in 2016–17. Total revenues are estimated to be $78.5 million and total expenses $81.4 million.
Total assets at the end of the 2016–17 financial year are estimated to be $69.4 million. The majority of the assets represent receivables (appropriations receivable) and office fit outs. The Fair Work Commission is planning asset acquisition in the 2016–17 year primarily relating to information technology equipment, software and minor office accommodation costs.
Total liabilities for 2016–17 are estimated at $28.9 million. The largest liability item are accrued employee entitlements.
Administered financial statements
Administered revenues in 2016–17 for the refund of application fees are estimated to be $0.5 million, consistent with the 2015–16 estimated actual.
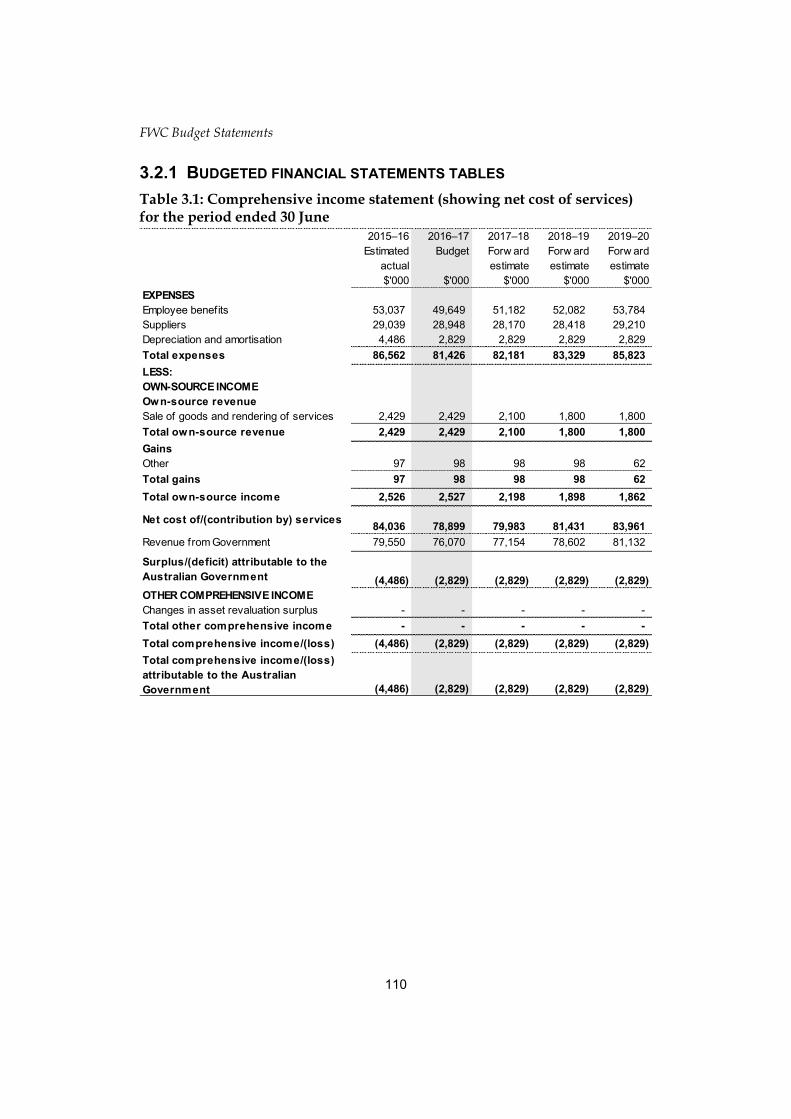
FWC Budget Statements
110
3.2.1 BUDGETED FINANCIAL STATEMENTS TABLES
Table 3.1: Comprehensive income statement (showing net cost of services) for the period ended 30 June
2015–16
Estimated
actual
$'000
2016–17
Budget
$'000
2017–18
Forw ard
estimate
$'000
2018–19
Forw ard
estimate
$'000
2019–20
Forw ard
estimate
$'000
EXPENSES
Employee benefits 53,037 49,649 51,182 52,082 53,784
Suppliers 29,039 28,948 28,170 28,418 29,210
Depreciation and amortisation 4,486 2,829 2,829 2,829 2,829
Total expenses 86,562 81,426 82,181 83,329 85,823
LESS:
OWN-SOURCE INCOME
Own-source revenue
Sale of goods and rendering of services 2,429 2,429 2,100 1,800 1,800
Total own-source revenue 2,429 2,429 2,100 1,800 1,800
Gains
Other 97 98 98 98 62
Total gains 97 98 98 98 62
Total own-source income 2,526 2,527 2,198 1,898 1,862
Net cost of/(contribution by) services84,036 78,899 79,983 81,431 83,961
Revenue from Government 79,550 76,070 77,154 78,602 81,132
Surplus/(deficit) attributable to the
Australian Government (4,486) (2,829) (2,829) (2,829) (2,829)
OTHER COMPREHENSIVE INCOME
Changes in asset revaluation surplus - - - - -
Total other comprehensive income - - - - -
Total comprehensive income/(loss) (4,486) (2,829) (2,829) (2,829) (2,829)
Total comprehensive income/(loss)
attributable to the Australian
Government (4,486) (2,829) (2,829) (2,829) (2,829)

FWC Budget Statements
111
Table 3.1: Comprehensive income statement (showing net cost of services) for the period ended 30 June (continued)
Note: Impact of net cash appropriation arrangements
(a) From 2010–11, the Government introduced net cash appropriation arrangements where Bill 1 revenue
appropriations for the depreciation/amortisation expenses of non-corporate Commonwealth entities (and select corporate Commonwealth entities) were replaced with a separate capital budget (the Departmental Capital Budget, or DCB) provided through Bill 1 equity appropriations. For information regarding DCBs, please refer to Table 3.5 Departmental Capital Budget Statement.
Prepared on Australian Accounting Standards basis.
2015–16
$'000
2016–17
$'000
2017–18
$'000
2018–19
$'000
2019–20
$'000
Total comprehensive income/(loss)
excluding depreciation/amortisation
expenses previously funded through
revenue appropriations.
(4,486) (2,829) (2,829) (2,829) (2,829)
less depreciation/amortisation expenses
previously funded through revenue
appropriations (a)
- - - - -
Total comprehensive income/(loss)
—as per the statement of
comprehensive income
(4,486) (2,829) (2,829) (2,829) (2,829)

FWC Budget Statements
112
Table 3.2: Budgeted departmental balance sheet (as at 30 June)
* Equity is the residual interest in assets after deduction of liabilities.
Prepared on Australian Accounting Standards basis.
2015–16
Estimated
actual
$'000
2016–17
Budget
$'000
2017–18
Forw ard
estimate
$'000
2018–19
Forw ard
estimate
$'000
2019–20
Forw ard
estimate
$'000
ASSETS
Financial assets
Cash and cash equivalents 593 593 593 593 593
Trade and other receivables 41,151 40,151 40,151 40,151 40,151
Total financial assets 41,744 40,744 40,744 40,744 40,744
Non-financial assets
Land and buildings 17,141 16,177 15,708 15,332 15,097
Property, plant and equipment 4,673 3,673 2,850 1,856 292
Intangibles 1,262 3,956 4,850 5,844 7,288
Other non-financial assets 4,891 4,891 4,891 4,891 4,891
Total non-financial assets 27,967 28,697 28,299 27,923 27,568
Assets held for sale - - - - -
Total assets 69,711 69,441 69,043 68,667 68,312
LIABILITIES
Payables
Suppliers 951 951 951 951 951
Other payables 7,448 7,448 7,448 7,448 7,448
Total payables 8,399 8,399 8,399 8,399 8,399
Provisions
Employee provisions 20,448 20,448 20,448 20,448 20,448
Other provisions 93 93 93 93 93
Total provisions 20,541 20,541 20,541 20,541 20,541
Total liabilities 28,940 28,940 28,940 28,940 28,940
Net assets 40,771 40,501 40,103 39,727 39,372
EQUITY*
Parent entity interest
Contributed equity 46,205 48,764 51,195 53,648 56,122
Reserves 262 262 262 262 262
Retained surplus (accumulated deficit) (5,696) (8,525) (11,354) (14,183) (17,012)
Total parent entity interest 40,771 40,501 40,103 39,727 39,372
Total equity 40,771 40,501 40,103 39,727 39,372

FWC Budget Statements
113
Table 3.3: Departmental statement of changes in equity—summary of movement (Budget year 2016–17)
Prepared on Australian Accounting Standards basis.
Retained
earnings
$'000
Asset
revaluation
reserve
$'000
Contributed
equity/
capital
$'000
Total equity
$'000
Opening balance as at 1 July 2016
Balance carried forw ard from previous period (5,696) 262 46,205 40,771
Adjusted opening balance (5,696) 262 46,205 40,771
Comprehensive income
Surplus/(deficit) for the period (2,829) - - (2,829)
Total comprehensive income (2,829) - - (2,829)
of w hich:
Attributable to the Australian Government (2,829) - - (2,829)
Transactions with owners
Contributions by owners
Equity injection - - 150 150
Departmental Capital Budget (DCB) - - 2,409 2,409
Sub-total transactions with owners - - 2,559 2,559
Transfers betw een equity components - - - -
Estimated closing balance as at 30 June 2017 (8,525) 262 48,764 40,501
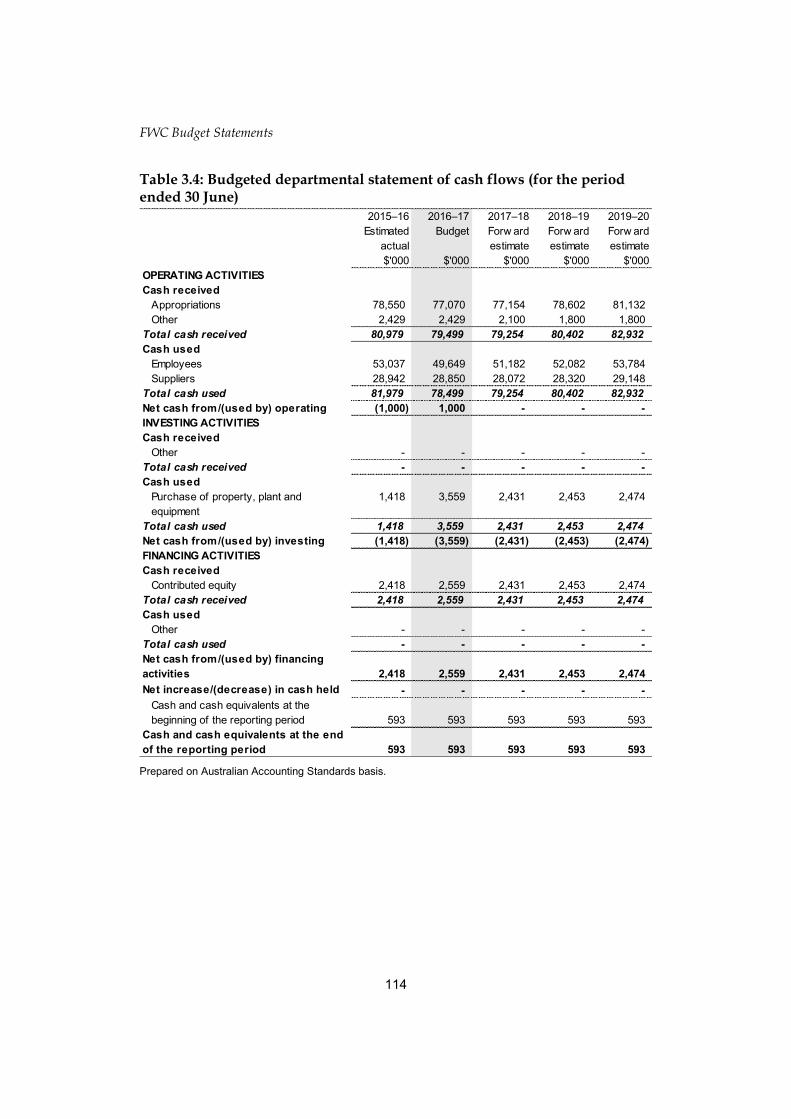
FWC Budget Statements
114
Table 3.4: Budgeted departmental statement of cash flows (for the period ended 30 June)
Prepared on Australian Accounting Standards basis.
2015–16
Estimated
actual
$'000
2016–17
Budget
$'000
2017–18
Forw ard
estimate
$'000
2018–19
Forw ard
estimate
$'000
2019–20
Forw ard
estimate
$'000
OPERATING ACTIVITIES
Cash received
Appropriations 78,550 77,070 77,154 78,602 81,132
Other 2,429 2,429 2,100 1,800 1,800
Total cash received 80,979 79,499 79,254 80,402 82,932
Cash used
Employees 53,037 49,649 51,182 52,082 53,784
Suppliers 28,942 28,850 28,072 28,320 29,148
Total cash used 81,979 78,499 79,254 80,402 82,932
Net cash from/(used by) operating (1,000) 1,000 - - -
INVESTING ACTIVITIES
Cash received
Other - - - - -
Total cash received - - - - -
Cash used
Purchase of property, plant and
equipment
1,418 3,559 2,431 2,453 2,474
Total cash used 1,418 3,559 2,431 2,453 2,474
Net cash from/(used by) investing (1,418) (3,559) (2,431) (2,453) (2,474)
FINANCING ACTIVITIES
Cash received
Contributed equity 2,418 2,559 2,431 2,453 2,474
Total cash received 2,418 2,559 2,431 2,453 2,474
Cash used
Other - - - - -
Total cash used - - - - -
Net cash from/(used by) financing
activities 2,418 2,559 2,431 2,453 2,474
Net increase/(decrease) in cash held - - - - -
Cash and cash equivalents at the
beginning of the reporting period 593 593 593 593 593
Cash and cash equivalents at the end
of the reporting period 593 593 593 593 593
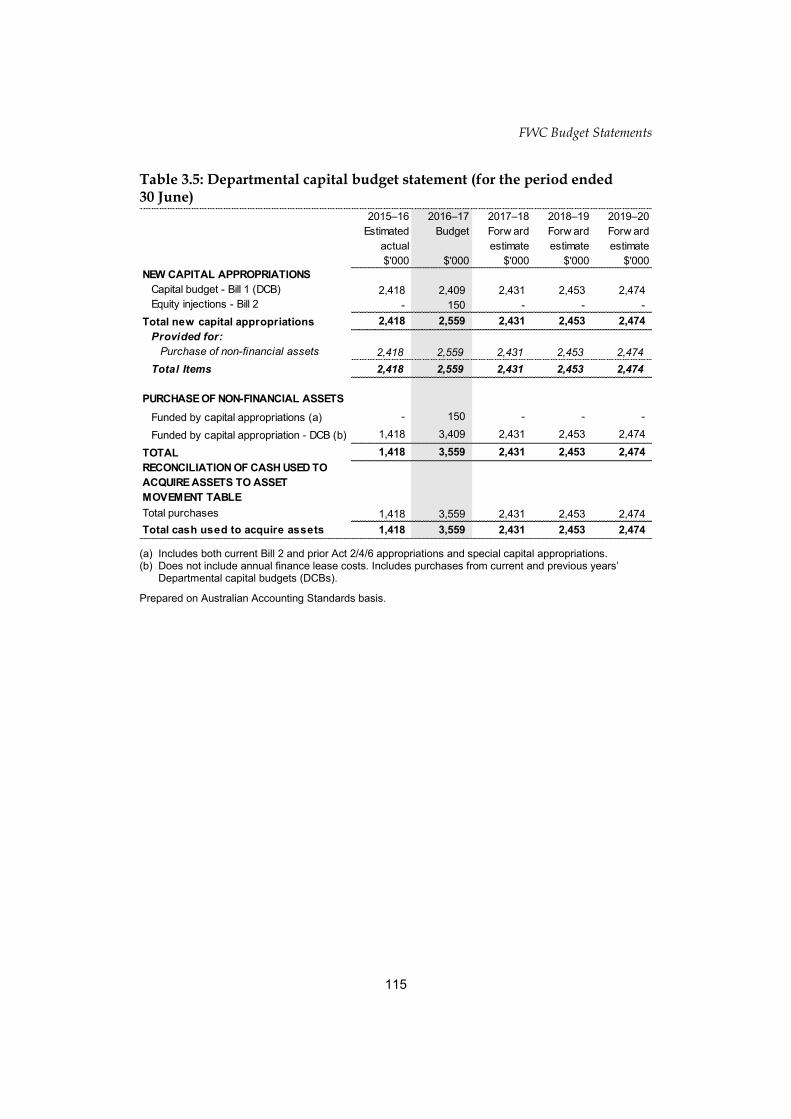
FWC Budget Statements
115
Table 3.5: Departmental capital budget statement (for the period ended 30 June)
(a) Includes both current Bill 2 and prior Act 2/4/6 appropriations and special capital appropriations. (b) Does not include annual finance lease costs. Includes purchases from current and previous years’
Departmental capital budgets (DCBs).
Prepared on Australian Accounting Standards basis.
2015–16
Estimated
actual
$'000
2016–17
Budget
$'000
2017–18
Forw ard
estimate
$'000
2018–19
Forw ard
estimate
$'000
2019–20
Forw ard
estimate
$'000
NEW CAPITAL APPROPRIATIONS
Capital budget - Bill 1 (DCB) 2,418 2,409 2,431 2,453 2,474
Equity injections - Bill 2 - 150 - - -
Total new capital appropriations 2,418 2,559 2,431 2,453 2,474
Provided for:
Purchase of non-financial assets 2,418 2,559 2,431 2,453 2,474
Total Items 2,418 2,559 2,431 2,453 2,474
PURCHASE OF NON-FINANCIAL ASSETS
Funded by capital appropriations (a) - 150 - - -
Funded by capital appropriation - DCB (b) 1,418 3,409 2,431 2,453 2,474
TOTAL 1,418 3,559 2,431 2,453 2,474
RECONCILIATION OF CASH USED TO
ACQUIRE ASSETS TO ASSET
MOVEMENT TABLE
Total purchases 1,418 3,559 2,431 2,453 2,474
Total cash used to acquire assets 1,418 3,559 2,431 2,453 2,474

FWC Budget Statements
116
FW
C B
ud
get S
tatemen
ts
Table 3.6: Statement of asset movements (Budget year 2016–17)
(a) Appropriation equity refers to Appropriation Bill (No. 1) 2015–16 for depreciation/amortisation expenses,
DCBs or other operational expenses and equity injections appropriations provided through Appropriation Bill (No. 2) 2015–16, including CDABs.
Prepared on Australian Accounting Standards basis.
Buildings
$'000
Other
property, plant
and equipment
$'000
Computer
softw are and
intangibles
$'000
Total
$'000
As at 1 July 2016
Gross book value 19,017 7,004 3,835 29,856
Accumulated depreciation/amortisation
and impairment
(1,876) (2,331) (2,573) (6,780)
Opening net book balance 17,141 4,673 1,262 23,076
Capital asset additions
Estimated expenditure on new or
replacement assets
By purchase - appropriation equity (a) 269 1,290 2,000 3,559
Total additions 269 1,290 2,000 3,559
Other movements
Depreciation/amortisation expense (1,233) (2,290) 694 (2,829)
Total other movements (1,233) (2,290) 694 (2,829)
As at 30 June 2017
Gross book value 19,286 8,294 5,835 33,415
Accumulated depreciation/ amortisation
and impairment
(3,109) (4,621) (1,879) (9,609)
Closing net book balance 16,177 3,673 3,956 23,806
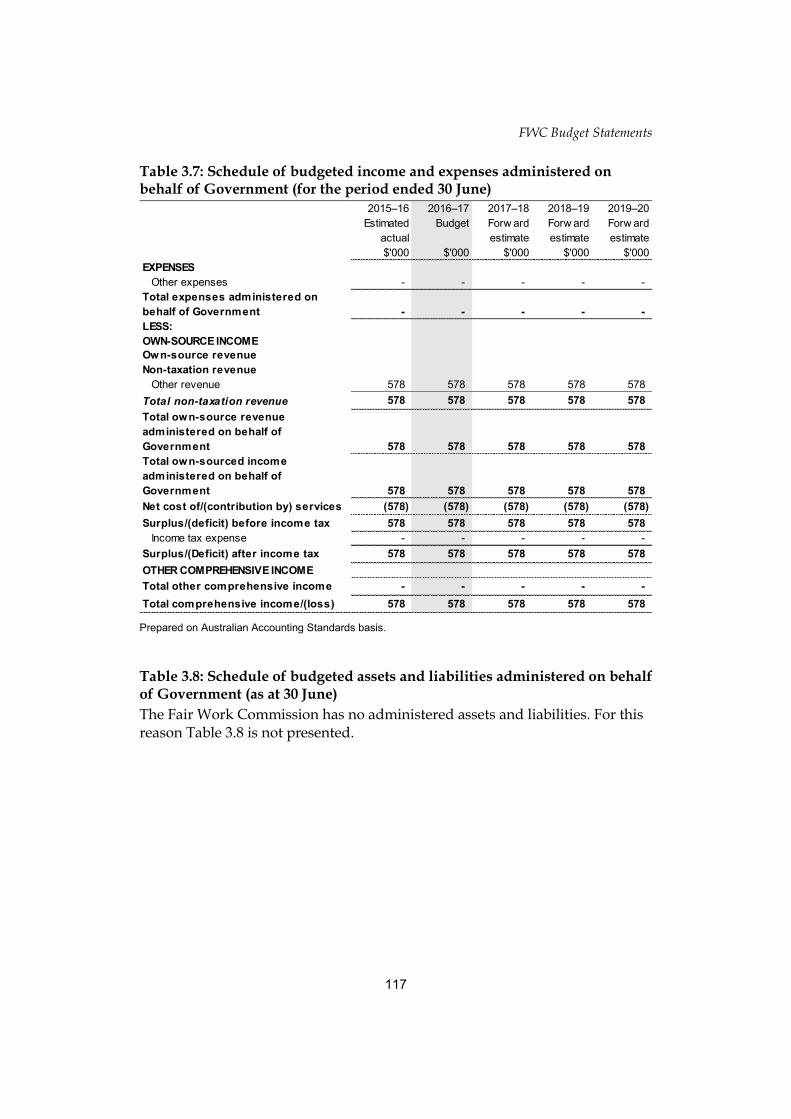
FWC Budget Statements
117
Table 3.7: Schedule of budgeted income and expenses administered on behalf of Government (for the period ended 30 June)
Prepared on Australian Accounting Standards basis.
Table 3.8: Schedule of budgeted assets and liabilities administered on behalf of Government (as at 30 June)
The Fair Work Commission has no administered assets and liabilities. For this reason Table 3.8 is not presented.
2015–16
Estimated
actual
$'000
2016–17
Budget
$'000
2017–18
Forw ard
estimate
$'000
2018–19
Forw ard
estimate
$'000
2019–20
Forw ard
estimate
$'000
EXPENSES
Other expenses - - - - -
Total expenses administered on
behalf of Government - - - - -
LESS:
OWN-SOURCE INCOME
Own-source revenue
Non-taxation revenue
Other revenue 578 578 578 578 578
Total non-taxation revenue 578 578 578 578 578
Total own-source revenue
administered on behalf of
Government 578 578 578 578 578
Total own-sourced income
administered on behalf of
Government 578 578 578 578 578
Net cost of/(contribution by) services (578) (578) (578) (578) (578)
Surplus/(deficit) before income tax 578 578 578 578 578
Income tax expense - - - - -
Surplus/(Deficit) after income tax 578 578 578 578 578
OTHER COMPREHENSIVE INCOME
Total other comprehensive income - - - - -
Total comprehensive income/(loss) 578 578 578 578 578

FWC Budget Statements
118
Table 3.9: Schedule of budgeted administered cash flows (for the period ended 30 June)
Prepared on Australian Accounting Standards basis.
Table 3.10: Administered capital budget statement (period ended 30 June)
The Fair Work Commission has no administered capital budget. For this reason Table 3.10 is not presented.
Table 3.11: Statement of administered asset movements (Budget year 2016–17) The Fair Work Commission has no administered assets and liabilities. For this reason Table 3.11 is not presented.
2015–16
Estimated
actual
$'000
2016–17
Budget
$'000
2017–18
Forw ard
estimate
$'000
2018–19
Forw ard
estimate
$'000
2019–20
Forw ard
estimate
$'000
OPERATING ACTIVITIES
Cash received
Other 578 578 578 578 578
Total cash received 578 578 578 578 578
Cash used
Other - - - - -
Total cash used - - - - -
Net cash from/(used by) operating
activities 578 578 578 578 578
INVESTING ACTIVITIES
Cash received
Other - - - - -
Total cash received - - - - -
Cash usedOther - - - - -
Total cash used - - - - -
Net cash from/(used by) investing
activities - - - - -
FINANCING ACTIVITIES
Cash received
Other - - - - -
Total cash received - - - - -
Cash used
Other - - - - -
Total cash used - - - - -
Net cash from/(used by) financing
activities - - - - -
Net increase/(decrease) in cash held 578 578 578 578 578
Cash to Official Public Account for:
- Other (578) (578) (578) (578) (578)
Cash and cash equivalents at end of
reporting period - - - - -
Fair Work Ombudsman
Entity resources and planned performance

FWO Budget Statements
121
FAIR WORK OMBUDSMAN
Section 1: Entity overview and resources .............................................................. 123
1.1 Strategic direction statement ........................................................................ 123
1.2 Entity resource statement ............................................................................. 124
1.3 Budget measures .......................................................................................... 126
Section 2: Outcomes and planned performance ................................................... 127
2.1 Budgeted expenses and performance for Outcome 1 .................................. 128
Section 3: Budgeted financial statements .............................................................. 131
3.1 Budgeted financial statements...................................................................... 131
3.2.1 Budgeted financial statements tables ........................................................... 132


FWO Budget Statements
123
FAIR WORK OMBUDSMAN
Section 1: Entity overview and resources
1.1 STRATEGIC DIRECTION STATEMENT
The Fair Work Ombudsman is an independent statutory office created by the Fair Work Act 2009 on 1 July 2009.
The Fair Work Ombudsman promotes harmonious, productive and cooperative workplace relations and ensures compliance with Commonwealth workplace laws by:
offering people a single point of contact for them to receive accurate and timely advice and information about Australia’s workplace relations system
educating people working in Australia about their workplace rights and obligations
investigating complaints or suspected contraventions of workplace laws, awards and agreements
litigating to enforce workplace laws and to deter people from not complying with their workplace responsibilities.
The strategic focus of the Fair Work Ombudsman in 2016–17 is to ensure that there is increased compliance with Commonwealth workplace laws through educating and advising employees, employers, outworkers, outworker entities and organisations about the federal workplace relations system.

FWO Budget Statements
124
1.2 ENTITY RESOURCE STATEMENT
Table 1.1 shows the total funding from all sources available to the entity for its operations and to deliver programs and services on behalf of the government.
The table summarises how resources will be applied by outcome (government strategic policy objectives) and by administered (on behalf of the government or the public) and departmental (for the entity’s operations) classification.
For more detailed information please refer to Budget Paper No. 4—Agency Resourcing.
Information in this table is presented on a resourcing (i.e. appropriations/cash available) basis, whilst the ‘Budgeted expenses by Outcome 1’ tables in Section 2 and the financial statements in Section 3 are presented on an accrual basis.

FWO Budget Statements
125
Table 1.1: Fair Work Ombudsman resource statement—Budget estimates for 2016–17 as at Budget May 2016
Prepared on a resourcing (i.e. appropriations available) basis. Please note: All figures shown above are GST exclusive—these may not match figures in the cash flow statement.
(a) Appropriation Bill (No.1) 2016–17. (b) Excludes $0.075m subject to quarantine by Finance or withheld under section 51 of the Public
Governance, Performance and Accountability Act 2013 (PGPA Act) (c) Estimated retained revenue receipts under section 74 of the PGPA Act. (d) Departmental capital budgets are not separately identified in Appropriation Bill (No.1) and form part of
ordinary annual services items. Please refer to Table 3.5 for further details. For accounting purposes, this amount has been designated as a 'contribution by owner’.
(e) Appropriation Bill (No.2) 2016–17. (f) Excludes 'Special Public Money' held in accounts like Other Trust Monies accounts (OTM), Services for
Other Government and Non-agency Bodies accounts (SOG) or Services for Other Entities and Trust Moneys accounts (SOETM). For further information on special appropriations and special accounts, please refer to Budget Paper No. 4—Agency Resourcing. Please also see Table 2.1 for further information on outcome and program expenses broken down by various funding sources, e.g. annual appropriations, special appropriations and special accounts.
2015–16
Estimated
actual
$'000
2016–17
Estimate
$'000
Departmental
Annual appropriations - ordinary annual services (a)
Prior year appropriations available (b) 65,610 57,767
Departmental appropriation 107,995 103,987
s 74 retained revenue receipts (c) 3,400 1,550
Departmental capital budget (d) 9,811 6,849
Annual appropriations - other services - non-operating (e)
Equity injection - 150
Total departmental annual appropriations 186,816 170,303
Total departmental special appropriations (f) 225 250
Total departmental resourcing 187,041 170,553
Total resourcing for Fair Work Ombudsman 187,041 170,553
2015–16 2016–17
Average staffing level (number) 702 675

FWO Budget Statements
126
1.3 BUDGET MEASURES
Budget measures in Part 1 relating to the Fair Work Ombudsman are detailed in Budget Paper No. 2 and are summarised below.
Table 1.2: Entity 2016–17 Budget measures
Part 1: Measures announced since the 2015–16 Mid-Year Economic and Fiscal Outlook (MYEFO)
Prepared on a Government Finance Statistics (fiscal) basis. Figures displayed as a negative (-) represent a decrease in funds and a positive (+) represent an increase in funds.
Part 2: Other measures not previously reported in a portfolio statement
(a) This measure was first published in the 2015–16 Budget. (b) This measure was first published in the 2015–16 Mid-Year Economic and Fiscal Outlook. (c) This measure was first published in the 2014–15 Mid-Year Economic and Fiscal Outlook.
Prepared on a Government Finance Statistics (fiscal) basis. Figures displayed as a negative (-) represent a decrease in funds and a positive (+) represent an increase in funds.
Program
2015–16
$'000
2016–17
$'000
2017–18
$'000
2018–19
$'000
2019–20
$'000
Expense measures
Community Engagement Grants
Program - establishment
1.1
Departmental expenses - - - - -
Total - - - - -
Road Safety Remuneration Tribunal -
abolition
1.1
Departmental expenses - (1,407) (1,416) (1,425) (1,434)
Total - (1,407) (1,416) (1,425) (1,434)
Total expense measures
Departmental - (1,407) (1,416) (1,425) (1,434)
Total - (1,407) (1,416) (1,425) (1,434)
Program
2015–16
$'000
2016–17
$'000
2017–18
$'000
2018–19
$'000
2019–20
$'000
Measures
Public Sector Savings - Enterprise
Resource Planning Systems (a)
1.1
Departmental expenses - - (82) (101) -
Total - - (82) (101) -
Public Sector Savings - Shared and
Common Services Programme (b)
1.1
Departmental expenses - (26) (52) (52) -
Total - (26) (52) (52) -
Public Sector Superannuation
Accumulation Plan administration
fees (c)
1.1
Departmental expenses (91) (91) (91) (91) (91)
Total (91) (91) (91) (91) (91)
Total measures
Departmental (91) (117) (225) (244) (91)
Total (91) (117) (225) (244) (91)
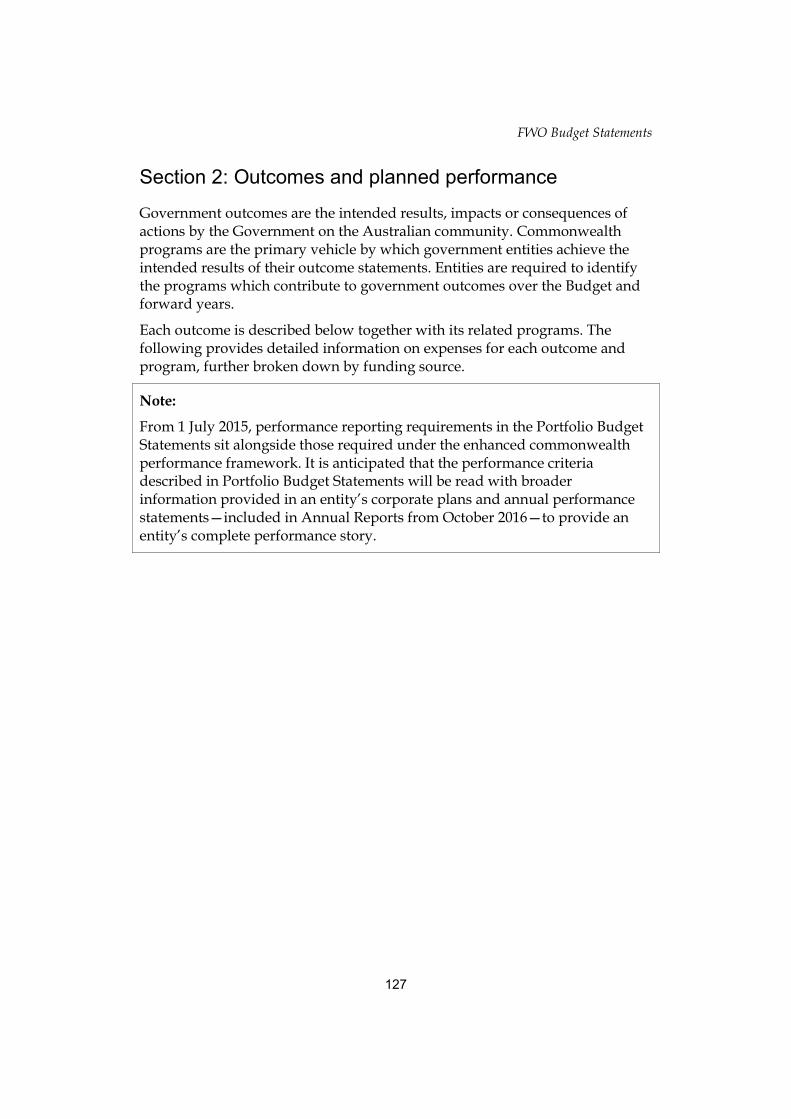
FWO Budget Statements
127
Section 2: Outcomes and planned performance
Government outcomes are the intended results, impacts or consequences of actions by the Government on the Australian community. Commonwealth programs are the primary vehicle by which government entities achieve the intended results of their outcome statements. Entities are required to identify the programs which contribute to government outcomes over the Budget and forward years.
Each outcome is described below together with its related programs. The following provides detailed information on expenses for each outcome and program, further broken down by funding source.
Note:
From 1 July 2015, performance reporting requirements in the Portfolio Budget Statements sit alongside those required under the enhanced commonwealth performance framework. It is anticipated that the performance criteria described in Portfolio Budget Statements will be read with broader information provided in an entity’s corporate plans and annual performance statements—included in Annual Reports from October 2016—to provide an entity’s complete performance story.
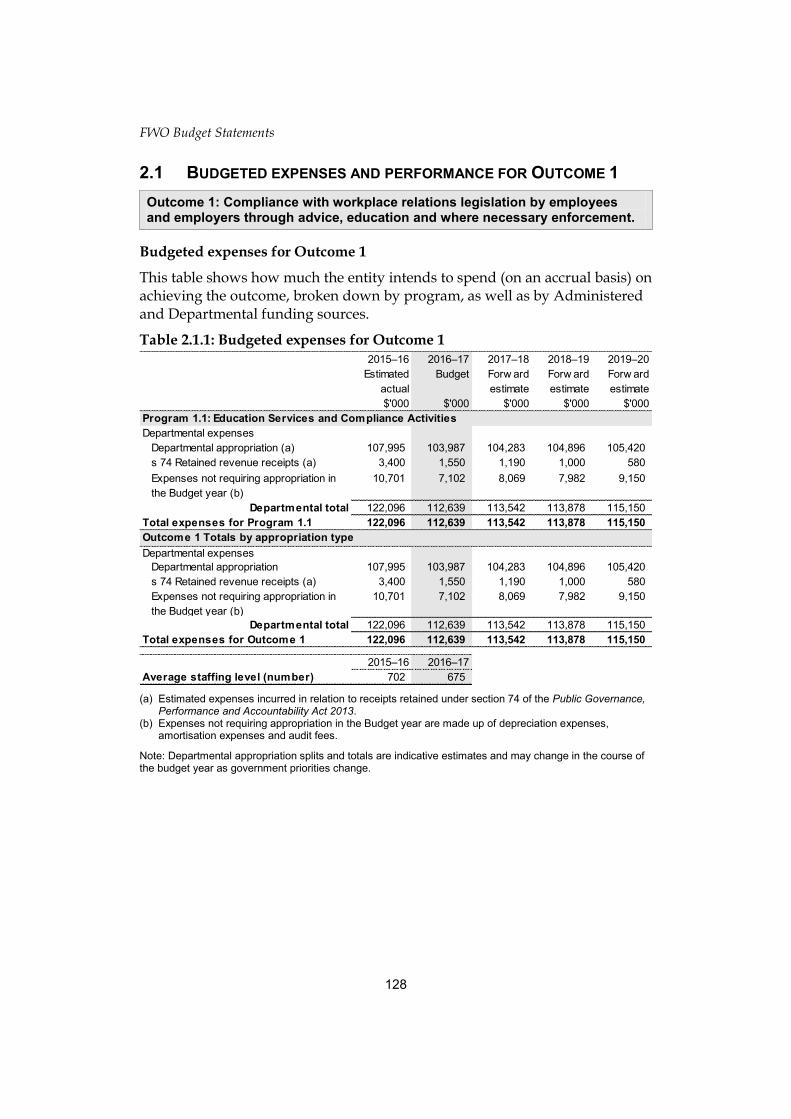
FWO Budget Statements
128
2.1 BUDGETED EXPENSES AND PERFORMANCE FOR OUTCOME 1
Outcome 1: Compliance with workplace relations legislation by employees and employers through advice, education and where necessary enforcement.
Budgeted expenses for Outcome 1
This table shows how much the entity intends to spend (on an accrual basis) on achieving the outcome, broken down by program, as well as by Administered and Departmental funding sources.
Table 2.1.1: Budgeted expenses for Outcome 1
(a) Estimated expenses incurred in relation to receipts retained under section 74 of the Public Governance,
Performance and Accountability Act 2013. (b) Expenses not requiring appropriation in the Budget year are made up of depreciation expenses,
amortisation expenses and audit fees.
Note: Departmental appropriation splits and totals are indicative estimates and may change in the course of the budget year as government priorities change.
2015–16
Estimated
actual
$'000
2016–17
Budget
$'000
2017–18
Forw ard
estimate
$'000
2018–19
Forw ard
estimate
$'000
2019–20
Forw ard
estimate
$'000
Departmental expenses
Departmental appropriation (a) 107,995 103,987 104,283 104,896 105,420
s 74 Retained revenue receipts (a) 3,400 1,550 1,190 1,000 580
Expenses not requiring appropriation in
the Budget year (b)
10,701 7,102 8,069 7,982 9,150
Departmental total 122,096 112,639 113,542 113,878 115,150
Total expenses for Program 1.1 122,096 112,639 113,542 113,878 115,150
Departmental expenses
Departmental appropriation 107,995 103,987 104,283 104,896 105,420
s 74 Retained revenue receipts (a) 3,400 1,550 1,190 1,000 580
Expenses not requiring appropriation in
the Budget year (b)
10,701 7,102 8,069 7,982 9,150
Departmental total 122,096 112,639 113,542 113,878 115,150
Total expenses for Outcome 1 122,096 112,639 113,542 113,878 115,150
2015–16 2016–17
Average staffing level (number) 702 675
Program 1.1: Education Services and Compliance Activities
Outcome 1 Totals by appropriation type
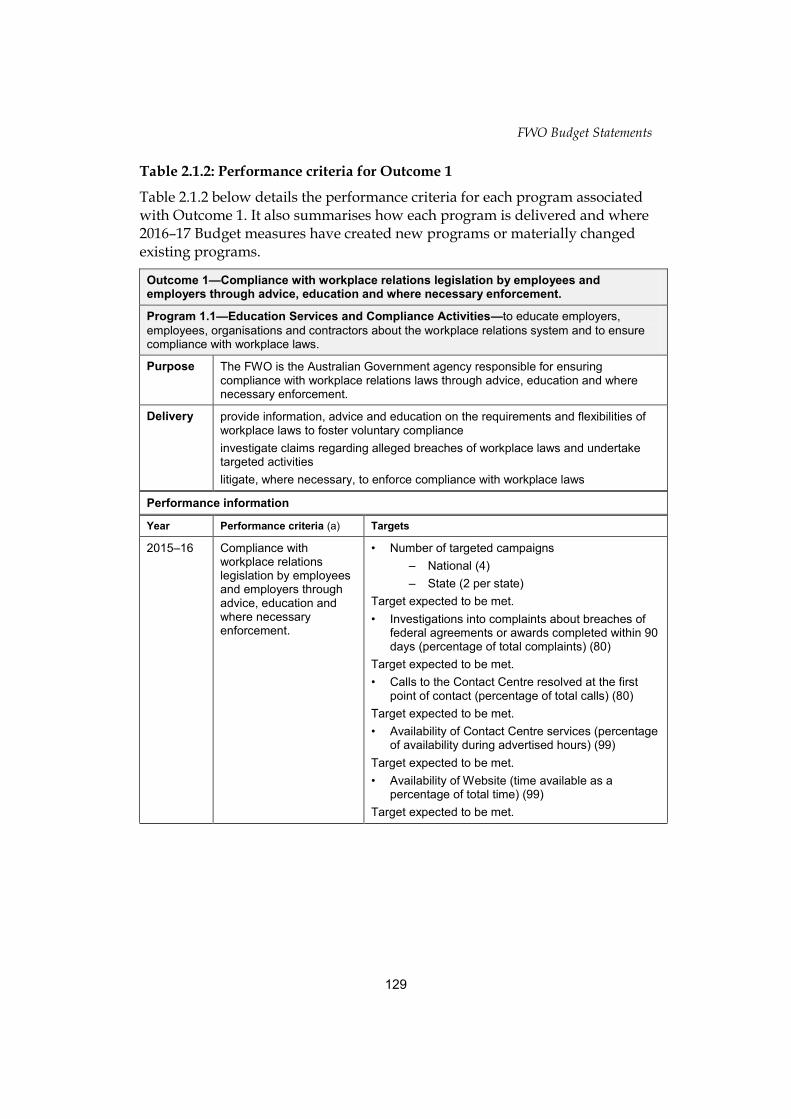
FWO Budget Statements
129
Table 2.1.2: Performance criteria for Outcome 1
Table 2.1.2 below details the performance criteria for each program associated with Outcome 1. It also summarises how each program is delivered and where 2016–17 Budget measures have created new programs or materially changed existing programs.
Outcome 1—Compliance with workplace relations legislation by employees and employers through advice, education and where necessary enforcement.
Program 1.1—Education Services and Compliance Activities—to educate employers,
employees, organisations and contractors about the workplace relations system and to ensure compliance with workplace laws.
Purpose The FWO is the Australian Government agency responsible for ensuring compliance with workplace relations laws through advice, education and where necessary enforcement.
Delivery provide information, advice and education on the requirements and flexibilities of workplace laws to foster voluntary compliance
investigate claims regarding alleged breaches of workplace laws and undertake targeted activities
litigate, where necessary, to enforce compliance with workplace laws
Performance information
Year Performance criteria (a) Targets
2015–16 Compliance with workplace relations legislation by employees and employers through advice, education and where necessary enforcement.
• Number of targeted campaigns
– National (4)
– State (2 per state)
Target expected to be met.
• Investigations into complaints about breaches of federal agreements or awards completed within 90 days (percentage of total complaints) (80)
Target expected to be met.
• Calls to the Contact Centre resolved at the first point of contact (percentage of total calls) (80)
Target expected to be met.
• Availability of Contact Centre services (percentage of availability during advertised hours) (99)
Target expected to be met.
• Availability of Website (time available as a percentage of total time) (99)
Target expected to be met.

FWO Budget Statements
130
Performance information
Year Performance criteria (a) Targets
2016–17 The FWO takes a risk based and proportionate approach to its compliance and enforcement activities.
At least 90% of requests for assistance involving a workplace dispute are finalised through education and dispute resolution services.
No more than 10% of requests for assistance involving a workplace dispute are finalised through compliance and enforcement tools.
The FWO provides information and advice that is accessible, timely and reliable.
99% availability for website services and of advertised contact centre hours.
Requests for assistance involving a workplace dispute are finalised in an average of 30 days.
2017–18 and beyond
As per 2016–17 As per 2016–17
Material changes to Program 1.1 resulting from the following measures:
Nil

FWO Budget Statements
131
Section 3: Budgeted financial statements
Section 3 presents budgeted financial statements which provide a comprehensive snapshot of entity finances for the 2016–17 budget year, including the impact of budget measures and resourcing on financial statements.
3.1 BUDGETED FINANCIAL STATEMENTS
3.1.1 Differences between entity resourcing and financial statements
The Agency Resource Statement (Table 1.1) details the total appropriation available to an agency from all sources. For departmental operating appropriations (outputs) this includes carry-forward amounts as well as amounts appropriated at Budget. As agencies incur and are funded for future liabilities and employee entitlements, the total amount of departmental operating appropriation available to an agency is unlikely to be fully utilised in the Budget year. The difference between the agency resource statement and the sum of all payments made at the departmental outputs level is the expected carry-forward amount of resources for the 2016–17 Budget year, including amounts related to meeting future employee entitlement obligations.
3.1.2 Explanatory notes and analysis of budgeted financial statements
The Fair Work Ombudsman is budgeting for an operating loss equal to the unappropriated depreciation and amortisation expense of $7.0 million for the 2016–17 financial year.
Total revenues are estimated to be $105.5 million and total expenses $112.6 million.
Total assets at the end of the 2016–17 financial year are estimated to be $90.7 million. The majority of the assets represent receivables (appropriations receivable) and property fit outs. Asset acquisitions are planned in Information Technology equipment and systems and on office accommodation fit outs.
Total liabilities for 2016–17 are estimated at $38.9 million. The largest liability item is accrued employee entitlements.
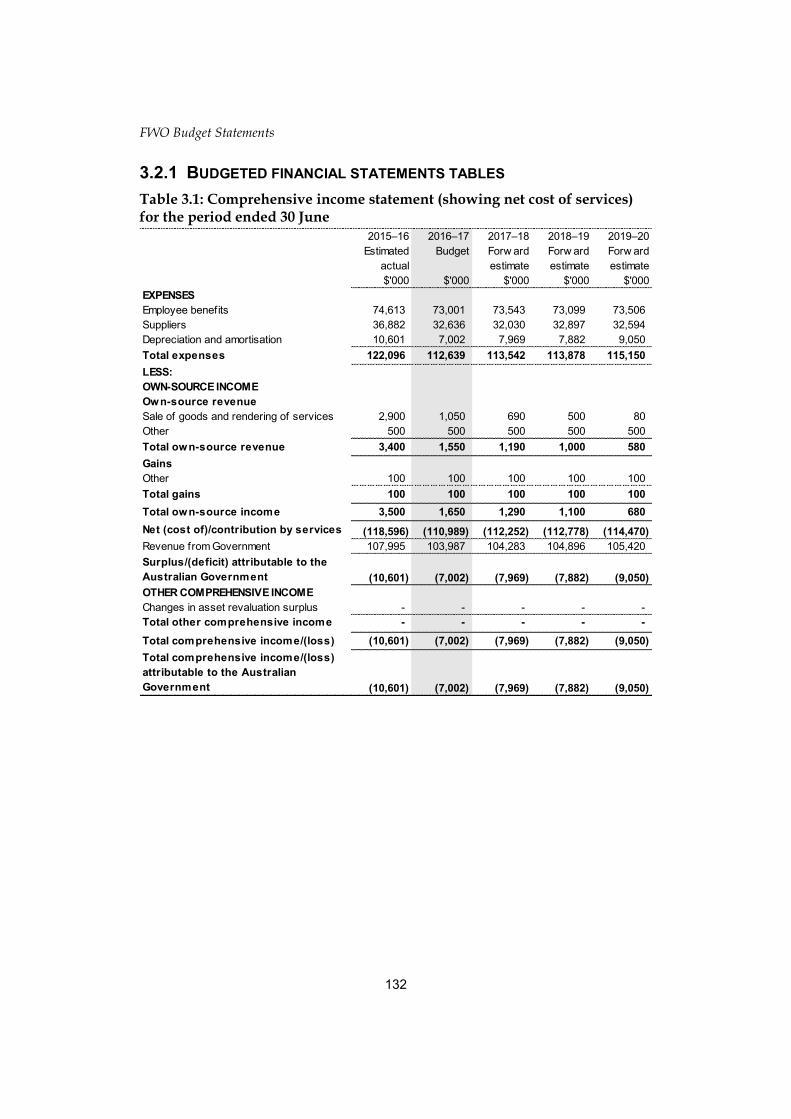
FWO Budget Statements
132
3.2.1 BUDGETED FINANCIAL STATEMENTS TABLES
Table 3.1: Comprehensive income statement (showing net cost of services) for the period ended 30 June
2015–16
Estimated
actual
$'000
2016–17
Budget
$'000
2017–18
Forw ard
estimate
$'000
2018–19
Forw ard
estimate
$'000
2019–20
Forw ard
estimate
$'000
EXPENSES
Employee benefits 74,613 73,001 73,543 73,099 73,506
Suppliers 36,882 32,636 32,030 32,897 32,594
Depreciation and amortisation 10,601 7,002 7,969 7,882 9,050
Total expenses 122,096 112,639 113,542 113,878 115,150
LESS:
OWN-SOURCE INCOME
Own-source revenue
Sale of goods and rendering of services 2,900 1,050 690 500 80
Other 500 500 500 500 500
Total own-source revenue 3,400 1,550 1,190 1,000 580
Gains
Other 100 100 100 100 100
Total gains 100 100 100 100 100
Total own-source income 3,500 1,650 1,290 1,100 680
Net (cost of)/contribution by services (118,596) (110,989) (112,252) (112,778) (114,470)
Revenue from Government 107,995 103,987 104,283 104,896 105,420
Surplus/(deficit) attributable to the
Australian Government (10,601) (7,002) (7,969) (7,882) (9,050)
OTHER COMPREHENSIVE INCOME
Changes in asset revaluation surplus - - - - -
Total other comprehensive income - - - - -
Total comprehensive income/(loss) (10,601) (7,002) (7,969) (7,882) (9,050)
Total comprehensive income/(loss)
attributable to the Australian
Government (10,601) (7,002) (7,969) (7,882) (9,050)

FWO Budget Statements
133
Table 3.1: Comprehensive income statement (showing net cost of services) for the period ended 30 June (continued)
Note: Impact of net cash appropriation arrangements
(a) From 2010–11, the Government introduced net cash appropriation arrangements where Bill 1 revenue
appropriations for the depreciation/amortisation expenses of non-corporate Commonwealth entities (and select corporate Commonwealth entities) were replaced with a separate capital budget (the Departmental Capital Budget, or DCB) provided through Bill 1 equity appropriations. For information regarding DCBs, please refer to Table 3.5 Departmental Capital Budget Statement.
Prepared on Australian Accounting Standards basis.
2015–16
$'000
2016–17
$'000
2017–18
$'000
2018–19
$'000
2019–20
$'000
Total comprehensive income/(loss)
excluding depreciation/amortisation
expenses previously funded through
revenue appropriations.
- - - - -
less depreciation/amortisation expenses
previously funded through revenue
appropriations (a)
10,601 7,002 7,969 7,882 9,050
Total comprehensive income/(loss)
—as per the statement of
comprehensive income
(10,601) (7,002) (7,969) (7,882) (9,050)
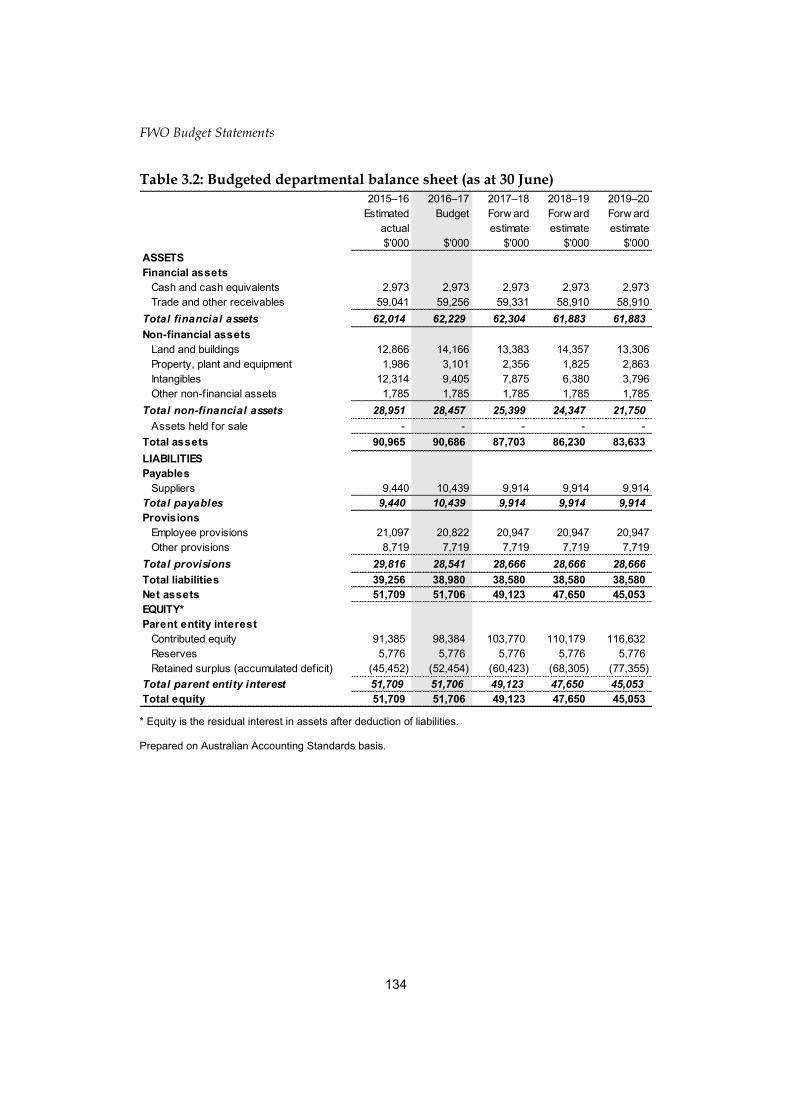
FWO Budget Statements
134
Table 3.2: Budgeted departmental balance sheet (as at 30 June)
* Equity is the residual interest in assets after deduction of liabilities. Prepared on Australian Accounting Standards basis.
2015–16
Estimated
actual
$'000
2016–17
Budget
$'000
2017–18
Forw ard
estimate
$'000
2018–19
Forw ard
estimate
$'000
2019–20
Forw ard
estimate
$'000
ASSETS
Financial assets
Cash and cash equivalents 2,973 2,973 2,973 2,973 2,973
Trade and other receivables 59,041 59,256 59,331 58,910 58,910
Total financial assets 62,014 62,229 62,304 61,883 61,883
Non-financial assets
Land and buildings 12,866 14,166 13,383 14,357 13,306
Property, plant and equipment 1,986 3,101 2,356 1,825 2,863
Intangibles 12,314 9,405 7,875 6,380 3,796
Other non-financial assets 1,785 1,785 1,785 1,785 1,785
Total non-financial assets 28,951 28,457 25,399 24,347 21,750
Assets held for sale - - - - -
Total assets 90,965 90,686 87,703 86,230 83,633
LIABILITIES
Payables
Suppliers 9,440 10,439 9,914 9,914 9,914
Total payables 9,440 10,439 9,914 9,914 9,914
Provisions
Employee provisions 21,097 20,822 20,947 20,947 20,947
Other provisions 8,719 7,719 7,719 7,719 7,719
Total provisions 29,816 28,541 28,666 28,666 28,666
Total liabilities 39,256 38,980 38,580 38,580 38,580
Net assets 51,709 51,706 49,123 47,650 45,053
EQUITY*
Parent entity interest
Contributed equity 91,385 98,384 103,770 110,179 116,632
Reserves 5,776 5,776 5,776 5,776 5,776
Retained surplus (accumulated deficit) (45,452) (52,454) (60,423) (68,305) (77,355)
Total parent entity interest 51,709 51,706 49,123 47,650 45,053
Total equity 51,709 51,706 49,123 47,650 45,053

FWO Budget Statements
135
Table 3.3: Departmental statement of changes in equity—summary of movement (Budget year 2016–17)
Prepared on Australian Accounting Standards basis.
Retained
earnings
$'000
Asset
revaluation
reserve
$'000
Contributed
equity/
capital
$'000
Total equity
$'000
Opening balance as at 1 July 2016
Balance carried forw ard from previous
period
(45,452) 5,776 91,385 51,709
Adjusted opening balance (45,452) 5,776 91,385 51,709
Comprehensive income
Surplus/(deficit) for the period (7,002) - - (7,002)
Total comprehensive income (7,002) - - (7,002)
Transactions with owners
Contributions by owners
Equity injection - Appropriation - - 150 150
Departmental capital budget (DCB) - - 6,849 6,849
Sub-total transactions with owners - - 6,999 6,999
Estimated closing balance as at 30
June 2017 (52,454) 5,776 98,384 51,706
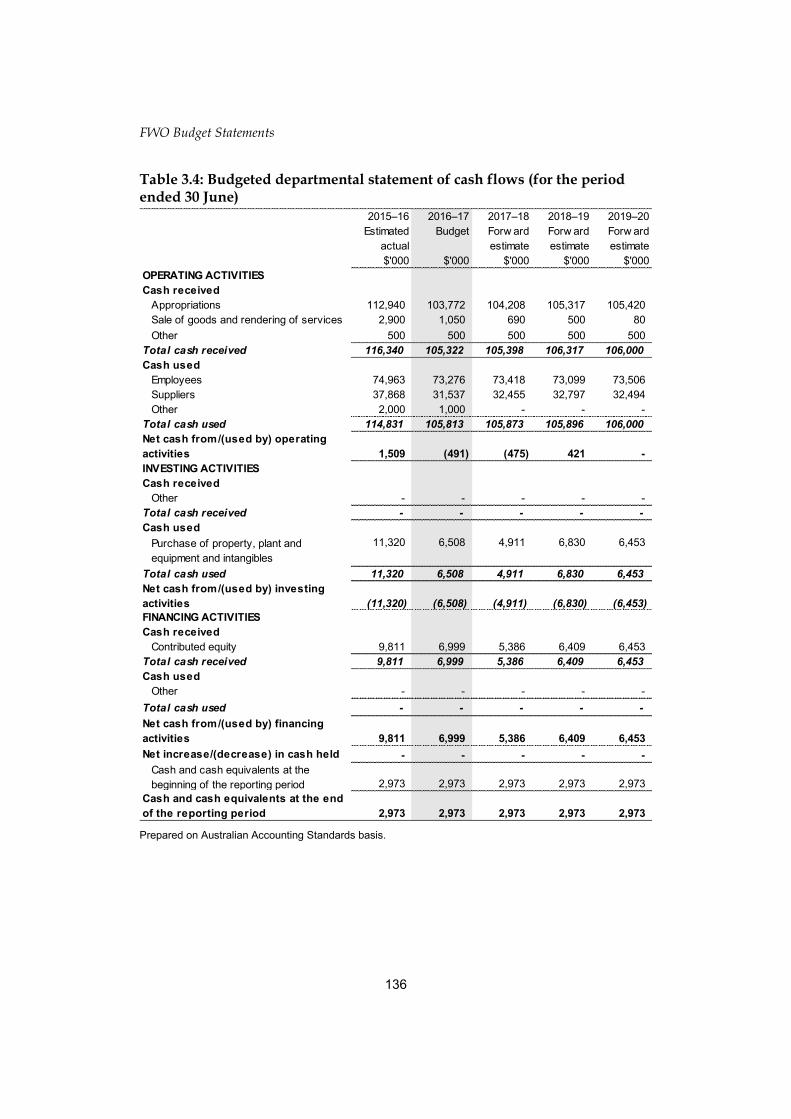
FWO Budget Statements
136
Table 3.4: Budgeted departmental statement of cash flows (for the period ended 30 June)
Prepared on Australian Accounting Standards basis.
2015–16
Estimated
actual
$'000
2016–17
Budget
$'000
2017–18
Forw ard
estimate
$'000
2018–19
Forw ard
estimate
$'000
2019–20
Forw ard
estimate
$'000
OPERATING ACTIVITIES
Cash received
Appropriations 112,940 103,772 104,208 105,317 105,420
Sale of goods and rendering of services 2,900 1,050 690 500 80
Other 500 500 500 500 500
Total cash received 116,340 105,322 105,398 106,317 106,000
Cash used
Employees 74,963 73,276 73,418 73,099 73,506
Suppliers 37,868 31,537 32,455 32,797 32,494
Other 2,000 1,000 - - -
Total cash used 114,831 105,813 105,873 105,896 106,000
Net cash from/(used by) operating
activities 1,509 (491) (475) 421 -
INVESTING ACTIVITIES
Cash received
Other - - - - -
Total cash received - - - - -
Cash used
Purchase of property, plant and
equipment and intangibles
11,320 6,508 4,911 6,830 6,453
Total cash used 11,320 6,508 4,911 6,830 6,453
Net cash from/(used by) investing
activities (11,320) (6,508) (4,911) (6,830) (6,453)
FINANCING ACTIVITIES
Cash received
Contributed equity 9,811 6,999 5,386 6,409 6,453
Total cash received 9,811 6,999 5,386 6,409 6,453
Cash used
Other - - - - -
Total cash used - - - - -
Net cash from/(used by) financing
activities 9,811 6,999 5,386 6,409 6,453
Net increase/(decrease) in cash held - - - - -
Cash and cash equivalents at the
beginning of the reporting period 2,973 2,973 2,973 2,973 2,973
Cash and cash equivalents at the end
of the reporting period 2,973 2,973 2,973 2,973 2,973

FWO Budget Statements
137
Table 3.5: Departmental capital budget statement (for the period ended 30 June)
(a) Includes both current Bill 2 and prior Act 2/4/6 appropriations and special capital appropriations. (b) Does not include annual finance lease costs. Includes purchases from current and previous years’
Departmental capital budgets (DCBs). (c) Includes the following sources of funding:
- current Bill 1 and prior year Act 1/3/5 appropriations (excluding amounts from the DCB); - internally developed assets; - s 74 Retained revenue receipts; and - proceeds from the sale of assets.
Prepared on Australian Accounting Standards basis.
2015–16
Estimated
actual
$'000
2016–17
Budget
$'000
2017–18
Forw ard
estimate
$'000
2018–19
Forw ard
estimate
$'000
2019–20
Forw ard
estimate
$'000
NEW CAPITAL APPROPRIATIONS
Capital budget - Bill 1 (DCB) 9,811 6,849 5,386 6,409 6,453
Equity injections - Bill 2 - 150 - - -
Total new capital appropriations 9,811 6,999 5,386 6,409 6,453
Provided for:
Purchase of non-financial assets 9,811 6,999 5,386 6,409 6,453
Total items 9,811 6,999 5,386 6,409 6,453
PURCHASE OF NON-FINANCIAL ASSETS
Funded by capital appropriations (a) - 150 - - -
Funded by capital appropriation - DCB (b) 6,320 4,358 4,911 5,830 6,453
Funded internally from departmental
resources (c)
5,000 2,000 - 1,000 -
TOTAL 11,320 6,508 4,911 6,830 6,453
RECONCILIATION OF CASH USED TO
ACQUIRE ASSETS TO ASSET MOVEMENT
TABLE
Total purchases 11,320 6,508 4,911 6,830 6,453
Total cash used to acquire assets 11,320 6,508 4,911 6,830 6,453
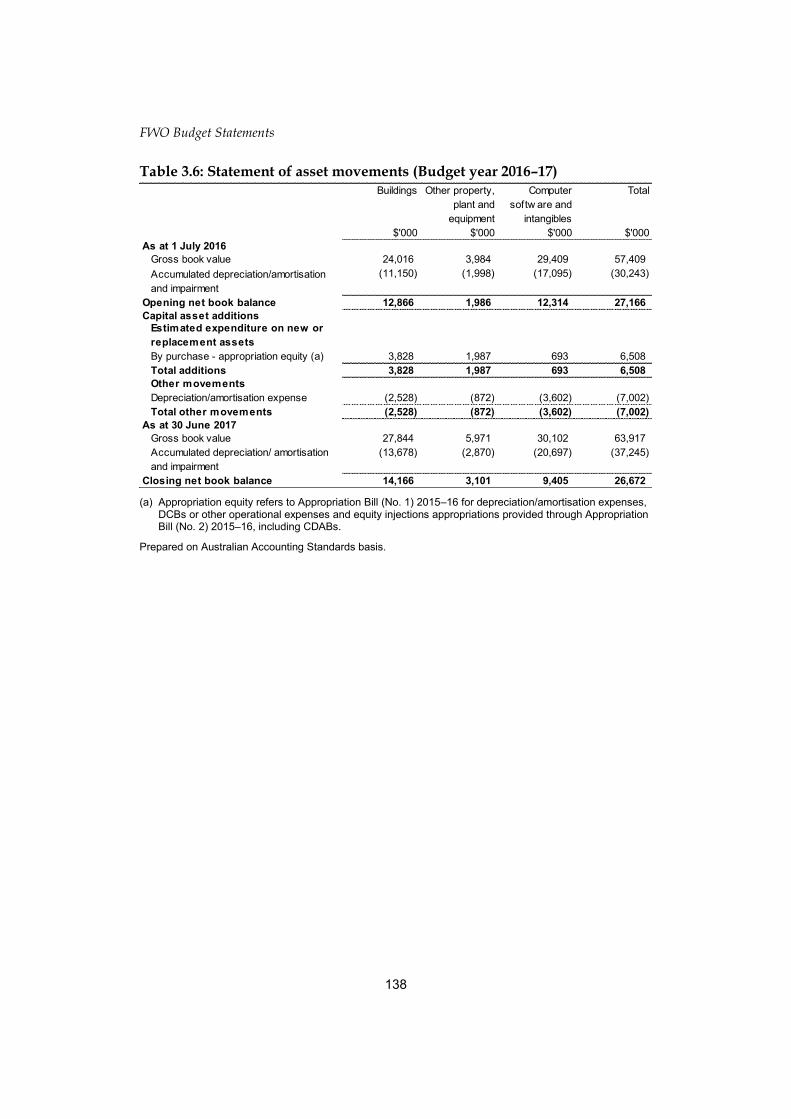
FWO Budget Statements
138
FW
O B
udg
et Statem
ents
Table 3.6: Statement of asset movements (Budget year 2016–17)
(a) Appropriation equity refers to Appropriation Bill (No. 1) 2015–16 for depreciation/amortisation expenses,
DCBs or other operational expenses and equity injections appropriations provided through Appropriation Bill (No. 2) 2015–16, including CDABs.
Prepared on Australian Accounting Standards basis.
Buildings
$'000
Other property,
plant and
equipment
$'000
Computer
softw are and
intangibles
$'000
Total
$'000
As at 1 July 2016
Gross book value 24,016 3,984 29,409 57,409
Accumulated depreciation/amortisation
and impairment
(11,150) (1,998) (17,095) (30,243)
Opening net book balance 12,866 1,986 12,314 27,166
Capital asset additions
Estimated expenditure on new or
replacement assets
By purchase - appropriation equity (a) 3,828 1,987 693 6,508
Total additions 3,828 1,987 693 6,508
Other movements
Depreciation/amortisation expense (2,528) (872) (3,602) (7,002)
Total other movements (2,528) (872) (3,602) (7,002)
As at 30 June 2017
Gross book value 27,844 5,971 30,102 63,917
Accumulated depreciation/ amortisation
and impairment
(13,678) (2,870) (20,697) (37,245)
Closing net book balance 14,166 3,101 9,405 26,672
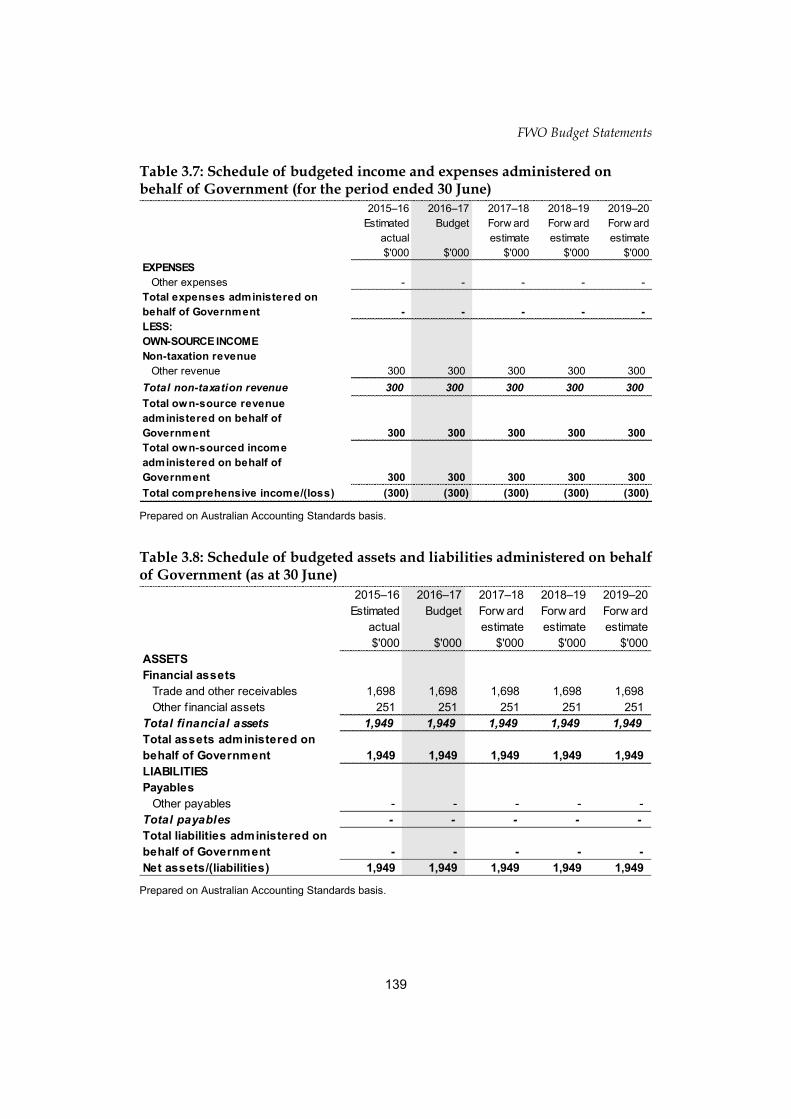
FWO Budget Statements
139
Table 3.7: Schedule of budgeted income and expenses administered on behalf of Government (for the period ended 30 June)
Prepared on Australian Accounting Standards basis.
Table 3.8: Schedule of budgeted assets and liabilities administered on behalf of Government (as at 30 June)
Prepared on Australian Accounting Standards basis.
2015–16
Estimated
actual
$'000
2016–17
Budget
$'000
2017–18
Forw ard
estimate
$'000
2018–19
Forw ard
estimate
$'000
2019–20
Forw ard
estimate
$'000
EXPENSES
Other expenses - - - - -
Total expenses administered on
behalf of Government - - - - -
LESS:
OWN-SOURCE INCOME
Non-taxation revenue
Other revenue 300 300 300 300 300
Total non-taxation revenue 300 300 300 300 300
Total own-source revenue
administered on behalf of
Government 300 300 300 300 300
Total own-sourced income
administered on behalf of
Government 300 300 300 300 300
Total comprehensive income/(loss) (300) (300) (300) (300) (300)
2015–16
Estimated
actual
$'000
2016–17
Budget
$'000
2017–18
Forw ard
estimate
$'000
2018–19
Forw ard
estimate
$'000
2019–20
Forw ard
estimate
$'000
ASSETS
Financial assets
Trade and other receivables 1,698 1,698 1,698 1,698 1,698
Other f inancial assets 251 251 251 251 251
Total financial assets 1,949 1,949 1,949 1,949 1,949
Total assets administered on
behalf of Government 1,949 1,949 1,949 1,949 1,949
LIABILITIES
Payables
Other payables - - - - -
Total payables - - - - -
Total liabilities administered on
behalf of Government - - - - -
Net assets/(liabilities) 1,949 1,949 1,949 1,949 1,949
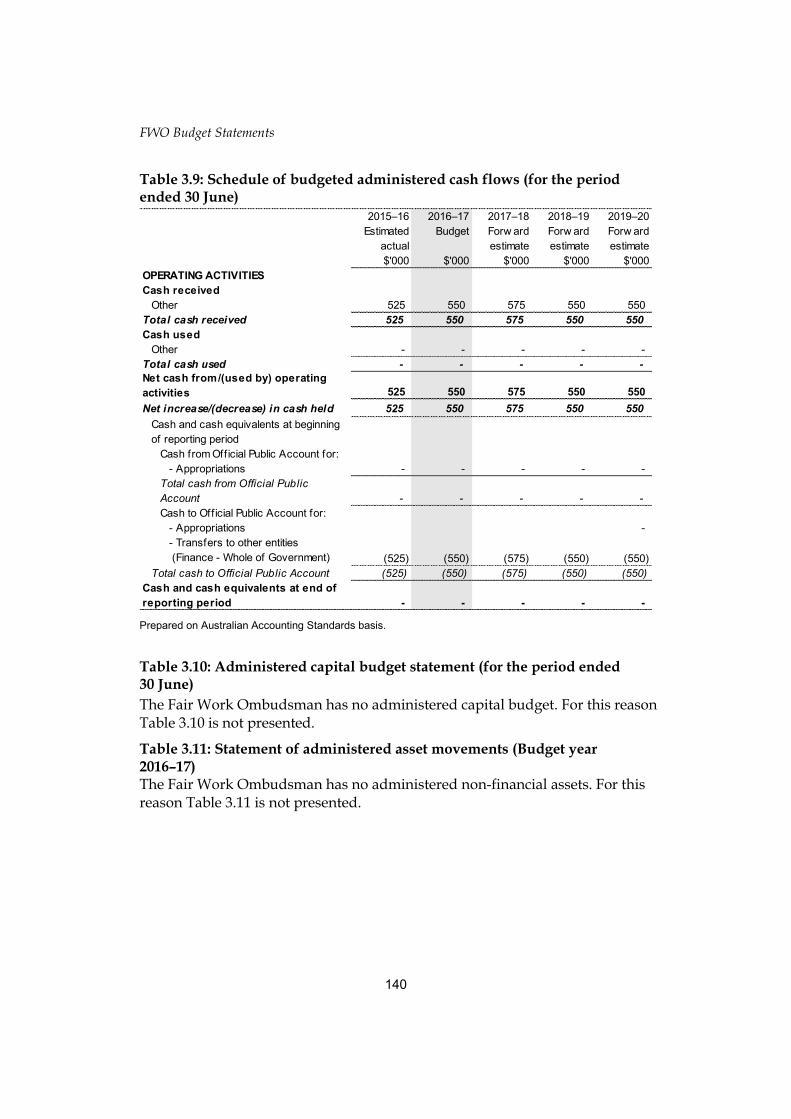
FWO Budget Statements
140
Table 3.9: Schedule of budgeted administered cash flows (for the period ended 30 June)
Prepared on Australian Accounting Standards basis.
Table 3.10: Administered capital budget statement (for the period ended 30 June)
The Fair Work Ombudsman has no administered capital budget. For this reason Table 3.10 is not presented.
Table 3.11: Statement of administered asset movements (Budget year 2016–17) The Fair Work Ombudsman has no administered non-financial assets. For this reason Table 3.11 is not presented.
2015–16
Estimated
actual
$'000
2016–17
Budget
$'000
2017–18
Forw ard
estimate
$'000
2018–19
Forw ard
estimate
$'000
2019–20
Forw ard
estimate
$'000
OPERATING ACTIVITIES
Cash received
Other 525 550 575 550 550
Total cash received 525 550 575 550 550
Cash used
Other - - - - -
Total cash used - - - - -
Net cash from/(used by) operating
activities 525 550 575 550 550
Net increase/(decrease) in cash held 525 550 575 550 550
Cash and cash equivalents at beginning
of reporting period
Cash from Official Public Account for:
- Appropriations - - - - -
Total cash from Official Public
Account - - - - -
Cash to Official Public Account for:
- Appropriations -
- Transfers to other entities
(Finance - Whole of Government) (525) (550) (575) (550) (550)
Total cash to Official Public Account (525) (550) (575) (550) (550)
Cash and cash equivalents at end of
reporting period - - - - -
Office of the Fair Work Building Industry Inspectorate
Entity resources and planned performance


FWBII Budget Statements
143
OFFICE OF THE FAIR WORK BUILDING INDUSTRY
INSPECTORATE
Section 1: Entity overview and resources .............................................................. 145
1.1 Strategic direction statement ........................................................................ 145
1.2 Entity resource statement ............................................................................. 146
1.3 Budget measures .......................................................................................... 147
Section 2: Outcomes and planned performance ................................................... 148
2.1 Budgeted expenses and performance for Outcome 1 .................................. 149
Section 3: Budgeted financial statements .............................................................. 152
3.1 Budgeted financial statements...................................................................... 152
3.2.1 Budgeted financial statements tables ........................................................... 153

FWBII Budget Statements
145
OFFICE OF THE FAIR WORK BUILDING INDUSTRY
INSPECTORATE
Section 1: Entity overview and resources
1.1 STRATEGIC DIRECTION STATEMENT
The Office of the Fair Work Building Industry Inspectorate (FWBII) was established by the Fair Work (Building Industry) Act 2012 on 1 June 2012. FWBII commenced operations on 1 June 2012. It operates under the name ‘Fair Work Building and Construction’.
In respect of the building and construction industry, FWBII is primarily responsible for:
the provision of education, assistance and advice to industry participants regarding their rights and obligations
inquiring into and investigating alleged breaches of relevant workplace laws
commencing civil penalty litigation, or making submissions to the Fair Work Commission, to enforce compliance by industry participants
referring matters to relevant authorities where appropriate in relation to:
- Fair Work (Building Industry) Act 2012
- Fair Work Act 2009, the Fair Work (Transitional Provisions and Consequential Amendments) Act 2009 and the Independent Contractors Act 2006
- safety net entitlements
- awards, agreements and court and tribunal orders
- the Building Code
- Competition and Consumer Act 2010
- allegations of criminal conduct.
During 2016–17, FWBII plans to achieve the following outcomes:
enforce workplace relations laws in the building and construction industry and ensure compliance with those laws by all participants in the building and construction industry through the provision of education, assistance and advice; and where necessary, civil penalty litigation in the courts
ensure compliance with building codes of practice through the provision of education, assistance and advice.

FWBII Budget Statements
146
1.2 ENTITY RESOURCE STATEMENT
Table 1.1 shows the total funding from all sources available to the entity for its operations and to deliver programs and services on behalf of the government.
The table summarises how resources will be applied by outcome (government strategic policy objectives) and by administered (on behalf of the government or the public) and departmental (for the entity’s operations) classification.
For more detailed information please refer to Budget Paper No. 4—Agency Resourcing.
Information in this table is presented on a resourcing (i.e. appropriations/cash available) basis, whilst the ‘Budgeted expenses by Outcome 1’ tables in Section 2 and the financial statements in Section 3 are presented on an accrual basis.
Table 1.1: Office of the Fair Work Building Industry Inspectorate resource statement—Budget estimates for 2016–17 as at Budget May 2016
Prepared on a resourcing (i.e. appropriations available) basis. Please note: All figures shown above are GST exclusive—these may not match figures in the cash flow statement.
(a) Appropriation Bill (No.1) 2016–17. (b) Excludes $19.32m subject to quarantine by Finance or withheld under section 51 of the Public
Governance, Performance and Accountability Act 2013 (PGPA Act). (c) Estimated retained revenue receipts under section 74 of the PGPA Act. (d) Departmental capital budgets are not separately identified in Appropriation Bill (No.1) and form part of
ordinary annual services items. Please refer to Table 3.5 for further details. For accounting purposes, this amount has been designated as a 'contribution by owner’.
(e) Appropriation Bill (No.2) 2016–17.
2015–16
Estimated actual
$'000
2016–17
Estimate
$'000
Departmental
Annual appropriations - ordinary annual services (a)
Prior year appropriations available (b) 48,557 44,543
Departmental appropriation 33,559 33,039
s 74 retained revenue receipts (c) 539 370
Departmental capital budget (d) 1,601 448
Annual appropriations - other services - non-operating (e)
Equity injection - 150
Total departmental annual appropriations 84,256 78,550
Total departmental resourcing 84,256 78,550
Total resourcing for Fair Work Building Industry
Inspectorate 84,256 78,550
2015–16 2016–17
Average staffing level (number) 131 155

FWBII Budget Statements
147
1.3 BUDGET MEASURES
Budget measures in Part 1 relating to the Office of the Fair Work Building Industry Inspectorate are detailed in Budget Paper No. 2 and are summarised below.
Table 1.2: Entity 2016–17 Budget measures
Part 1: Measures announced since the 2015–16 Mid-Year Economic and Fiscal Outlook (MYEFO)
The Office of the Fair Work Building Industry Inspectorate does not have any new measures since the 2015–16 MYEFO. For this reason Part 1 of Table 1.2 is not presented.
Part 2: Other measures not previously reported in a portfolio statement
(a) This measure was first published in the 2015–16 Budget. (b) This measure was first published in the 2015–16 Mid-Year Economic and Fiscal Outlook.
Prepared on a Government Finance Statistics (fiscal) basis. Figures displayed as a negative (-) represent a decrease in funds and a positive (+) represent an increase in funds.
Program
2015–16
$'000
2016–17
$'000
2017–18
$'000
2018–19
$'000
2019–20
$'000
Measures
Public Sector Savings - Enterprise
Resource Planning Systems (a)
1.1
Departmental expenses - - (24) (30) -
Total - - (24) (30) -
Public Sector Savings - Shared and
Common Services Programme (b)
1.1
Departmental expenses - (53) (106) (106) -
Total - (53) (106) (106) -
Total measures
Departmental - (53) (130) (136) -
Total - (53) (130) (136) -
FWBII Budget Statements
148
Section 2: Outcomes and planned performance
Government outcomes are the intended results, impacts or consequences of actions by the Government on the Australian community. Commonwealth programs are the primary vehicle by which government entities achieve the intended results of their outcome statements. Entities are required to identify the programs which contribute to government outcomes over the Budget and forward years.
Each outcome is described below together with its related programs. The following provides detailed information on expenses for each outcome and program, further broken down by funding source.
Note:
From 1 July 2015, performance reporting requirements in the Portfolio Budget Statements sit alongside those required under the enhanced commonwealth performance framework. It is anticipated that the performance criteria described in Portfolio Budget Statements will be read with broader information provided in an entity’s corporate plans and annual performance statements—included in Annual Reports from October 2016—to provide an entity’s complete performance story.
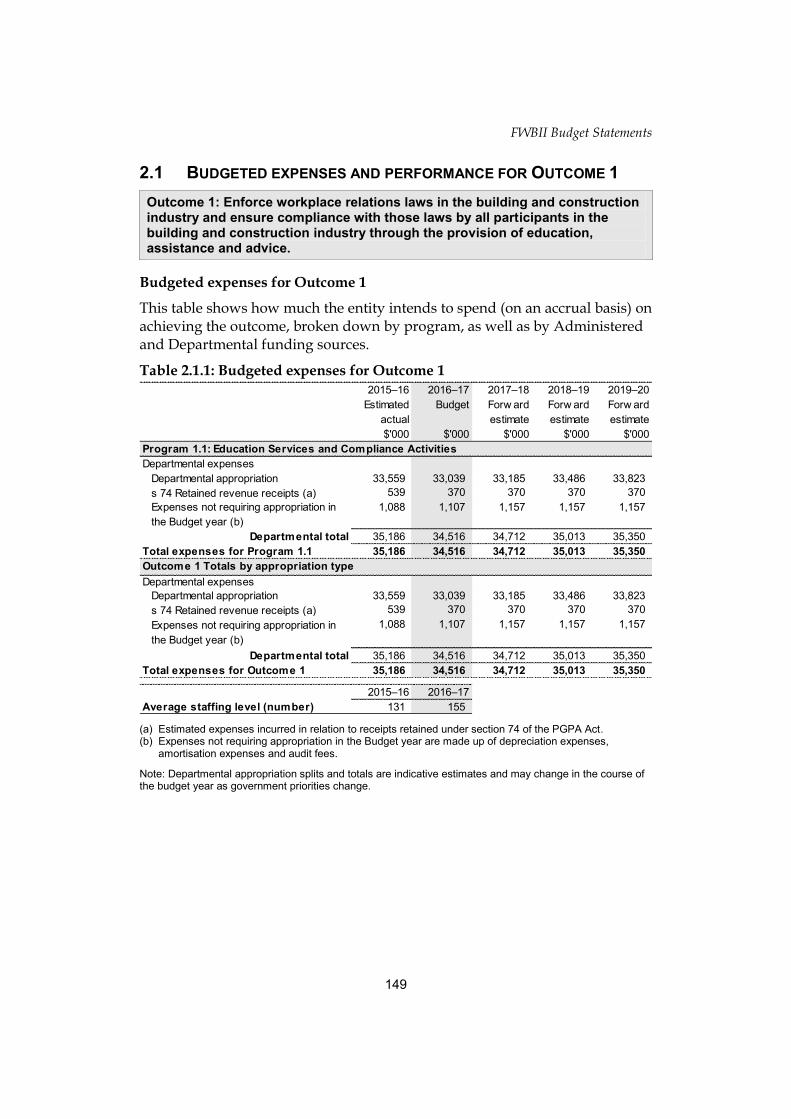
FWBII Budget Statements
149
2.1 BUDGETED EXPENSES AND PERFORMANCE FOR OUTCOME 1
Outcome 1: Enforce workplace relations laws in the building and construction industry and ensure compliance with those laws by all participants in the building and construction industry through the provision of education, assistance and advice.
Budgeted expenses for Outcome 1
This table shows how much the entity intends to spend (on an accrual basis) on achieving the outcome, broken down by program, as well as by Administered and Departmental funding sources.
Table 2.1.1: Budgeted expenses for Outcome 1
(a) Estimated expenses incurred in relation to receipts retained under section 74 of the PGPA Act. (b) Expenses not requiring appropriation in the Budget year are made up of depreciation expenses,
amortisation expenses and audit fees.
Note: Departmental appropriation splits and totals are indicative estimates and may change in the course of the budget year as government priorities change.
2015–16
Estimated
actual
$'000
2016–17
Budget
$'000
2017–18
Forw ard
estimate
$'000
2018–19
Forw ard
estimate
$'000
2019–20
Forw ard
estimate
$'000
Departmental expenses
Departmental appropriation 33,559 33,039 33,185 33,486 33,823
s 74 Retained revenue receipts (a) 539 370 370 370 370
Expenses not requiring appropriation in
the Budget year (b)
1,088 1,107 1,157 1,157 1,157
Departmental total 35,186 34,516 34,712 35,013 35,350
Total expenses for Program 1.1 35,186 34,516 34,712 35,013 35,350
Departmental expenses
Departmental appropriation 33,559 33,039 33,185 33,486 33,823
s 74 Retained revenue receipts (a) 539 370 370 370 370
Expenses not requiring appropriation in
the Budget year (b)
1,088 1,107 1,157 1,157 1,157
Departmental total 35,186 34,516 34,712 35,013 35,350
Total expenses for Outcome 1 35,186 34,516 34,712 35,013 35,350
2015–16 2016–17
Average staffing level (number) 131 155
Program 1.1: Education Services and Compliance Activities
Outcome 1 Totals by appropriation type
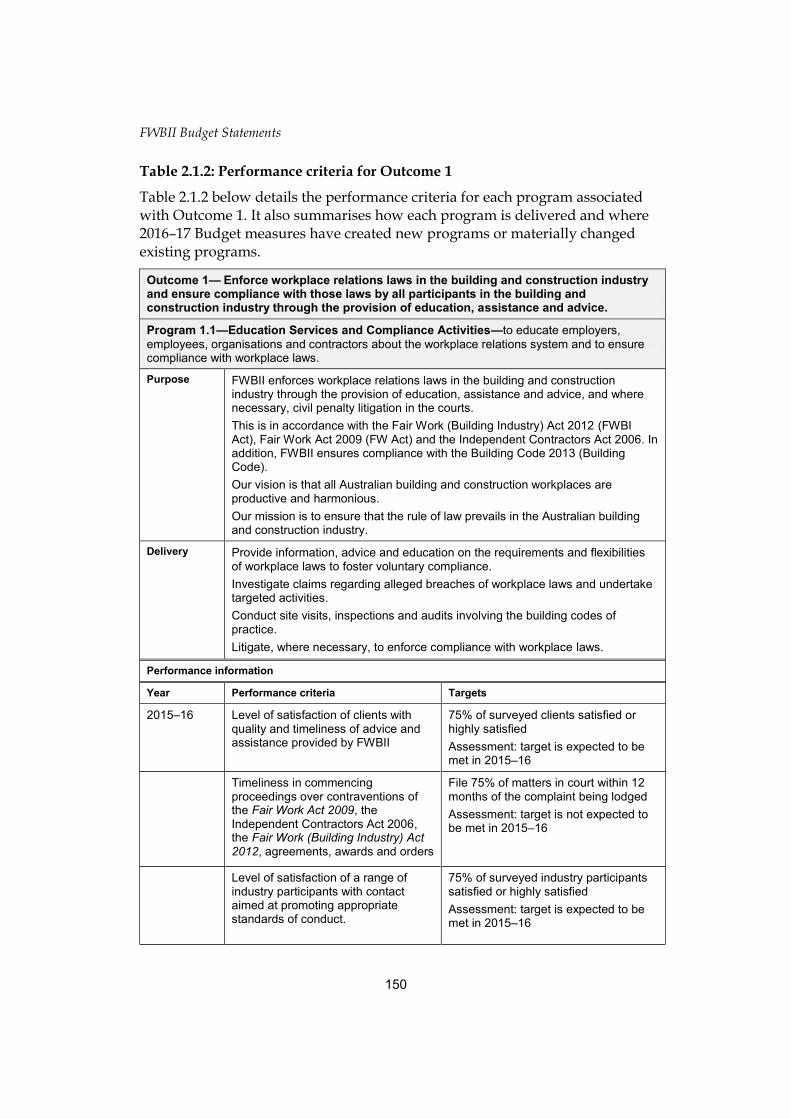
FWBII Budget Statements
150
Table 2.1.2: Performance criteria for Outcome 1
Table 2.1.2 below details the performance criteria for each program associated with Outcome 1. It also summarises how each program is delivered and where 2016–17 Budget measures have created new programs or materially changed existing programs.
Outcome 1— Enforce workplace relations laws in the building and construction industry and ensure compliance with those laws by all participants in the building and construction industry through the provision of education, assistance and advice.
Program 1.1—Education Services and Compliance Activities—to educate employers,
employees, organisations and contractors about the workplace relations system and to ensure compliance with workplace laws.
Purpose FWBII enforces workplace relations laws in the building and construction industry through the provision of education, assistance and advice, and where necessary, civil penalty litigation in the courts.
This is in accordance with the Fair Work (Building Industry) Act 2012 (FWBI Act), Fair Work Act 2009 (FW Act) and the Independent Contractors Act 2006. In addition, FWBII ensures compliance with the Building Code 2013 (Building Code).
Our vision is that all Australian building and construction workplaces are productive and harmonious.
Our mission is to ensure that the rule of law prevails in the Australian building and construction industry.
Delivery Provide information, advice and education on the requirements and flexibilities of workplace laws to foster voluntary compliance.
Investigate claims regarding alleged breaches of workplace laws and undertake targeted activities.
Conduct site visits, inspections and audits involving the building codes of practice.
Litigate, where necessary, to enforce compliance with workplace laws.
Performance information
Year Performance criteria Targets
2015–16 Level of satisfaction of clients with quality and timeliness of advice and assistance provided by FWBII
75% of surveyed clients satisfied or highly satisfied
Assessment: target is expected to be met in 2015–16
Timeliness in commencing proceedings over contraventions of the Fair Work Act 2009, the Independent Contractors Act 2006, the Fair Work (Building Industry) Act 2012, agreements, awards and orders
File 75% of matters in court within 12 months of the complaint being lodged
Assessment: target is not expected to be met in 2015–16
Level of satisfaction of a range of industry participants with contact aimed at promoting appropriate standards of conduct.
75% of surveyed industry participants satisfied or highly satisfied
Assessment: target is expected to be met in 2015–16
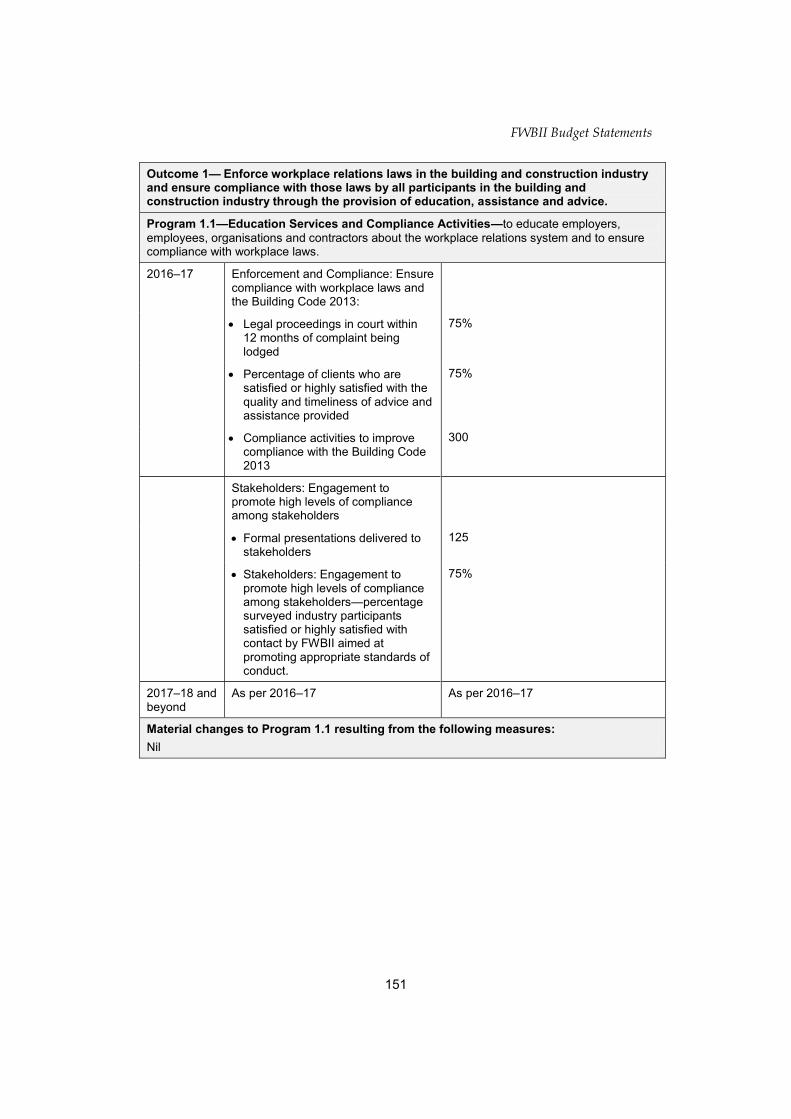
FWBII Budget Statements
151
Outcome 1— Enforce workplace relations laws in the building and construction industry and ensure compliance with those laws by all participants in the building and construction industry through the provision of education, assistance and advice.
Program 1.1—Education Services and Compliance Activities—to educate employers,
employees, organisations and contractors about the workplace relations system and to ensure compliance with workplace laws.
2016–17 Enforcement and Compliance: Ensure compliance with workplace laws and the Building Code 2013:
Legal proceedings in court within 12 months of complaint being lodged
75%
Percentage of clients who are satisfied or highly satisfied with the quality and timeliness of advice and assistance provided
75%
Compliance activities to improve compliance with the Building Code 2013
300
Stakeholders: Engagement to promote high levels of compliance among stakeholders
Formal presentations delivered to stakeholders
125
Stakeholders: Engagement to promote high levels of compliance among stakeholders—percentage surveyed industry participants satisfied or highly satisfied with contact by FWBII aimed at promoting appropriate standards of conduct.
75%
2017–18 and beyond
As per 2016–17 As per 2016–17
Material changes to Program 1.1 resulting from the following measures:
Nil
FWBII Budget Statements
152
Section 3: Budgeted financial statements
Section 3 presents budgeted financial statements which provide a comprehensive snapshot of entity finances for the 2016–17 budget year, including the impact of budget measures and resourcing on financial statements.
3.1 BUDGETED FINANCIAL STATEMENTS
3.1.1 Differences between entity resourcing and financial statements
The Agency Resource Statement (Table 1.1) details the total appropriation available to an agency from all sources. For departmental operating appropriations (outputs) this includes carry-forward amounts as well as amounts appropriated at Budget. As agencies incur and are funded for future liabilities and employee entitlements, the total amount of departmental operating appropriation available to an agency is unlikely to be fully utilised in the Budget year. The difference between the agency resource statement and the sum of all payments made at the departmental outputs level is the expected carry-forward amount of resources for the 2016–17 Budget year, including amounts related to meeting future employee entitlement obligations.
3.1.2 Explanatory notes and analysis of budgeted financial statements
The Fair Work Building Industry Inspectorate is budgeting for an operating loss equal to the unappropriated depreciation and amortisation expense of $1.1 million for the 2016–17 financial year.
Total revenues are estimated to be $33.4 million and total expenses $34.5 million.
Total assets at the end of the 2016–17 financial year are estimated to be $49.7 million. The majority of the assets represent receivables (appropriations receivable) and property fit outs. Asset acquisitions are planned in Information Technology equipment and systems and on office accommodation fit outs.
Total liabilities for 2016–17 are estimated at $5.8 million. The largest liability item is accrued employee entitlements.

FWBII Budget Statements
153
3.2.1 BUDGETED FINANCIAL STATEMENTS TABLES
Table 3.1: Comprehensive income statement (showing net cost of services) for the period ended 30 June
2015–16
Estimated
actual
$'000
2016–17
Budget
$'000
2017–18
Forw ard
estimate
$'000
2018–19
Forw ard
estimate
$'000
2019–20
Forw ard
estimate
$'000
EXPENSES
Employee benefits 18,550 18,424 18,637 18,936 19,079
Suppliers 15,583 15,020 14,953 14,955 15,149
Depreciation and amortisation 1,053 1,072 1,122 1,122 1,122
Total expenses 35,186 34,516 34,712 35,013 35,350
LESS:
OWN-SOURCE INCOME
Own-source revenue
Other 539 370 370 370 370
Total own-source revenue 539 370 370 370 370
Gains
Other 35 35 35 35 35
Total gains 35 35 35 35 35
Total own-source income 574 405 405 405 405
Net (cost of)/contribution by services (34,612) (34,111) (34,307) (34,608) (34,945)
Revenue from Government 33,559 33,039 33,185 33,486 33,823
Surplus/(deficit) attributable to the
Australian Government (1,053) (1,072) (1,122) (1,122) (1,122)
OTHER COMPREHENSIVE INCOME
Changes in asset revaluation surplus - - - - -
Total other comprehensive income - - - - -
Total comprehensive income/(loss) (1,053) (1,072) (1,122) (1,122) (1,122)
Total comprehensive income/(loss)
attributable to the Australian
Government (1,053) (1,072) (1,122) (1,122) (1,122)

FWBII Budget Statements
154
Table 3.1: Comprehensive income statement (showing net cost of services) for the period ended 30 June (continued)
Note: Impact of net cash appropriation arrangements
(a) From 2010–11, the Government introduced net cash appropriation arrangements where Bill 1 revenue
appropriations for the depreciation/amortisation expenses of non-corporate Commonwealth entities (and select corporate Commonwealth entities) were replaced with a separate capital budget (the Departmental Capital Budget, or DCB) provided through Bill 1 equity appropriations. For information regarding DCBs, please refer to Table 3.5 Departmental Capital Budget Statement.
Prepared on Australian Accounting Standards basis.
2015–16
$'000
2016–17
$'000
2017–18
$'000
2018–19
$'000
2019–20
$'000
Total comprehensive income/(loss)
excluding depreciation/amortisation
expenses previously funded through
revenue appropriations.
- - - - -
less depreciation/amortisation expenses
previously funded through revenue
appropriations (a)
1,053 1,072 1,122 1,122 1,122
Total comprehensive income/(loss)
—as per the statement of
comprehensive income
(1,053) (1,072) (1,122) (1,122) (1,122)
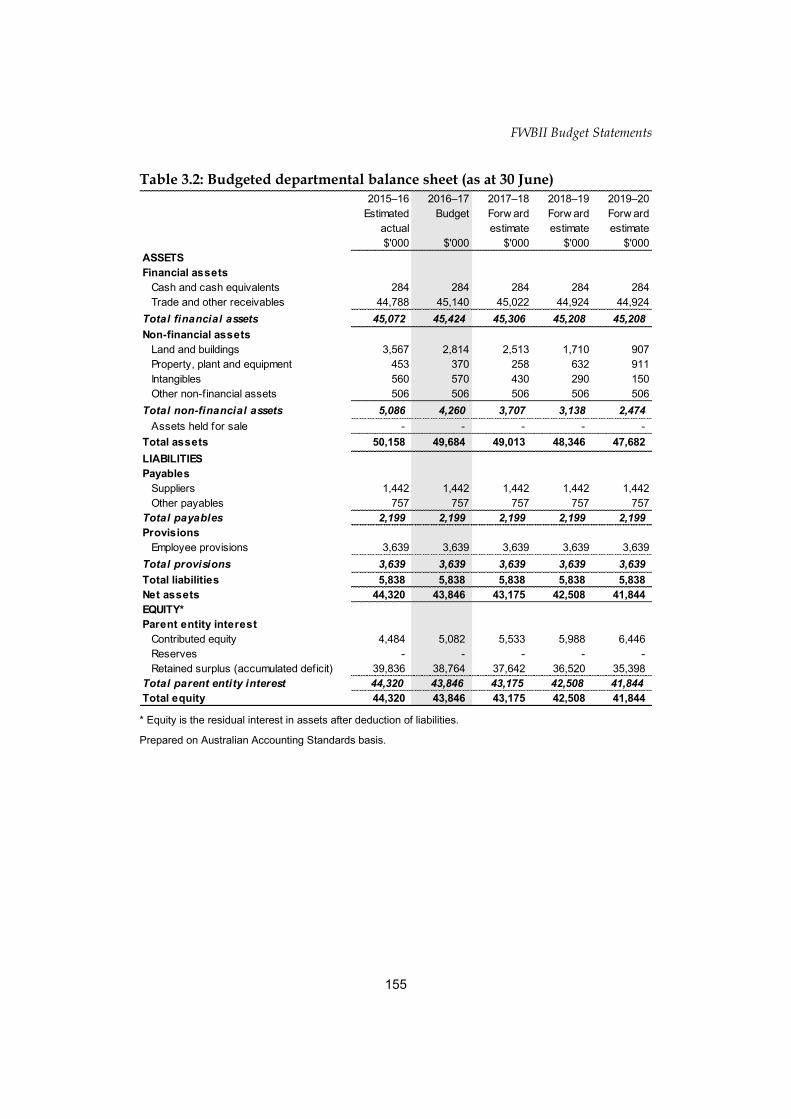
FWBII Budget Statements
155
Table 3.2: Budgeted departmental balance sheet (as at 30 June)
* Equity is the residual interest in assets after deduction of liabilities.
Prepared on Australian Accounting Standards basis.
2015–16
Estimated
actual
$'000
2016–17
Budget
$'000
2017–18
Forw ard
estimate
$'000
2018–19
Forw ard
estimate
$'000
2019–20
Forw ard
estimate
$'000
ASSETS
Financial assets
Cash and cash equivalents 284 284 284 284 284
Trade and other receivables 44,788 45,140 45,022 44,924 44,924
Total financial assets 45,072 45,424 45,306 45,208 45,208
Non-financial assets
Land and buildings 3,567 2,814 2,513 1,710 907
Property, plant and equipment 453 370 258 632 911
Intangibles 560 570 430 290 150
Other non-financial assets 506 506 506 506 506
Total non-financial assets 5,086 4,260 3,707 3,138 2,474
Assets held for sale - - - - -
Total assets 50,158 49,684 49,013 48,346 47,682
LIABILITIES
Payables
Suppliers 1,442 1,442 1,442 1,442 1,442
Other payables 757 757 757 757 757
Total payables 2,199 2,199 2,199 2,199 2,199
Provisions
Employee provisions 3,639 3,639 3,639 3,639 3,639
Total provisions 3,639 3,639 3,639 3,639 3,639
Total liabilities 5,838 5,838 5,838 5,838 5,838
Net assets 44,320 43,846 43,175 42,508 41,844
EQUITY*
Parent entity interest
Contributed equity 4,484 5,082 5,533 5,988 6,446
Reserves - - - - -
Retained surplus (accumulated deficit) 39,836 38,764 37,642 36,520 35,398
Total parent entity interest 44,320 43,846 43,175 42,508 41,844
Total equity 44,320 43,846 43,175 42,508 41,844

FWBII Budget Statements
156
Table 3.3: Departmental statement of changes in equity—summary of movement (Budget year 2016–17)
Prepared on Australian Accounting Standards basis.
Retained
earnings
$'000
Asset
revaluation
reserve
$'000
Contributed
equity/
capital
$'000
Total equity
$'000
Opening balance as at 1 July 2016
Balance carried forw ard from previous period 39,836 - 4,484 44,320
Adjusted opening balance 39,836 - 4,484 44,320
Comprehensive income
Surplus/(deficit) for the period (1,072) - - (1,072)
Total comprehensive income (1,072) - - (1,072)
Transactions with owners
Contributions by owners
Equity injection - Appropriation - - 150 150
Departmental capital budget (DCB) - - 448 448
Sub-total transactions with owners - - 598 598
Estimated closing balance as at 30 June 2017 38,764 - 5,082 43,846
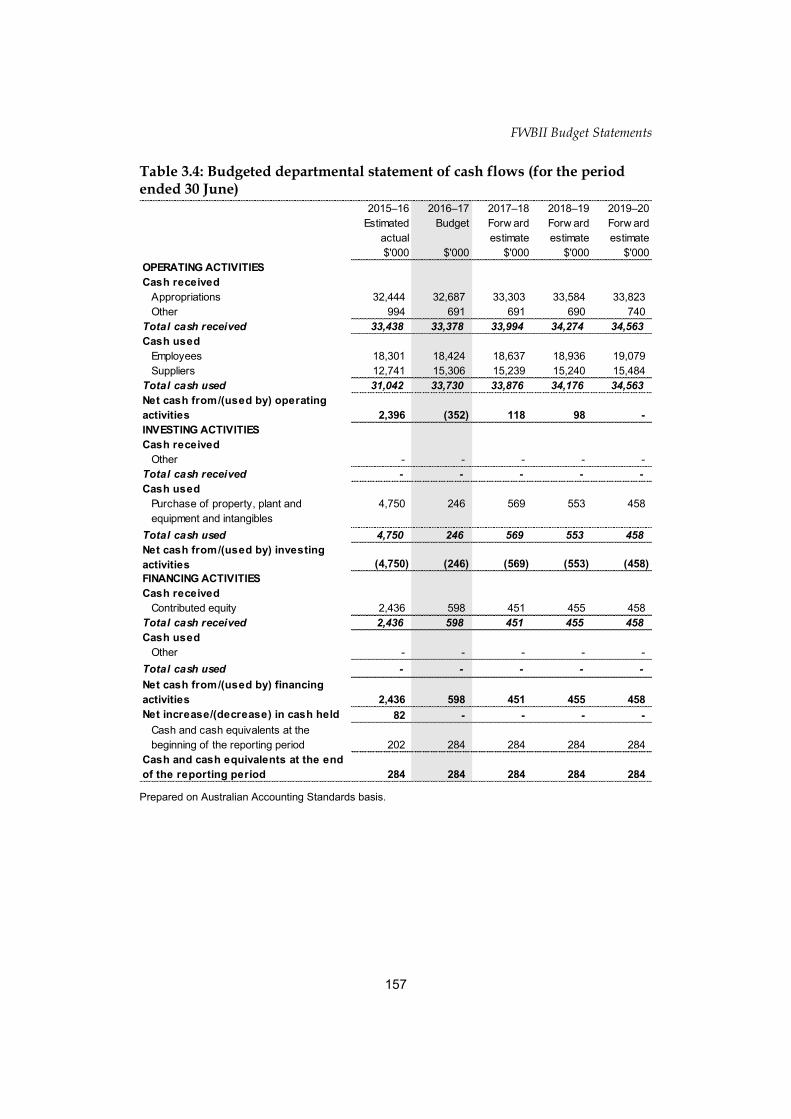
FWBII Budget Statements
157
Table 3.4: Budgeted departmental statement of cash flows (for the period ended 30 June)
Prepared on Australian Accounting Standards basis.
2015–16
Estimated
actual
$'000
2016–17
Budget
$'000
2017–18
Forw ard
estimate
$'000
2018–19
Forw ard
estimate
$'000
2019–20
Forw ard
estimate
$'000
OPERATING ACTIVITIES
Cash received
Appropriations 32,444 32,687 33,303 33,584 33,823
Other 994 691 691 690 740
Total cash received 33,438 33,378 33,994 34,274 34,563
Cash used
Employees 18,301 18,424 18,637 18,936 19,079
Suppliers 12,741 15,306 15,239 15,240 15,484
Total cash used 31,042 33,730 33,876 34,176 34,563
Net cash from/(used by) operating
activities 2,396 (352) 118 98 -
INVESTING ACTIVITIES
Cash received
Other - - - - -
Total cash received - - - - -
Cash used
Purchase of property, plant and
equipment and intangibles
4,750 246 569 553 458
Total cash used 4,750 246 569 553 458
Net cash from/(used by) investing
activities (4,750) (246) (569) (553) (458)
FINANCING ACTIVITIES
Cash received
Contributed equity 2,436 598 451 455 458
Total cash received 2,436 598 451 455 458
Cash used
Other - - - - -
Total cash used - - - - -
Net cash from/(used by) financing
activities 2,436 598 451 455 458
Net increase/(decrease) in cash held 82 - - - -
Cash and cash equivalents at the
beginning of the reporting period 202 284 284 284 284
Cash and cash equivalents at the end
of the reporting period 284 284 284 284 284

FWBII Budget Statements
158
Table 3.5: Departmental capital budget statement (for the period ended 30 June)
(a) Includes both current Bill 2 and prior Act 2/4/6 appropriations and special capital appropriations. (b) Does not include annual finance lease costs. Includes purchases from current and previous years’
Departmental capital budgets (DCBs). (c) Includes the following sources of funding:
- current Bill 1 and prior year Act 1/3/5 appropriations (excluding amounts from the DCB); - internally developed assets; - s 74 Retained revenue receipts; and - proceeds from the sale of assets.
Prepared on Australian Accounting Standards basis.
2015–16
Estimated
actual
$'000
2016–17
Budget
$'000
2017–18
Forw ard
estimate
$'000
2018–19
Forw ard
estimate
$'000
2019–20
Forw ard
estimate
$'000
NEW CAPITAL APPROPRIATIONS
Capital budget - Bill 1 (DCB) 1,601 448 451 455 458
Equity injections - Bill 2 - 150 - - -
Total new capital appropriations 1,601 598 451 455 458
Provided for:
Purchase of non-financial assets 1,601 598 451 455 458
Total items 1,601 598 451 455 458
PURCHASE OF NON-FINANCIAL ASSETS
Funded by capital appropriations (a) - 150 - - -
Funded by capital appropriation - DCB (b) 836 96 569 553 458
Funded internally from departmental
resources (c)
3,914 - - - -
TOTAL 4,750 246 569 553 458
RECONCILIATION OF CASH USED TO
ACQUIRE ASSETS TO ASSET
MOVEMENT TABLE
Total purchases 4,750 246 569 553 458
Total cash used to acquire assets 4,750 246 569 553 458

FWBII Budget Statements
159
Table 3.6: Statement of asset movements (Budget year 2016–17)
(a) Appropriation equity refers to Appropriation Bill (No. 1) 2015–16 for depreciation/amortisation expenses,
DCBs or other operational expenses and equity injections appropriations provided through Appropriation Bill (No. 2) 2015–16, including CDABs.
Prepared on Australian Accounting Standards basis.
Buildings
$'000
Other
property, plant
and equipment
$'000
Computer
softw are and
intangibles
$'000
Total
$'000
As at 1 July 2016
Gross book value 11,859 1,242 1,494 14,595
Accumulated depreciation/amortisation
and impairment
(8,292) (789) (934) (10,015)
Opening net book balance 3,567 453 560 4,580
Capital asset additions
Estimated expenditure on new or
replacement assets
By purchase - appropriation equity (a) - 96 150 246
Total additions - 96 150 246
Other movements
Depreciation/amortisation expense (753) (179) (140) (1,072)
Total other movements (753) (179) (140) (1,072)
As at 30 June 2017
Gross book value 11,859 1,338 1,644 14,841
Accumulated depreciation/ amortisation
and impairment
(9,045) (968) (1,074) (11,087)
Closing net book balance 2,814 370 570 3,754

FWBII Budget Statements
160
Table 3.7: Schedule of budgeted income and expenses administered on behalf of Government (for the period ended 30 June)
The Fair Work Building Industry Inspectorate has no budgeted administered income or expenses. For this reason Table 3.7 is not presented.
Table 3.8: Schedule of budgeted assets and liabilities administered on behalf of Government (as at 30 June)
The Fair Work Building Industry Inspectorate has no budgeted administered assets or liabilities. For this reason Table 3.8 is not presented.
Table 3.9: Schedule of budgeted administered cash flows (for the period ended 30 June)
The Fair Work Building Industry Inspectorate has no budgeted administered cash flows. For this reason Table 3.9 is not presented.
Table 3.10: Administered capital budget statement (for the period ended 30 June)
The Fair Work Building Industry Inspectorate has no administered capital budget. For this reason Table 3.10 is not presented.
Table 3.11: Statement of administered asset movements (Budget year 2016–17) The Fair Work Building Industry Inspectorate has no administered non-financial assets. For this reason Table 3.11 is not presented.
Safe Work Australia
Entity resources and planned performance

SWA Budget Statements
163
SAFE WORK AUSTRALIA
Section 1: Entity overview and resources .............................................................. 165
1.1 Strategic direction statement ........................................................................ 165
1.2 Entity resource statement ............................................................................. 167
1.3 Budget measures .......................................................................................... 168
Section 2: Outcomes and planned performance ................................................... 169
2.1 Budgeted expenses and performance for Outcome 1 .................................. 170
Section 3: Budgeted financial statements .............................................................. 174
3.1 Budgeted financial statements...................................................................... 174
3.2.1 Budgeted financial statements tables ........................................................... 175

SWA Budget Statements
165
SAFE WORK AUSTRALIA
Section 1: Entity overview and resources
1.1 STRATEGIC DIRECTION STATEMENT
Safe Work Australia was established on 1 November 2009 as a Statutory Agency under the Safe Work Australia Act 2008 (the Act). The agency operates under the Commonwealth Government's accountability and governance frameworks.
Safe Work Australia is the body leading the development of national policy to improve work health and safety and workers’ compensation across Australia. Safe Work Australia works collaboratively with regulators, industry and worker associations and the community, to realise the national vision of healthy, safe and productive working lives.
The future direction for Safe Work Australia will continue the effective delivery of strategies articulated through the corporate plan so Australia can become a world leader in the delivery of work health and safety and workers’ compensation outcomes.
The establishment of Safe Work Australia was provided for in the Intergovernmental Agreement for Regulatory and Operational Reform in Occupational Health and Safety (IGA), agreed by the Council of Australian Governments (COAG) on 3 July 2008.
The agency is jointly funded by the Commonwealth, state and territory governments. This funding arrangement promotes collaboration with jurisdictions on policy development, implementation, compliance and enforcement, and communication activities.
Safe Work Australia has 15 Members, including an independent Chair, nine Members representing the Commonwealth and each state and territory, two Members representing the interests of employers, two representing the interests of employees, and the Chief Executive Officer of Safe Work Australia (CEO).
The CEO manages the agency under section 45 of the Act and is the Accountable Authority in accordance with the Public Governance, Performance and Accountability Act 2013.
Together, the Safe Work Australia Members and the agency work to achieve :
significant and continued reductions in the incidence of work-related death, injury and illness through:
– an improved and reformed work health and safety framework

SWA Budget Statements
166
– increased work health and safety awareness and skills
– an evidence base which informs policy and practice
– reduced exposure to work-related hazards causing injury and illness
– improved quality of workplace controls
improved outcomes for injured workers and their employers through more effective, efficient, clearly understood and sustainable workers’ compensation arrangements.
During 2016–17, Safe Work Australia will continue to be a model for the innovative development of multi-stakeholder policy. We will do this by:
bringing together and recognising varying views and interests to develop effective national policy to improve work health and safety and workers’ compensation outcomes
using our influence and innovative technologies to increase health and safety knowledge and capability and to integrate work health and safety into normal business practices
being a key source of work health and safety and workers’ compensation research and data
improving workers’ compensation arrangements with a particular focus on return to work outcomes
developing and progressing policy proposals that will lead to nationally consistent explosives regulation
working with other countries or international organisations and representing Australia at relevant forums to share data, information and knowledge on work health and safety and workers’ compensation matters to improve Australian outcomes.

SWA Budget Statements
167
1.2 ENTITY RESOURCE STATEMENT
Table 1.1 shows the total funding from all sources available to the entity for its operations and to deliver programs and services on behalf of the government.
The table summarises how resources will be applied by outcome (government strategic policy objectives) and by administered (on behalf of the government or the public) and departmental (for the entity’s operations) classification.
For more detailed information please refer to Budget Paper No. 4—Agency Resourcing.
Information in this table is presented on a resourcing (i.e. appropriations/cash available) basis, whilst the ‘Budgeted expenses by Outcome 1’ tables in Section 2 and the financial statements in Section 3 are presented on an accrual basis.
Table 1.1: Safe Work Australia resource statement—Budget estimates for 2016–17 as at Budget May 2016
Prepared on a resourcing (i.e. appropriations available) basis. Please note: All figures shown above are GST exclusive—these may not match figures in the cash flow statement.
(a) Appropriation Bill (No.1) 2016–17. (b) Departmental capital budgets are not separately identified in Appropriation Bill (No.1) and form part of
ordinary annual services items. Please refer to Table 3.5 for further details. For accounting purposes, this amount has been designated as a 'contribution by owner’.
(c) Excludes 'Special Public Money' held in accounts like Other Trust Monies accounts (OTM). (d) Amounts credited to the special account(s) from Safe Work Australia’s annual and special
appropriations.
2015–16
Estimated
actual
$'000
2016–17
Estimate
$'000
Departmental
Annual appropriations - ordinary annual services (a)
Departmental appropriation 9,625 9,740
Departmental capital budget (b) 73 81
Total departmental annual appropriations 9,698 9,821
Special accounts (c)
Opening balance 12,342 12,042
Appropriation receipts (d) 9,698 9,821
Non-appropriation receipts 11,038 11,151
Total special accounts 33,078 33,014
less departmental appropriations drawn from annual/special
appropriations and credited to special accounts (9,698) (9,821)
Total departmental resourcing 33,078 33,014
Total resourcing for Safe Work Australia 33,078 33,014
2015–16 2016–17
Average staffing level (number) 101 101

SWA Budget Statements
168
1.3 BUDGET MEASURES
Budget measures in Part 1 relating to Safe Work Australia are detailed in Budget Paper No. 2 and summarised below.
Table 1.2: Entity 2016–17 Budget measures
Part 1: Measures announced since the 2015–16 Mid-Year Economic and Fiscal Outlook (MYEFO)
Safe Work Australia does not have any new measures since the 2015–16 MYEFO. For this reason Part 1 of Table 1.2 is not presented.
Part 2: Other measures not previously reported in a portfolio statement
(a) This measure was first published in the 2015–16 Mid-Year Economic and Fiscal Outlook. (b) This measure was first published in the 2014–15 Mid-Year Economic and Fiscal Outlook.
Prepared on a Government Finance Statistics (fiscal) basis. Figures displayed as a negative (-) represent a decrease in funds and a positive (+) represent an increase in funds.
Program
2015–16
$'000
2016–17
$'000
2017–18
$'000
2018–19
$'000
2019–20
$'000
Measures
Public Sector Savings - Shared and
Common Services Programme (a)
1
Administered expenses - - - - -
Departmental expenses - (15) (29) (29) -
Total - (15) (29) (29) -
Public Sector Superannuation
Accumulation Plan administration
fees(b)
1
Administered expenses - - - - -
Departmental expenses (7) (7) (7) (7) (7)
Total (7) (7) (7) (7) (7)
Total measures
Administered - - - - -
Departmental (7) (22) (36) (36) (7)
Total (7) (22) (36) (36) (7)

SWA Budget Statements
169
Section 2: Outcomes and planned performance
Government outcomes are the intended results, impacts or consequences of actions by the Government on the Australian community. Commonwealth programs are the primary vehicle by which government entities achieve the intended results of their outcome statements. Entities are required to identify the programs which contribute to government outcomes over the Budget and forward years.
Each outcome is described below together with its related programs. The following provides detailed information on expenses for each outcome and program, further broken down by funding source.
Note:
From 1 July 2015, performance reporting requirements in the Portfolio Budget Statements sit alongside those required under the enhanced commonwealth performance framework. It is anticipated that the performance criteria described in Portfolio Budget Statements will be read with broader information provided in an entity’s corporate plans and annual performance statements—included in Annual Reports from October 2016—to provide an entity’s complete performance story.
SWA Budget Statements
170
2.1 BUDGETED EXPENSES AND PERFORMANCE FOR OUTCOME 1
Outcome 1: Healthier, safer and more productive workplaces through improvements to Australian work health and safety and workers’ compensation arrangements.
Linked programs
Department of Health
Programs
Program 5.1—Protect the Health and Safety of the Community through Regulation.
Contribution to Outcome 1 made by linked programs
Safe Work Australia contributes to the protection of the health and safety of the Australian Community through effective management of risks arising from industrial chemicals through Australian work health and safety and workers' compensation arrangements (5.1).

SWA Budget Statements
171
Budgeted expenses for Outcome 1
This table shows how much the entity intends to spend (on an accrual basis) on achieving the outcome, broken down by program, as well as by Administered and Departmental funding sources.
Table 2.1.1: Budgeted expenses for Outcome 1
(a) Estimated expenses incurred in relation to receipts retained under section 74 of the Public Governance,
Performance and Accountability Act 2013. (b) Expenses not requiring appropriation in the Budget year are made up of depreciation expenses,
amortisation expenses and audit fees.
Note: Departmental appropriation splits and totals are indicative estimates and may change in the course of the budget year as government priorities change.
2015–16
Estimated
actual
$'000
2016–17
Budget
$'000
2017–18
Forw ard
estimate
$'000
2018–19
Forw ard
estimate
$'000
2019–20
Forw ard
estimate
$'000
Departmental expenses
Departmental appropriation (a) 9,625 9,740 10,145 10,382 10,675
Special accounts 10,028 10,137 10,183 10,419 10,681
Expenses not requiring
appropriation in the Budget
year (b)
246 332 275 281 281
Departmental total 19,899 20,209 20,603 21,082 21,637
Total expenses for
Program 1.1 19,899 20,209 20,603 21,082 21,637
Departmental expenses
Departmental appropriation 9,625 9,740 10,145 10,382 10,675
Special accounts 10,028 10,137 10,183 10,419 10,681
Expenses not requiring
appropriation in the Budget year (b)
246 332 275 281 281
Departmental total 19,899 20,209 20,603 21,082 21,637
Total expenses for Outcome 1 19,899 20,209 20,603 21,082 21,637
2015–16 2016–17
Average staffing level (number) 101 101
Program 1.1: Reform of and improvements to Australian work health and safety and
workers' compensation arrangements
Outcome 1 Totals by appropriation type

SWA Budget Statements
172
Table 2.1.2: Performance criteria for Outcome 1
Table 2.1.2 below details the performance criteria for each program associated with Outcome 1. It also summarises how each program is delivered and where 2016–17 Budget measures have created new programs or materially changed existing programs.
Outcome 1: Healthier, safer and more productive workplaces through improvements to Australian work health and safety and workers' compensation arrangements.
Purpose Safe Work Australia has an important national role to achieve significant and continual reductions in the incidence of work-related death, injury and illness and to improve outcomes for injured workers and their employers.
To be able to meet its objectives Safe Work Australia works collaboratively with regulators, industry and employee associations and the community to achieve healthy, safe and productive working lives for all Australians.
Program 1.1: Reform of and improvements to Australian work health and safety and workers' compensation arrangements contribute to Outcome 1 by the innovative
development of multi-stakeholder policy and being central to Australia becoming a world leader in the delivery of improved safety and compensation outcomes.
Delivery The deliverables for Safe Work Australia are highlighted in its annual operational plan:
• Coordinate and report on the progress of national activities being implemented to assist in the achievement of the outcomes and targets outlined in the Australian Work Health and Safety Strategy 2012–2022.
• Develop and deliver high-quality, innovative and engaging material and undertake activities that
– improve work health and safety capability
– integrate work health and safety into normal business practices
– provide accessible, effective and practical information to aid understanding and compliance particularly for individuals and small business.
• Collect, maintain, improve and report on national work health and safety and workers' compensation data.
• Undertake and disseminate research and analysis on emerging work health and safety and workers’ compensation issues to identify new priorities and areas for policy and program development.
• Monitor, evaluate and remove unnecessary regulation to enhance the model Work Health and Safety laws to improve safety outcomes and address issues impeding the effective and efficient operation of the laws.
• Improve workers' compensation arrangements with a particular focus on improving return to work outcomes.
• Develop and progress policy proposals that will lead to nationally consistent explosives regulation.
• Work with other countries or international organisations and represent Australia at relevant forums (as appropriate) to share data, information and/or knowledge on work health and safety and workers' compensation matters.

SWA Budget Statements
173
Performance information
Year Performance criteria Targets
2015–16 The work health and safety framework continues to be developed, implemented and reviewed in accordance with COAG requirements.
COAG requirements are met.
Level of satisfaction of the Chair of Safe Work Australia with how the agency is achieving the deliverables of its operational plan.
Chair rates the performance of the agency as very good or above.
Level of satisfaction of the Members of Safe Work Australia with how the agency is achieving the deliverables of its operational plan.
80% of Members agree the agency is achieving the deliverables of its operational plan.
2016–17 Activities in the Operational Plan are delivered to the expected quality, on time and within budget
Reductions in the incidence of work-related death, injury and illness through:
• an improved and reformed work health and safety framework
• increased work health and safety awareness and skills
• developing and maintaining an evidence base which informs policy and practice
• reduced exposure to work-related hazards causing injury and illness, and
• improved quality of workplace controls.
80% of Members and the Chair are satisfied with the agency achievements
By 2022:
• reduce workplace fatalities due to injury by 20 per cent or more
• reduce the incidence rate of serious workers’ compensation claims by 30 per cent or more, and
• reduce the incidence rate of serious workers’ compensation claims for musculoskeletal claims by 30 per cent or more.
2017–18 and beyond
As per 2016–17 As per 2016–17
Material changes to Program 1.1 resulting from the following measures:
Nil
SWA Budget Statements
174
Section 3: Budgeted financial statements
Section 3 presents budgeted financial statements which provide a comprehensive snapshot of entity finances for the 2016–17 budget year, including the impact of budget measures and resourcing on financial statements.
3.1 BUDGETED FINANCIAL STATEMENTS
3.1.1 Differences between entity resourcing and financial statements
Safe Work Australia receives funds from states and territories and matched appropriation funding from the Commonwealth as provided for in the IGA.
3.1.2 Explanatory notes and analysis of budgeted financial statements
The agency is not expecting any major changes in its operations from a financial perspective. Funding arrangements are provided for in the IGA.
Safe Work Australia is budgeting for an operating loss equal to the unappropriated depreciation and amortisation expense of $0.3 million for the 2016–17 financial year.
Total revenues are estimated to be $19.9 million and total expenses $20.2 million.
Total assets at the end of the 2016–17 financial year are estimated to be $13.2 million. The majority of the assets represent receivables (appropriations receivable).
Total liabilities for 2016–17 are estimated at $5.8 million. The largest liability item is accrued employee entitlements.

SWA Budget Statements
175
3.2.1 BUDGETED FINANCIAL STATEMENTS TABLES
Table 3.1: Comprehensive income statement (showing net cost of services) for the period ended 30 June
2015–16
Estimated
actual
$'000
2016–17
Budget
$'000
2017–18
Forw ard
estimate
$'000
2018–19
Forw ard
estimate
$'000
2019–20
Forw ard
estimate
$'000
EXPENSES
Employee benefits 12,868 13,008 13,355 13,868 14,752
Suppliers 6,745 6,829 6,933 6,893 6,564
Grants 100 100 100 100 100
Depreciation and amortisation 186 272 215 221 221
Total expenses 19,899 20,209 20,603 21,082 21,637
LESS:
OWN-SOURCE INCOME
Own-source revenue
Sale of goods and rendering of services 10,028 10,137 10,183 10,419 10,681
Total own-source revenue 10,028 10,137 10,183 10,419 10,681
Gains
Other 60 60 60 60 60
Total gains 60 60 60 60 60
Total own-source income 10,088 10,197 10,243 10,479 10,741
Net (cost of)/contribution by
services (9,811) (10,012) (10,360) (10,603) (10,896)
Revenue from Government 9,625 9,740 10,145 10,382 10,675
Surplus/(deficit) attributable to the
Australian Government(186) (272) (215) (221) (221)
Total comprehensive income/(loss) (186) (272) (215) (221) (221)
Total comprehensive income/(loss)
attributable to the Australian
Government (186) (272) (215) (221) (221)

SWA Budget Statements
176
Table 3.1: Comprehensive income statement (showing net cost of services) for the period ended 30 June (continued)
Note: Impact of net cash appropriation arrangements
(a) From 2010–11, the Government introduced net cash appropriation arrangements where Bill 1 revenue
appropriations for the depreciation/amortisation expenses of non-corporate Commonwealth entities (and select corporate Commonwealth entities) were replaced with a separate capital budget (the Departmental Capital Budget, or DCB) provided through Bill 1 equity appropriations. For information regarding DCBs, please refer to Table 3.5 Departmental Capital Budget Statement.
Prepared on Australian Accounting Standards basis.
2015–16
$'000
2016–17
$'000
2017–18
$'000
2018–19
$'000
2019–20
$'000
Total comprehensive income/(loss)
excluding depreciation/amortisation
expenses previously funded
through revenue appropriations.
- - - - -
less depreciation/amortisation
expenses previously funded through
revenue appropriations (a)
186 272 215 221 221
Total comprehensive income/(loss)
—as per the statement of
comprehensive income
(186) (272) (215) (221) (221)
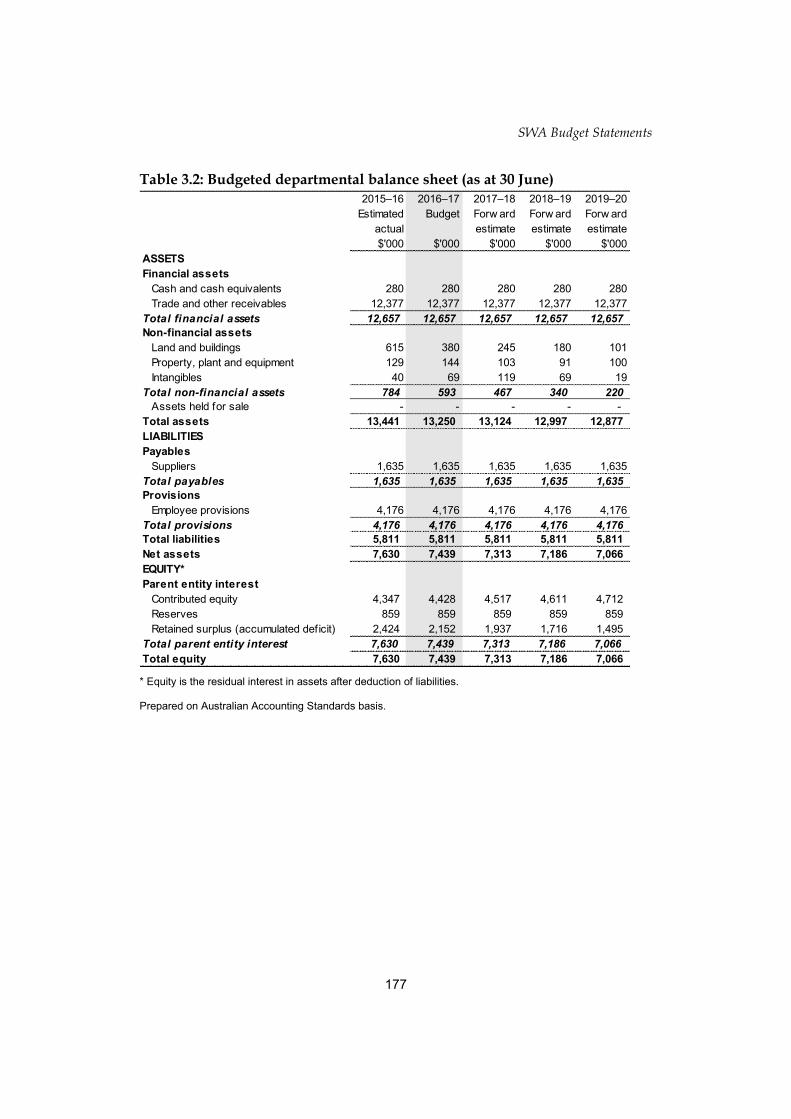
SWA Budget Statements
177
Table 3.2: Budgeted departmental balance sheet (as at 30 June)
* Equity is the residual interest in assets after deduction of liabilities. Prepared on Australian Accounting Standards basis.
2015–16
Estimated
actual
$'000
2016–17
Budget
$'000
2017–18
Forw ard
estimate
$'000
2018–19
Forw ard
estimate
$'000
2019–20
Forw ard
estimate
$'000
ASSETS
Financial assets
Cash and cash equivalents 280 280 280 280 280
Trade and other receivables 12,377 12,377 12,377 12,377 12,377
Total financial assets 12,657 12,657 12,657 12,657 12,657
Non-financial assets
Land and buildings 615 380 245 180 101
Property, plant and equipment 129 144 103 91 100
Intangibles 40 69 119 69 19
Total non-financial assets 784 593 467 340 220
Assets held for sale - - - - -
Total assets 13,441 13,250 13,124 12,997 12,877
LIABILITIES
Payables
Suppliers 1,635 1,635 1,635 1,635 1,635
Total payables 1,635 1,635 1,635 1,635 1,635
Provisions
Employee provisions 4,176 4,176 4,176 4,176 4,176
Total provisions 4,176 4,176 4,176 4,176 4,176
Total liabilities 5,811 5,811 5,811 5,811 5,811
Net assets 7,630 7,439 7,313 7,186 7,066
EQUITY*
Parent entity interest
Contributed equity 4,347 4,428 4,517 4,611 4,712
Reserves 859 859 859 859 859
Retained surplus (accumulated deficit) 2,424 2,152 1,937 1,716 1,495
Total parent entity interest 7,630 7,439 7,313 7,186 7,066
Total equity 7,630 7,439 7,313 7,186 7,066
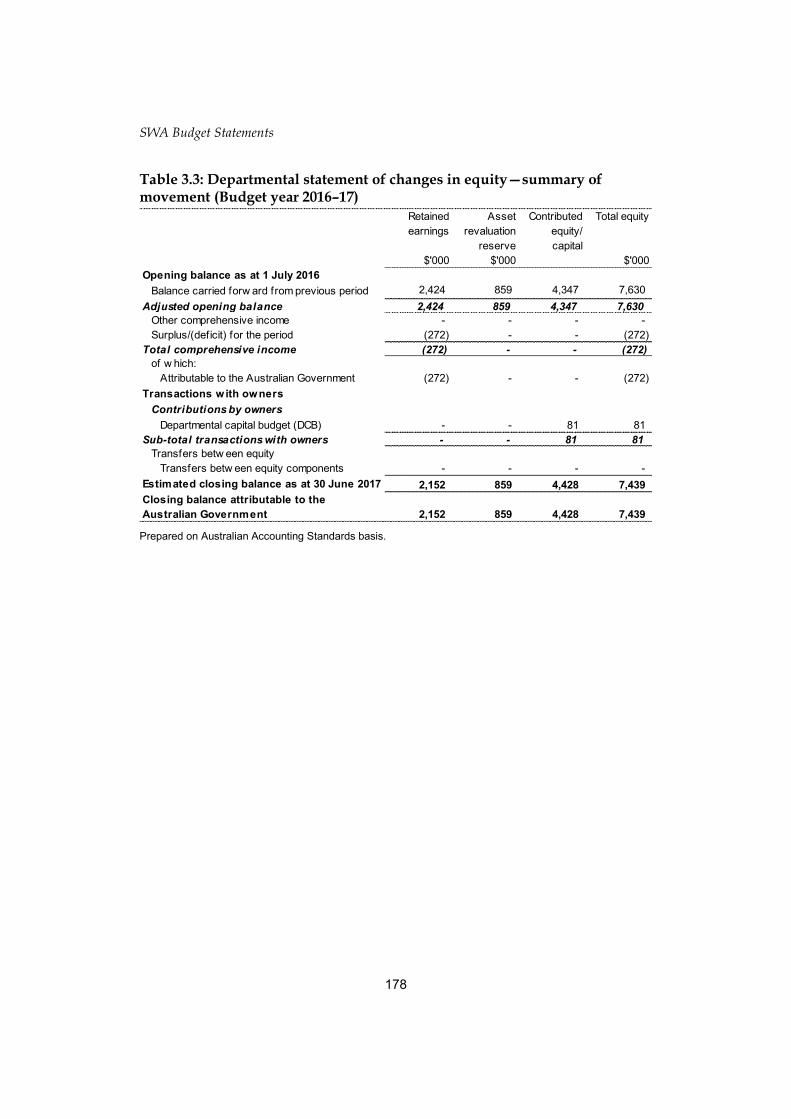
SWA Budget Statements
178
Table 3.3: Departmental statement of changes in equity—summary of movement (Budget year 2016–17)
Prepared on Australian Accounting Standards basis.
Retained
earnings
$'000
Asset
revaluation
reserve
$'000
Contributed
equity/
capital
Total equity
$'000
Opening balance as at 1 July 2016
Balance carried forw ard from previous period 2,424 859 4,347 7,630
Adjusted opening balance 2,424 859 4,347 7,630
Other comprehensive income - - - -
Surplus/(deficit) for the period (272) - - (272)
Total comprehensive income (272) - - (272)
of w hich:
Attributable to the Australian Government (272) - - (272)
Transactions with owners
Contributions by owners
Departmental capital budget (DCB) - - 81 81
Sub-total transactions with owners - - 81 81
Transfers betw een equity
Transfers betw een equity components - - - -
Estimated closing balance as at 30 June 2017 2,152 859 4,428 7,439
Closing balance attributable to the
Australian Government 2,152 859 4,428 7,439
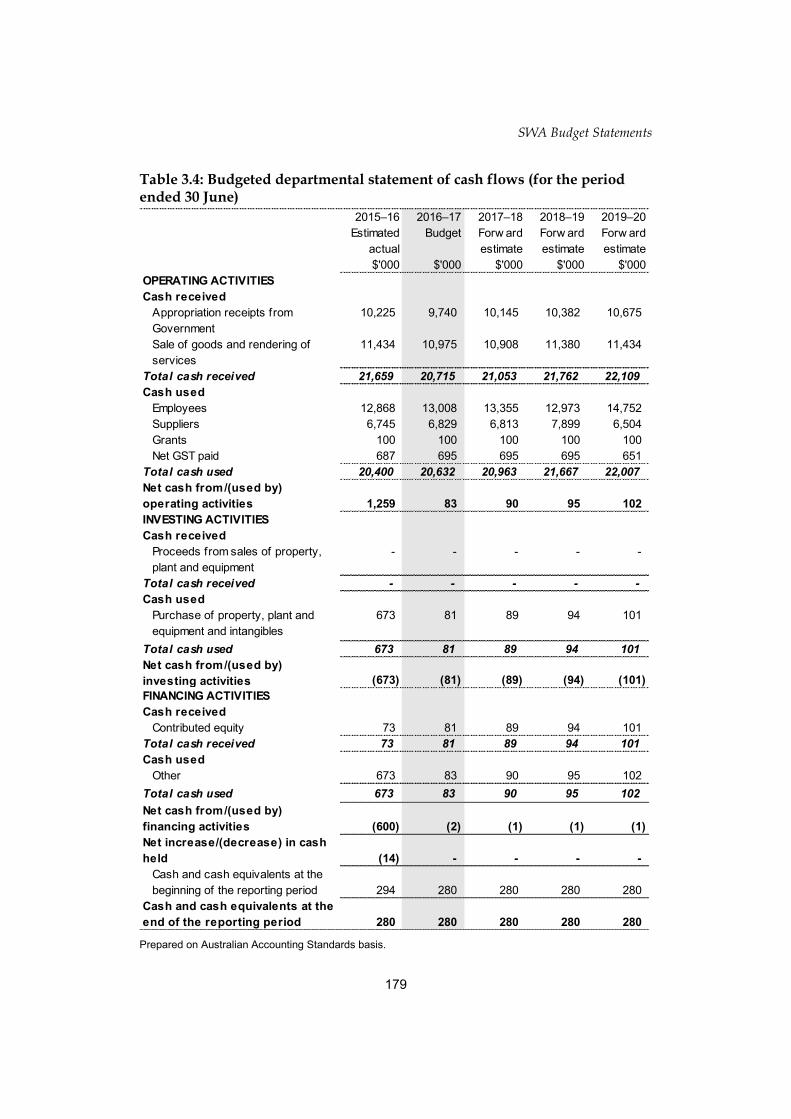
SWA Budget Statements
179
Table 3.4: Budgeted departmental statement of cash flows (for the period ended 30 June)
Prepared on Australian Accounting Standards basis.
2015–16
Estimated
actual
$'000
2016–17
Budget
$'000
2017–18
Forw ard
estimate
$'000
2018–19
Forw ard
estimate
$'000
2019–20
Forw ard
estimate
$'000
OPERATING ACTIVITIES
Cash received
Appropriation receipts from
Government
10,225 9,740 10,145 10,382 10,675
Sale of goods and rendering of
services
11,434 10,975 10,908 11,380 11,434
Total cash received 21,659 20,715 21,053 21,762 22,109
Cash used
Employees 12,868 13,008 13,355 12,973 14,752
Suppliers 6,745 6,829 6,813 7,899 6,504
Grants 100 100 100 100 100
Net GST paid 687 695 695 695 651
Total cash used 20,400 20,632 20,963 21,667 22,007
Net cash from/(used by)
operating activities 1,259 83 90 95 102
INVESTING ACTIVITIES
Cash received
Proceeds from sales of property,
plant and equipment
- - - - -
Total cash received - - - - -
Cash used
Purchase of property, plant and
equipment and intangibles
673 81 89 94 101
Total cash used 673 81 89 94 101
Net cash from/(used by)
investing activities (673) (81) (89) (94) (101)
FINANCING ACTIVITIES
Cash received
Contributed equity 73 81 89 94 101
Total cash received 73 81 89 94 101
Cash used
Other 673 83 90 95 102
Total cash used 673 83 90 95 102
Net cash from/(used by)
financing activities (600) (2) (1) (1) (1)
Net increase/(decrease) in cash
held (14) - - - -
Cash and cash equivalents at the
beginning of the reporting period 294 280 280 280 280
Cash and cash equivalents at the
end of the reporting period 280 280 280 280 280

SWA Budget Statements
180
Table 3.5: Departmental capital budget statement (for the period ended 30 June)
(a) Does not include annual finance lease costs. Includes purchases from current and previous years’
Departmental capital budgets (DCBs). (b) Includes the following sources of funding:
- current Bill 1 and prior year Act 1/3/5 appropriations (excluding amounts from the DCB); - internally developed assets; - s 74 Retained revenue receipts; and - proceeds from the sale of assets.
Prepared on Australian Accounting Standards basis.
2015–16
Estimated
actual
$'000
2016–17
Budget
$'000
2017–18
Forw ard
estimate
$'000
2018–19
Forw ard
estimate
$'000
2019–20
Forw ard
estimate
$'000
NEW CAPITAL APPROPRIATIONS
Capital budget - Bill 1 (DCB) 73 81 89 94 101
Total new capital appropriations 73 81 89 94 101
Provided for:
Purchase of non-financial assets 73 81 89 94 101
Total items 73 81 89 94 101
PURCHASE OF NON-FINANCIAL ASSETS
Funded by capital appropriation - DCB (a) 73 81 89 94 101
Funded internally from departmental
resources (b)
600 - - - -
TOTAL 673 81 89 94 101
RECONCILIATION OF CASH USED TO
ACQUIRE ASSETS TO ASSET
MOVEMENT TABLE
Total purchases 673 81 89 94 101
Total cash used to acquire assets 673 81 89 94 101
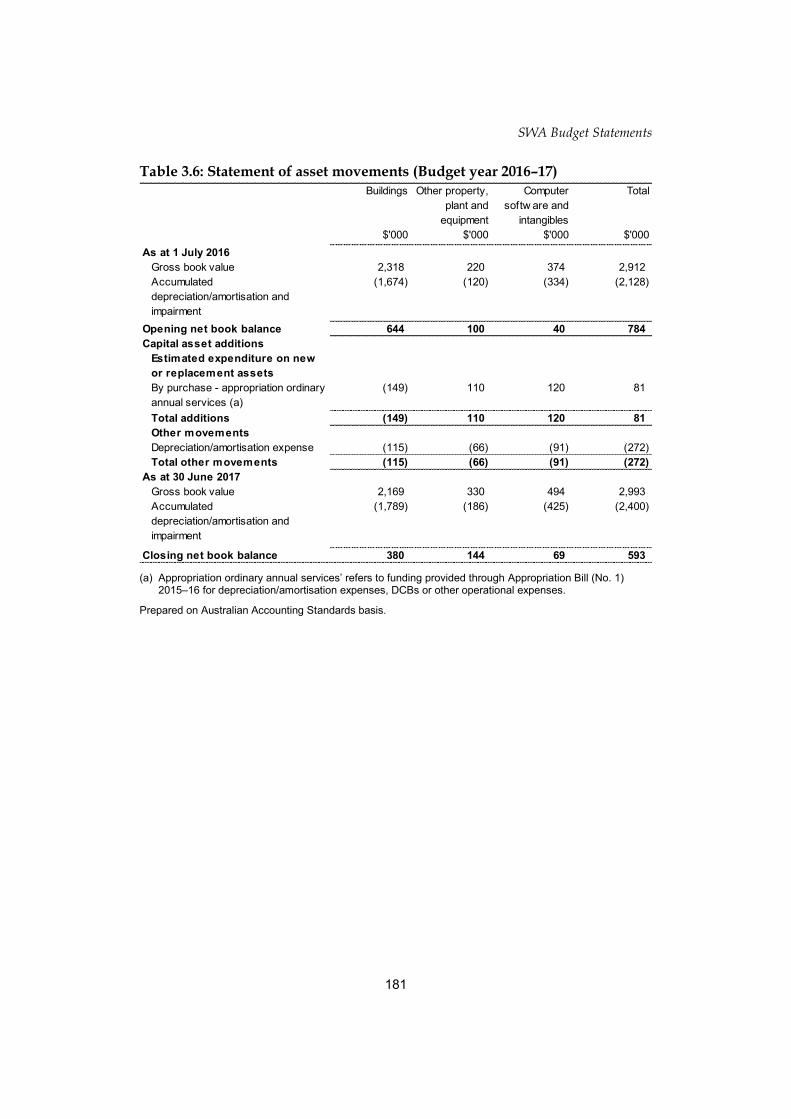
SWA Budget Statements
181
SW
A B
ud
get S
tatemen
ts
Table 3.6: Statement of asset movements (Budget year 2016–17)
(a) Appropriation ordinary annual services’ refers to funding provided through Appropriation Bill (No. 1)
2015–16 for depreciation/amortisation expenses, DCBs or other operational expenses.
Prepared on Australian Accounting Standards basis.
Buildings
$'000
Other property,
plant and
equipment
$'000
Computer
softw are and
intangibles
$'000
Total
$'000
As at 1 July 2016
Gross book value 2,318 220 374 2,912
Accumulated
depreciation/amortisation and
impairment
(1,674) (120) (334) (2,128)
Opening net book balance 644 100 40 784
Capital asset additions
Estimated expenditure on new
or replacement assets
By purchase - appropriation ordinary
annual services (a)
(149) 110 120 81
Total additions (149) 110 120 81
Other movements
Depreciation/amortisation expense (115) (66) (91) (272)
Total other movements (115) (66) (91) (272)
As at 30 June 2017
Gross book value 2,169 330 494 2,993
Accumulated
depreciation/amortisation and
impairment
(1,789) (186) (425) (2,400)
Closing net book balance 380 144 69 593

SWA Budget Statements
182
Table 3.7: Schedule of budgeted income and expenses administered on behalf of Government (for the period ended 30 June)
Safe Work Australia has no budgeted administered income or expenses. For this reason Table 3.7 is not presented.
Table 3.8: Schedule of budgeted assets and liabilities administered on behalf of Government (as at 30 June)
Safe Work Australia has no budgeted administered assets or liabilities. For this reason Table 3.8 is not presented.
Table 3.9: Schedule of budgeted administered cash flows (for the period ended 30 June)
Safe Work Australia has no budgeted administered cash flows. For this reason Table 3.9 is not presented.
Table 3.10: Administered capital budget statement (for the period ended 30 June)
Safe Work Australia has no administered capital budget. For this reason Table 3.10 is not presented.
Table 3.11: Statement of administered asset movements (Budget year 2016–17) Safe Work Australia has no administered non-financial assets. For this reason Table 3.11 is not presented.
Workplace Gender Equality Agency
Entity resources and planned performance

WGEA Budget Statements
185
WORKPLACE GENDER EQUALITY AGENCY
Section 1: Entity overview and resources .............................................................. 187
1.1 Strategic direction statement ........................................................................ 187
1.2 Entity resource statement ............................................................................. 189
1.3 Budget measures .......................................................................................... 190
Section 2: Outcomes and planned performance ................................................... 191
2.1 Budgeted expenses and performance for Outcome 1 .................................. 192
Section 3: Budgeted financial statements .............................................................. 195
3.1 Budgeted financial statements...................................................................... 195
3.2.1 Budgeted financial statements tables ........................................................... 196


WGEA Budget Statements
187
WORKPLACE GENDER EQUALITY AGENCY
Section 1: Entity overview and resources
1.1 STRATEGIC DIRECTION STATEMENT
The Workplace Gender Equality Agency (WGEA), established under the Workplace Gender Equality Act 2012 (the Act), is charged with promoting and improving gender equality in Australian workplaces. WGEA’s vision is for women and men to be equally represented, valued and rewarded in the workplace.
Under the Act, non-public sector employers with 100 or more employees are required to submit a report annually to the Agency against six gender equality indicators (GEIs):
GEI 1: gender composition of the workforce
GEI 2: gender composition of governing bodies
GEI 3: equal remuneration between women and men
GEI 4: availability and utility of employment terms, conditions and practices relating to flexible working arrangements for employees and to working arrangements supporting employees with family or caring responsibilities
GEI 5: consultation with employees on issues concerning gender equality in the workplace
GEI 6: sex-based harassment and discrimination.
The Agency’s dataset is based on approximately 5,000 reports submitted on behalf of approximately 12,000 employers and covers almost 40 per cent of all employees in Australia. This dataset underpins initiatives to promote and improve workplace gender equality through:
the annual publication of key findings in Australia’s gender equality scorecard
the publication of aggregated competitive analyses/benchmark data on an interactive data centre on the Agency’s website
the provision to each employer of a confidential customised competitor analysis/benchmark report
the award to the WGEA Employer of Choice for Gender Equality citation to employers reflecting leading practice in gender equality
the development of educational tools and resources
partnering in research

WGEA Budget Statements
188
engagement with business and the community to drive public awareness of gender equality issues.
The strategic priorities for WGEA in 2016–17 and the forward years are to increase our impact and reach, realise the potential of our data and to develop our team.
More information about the WGEA is available at www.wgea.gov.au, where the WGEA Corporate Plan is also published.
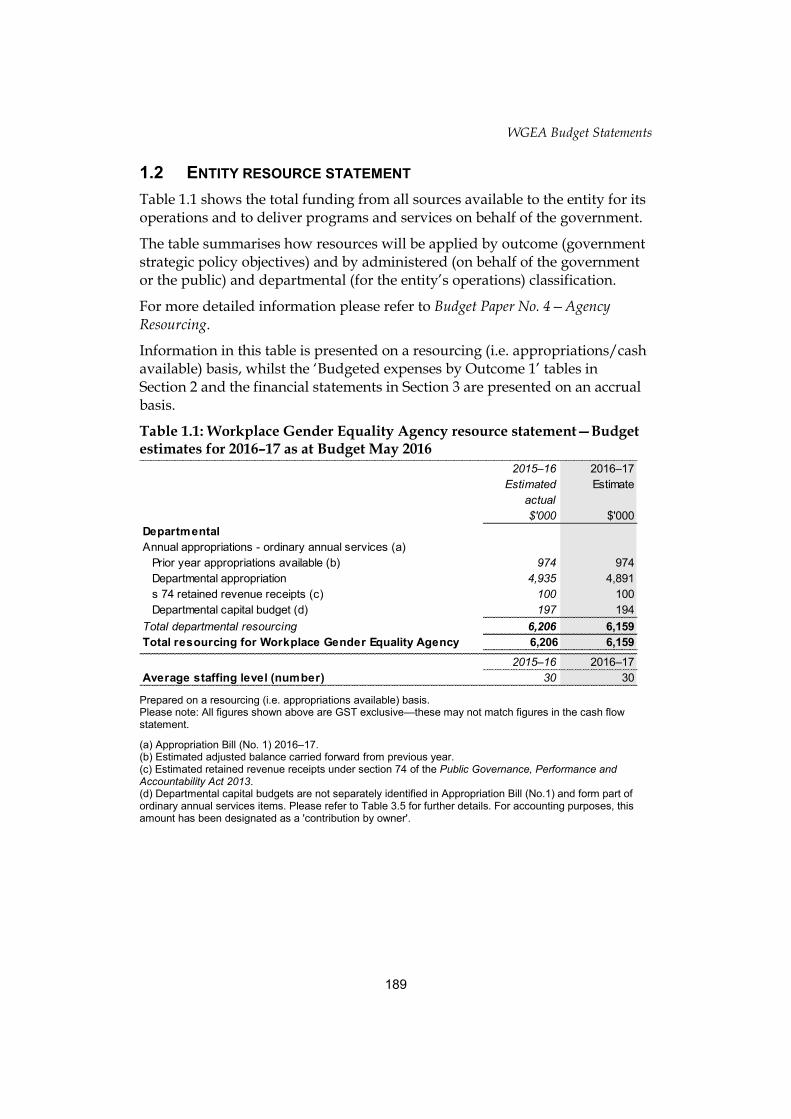
WGEA Budget Statements
189
1.2 ENTITY RESOURCE STATEMENT
Table 1.1 shows the total funding from all sources available to the entity for its operations and to deliver programs and services on behalf of the government.
The table summarises how resources will be applied by outcome (government strategic policy objectives) and by administered (on behalf of the government or the public) and departmental (for the entity’s operations) classification.
For more detailed information please refer to Budget Paper No. 4—Agency Resourcing.
Information in this table is presented on a resourcing (i.e. appropriations/cash available) basis, whilst the ‘Budgeted expenses by Outcome 1’ tables in Section 2 and the financial statements in Section 3 are presented on an accrual basis.
Table 1.1: Workplace Gender Equality Agency resource statement—Budget estimates for 2016–17 as at Budget May 2016
Prepared on a resourcing (i.e. appropriations available) basis. Please note: All figures shown above are GST exclusive—these may not match figures in the cash flow statement.
(a) Appropriation Bill (No. 1) 2016–17. (b) Estimated adjusted balance carried forward from previous year. (c) Estimated retained revenue receipts under section 74 of the Public Governance, Performance and Accountability Act 2013. (d) Departmental capital budgets are not separately identified in Appropriation Bill (No.1) and form part of ordinary annual services items. Please refer to Table 3.5 for further details. For accounting purposes, this amount has been designated as a 'contribution by owner'.
2015–16
Estimated
actual
$'000
2016–17
Estimate
$'000
Departmental
Annual appropriations - ordinary annual services (a)
Prior year appropriations available (b) 974 974
Departmental appropriation 4,935 4,891
s 74 retained revenue receipts (c) 100 100
Departmental capital budget (d) 197 194
Total departmental resourcing 6,206 6,159
Total resourcing for Workplace Gender Equality Agency 6,206 6,159
2015–16 2016–17
Average staffing level (number) 30 30
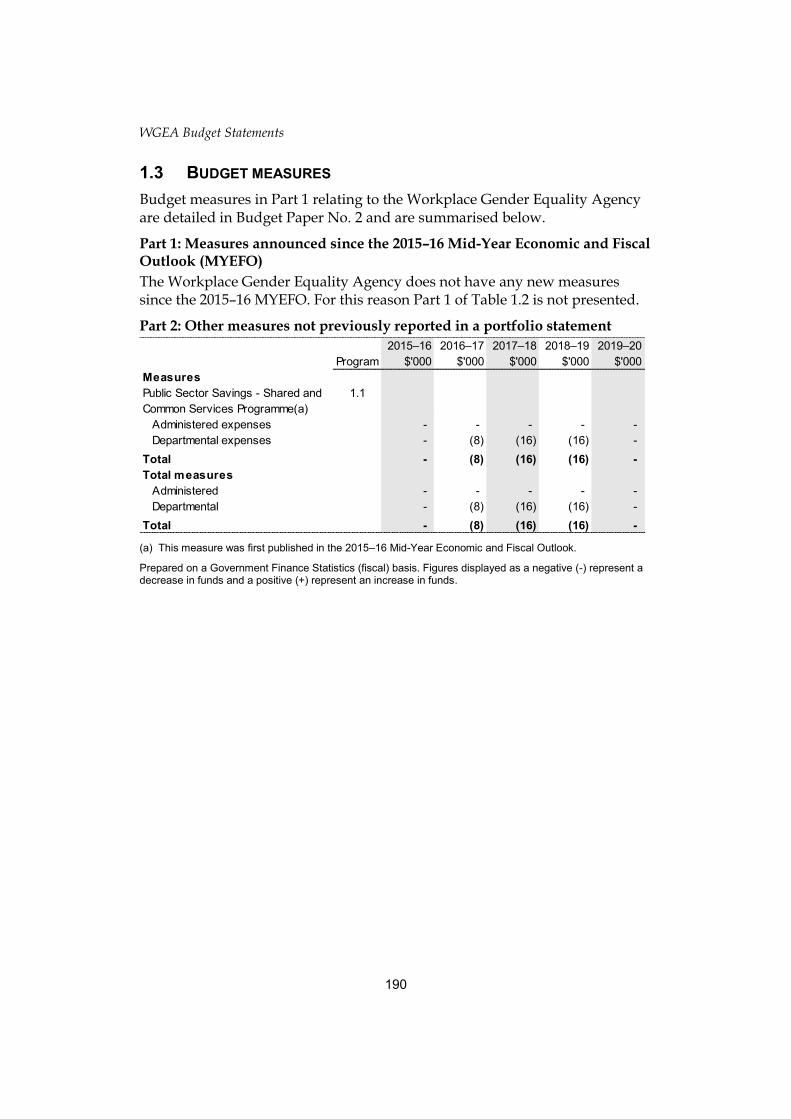
WGEA Budget Statements
190
1.3 BUDGET MEASURES
Budget measures in Part 1 relating to the Workplace Gender Equality Agency are detailed in Budget Paper No. 2 and are summarised below.
Part 1: Measures announced since the 2015–16 Mid-Year Economic and Fiscal Outlook (MYEFO)
The Workplace Gender Equality Agency does not have any new measures since the 2015–16 MYEFO. For this reason Part 1 of Table 1.2 is not presented.
Part 2: Other measures not previously reported in a portfolio statement
(a) This measure was first published in the 2015–16 Mid-Year Economic and Fiscal Outlook.
Prepared on a Government Finance Statistics (fiscal) basis. Figures displayed as a negative (-) represent a decrease in funds and a positive (+) represent an increase in funds.
Program
2015–16
$'000
2016–17
$'000
2017–18
$'000
2018–19
$'000
2019–20
$'000
Measures
Public Sector Savings - Shared and
Common Services Programme(a)
1.1
Administered expenses - - - - -
Departmental expenses - (8) (16) (16) -
Total - (8) (16) (16) -
Total measures
Administered - - - - -
Departmental - (8) (16) (16) -
Total - (8) (16) (16) -
WGEA Budget Statements
191
Section 2: Outcomes and planned performance
Government outcomes are the intended results, impacts or consequences of actions by the Government on the Australian community. Commonwealth programs are the primary vehicle by which government entities achieve the intended results of their outcome statements. Entities are required to identify the programs which contribute to government outcomes over the Budget and forward years.
Each outcome is described below together with its related programs. The following provides detailed information on expenses for each outcome and program, further broken down by funding source.
Note:
From 1 July 2015, performance reporting requirements in the Portfolio Budget Statements sit alongside those required under the enhanced commonwealth performance framework. It is anticipated that the performance criteria described in Portfolio Budget Statements will be read with broader information provided in an entity’s corporate plans and annual performance statements—included in Annual Reports from October 2016—to provide an entity’s complete performance story.

WGEA Budget Statements
192
2.1 BUDGETED EXPENSES AND PERFORMANCE FOR OUTCOME 1
Outcome 1: Promote and improve gender equality in Australian workplaces including through the provision of advice and assistance to employers and the assessment and measurement of workplace gender data.
Budgeted expenses for Outcome 1
This table shows how much the entity intends to spend (on an accrual basis) on achieving the outcome, broken down by program, as well as by Administered and Departmental funding sources.
Table 2.1.1: Budgeted expenses for Outcome 1
(a) Estimated expenses incurred in relation to receipts retained under section 74 of the PGPA Act. (b) Expenses not requiring appropriation in the Budget year are made up of depreciation expenses,
amortisation expenses and audit fees.
Note: Departmental appropriation splits and totals are indicative estimates and may change in the course of the budget year as government priorities change.
2015–16
Estimated
actual
$'000
2016–17
Budget
$'000
2017–18
Forw ard
estimate
$'000
2018–19
Forw ard
estimate
$'000
2019–20
Forw ard
estimate
$'000
Departmental expenses
Departmental appropriation 4,935 4,891 4,925 4,970 5,019
s 74 Retained revenue receipts (a) 100 100 100 100 100
Expenses not requiring appropriation in
the Budget year (b)
627 601 570 450 371
Departmental total 5,662 5,592 5,595 5,520 5,490
Total expenses for Program 1.1 5,662 5,592 5,595 5,520 5,490
Departmental expenses
Departmental appropriation 4,935 4,891 4,925 4,970 5,019
s 74 Retained revenue receipts (a) 100 100 100 100 100
Expenses not requiring appropriation in
the Budget year (b)
627 601 570 450 371
Departmental total 5,662 5,592 5,595 5,520 5,490
Total expenses for Outcome 1 5,662 5,592 5,595 5,520 5,490
2015–16 2016–17
Average staffing level (number) 30 30
Program 1.1: Workplace Gender Equality
Outcome 1 Totals by appropriation type
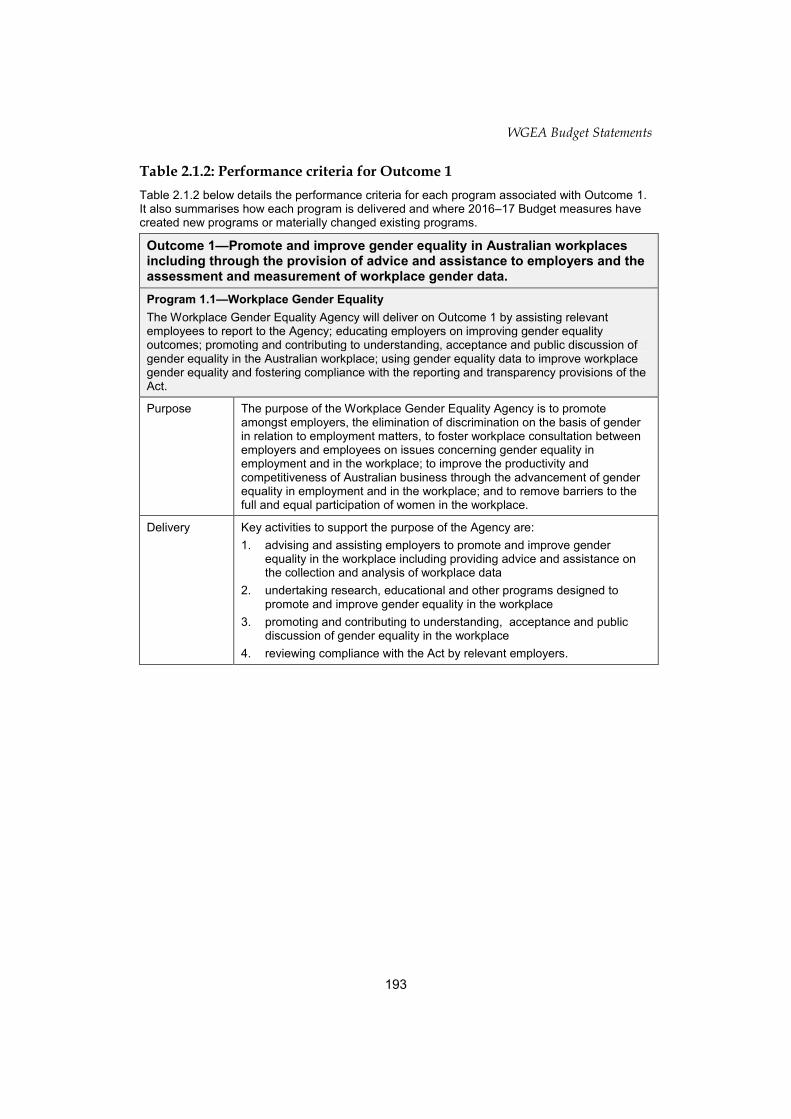
WGEA Budget Statements
193
Table 2.1.2: Performance criteria for Outcome 1
Table 2.1.2 below details the performance criteria for each program associated with Outcome 1. It also summarises how each program is delivered and where 2016–17 Budget measures have created new programs or materially changed existing programs.
Outcome 1—Promote and improve gender equality in Australian workplaces including through the provision of advice and assistance to employers and the assessment and measurement of workplace gender data.
Program 1.1—Workplace Gender Equality
The Workplace Gender Equality Agency will deliver on Outcome 1 by assisting relevant employees to report to the Agency; educating employers on improving gender equality outcomes; promoting and contributing to understanding, acceptance and public discussion of gender equality in the Australian workplace; using gender equality data to improve workplace gender equality and fostering compliance with the reporting and transparency provisions of the Act.
Purpose The purpose of the Workplace Gender Equality Agency is to promote amongst employers, the elimination of discrimination on the basis of gender in relation to employment matters, to foster workplace consultation between employers and employees on issues concerning gender equality in employment and in the workplace; to improve the productivity and competitiveness of Australian business through the advancement of gender equality in employment and in the workplace; and to remove barriers to the full and equal participation of women in the workplace.
Delivery Key activities to support the purpose of the Agency are:
1. advising and assisting employers to promote and improve gender equality in the workplace including providing advice and assistance on the collection and analysis of workplace data
2. undertaking research, educational and other programs designed to promote and improve gender equality in the workplace
3. promoting and contributing to understanding, acceptance and public discussion of gender equality in the workplace
4. reviewing compliance with the Act by relevant employers.

WGEA Budget Statements
194
Performance information
Year Performance criteria (a) Targets
2015–16 Educating employers on improving gender equality outcomes
Increase in education participants.
Assessment: Target of 1419 has been exceeded and forecast is 2316.
Increase in visits to Agency website.
Assessment: On track—target of 210,000 has almost been achieved and forecast is 250,000.
Promoting understanding, acceptance and public discussion on gender equality issues
Maintaining the number of speeches and events delivered.
Assessment: Target of 52 has been achieved and forecast is 56 based on events already scheduled.
Using gender equality data to improve gender equality in workplaces
Increasing the number of Employer of Choice for Gender Equality organisations (EOCGEs)
Assessment: Target of 88 has been exceeded. There are currently 90 EOCGEs
2016–17 Increasing our impact and reach on gender equality issues through leveraging and development of our networks
Increase in speaking engagements and event participation
Realising the potential of gender equality data by optimising its collection, analysis and release
Improve the ease of reporting and increase the means by which the data is communicated
Communicating effectively on gender equality matters by reviewing our channels and audience
Increase our media presence and third party advocacy and increase industry roundtables
2017–18 and beyond
Increasing our impact and reach on gender equality issues through development and delivery of educational tools and resources to inform and equip
Review and refresh of educational resources and toolkits
Realising the potential of gender equality data by mining for evidence to add value and generate insights
Establish additional research partnerships and influence the research agenda on gender equality
Communicating widely on gender equality matters in consumable forms which tell the story.
Refresh of website content to include increase in case studies and result in more visits to the site
Material changes to Program 1.1 resulting from the following measures:
Nil

WGEA Budget Statements
195
Section 3: Budgeted financial statements
Section 3 presents budgeted financial statements which provide a comprehensive snapshot of entity finances for the 2016–17 budget year, including the impact of budget measures and resourcing on financial statements.
3.1 BUDGETED FINANCIAL STATEMENTS
3.1.1 Differences between entity resourcing and financial statements
The Workplace Gender Equality Agency has nil differences to report.
3.1.2 Explanatory notes and analysis of budgeted financial statements
The Workplace Gender Equality Agency is budgeting for an operating loss equal to the unappropriated depreciation and amortisation expense of $0.57 million for the 2016–17 financial year.
Total revenues are estimated to be $4.9 million and total expenses $5.6 million.
Total assets at the end of the 2016–17 financial year are estimated to be $2.9 million. The majority of the assets represent receivables (appropriation receivables) and intangible assets.
Total liabilities for 2016–17 are estimated at $1.2 million. The largest liability items are accrued expenses and accrued employee entitlements.
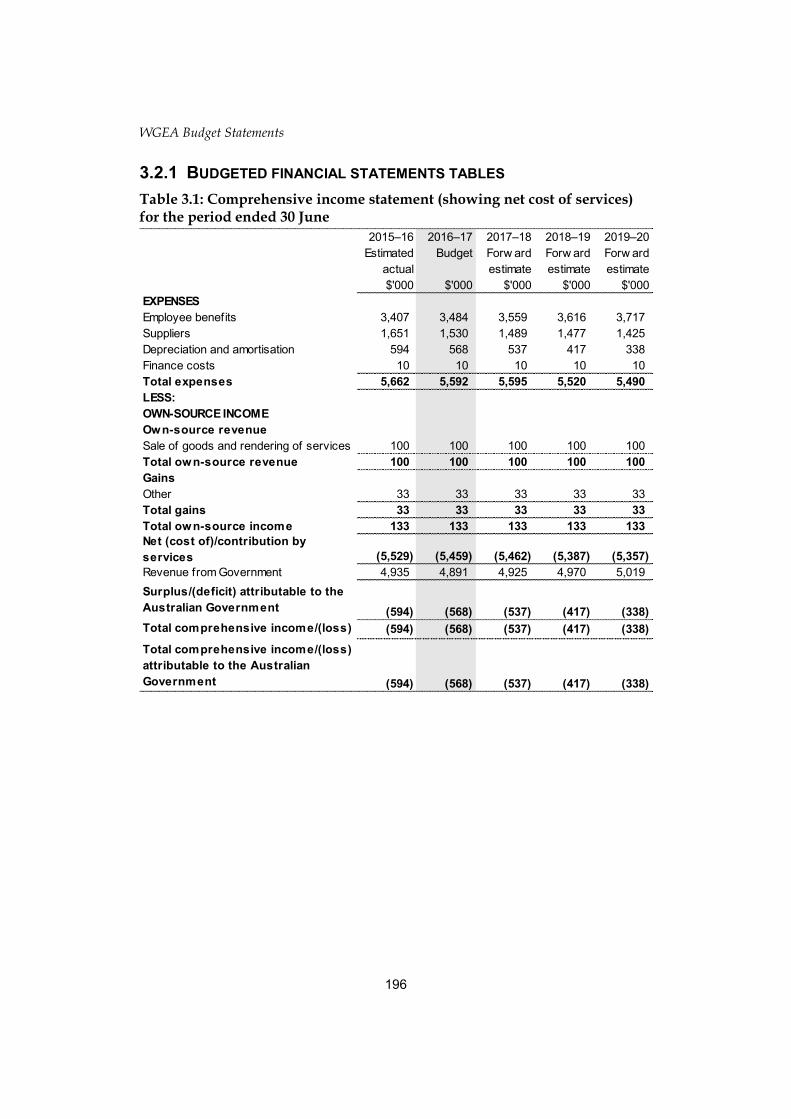
WGEA Budget Statements
196
3.2.1 BUDGETED FINANCIAL STATEMENTS TABLES
Table 3.1: Comprehensive income statement (showing net cost of services) for the period ended 30 June
2015–16
Estimated
actual
$'000
2016–17
Budget
$'000
2017–18
Forw ard
estimate
$'000
2018–19
Forw ard
estimate
$'000
2019–20
Forw ard
estimate
$'000
EXPENSES
Employee benefits 3,407 3,484 3,559 3,616 3,717
Suppliers 1,651 1,530 1,489 1,477 1,425
Depreciation and amortisation 594 568 537 417 338
Finance costs 10 10 10 10 10
Total expenses 5,662 5,592 5,595 5,520 5,490
LESS:
OWN-SOURCE INCOME
Own-source revenue
Sale of goods and rendering of services 100 100 100 100 100
Total own-source revenue 100 100 100 100 100
Gains
Other 33 33 33 33 33
Total gains 33 33 33 33 33
Total own-source income 133 133 133 133 133
Net (cost of)/contribution by
services (5,529) (5,459) (5,462) (5,387) (5,357)
Revenue from Government 4,935 4,891 4,925 4,970 5,019
Surplus/(deficit) attributable to the
Australian Government (594) (568) (537) (417) (338)
Total comprehensive income/(loss) (594) (568) (537) (417) (338)
Total comprehensive income/(loss)
attributable to the Australian
Government (594) (568) (537) (417) (338)
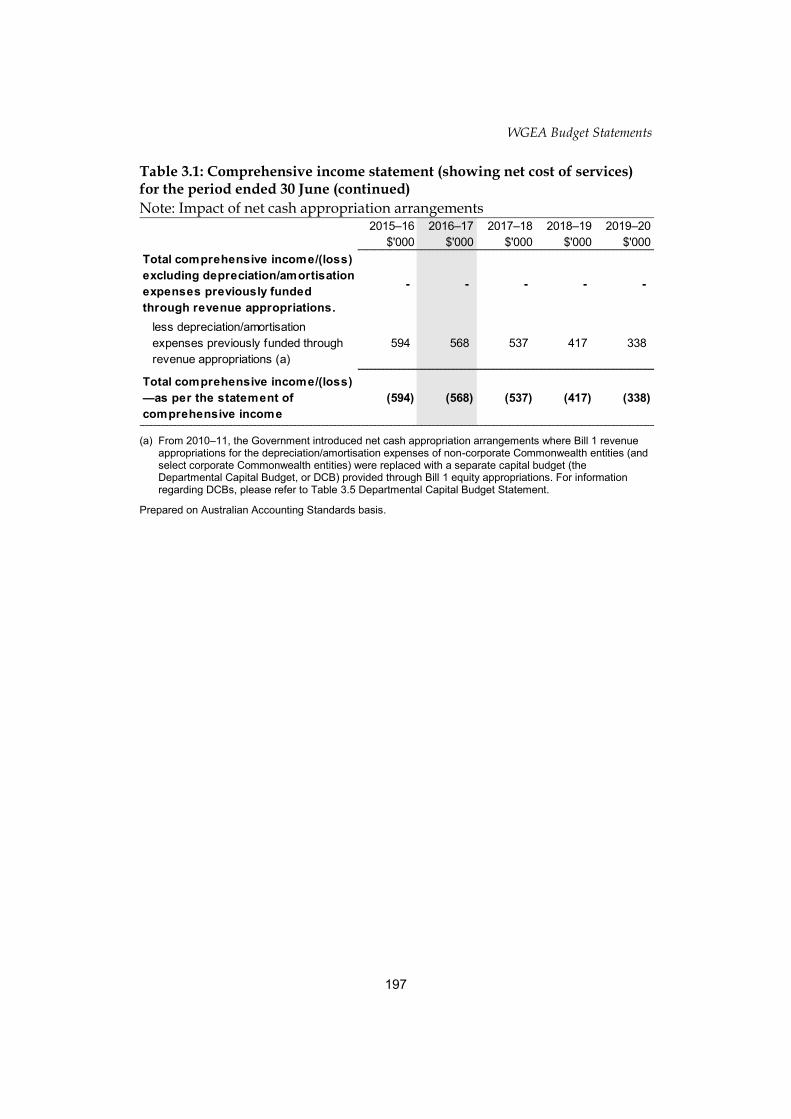
WGEA Budget Statements
197
Table 3.1: Comprehensive income statement (showing net cost of services) for the period ended 30 June (continued)
Note: Impact of net cash appropriation arrangements
(a) From 2010–11, the Government introduced net cash appropriation arrangements where Bill 1 revenue
appropriations for the depreciation/amortisation expenses of non-corporate Commonwealth entities (and select corporate Commonwealth entities) were replaced with a separate capital budget (the Departmental Capital Budget, or DCB) provided through Bill 1 equity appropriations. For information regarding DCBs, please refer to Table 3.5 Departmental Capital Budget Statement.
Prepared on Australian Accounting Standards basis.
2015–16
$'000
2016–17
$'000
2017–18
$'000
2018–19
$'000
2019–20
$'000
Total comprehensive income/(loss)
excluding depreciation/amortisation
expenses previously funded
through revenue appropriations.
- - - - -
less depreciation/amortisation
expenses previously funded through
revenue appropriations (a)
594 568 537 417 338
Total comprehensive income/(loss)
—as per the statement of
comprehensive income
(594) (568) (537) (417) (338)

WGEA Budget Statements
198
Table 3.2: Budgeted departmental balance sheet (as at 30 June)
* Equity is the residual interest in assets after deduction of liabilities.
Prepared on Australian Accounting Standards basis.
2015–16
Estimated
actual
$'000
2016–17
Budget
$'000
2017–18
Forw ard
estimate
$'000
2018–19
Forw ard
estimate
$'000
2019–20
Forw ard
estimate
$'000
ASSETS
Financial assets
Cash and cash equivalents 216 216 216 216 216
Trade and other receivables 766 766 766 766 766
Total financial assets 982 982 982 982 982
Non-financial assets
Land and buildings 385 232 79 - -
Property, plant and equipment 124 46 - - -
Intangibles 1,865 1,722 1,587 1,453 1,321
Other non-financial assets 7 7 7 7 7
Total non-financial assets 2,381 2,007 1,673 1,460 1,328
Assets held for sale - - - - -
Total assets 3,363 2,989 2,655 2,442 2,310
LIABILITIES
Payables
Suppliers 5 5 5 5 5
Other payables 601 600 600 600 600
Total payables 606 605 605 605 605
Interest bearing liabilities
Leases 65 65 65 65 65
Total interest bearing liabilities 65 65 65 65 65
Provisions
Employee provisions 523 524 524 524 524
Other provisions 12 12 12 12 12
Total provisions 535 536 536 536 536
Total liabilities 1,206 1,206 1,206 1,206 1,206
Net assets 2,157 1,783 1,449 1,236 1,104
EQUITY*
Parent entity interest
Contributed equity 3,856 4,050 4,253 4,457 4,663
Retained surplus (accumulated
deficit)
(1,699) (2,267) (2,804) (3,221) (3,559)
Total parent entity interest 2,157 1,783 1,449 1,236 1,104
Total equity 2,157 1,783 1,449 1,236 1,104

WGEA Budget Statements
199
Table 3.3: Departmental statement of changes in equity—summary of movement (Budget year 2016–17)
Prepared on Australian Accounting Standards basis.
Retained
earnings
$'000
Contributed
equity/ capital
$'000
Total equity
$'000
Opening balance as at 1 July 2016
Balance carried forw ard from previous period (1,699) 3,856 2,157
Adjusted opening balance (1,699) 3,856 2,157
Comprehensive income
Surplus/(deficit) for the period (568) - (568)
Total comprehensive income (568) - (568)
of w hich:
Attributable to the Australian Government (568) - (568)
Transactions with owners
Contributions by owners
Departmental capital budget (DCB) - 194 194
Sub-total transactions with owners - 194 194
Estimated closing balance as at 30 June 2017 (2,267) 4,050 1,783
Closing balance attributable to the
Australian Government (2,267) 4,050 1,783

WGEA Budget Statements
200
Table 3.4: Budgeted departmental statement of cash flows (for the period ended 30 June)
Prepared on Australian Accounting Standards basis.
2015–16
Estimated
actual
$'000
2016–17
Budget
$'000
2017–18
Forw ard
estimate
$'000
2018–19
Forw ard
estimate
$'000
2019–20
Forw ard
estimate
$'000
OPERATING ACTIVITIES
Cash received
Appropriations 4,737 4,695 5,119 4,970 5,019
Sale of goods and rendering of
services
100 100 100 100 100
Total cash received 4,837 4,795 5,219 5,070 5,119
Cash used
Employees 3,405 3,483 3,559 3,616 3,717
Suppliers 1,430 1,311 1,660 1,454 1,402
Other 2 1 - - -
Total cash used 4,837 4,795 5,219 5,070 5,119
Net cash from/(used by)
operating activities - - - - -
INVESTING ACTIVITIES
Cash received
Other - - - - -
Total cash received - - - - -
Cash used
Purchase of property, plant and
equipment and intangibles
197 194 203 204 206
Total cash used 197 194 203 204 206
Net cash from/(used by)
investing activities (197) (194) (203) (204) (206)
FINANCING ACTIVITIES
Cash received
Contributed equity 197 194 203 204 206
Total cash received 197 194 203 204 206
Cash used
Other - - - - -
Total cash used - - - - -
Net cash from/(used by)
financing activities 197 194 203 204 206
Net increase/(decrease) in cash
held - - - - -
Cash and cash equivalents at the
beginning of the reporting period 216 216 216 216 216
Cash and cash equivalents at the
end of the reporting period 216 216 216 216 216

WGEA Budget Statements
201
Table 3.5: Departmental capital budget statement (for the period ended 30 June)
(a) Does not include annual finance lease costs. Includes purchases from current and previous years’
Departmental capital budgets (DCBs).
Prepared on Australian Accounting Standards basis.
2015–16
Estimated
actual
$'000
2016–17
Budget
$'000
2017–18
Forw ard
estimate
$'000
2018–19
Forw ard
estimate
$'000
2019–20
Forw ard
estimate
$'000
NEW CAPITAL APPROPRIATIONS
Capital budget - Bill 1 (DCB) 197 194 203 204 206
Total new capital appropriations 197 194 203 204 206
Provided for:
Purchase of non-financial assets 197 194 203 204 206
Total items 197 194 203 204 206
PURCHASE OF NON-FINANCIAL
ASSETS
Funded by capital appropriation - DCB
(a)
197 194 203 204 206
TOTAL 197 194 203 204 206
RECONCILIATION OF CASH USED TO
ACQUIRE ASSETS TO ASSET
MOVEMENT TABLE
Total purchases 197 194 203 204 206
Total cash used to acquire assets 197 194 203 204 206

WGEA Budget Statements
202
Table 3.6: Statement of asset movements (Budget year 2016–17)
(a) ‘Appropriation ordinary annual services’ refers to funding provided through Appropriation Bill (No. 1)
2016–17 for depreciation/amortisation expenses, DCBs or other operational expenses.
Prepared on Australian Accounting Standards basis.
Buildings
$'000
Other property,
plant and
equipment
$'000
Computer
softw are and
intangibles
$'000
Total
$'000
As at 1 July 2016
Gross book value 1,138 401 2,663 4,202
Accumulated
depreciation/amortisation and
impairment
(753) (277) (798) (1,828)
Opening net book balance 385 124 1,865 2,374
Capital asset additions
Estimated expenditure on new
or replacement assets
By purchase - appropriation ordinary
annual services (a)
- - 194 194
Total additions - - 194 194
Other movements
Depreciation/amortisation expense (153) (78) (337) (568)
Total other movements (153) (78) (337) (568)
As at 30 June 2017
Gross book value 1,138 401 2,857 4,396
Accumulated depreciation/
amortisation and impairment
(906) (355) (1,135) (2,396)
Closing net book balance 232 46 1,722 2,000
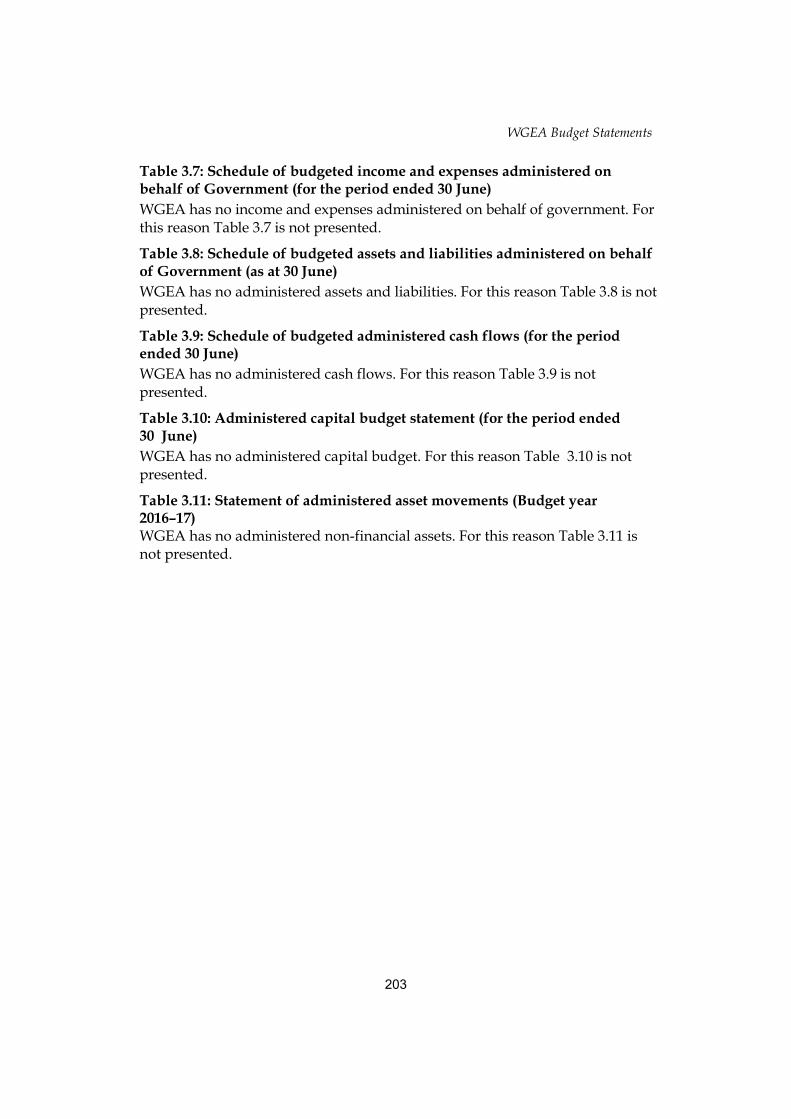
WGEA Budget Statements
203
Table 3.7: Schedule of budgeted income and expenses administered on behalf of Government (for the period ended 30 June)
WGEA has no income and expenses administered on behalf of government. For this reason Table 3.7 is not presented.
Table 3.8: Schedule of budgeted assets and liabilities administered on behalf of Government (as at 30 June)
WGEA has no administered assets and liabilities. For this reason Table 3.8 is not presented.
Table 3.9: Schedule of budgeted administered cash flows (for the period ended 30 June)
WGEA has no administered cash flows. For this reason Table 3.9 is not presented.
Table 3.10: Administered capital budget statement (for the period ended 30 June)
WGEA has no administered capital budget. For this reason Table 3.10 is not presented.
Table 3.11: Statement of administered asset movements (Budget year 2016–17) WGEA has no administered non-financial assets. For this reason Table 3.11 is not presented.


Glossary
205
PORTFOLIO GLOSSARY
Accrual Accounting System of accounting where items are brought to account and included in the financial statements as they are earned or incurred, rather than as they are received or paid.
Additional Estimates Where amounts appropriated at Budget time are insufficient, Parliament may appropriate more funds to portfolios through the Additional Estimates Acts.
Additional Estimates Bills or Acts
These are Appropriation Bills 3 and 4, and a separate Bill for the Parliamentary Departments [Appropriations (Parliamentary Departments) Bill (No. 2)]. These Bills are introduced into Parliament sometime after the Budget Bills.
Administered Items Expenses, revenues, assets or liabilities managed by agencies on behalf of the Commonwealth. Agencies do not control administered items. Administered expenses include grants, subsidies and benefits. In many cases, administered expenses fund the delivery of third party outputs.
Appropriation An authorisation by Parliament to spend moneys from the Consolidated Revenue Fund for a particular purpose.
Annual Appropriation Two Appropriation Bills are introduced into Parliament in May and comprise the Budget for the financial year beginning 1 July. Further Bills are introduced later in the financial year as part of the additional estimates. Parliamentary departments have their own appropriations.
Assets Assets are physical objects and legal rights it is expected will provide benefits in the future or alternatively items of value owned by an Agency.
Budget Measure A decision by Cabinet or Ministers and has resulted in a cost or savings to outlays.
Capital expenditure Expenditure by an agency on capital projects, for example purchasing a building.
Consolidated Revenue Fund
Section 81 of the Constitution stipulates that all revenue raised or money received by the Commonwealth forms the one consolidated revenue fund (CRF). The CRF is not a bank account. The Official Public Account reflects most of the operations of the CRF.
Departmental items Assets, liabilities, revenues and expenses that are controlled by the agency in providing its outputs. Departmental items would generally include computers, plant and equipment assets used by agencies in providing goods and services and most employee expenses, supplier costs and other administrative expenses incurred.
Depreciation Apportionment of an asset’s capital value as an expense over its estimated useful life to take account of normal usage, obsolescence, or the passage of time.
Equity or net assets Residual interest in the assets of an entity after deduction of its liabilities.
Expenses Total value of all of the resources consumed in producing goods and services or the loss of future economic benefits in the form of reductions in assets or increases in liabilities of an entity.
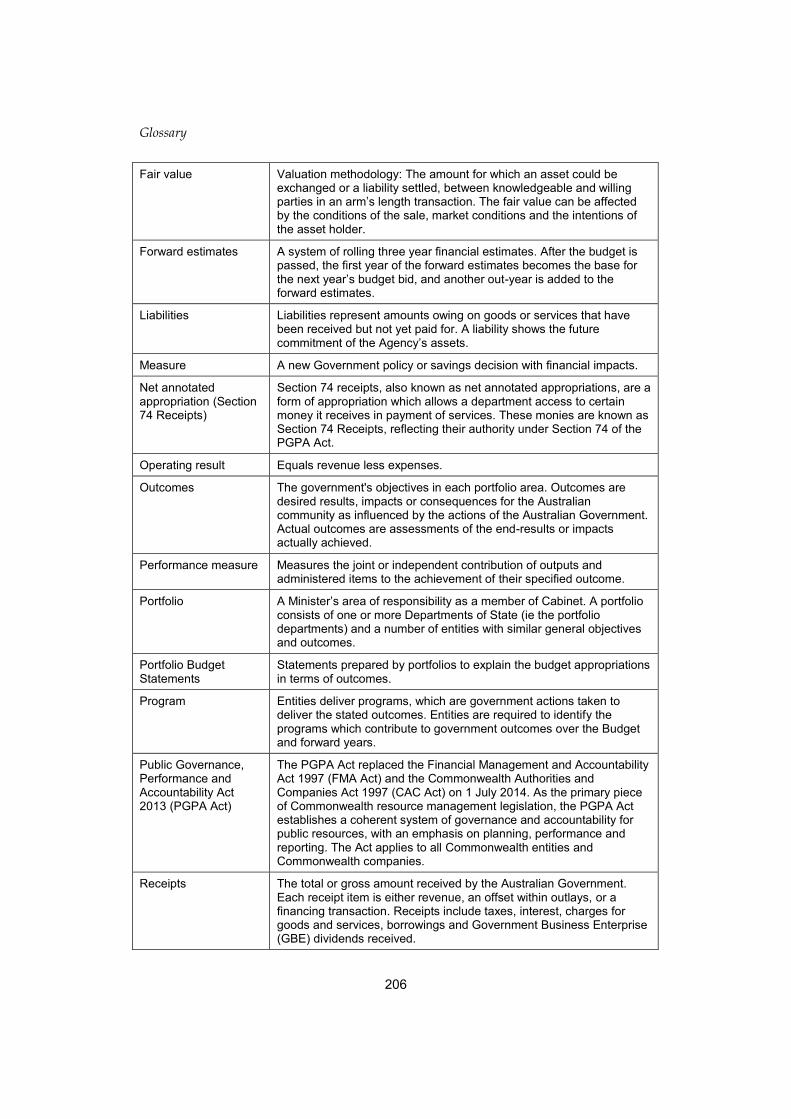
Glossary
206
Fair value Valuation methodology: The amount for which an asset could be exchanged or a liability settled, between knowledgeable and willing parties in an arm’s length transaction. The fair value can be affected by the conditions of the sale, market conditions and the intentions of the asset holder.
Forward estimates A system of rolling three year financial estimates. After the budget is passed, the first year of the forward estimates becomes the base for the next year’s budget bid, and another out-year is added to the forward estimates.
Liabilities Liabilities represent amounts owing on goods or services that have been received but not yet paid for. A liability shows the future commitment of the Agency’s assets.
Measure A new Government policy or savings decision with financial impacts.
Net annotated appropriation (Section 74 Receipts)
Section 74 receipts, also known as net annotated appropriations, are a form of appropriation which allows a department access to certain money it receives in payment of services. These monies are known as Section 74 Receipts, reflecting their authority under Section 74 of the PGPA Act.
Operating result Equals revenue less expenses.
Outcomes The government's objectives in each portfolio area. Outcomes are desired results, impacts or consequences for the Australian community as influenced by the actions of the Australian Government. Actual outcomes are assessments of the end-results or impacts actually achieved.
Performance measure Measures the joint or independent contribution of outputs and administered items to the achievement of their specified outcome.
Portfolio A Minister’s area of responsibility as a member of Cabinet. A portfolio consists of one or more Departments of State (ie the portfolio departments) and a number of entities with similar general objectives and outcomes.
Portfolio Budget Statements
Statements prepared by portfolios to explain the budget appropriations in terms of outcomes.
Program Entities deliver programs, which are government actions taken to deliver the stated outcomes. Entities are required to identify the programs which contribute to government outcomes over the Budget and forward years.
Public Governance, Performance and Accountability Act 2013 (PGPA Act)
The PGPA Act replaced the Financial Management and Accountability Act 1997 (FMA Act) and the Commonwealth Authorities and Companies Act 1997 (CAC Act) on 1 July 2014. As the primary piece of Commonwealth resource management legislation, the PGPA Act establishes a coherent system of governance and accountability for public resources, with an emphasis on planning, performance and reporting. The Act applies to all Commonwealth entities and Commonwealth companies.
Receipts The total or gross amount received by the Australian Government. Each receipt item is either revenue, an offset within outlays, or a financing transaction. Receipts include taxes, interest, charges for goods and services, borrowings and Government Business Enterprise (GBE) dividends received.
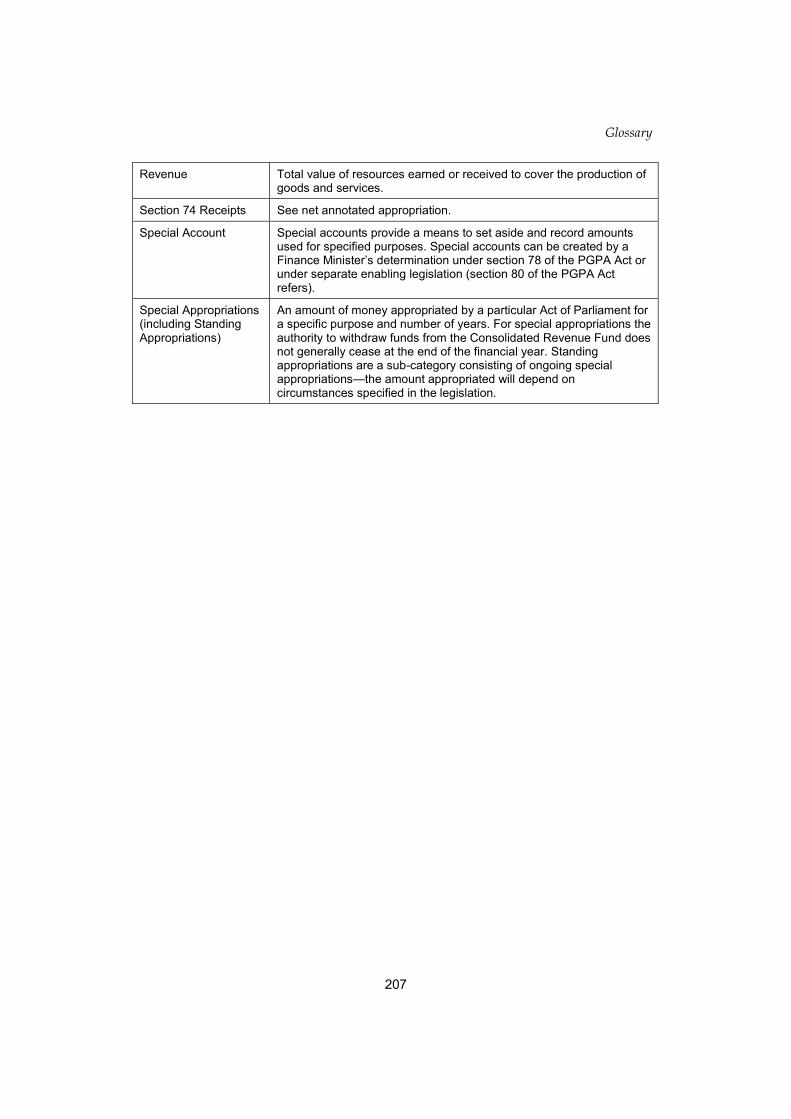
Glossary
207
Revenue Total value of resources earned or received to cover the production of goods and services.
Section 74 Receipts See net annotated appropriation.
Special Account Special accounts provide a means to set aside and record amounts used for specified purposes. Special accounts can be created by a Finance Minister’s determination under section 78 of the PGPA Act or under separate enabling legislation (section 80 of the PGPA Act refers).
Special Appropriations (including Standing Appropriations)
An amount of money appropriated by a particular Act of Parliament for a specific purpose and number of years. For special appropriations the authority to withdraw funds from the Consolidated Revenue Fund does not generally cease at the end of the financial year. Standing appropriations are a sub-category consisting of ongoing special appropriations—the amount appropriated will depend on circumstances specified in the legislation.