portfolio update and financial planning news
TRANSCRIPT

Page 1 of 16
March Quarter 2017
Portfolio Update
Much to investors delight Global equity markets generally rose during the March quarter.
The US was preoccupied with politics, with efforts to replace ‘Obamacare’ amounting to nothing.
Although the US Federal Reserve raised rates in March as expected, its outlook in terms of the US
economic growth was somewhat soft.
A relatively more benign political backdrop combined with strong economic data saw Eurozone
equities outperform during the quarter.
Globally the worst performing sub-sector during the quarter was Mining weighed down by falling
commodity prices.
In Australia the Mining sector also underperformed, however, the worst performing sub-sector
domestically was Discretionary Retail over fears of the implications of a possible entry of Amazon as a
competitor within the sector.
Australian banks performed well and outperformed their global counterparts for the quarter. Health
Care and Consumer Staples have been the best performing sectors in Australia year to date helped by
improved earnings trends.
The Australian Dollar weakened against most major currencies weighed down by falling commodity
prices, particularly iron ore. The Euro strengthened on an improving political and economic backdrop.
Still Tilting To Global Reflation From the perspective of our Australian Growth Portfolio we continue with a moderate overweight to
stocks with a global focus and we remain underweight bond proxies (infrastructure and property
trusts).
Our conviction on domestically exposed stocks is somewhat lower. Unlike global conditions, we see
less scope for improvement in economic conditions in Australia. The domestic economy continues to
muddle through but we see little prospect of acceleration, particularly with housing peaking. Domestic
themes are somewhat thin on the ground.
PORTFOLIO UPDATE
AND FINANCIAL
PLANNING NEWS

Page 2 of 16
A 'Stock Picker's' Market So Far In 2017 In contrast to 2016 which saw a dramatic rotation to value and away from yield and growth, this year
so far has been more of a stock picker's market. "Macro factors" could well re-assert particularly if the
US Federal Reserve do more than expected in terms of lifting interest rates, though we think the most
dramatic phase of sector rotation is likely behind us.
Resources – Valuation Appeal Increasing – No Current Exposure While mining has underperformed over the last quarter it has weathered the iron price fall fairly well in
aggregate terms. With Chinese growth continuing to show robust trends we may well have hit a short-
term bottom in the iron ore price after a circa 30% pullback from the very extended levels of late
February.
The iron ore price at circa $65 is still above our long term and 2018 expectation of $55 but in our view
valuations for the big cap miners still look attractive.
We currently have no exposure to materials, however we are watching share prices carefully as they
fall away and valuation appeal increases. Our favoured stock in the resource space is BHP Billiton for
its diversity and free cash-flow generation.
Banks – Neutral The Bank sector Price Earnings multiple is elevated in an absolute sense but in the context of rest of
the market it appears about fair.
Earnings trends in the bank sector have improved with modest upgrades seen this year. However,
medium term we would expect credit growth to slow somewhat on the back of recent additional macro
prudential tightening.
Looking at the valuation of the bank sector suggests the market appears quite relaxed about housing.
A soft landing remains our central case (helped by the likelihood that official rates are likely to stay on
hold, in our view) but the elevated level of house prices and reacceleration of household debt is still a
cautionary trend and influences our decision to maintain a neutral weighting to the banking sector. We
feel there is no short term share price upside from these levels.
Page 3 of 16
Market Excluding Resources & Banks The loss of the housing tailwind may not spell gloom and doom for the economy but will likely at least
take the edge off growth. This reinforces our preference for globally/US focussed companies.
P/E dispersion has stabilised around average levels, suggesting a relatively neutral position between
growth and value in the market ex resources, all things equal. This is how performance has been
tracking in recent months.
Earnings revision trends have improved in the higher P/E areas of the market relative to the weak
trends seen in the latter stages of 2016.
Retail actually still has pockets of reasonably strong operating conditions but the threat of more
intense competition (Amazon) has seen the sector marked back recently.
Telcos already face strong competition and soft earnings momentum but face the threat of stronger
competition (NBN and more mobile competition).
Real Estate Trusts and infrastructure have rallied with renewed decline in bond yields. The Real Estate
Trust sector dividend yield shows no premium over the market and looks unattractive to us given
muted distribution growth and no franking benefit. A renewed leg-up in bond yields (which we think is
quite likely) would pressure the bond proxies. From a portfolio perspective we remain cautious.
In summary we are now looking towards increasing our cash positions as we struggle to find value
in a market that looks stretched on valuation in the face of soft earnings growth and patchy
economic data. Areas of interest remain stocks exposed to Government infrastructure spending
as well as mining companies as value re-emerges with falling share prices.

Page 4 of 16
Portfolio Additions and Removals
Additions – Australian Share Portfolios The following shares were purchased in the March Quarter 2017.
Investment Investment Type Date of
Purchase Purchase
Price Sector
Exposure
Woolworths Limited (WOW) New Investment 14 Feb 2017 $25.60 4.26%
Additions – Australian Diversified Portfolios The following shares were purchased in the March Quarter 2017.
Investment Investment Type Date of
Purchase Purchase
Price Sector
Exposure
Woolworths Limited (WOW) New Investment 14 Feb 2017 $25.60 4.05%
Removals – Australian Share Portfolios No shares were sold during the March Quarter 2017.
Removals – Diversified Share Portfolios The following shares were sold during the March Quarter 2017.
Investment Full or Part
Sale Date of Sale Sale Price Average Unit Cost
Aconex Limited (ACX) Full Sale 30 Jan 2017 $3.65 $6.04
Woolworths Limited (WOW)
Food prices in our view are expected to remain steady or to rise in 2017, providing a boost to
Woolworths and Coles’ sales revenue following an extraordinary 2016 financial year where heavy
discounting led to the supermarkets sector growing at its slowest rate in 20 years. We expect the
market will remain competitive, albeit the risk of a price war is falling.
Woolworths has invested about $1 billion over 18 months to lower food prices, as it played catch up
with rivals after having put profit ahead of sales growth in previous years.
The latest official retail trade figures show food prices rose 4.3 per cent in December compared to the
same period a year ago. This is expected to show up in Woolworths’ and Coles’ sales growth, which
has been helped by an increase in fresh fruit and vegetable prices. Analysts also expect suppliers to
put pressure on supermarkets to increase prices as the price of sugar and other soft commodities
continue to rise.
During the first quarter, Coles’ crucial comparable food sales growth slowed to 1.7 per cent, compared
to 2.8 per cent in the same period a year ago. We expect Coles to continue to show a slowdown in its
sales growth, while Woolworths’ sales are expected to have grown, in a sign it has managed to wrest
back some of its loss market share. Woolworth’s comparable food sales rose 0.7 per cent in the first
quarter of 2017 — the first quarter of growth in almost two years — in a sign the business is turning
around.

Page 5 of 16
Analysts expect the turnaround to have continued into the second quarter. With our view being the
Woolworths turnaround is now underway, it was decided on 14 February to add Woolworths shares to
our portfolios. The shares were purchased at a price of $25.604 (incl. brokerage).
Aconex Limited (ACX)
On Monday 30 January Aconex announced in pre-market that they expected earnings before interest,
tax, depreciation and amortisation (EBITDA) for the full year to be $15 million to $18 million - down
from $22 million to $25 million as previously forecast. Aconex also announced that they expected full-
year revenue of $160 million to $165 million compared to the prior forecast of $172 million to $180
million.
It was decided to immediately dispose of our entire holding at market open. This was done at a sale
price of $3.64 (incl. brokerage). Aconex finished trading at $3.10 on the day, down 45%. Aconex
traded at an all-time high of $8.48 in mid-2016.
Aconex blamed lower than expected sales in the UK and the Americas during the half year to
December 2016. Uncertainty around Brexit was partly to blame for the softer sales in the UK, and the
US presidential election had impacted sales in the US. Also, a higher proportion of long-term contracts
had resulted in lower additional short-term revenue, and currency movements in the British pound and
the euro had been unfavourable.
Aconex provides cloud-based and mobile collaboration software for the construction industry, which
connects owners, contractors and their project teams.
Page 6 of 16
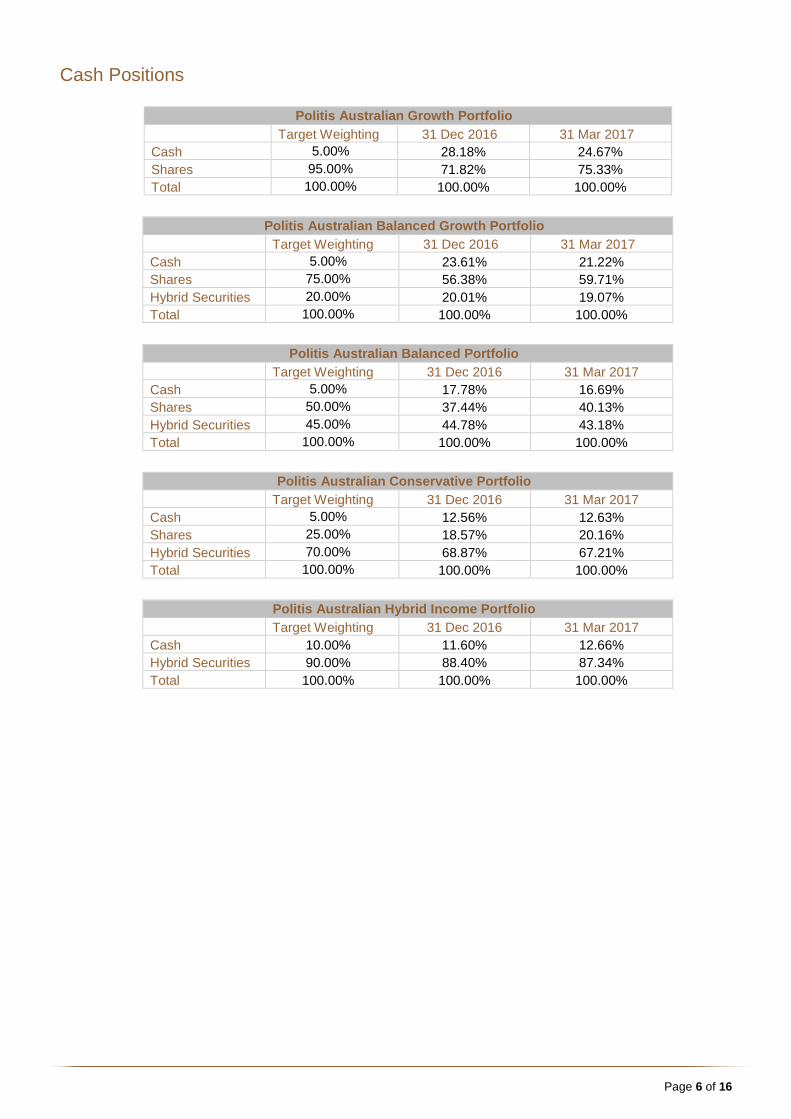
Cash Positions
Politis Australian Growth Portfolio
Target Weighting 31 Dec 2016 31 Mar 2017
Cash 5.00% 28.18% 24.67%
Shares 95.00% 71.82% 75.33%
Total 100.00% 100.00% 100.00%
Politis Australian Balanced Growth Portfolio
Target Weighting 31 Dec 2016 31 Mar 2017
Cash 5.00% 23.61% 21.22%
Shares 75.00% 56.38% 59.71%
Hybrid Securities 20.00% 20.01% 19.07%
Total 100.00% 100.00% 100.00%
Politis Australian Balanced Portfolio
Target Weighting 31 Dec 2016 31 Mar 2017
Cash 5.00% 17.78% 16.69%
Shares 50.00% 37.44% 40.13%
Hybrid Securities 45.00% 44.78% 43.18%
Total 100.00% 100.00% 100.00%
Politis Australian Conservative Portfolio
Target Weighting 31 Dec 2016 31 Mar 2017
Cash 5.00% 12.56% 12.63%
Shares 25.00% 18.57% 20.16%
Hybrid Securities 70.00% 68.87% 67.21%
Total 100.00% 100.00% 100.00%
Politis Australian Hybrid Income Portfolio
Target Weighting 31 Dec 2016 31 Mar 2017
Cash 10.00% 11.60% 12.66%
Hybrid Securities 90.00% 88.40% 87.34%
Total 100.00% 100.00% 100.00%
Page 7 of 16
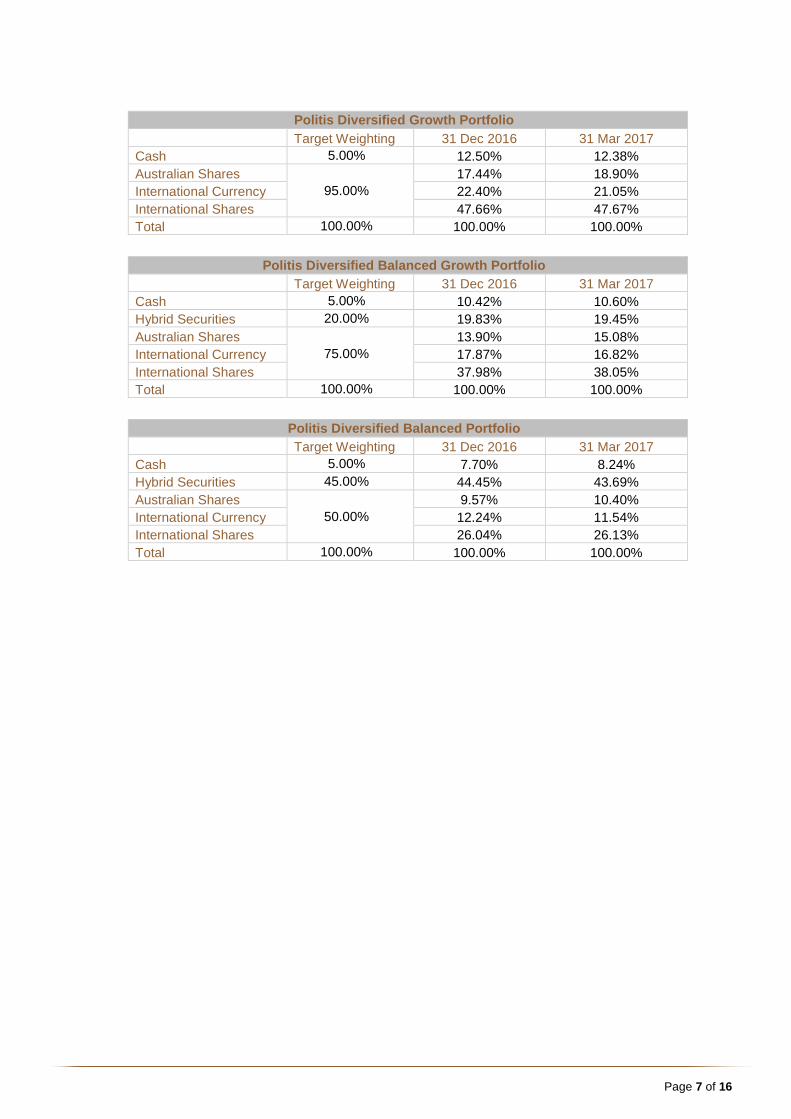
Politis Diversified Growth Portfolio
Target Weighting 31 Dec 2016 31 Mar 2017
Cash 5.00% 12.50% 12.38%
Australian Shares
95.00%
17.44% 18.90%
International Currency 22.40% 21.05%
International Shares 47.66% 47.67%
Total 100.00% 100.00% 100.00%
Politis Diversified Balanced Growth Portfolio
Target Weighting 31 Dec 2016 31 Mar 2017
Cash 5.00% 10.42% 10.60%
Hybrid Securities 20.00% 19.83% 19.45%
Australian Shares
75.00%
13.90% 15.08%
International Currency 17.87% 16.82%
International Shares 37.98% 38.05%
Total 100.00% 100.00% 100.00%
Politis Diversified Balanced Portfolio
Target Weighting 31 Dec 2016 31 Mar 2017
Cash 5.00% 7.70% 8.24%
Hybrid Securities 45.00% 44.45% 43.69%
Australian Shares
50.00%
9.57% 10.40%
International Currency 12.24% 11.54%
International Shares 26.04% 26.13%
Total 100.00% 100.00% 100.00%
Page 8 of 16
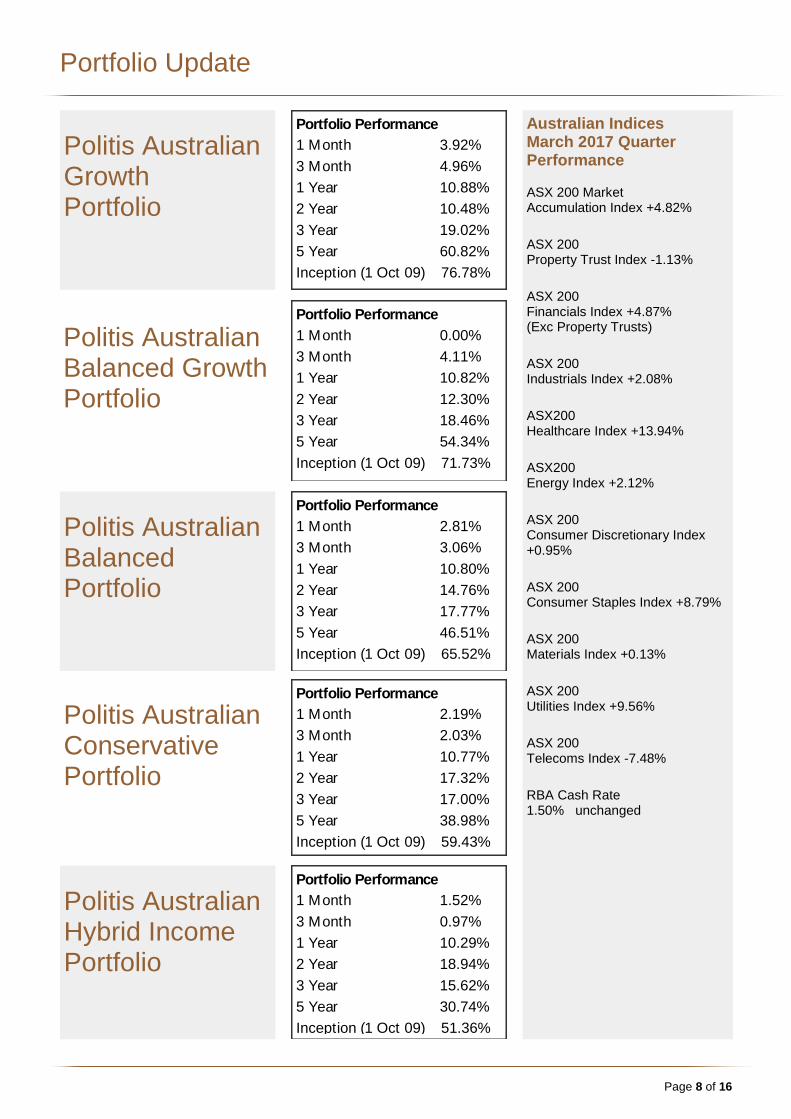
Portfolio Update
Politis Australian Growth Portfolio
Politis Australian Balanced Growth Portfolio
Politis Australian Balanced Portfolio
Portfolio Performance
1 Month 1.52%
3 Month 0.97%
1 Year 10.29%
2 Year 18.94%
3 Year 15.62%
5 Year 30.74%
Inception (1 Oct 09) 51.36%
Politis Australian Hybrid Income Portfolio
Politis Australian Conservative Portfolio
Australian Indices March 2017 Quarter Performance ASX 200 Market Accumulation Index +4.82%
ASX 200 Property Trust Index -1.13%
ASX 200 Financials Index +4.87% (Exc Property Trusts)
ASX 200 Industrials Index +2.08%
ASX200 Healthcare Index +13.94%
ASX200 Energy Index +2.12%
ASX 200 Consumer Discretionary Index +0.95%
ASX 200 Consumer Staples Index +8.79%
ASX 200 Materials Index +0.13%
ASX 200 Utilities Index +9.56%
ASX 200 Telecoms Index -7.48%
RBA Cash Rate 1.50% unchanged
Portfolio Performance
1 Month 2.19%
3 Month 2.03%
1 Year 10.77%
2 Year 17.32%
3 Year 17.00%
5 Year 38.98%
Inception (1 Oct 09) 59.43%
Portfolio Performance
1 Month 2.81%
3 Month 3.06%
1 Year 10.80%
2 Year 14.76%
3 Year 17.77%
5 Year 46.51%
Inception (1 Oct 09) 65.52%
Portfolio Performance
1 Month 0.00%
3 Month 4.11%
1 Year 10.82%
2 Year 12.30%
3 Year 18.46%
5 Year 54.34%
Inception (1 Oct 09) 71.73%
Portfolio Performance
1 Month 3.92%
3 Month 4.96%
1 Year 10.88%
2 Year 10.48%
3 Year 19.02%
5 Year 60.82%
Inception (1 Oct 09) 76.78%
Page 9 of 16
Portfolio Update
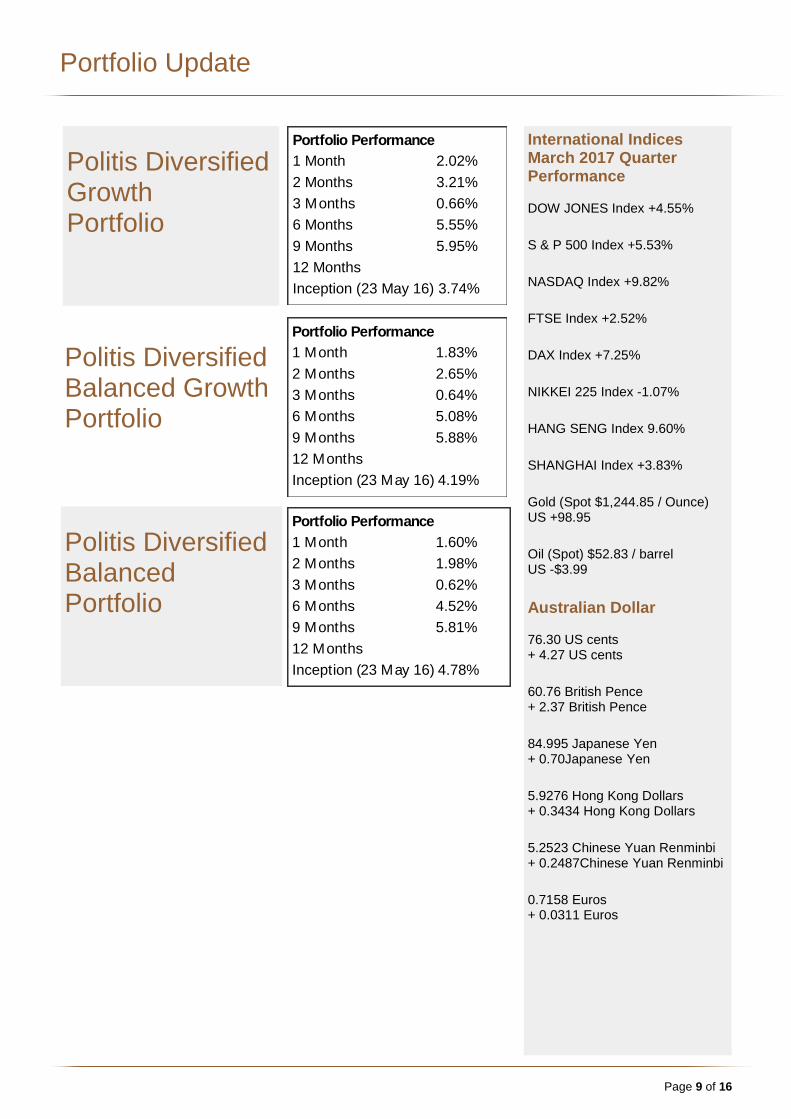
Politis Diversified Growth Portfolio
Portfolio Performance
1 Month 2.02%
2 Months 3.21%
3 Months 0.66%
6 Months 5.55%
9 Months 5.95%
12 Months
Inception (23 May 16) 3.74%
International Indices March 2017 Quarter Performance DOW JONES Index +4.55%
S & P 500 Index +5.53%
NASDAQ Index +9.82%
FTSE Index +2.52%
DAX Index +7.25%
NIKKEI 225 Index -1.07%
HANG SENG Index 9.60%
SHANGHAI Index +3.83%
Gold (Spot $1,244.85 / Ounce) US +98.95
Oil (Spot) $52.83 / barrel US -$3.99
Australian Dollar 76.30 US cents + 4.27 US cents
60.76 British Pence + 2.37 British Pence
84.995 Japanese Yen + 0.70Japanese Yen
5.9276 Hong Kong Dollars + 0.3434 Hong Kong Dollars
5.2523 Chinese Yuan Renminbi + 0.2487Chinese Yuan Renminbi
0.7158 Euros + 0.0311 Euros
Politis Diversified Balanced Growth Portfolio
Politis Diversified Balanced Portfolio
Portfolio Performance
1 Month 1.60%
2 Months 1.98%
3 Months 0.62%
6 Months 4.52%
9 Months 5.81%
12 Months
Inception (23 May 16) 4.78%
Portfolio Performance
1 Month 1.83%
2 Months 2.65%
3 Months 0.64%
6 Months 5.08%
9 Months 5.88%
12 Months
Inception (23 May 16) 4.19%

Page 10 of 16
Portfolio Performance
Politis Australian Growth Portfolio
Since inception (October 2009) the Politis Australian Growth Portfolio has seen an increase of 76.78%
compared to the Target Return (Consumer Price Index (CPI) +5%) which has seen an increase of
60.24% over the same period, representing an outperformance of 16.54%. $1 million invested in the
growth portfolio at inception would now be valued at $1,661,348.
Politis Australian Balanced Growth Portfolio
Since inception (October 2009) the Politis Australian Balanced Growth Portfolio has seen an increase
of 71.73% compared to the Target Return (CPI +4%) which has seen an increase of 50.69% over the
same period, representing an outperformance of 21.04%. $1 million invested in the balanced growth
portfolio at inception would now be valued at $1,602,126.
Page 11 of 16
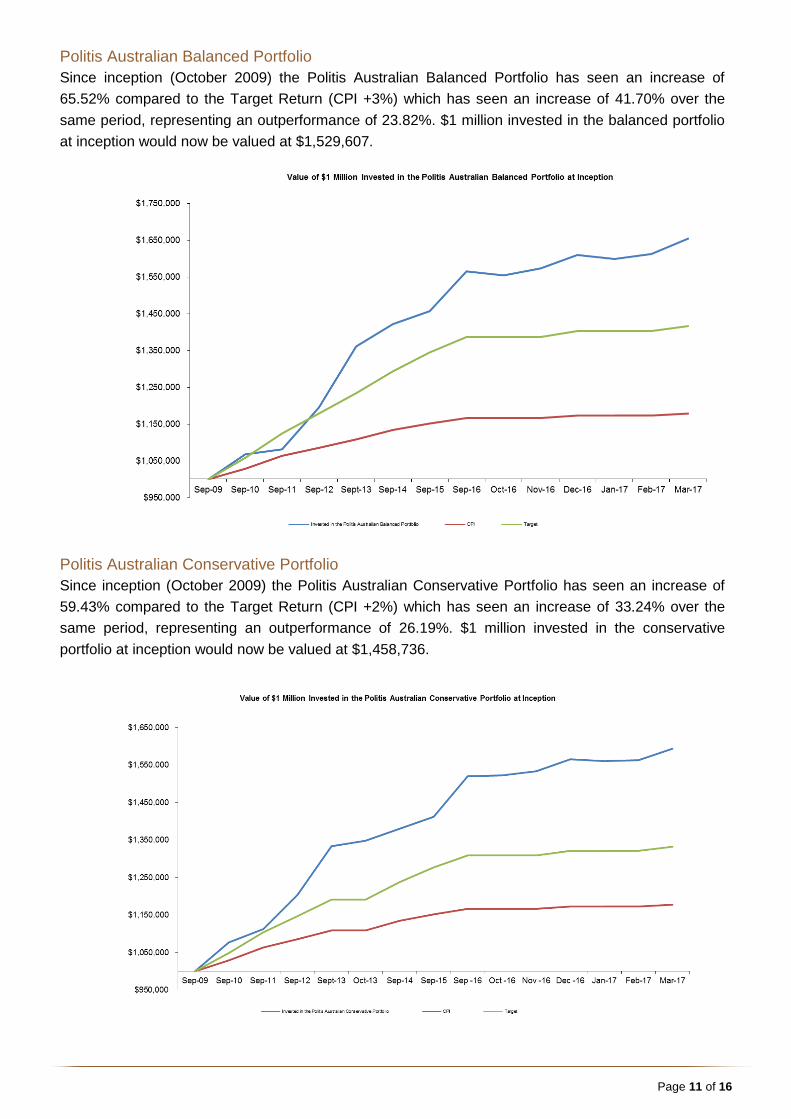
Politis Australian Balanced Portfolio
Since inception (October 2009) the Politis Australian Balanced Portfolio has seen an increase of
65.52% compared to the Target Return (CPI +3%) which has seen an increase of 41.70% over the
same period, representing an outperformance of 23.82%. $1 million invested in the balanced portfolio
at inception would now be valued at $1,529,607.
Politis Australian Conservative Portfolio
Since inception (October 2009) the Politis Australian Conservative Portfolio has seen an increase of
59.43% compared to the Target Return (CPI +2%) which has seen an increase of 33.24% over the
same period, representing an outperformance of 26.19%. $1 million invested in the conservative
portfolio at inception would now be valued at $1,458,736.
Page 12 of 16
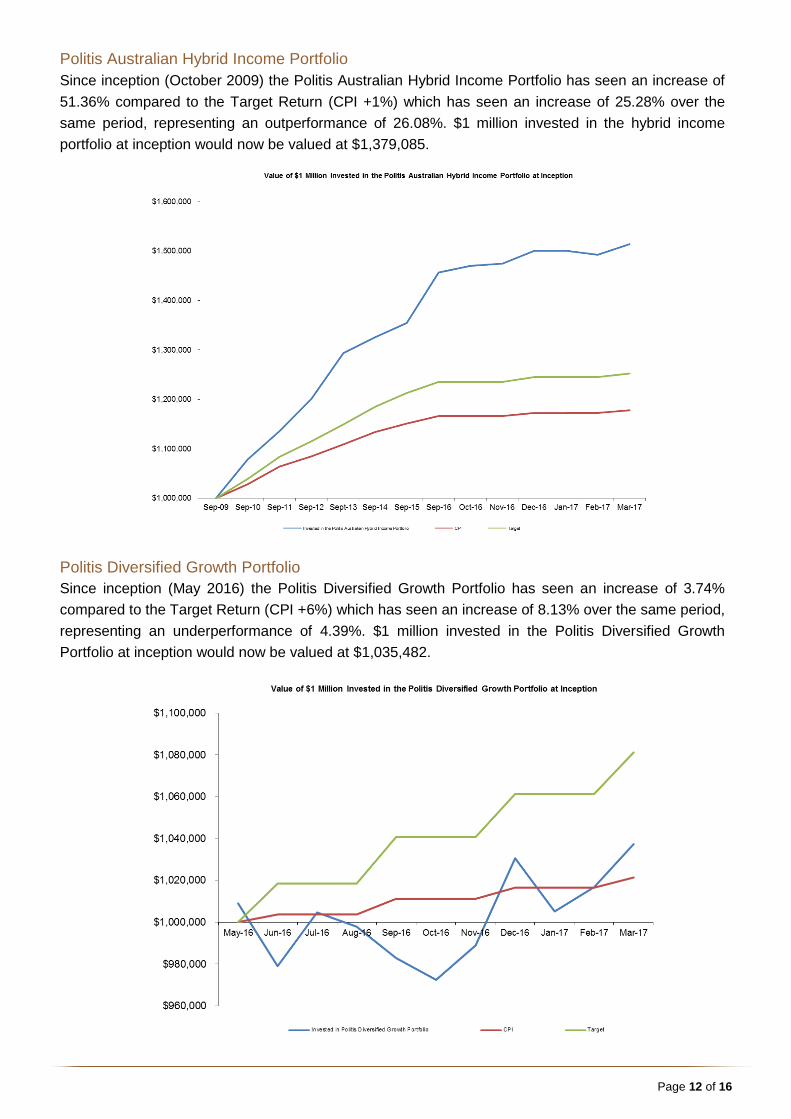
Politis Australian Hybrid Income Portfolio
Since inception (October 2009) the Politis Australian Hybrid Income Portfolio has seen an increase of
51.36% compared to the Target Return (CPI +1%) which has seen an increase of 25.28% over the
same period, representing an outperformance of 26.08%. $1 million invested in the hybrid income
portfolio at inception would now be valued at $1,379,085.
Politis Diversified Growth Portfolio
Since inception (May 2016) the Politis Diversified Growth Portfolio has seen an increase of 3.74%
compared to the Target Return (CPI +6%) which has seen an increase of 8.13% over the same period,
representing an underperformance of 4.39%. $1 million invested in the Politis Diversified Growth
Portfolio at inception would now be valued at $1,035,482.
Page 13 of 16
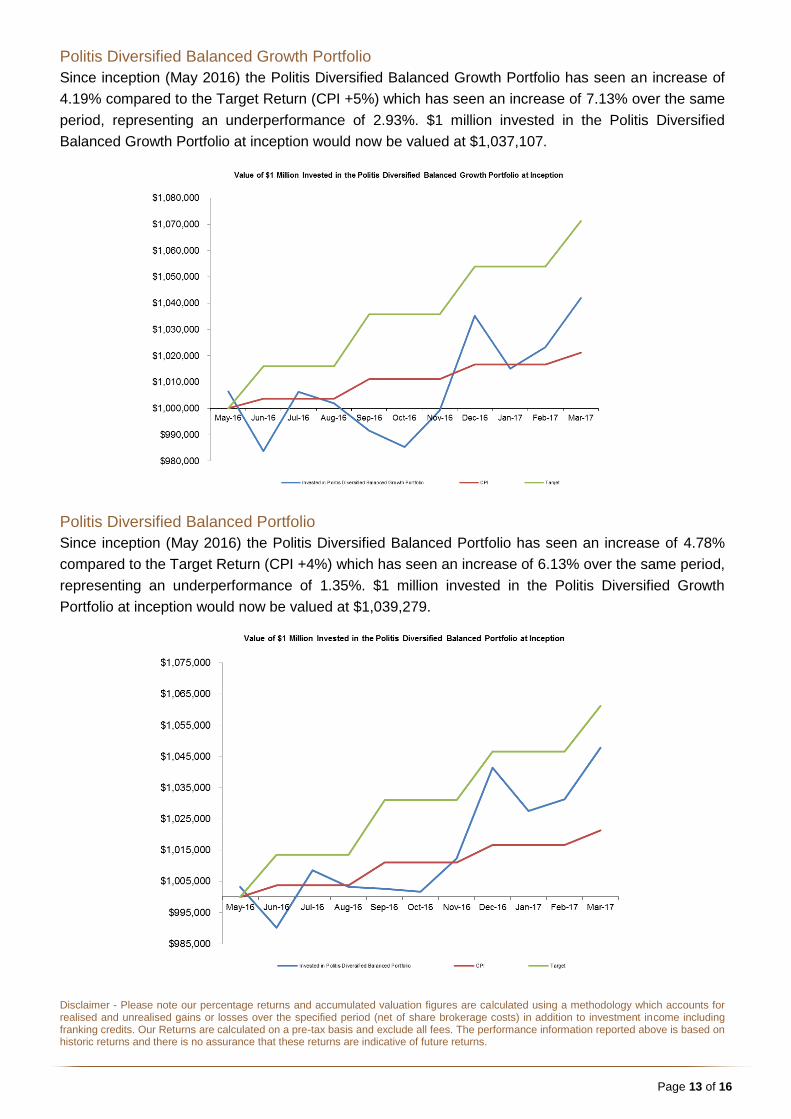
Politis Diversified Balanced Growth Portfolio
Since inception (May 2016) the Politis Diversified Balanced Growth Portfolio has seen an increase of
4.19% compared to the Target Return (CPI +5%) which has seen an increase of 7.13% over the same
period, representing an underperformance of 2.93%. $1 million invested in the Politis Diversified
Balanced Growth Portfolio at inception would now be valued at $1,037,107.
Politis Diversified Balanced Portfolio
Since inception (May 2016) the Politis Diversified Balanced Portfolio has seen an increase of 4.78%
compared to the Target Return (CPI +4%) which has seen an increase of 6.13% over the same period,
representing an underperformance of 1.35%. $1 million invested in the Politis Diversified Growth
Portfolio at inception would now be valued at $1,039,279.
Disclaimer - Please note our percentage returns and accumulated valuation figures are calculated using a methodology which accounts for realised and unrealised gains or losses over the specified period (net of share brokerage costs) in addition to investment income including franking credits. Our Returns are calculated on a pre-tax basis and exclude all fees. The performance information reported above is based on historic returns and there is no assurance that these returns are indicative of future returns.
Page 14 of 16
Financial Planning News
30 June 2017 Reminders
The approach to 30 June is always an important time of year to make sure your tax position is
optimised for the financial year. Given the upcoming changes set to take effect from 1 July 2017, this
lead up to 30 June could be even more important.
Changes to Non Concessional Contribution Limits
One of the most significant changes is the reduction in the non concessional contribution limit. Up until
30 June 2017, there is still an opportunity to take advantage of the $540,000 limit (or $180,000 limit if
you are over 65 and meet the work test). From 1 July 2017 the 3 year limit will be reduced to
$300,000, some $240,000 less than the current limit. The annual limit will be $100,000, $80,000 less
than the current $180,000.
Those with $1.6 million or more in superannuation will not be able to make any further non
concessional contributions. Those with $1.4 million or more will not be able to fully utilise the $300,000
limit.
If you have surplus personal cash available, or are considering applying the withdrawal and
recontribution strategy to improve the tax components of your superannuation balance, taking action
before 30 June may be beneficial.
Changes to Concessional Contribution Limits and Eligibility to Claim a Deduction
Up until 30 June 2017, those who are over 50 have a concessional contribution limit of $35,000 while
those under 50 have a limit of $30,000. From 1 July 2017 this limit will be $25,000 regardless of age.
Concessional contributions include employer mandated amounts, salary sacrifice amounts and
personal contributions for which a tax deduction is claimed.
For those who are currently contributing more than $25,000 per annum through their payroll (i.e. total
of employer mandated and salary sacrifice) you should be ready to reduce the amount from 1 July
2017.
It may actually be convenient for many to cease their salary sacrifice arrangements from 1 July 2017,
as there will be an alternative measure available from 1 July 2017 that will still allow to you to obtain a
tax benefit from contributing to superannuation.
Currently, only those who have less than 10% of their income derived from employment are able to
make a contribution from their personal bank account and claim a tax deduction. Generally speaking it
is just sole traders or those with investment related income who can take advantage of this.

Page 15 of 16
From 1 July 2017, all individuals who are eligible to contribute to superannuation will be able to claim a
tax deduction for personal contributions. Therefore, salary and wage earners will not need to commit to
a regular sacrificed amount out of their wage or salary. At any stage during the financial year they will
be able to transfer an amount to their superannuation fund and claim a tax deduction on lodgement of
their income tax return. However, it is important to note the procedure for doing so.
To deduct the contribution, or a part of the contribution you must give to the trustee of the fund
a) a valid notice, in the approved form, of your intention to claim the deduction; and
b) the notice must be given before:
if you have lodged your income tax return for the income year in which the contribution was
made on a day before the end of the next income year - the end of that day; or
otherwise - the end of the next income year
The legislation goes on to require that the trustee of the fund must give you an acknowledgement of
the notice and you must have that acknowledgement. Failure to satisfy any of the above will result in
no deduction being allowed.
Accordingly, those making deductible personal contributions must ensure that a notice of intention in
the approved form is given to the trustee of their fund and an acknowledgement is received back within
the timeframes set out above.
Before deciding to cease salary sacrifice arrangements in favour of taking advantage of the increased
flexibility surrounding personal concessional contributions, you should keep in mind these
requirements. For some it may be easier to continue salary sacrifice arrangements, albeit reviewed
from current year in light of reduced contribution limits.
$1.6 Million Limit On Retirement Phase Pension Accounts
If you have pension accounts with a value in excess of $1.6 million, you will need to take action at or
before the 30th of June to ensure you adhere to this limit by 1 July 2017. This may mean returning
money to accumulation phase or withdrawing funds from the superannuation environment.
Please contact your adviser if you wish to discuss how these changes may have an impact on your
financial situation.
Disclaimer - The information in this newsletter is general in nature and does not take into account your personal circumstances, financial needs or objectives. Before acting on any information in this newsletter, you should consider the appropriateness of it having regard to your objectives, financial situation and needs. In particular, you should seek financial advice prior to acting on any of the information.
POLITIS INVESTMENT STRATEGIES
Head Office Location 1st Floor, NCYC Commercial Centre 91 Hannell St, Wickham NSW 2293
Head Office Postal
PO Box 168, Wickham NSW 2293
Head Office Contact T: (02) 4962 5525 F: (02) 4962 5526
www.politis.com.au
Politis Investment Strategies Pty Ltd - ABN: 71 106 823 241 - AFSL: 253125