potential modification of the hcm pedestrian level of ... · pdf filehcm pedestrian level of...
TRANSCRIPT
Potential Modification of the HCM Pedestrian Level of Service Model for Arterial Roadways
final report
March 2014

HCM Pedestrian Level of Service Model for Arterial Roadways
Final Report
Potential Modification of the
HCM Pedestrian Level of Service Model for
Arterial Roadways
Prepared by
Sprinkle Consulting
Cambridge Systematics
For the
Florida Department of Transportation
Systems Planning Office
March 2014
HCM Pedestrian Level of Service Model for Arterial Roadways
ContentsExecutive Summary ....................................................................................................................................... 3
Background ................................................................................................................................................... 5
NCHRP 3‐70 Multimodal Level of Service Analysis for Urban Streets ...................................................... 5
The Existing HCM Model ........................................................................................................................... 6
Assumptions .................................................................................................................................................. 7
The Components of the Arterial Model .................................................................................................... 7
Approach ....................................................................................................................................................... 8
Initial Weighting ........................................................................................................................................ 8
Discussion of the Exponents ..................................................................................................................... 9
LOS Exponential Method Discussion ................................................................................................... 10
Application of the Roadway Crossing Difficulty Factor ....................................................................... 15
Recommended Model ................................................................................................................................ 15
Acknowledgements ..................................................................................................................................... 15
References .................................................................................................................................................. 15
Appendix 1 Sensitivity Analysis for LOS‐Based Exponential Methodology ................................................. 17
HCM Pedestrian Level of Service Model for Arterial Roadways
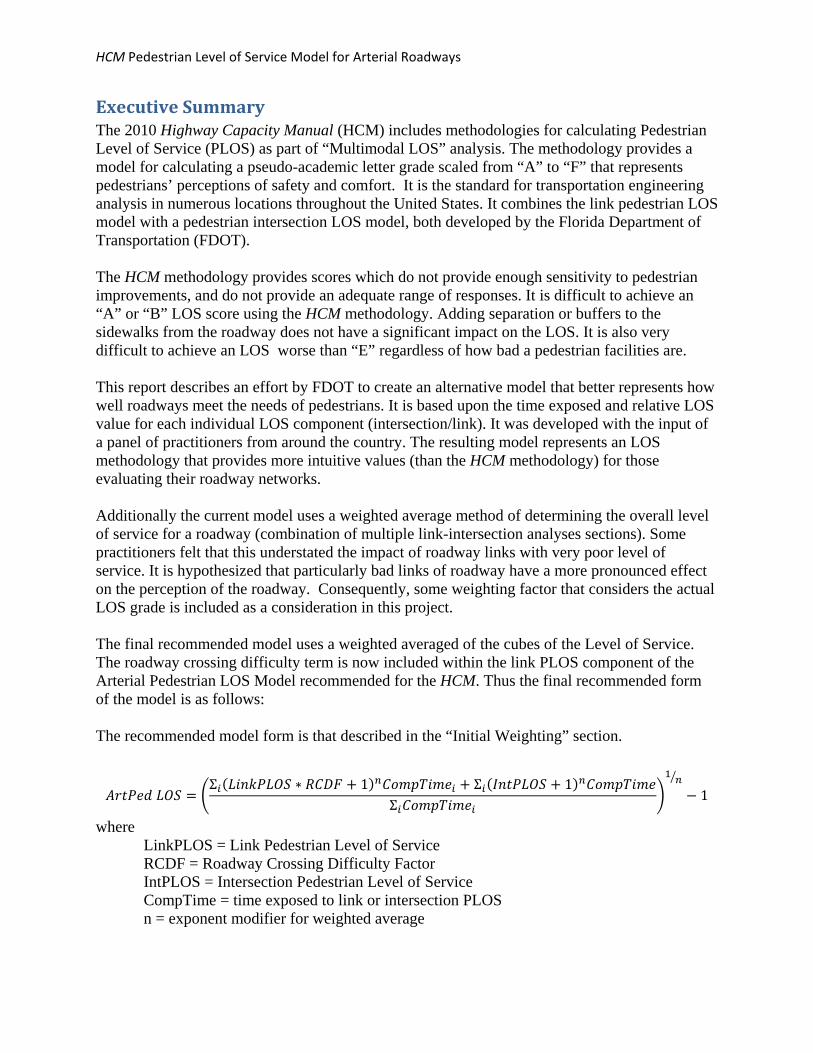
ExecutiveSummaryThe 2010 Highway Capacity Manual (HCM) includes methodologies for calculating Pedestrian Level of Service (PLOS) as part of “Multimodal LOS” analysis. The methodology provides a model for calculating a pseudo-academic letter grade scaled from “A” to “F” that represents pedestrians’ perceptions of safety and comfort. It is the standard for transportation engineering analysis in numerous locations throughout the United States. It combines the link pedestrian LOS model with a pedestrian intersection LOS model, both developed by the Florida Department of Transportation (FDOT). The HCM methodology provides scores which do not provide enough sensitivity to pedestrian improvements, and do not provide an adequate range of responses. It is difficult to achieve an “A” or “B” LOS score using the HCM methodology. Adding separation or buffers to the sidewalks from the roadway does not have a significant impact on the LOS. It is also very difficult to achieve an LOS worse than “E” regardless of how bad a pedestrian facilities are. This report describes an effort by FDOT to create an alternative model that better represents how well roadways meet the needs of pedestrians. It is based upon the time exposed and relative LOS value for each individual LOS component (intersection/link). It was developed with the input of a panel of practitioners from around the country. The resulting model represents an LOS methodology that provides more intuitive values (than the HCM methodology) for those evaluating their roadway networks. Additionally the current model uses a weighted average method of determining the overall level of service for a roadway (combination of multiple link-intersection analyses sections). Some practitioners felt that this understated the impact of roadway links with very poor level of service. It is hypothesized that particularly bad links of roadway have a more pronounced effect on the perception of the roadway. Consequently, some weighting factor that considers the actual LOS grade is included as a consideration in this project. The final recommended model uses a weighted averaged of the cubes of the Level of Service. The roadway crossing difficulty term is now included within the link PLOS component of the Arterial Pedestrian LOS Model recommended for the HCM. Thus the final recommended form of the model is as follows: The recommended model form is that described in the “Initial Weighting” section.
Σ ∗ 1 Σ 1
Σ1
where LinkPLOS = Link Pedestrian Level of Service RCDF = Roadway Crossing Difficulty Factor IntPLOS = Intersection Pedestrian Level of Service CompTime = time exposed to link or intersection PLOS n = exponent modifier for weighted average

HCM Pedestrian Level of Service Model for Arterial Roadways
CompTime for links was calculated using the link length and an assumed pedestrian speed of 4.5 feet per second, for intersections CompTime was calculated using the simple delay equation
2
where C = cycle length g = green time
HCM Pedestrian Level of Service Model for Arterial Roadways
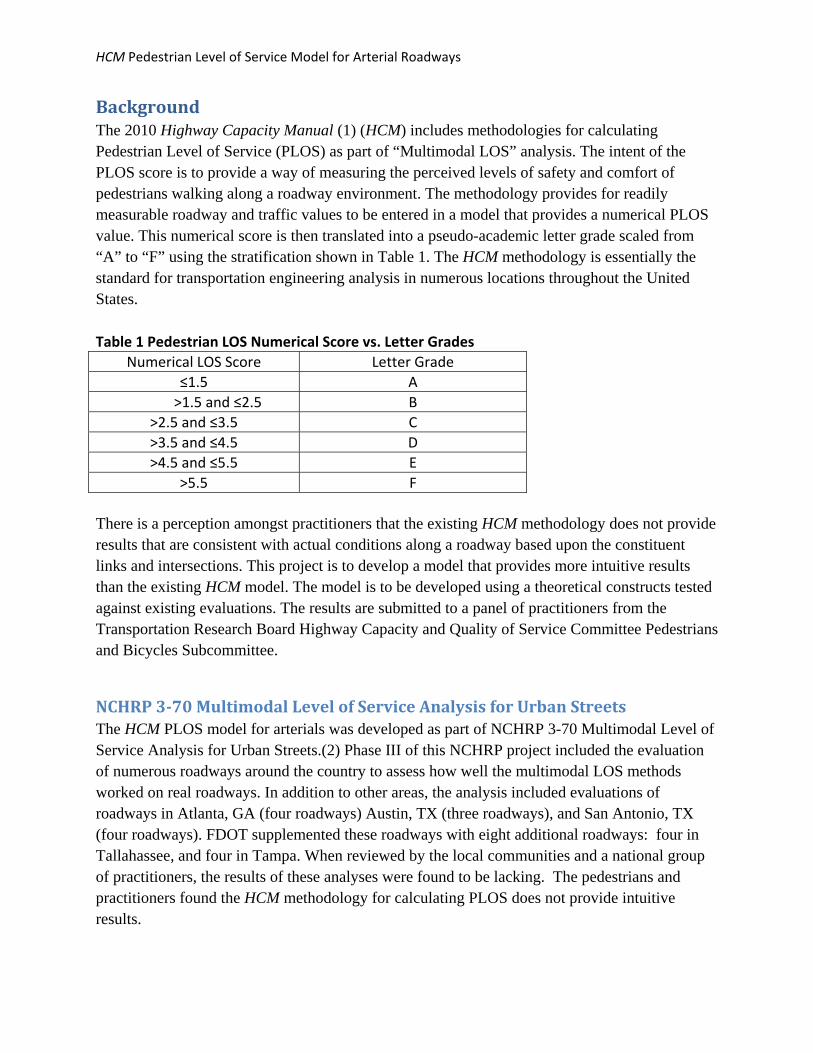
BackgroundThe 2010 Highway Capacity Manual (1) (HCM) includes methodologies for calculating Pedestrian Level of Service (PLOS) as part of “Multimodal LOS” analysis. The intent of the PLOS score is to provide a way of measuring the perceived levels of safety and comfort of pedestrians walking along a roadway environment. The methodology provides for readily measurable roadway and traffic values to be entered in a model that provides a numerical PLOS value. This numerical score is then translated into a pseudo-academic letter grade scaled from “A” to “F” using the stratification shown in Table 1. The HCM methodology is essentially the standard for transportation engineering analysis in numerous locations throughout the United States. Table 1 Pedestrian LOS Numerical Score vs. Letter Grades
Numerical LOS Score Letter Grade
≤1.5 A
>1.5 and ≤2.5 B
>2.5 and ≤3.5 C
>3.5 and ≤4.5 D
>4.5 and ≤5.5 E
>5.5 F There is a perception amongst practitioners that the existing HCM methodology does not provide results that are consistent with actual conditions along a roadway based upon the constituent links and intersections. This project is to develop a model that provides more intuitive results than the existing HCM model. The model is to be developed using a theoretical constructs tested against existing evaluations. The results are submitted to a panel of practitioners from the Transportation Research Board Highway Capacity and Quality of Service Committee Pedestrians and Bicycles Subcommittee.
NCHRP3‐70MultimodalLevelofServiceAnalysisforUrbanStreetsThe HCM PLOS model for arterials was developed as part of NCHRP 3-70 Multimodal Level of Service Analysis for Urban Streets.(2) Phase III of this NCHRP project included the evaluation of numerous roadways around the country to assess how well the multimodal LOS methods worked on real roadways. In addition to other areas, the analysis included evaluations of roadways in Atlanta, GA (four roadways) Austin, TX (three roadways), and San Antonio, TX (four roadways). FDOT supplemented these roadways with eight additional roadways: four in Tallahassee, and four in Tampa. When reviewed by the local communities and a national group of practitioners, the results of these analyses were found to be lacking. The pedestrians and practitioners found the HCM methodology for calculating PLOS does not provide intuitive results.
HCM Pedestrian Level of Service Model for Arterial Roadways
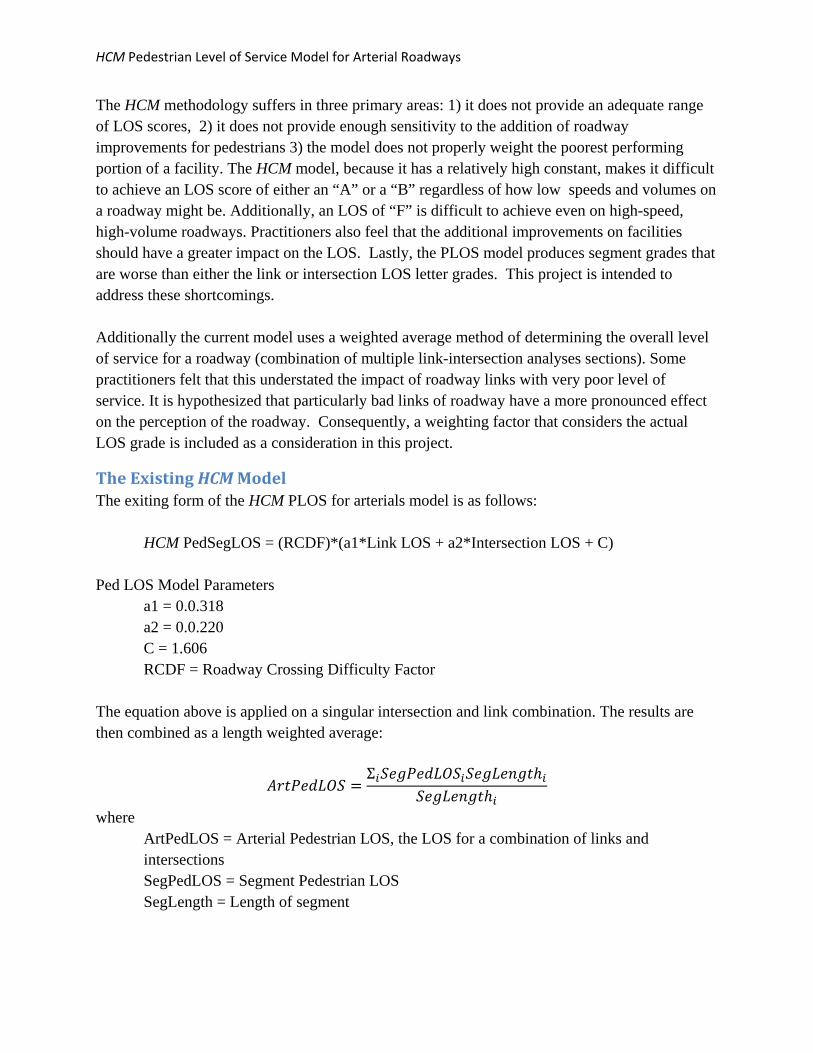
The HCM methodology suffers in three primary areas: 1) it does not provide an adequate range of LOS scores, 2) it does not provide enough sensitivity to the addition of roadway improvements for pedestrians 3) the model does not properly weight the poorest performing portion of a facility. The HCM model, because it has a relatively high constant, makes it difficult to achieve an LOS score of either an “A” or a “B” regardless of how low speeds and volumes on a roadway might be. Additionally, an LOS of “F” is difficult to achieve even on high-speed, high-volume roadways. Practitioners also feel that the additional improvements on facilities should have a greater impact on the LOS. Lastly, the PLOS model produces segment grades that are worse than either the link or intersection LOS letter grades. This project is intended to address these shortcomings. Additionally the current model uses a weighted average method of determining the overall level of service for a roadway (combination of multiple link-intersection analyses sections). Some practitioners felt that this understated the impact of roadway links with very poor level of service. It is hypothesized that particularly bad links of roadway have a more pronounced effect on the perception of the roadway. Consequently, a weighting factor that considers the actual LOS grade is included as a consideration in this project.
TheExistingHCMModelThe exiting form of the HCM PLOS for arterials model is as follows:
HCM PedSegLOS = (RCDF)*(a1*Link LOS + a2*Intersection LOS + C) Ped LOS Model Parameters
a1 = 0.0.318 a2 = 0.0.220 C = 1.606 RCDF = Roadway Crossing Difficulty Factor
The equation above is applied on a singular intersection and link combination. The results are then combined as a length weighted average:
Σ
where ArtPedLOS = Arterial Pedestrian LOS, the LOS for a combination of links and intersections SegPedLOS = Segment Pedestrian LOS SegLength = Length of segment

HCM Pedestrian Level of Service Model for Arterial Roadways
Assumptions
TheComponentsoftheArterialModelThe component models of the HCM PLOS for arterials methodology are the FDOT PLOS link (3,4) and the FDOT PLOS for the intersection through movement (5). Both of these models were developed with input from actual pedestrians walking courses in urban and suburban areas. They have been used in many communities around the country and provide results that practitioners have felt are intuitive. They were used as the link and intersection components of the HCM methodology and will be used as the link and intersection components for this proposed revision to the HCM methodology. Other Assumptions The evaluation spreadsheets used for the FDOT‘s 3-70 testing were reviewed so that the programming could be used in the comparison of HCM results to results obtained from potential modifications to the model.
When beginning this project, a sample roadway was evaluated using the HCM methodology. Using a sample of five segments, with various inputs the results shown in Table 2 were reported by the FDOT 3-70 testing spreadsheet. Each line represents one link and a single downstream signal. Table 2 ‐ Computed Pedestrian LOS
Segment Link Intersect RCDF Ped Ped Link and LOS LOS Score LOS Signal (#) (#) (#) (#)
1 3.69 9.00 1.17 5.55 F
2 2.32 5.68 1.20 4.31 E
3 1.97 3.60 1.20 3.63 D
4 1.58 2.33 1.20 3.14 C
5 2.11 2.14 1.00 2.75 B
Average 4.70 E
Please note the following observations regarding the values in Table 2:
On every segment, the Pedestrian LOS score is worse than the link LOS.
Lines 3, 4, and 5 the Pedestrian LOS score is worse than both the link and intersection LOS scores. This is true even on line 5 where there is no modification based upon the RCDF.

HCM Pedestrian Level of Service Model for Arterial Roadways
ApproachThis project is testing the application of the model form developed for the mode with the “HCM Pedestrian Level of Service Model for Arterial Roadways” project recently completed for FDOT. Thus, for this project the consultant is evaluating an exposure weighted coefficients for the ArtPedLOS model.1 The term ArtPedLOS refers to the level of service calculated over a segment (combination of multiple links and intersections. When this paper refers to the HCM PLOS model, it will be stated specifically. Because intersections do not represent a length along a facility, it was suggested that time would be a better weighting factor than distance. An additional consideration was the impact of links with varying “badness” on the perception of the overall arterial roadway. It is hypothesized that particularly bad links of roadway have a more pronounced effect on the perception of the roadway. An exponential weighted average was considered to compensate for this hypothesized phenomenon.
InitialWeightingOne method for addressing the above is to apply an exponent to the LOS score for the link or intersection. A problem with this approach is applying exponents to values less than one produce inconsistent results. For instance between zero and one exponential values would weight lower scores better than higher scores, counteracting the desired results. Cubed scores less than negative one would also disproportionately improve the overall score, again contrary to the desired impact. Squared scores below zero would degrade the overall results which is also contradictory to desired results. Figure 1 shows the relationship of linear, square, and cubic functions. Figure 1. Linear, Squared, and Cubed Functions
1 The term ArtPedLOS refers to the level of service calculated over a segment (combination of multiple links and intersections. When this paper refers to the HCM PLOS model, it will be stated specifically.
HCM Pedestrian Level of Service Model for Arterial Roadways
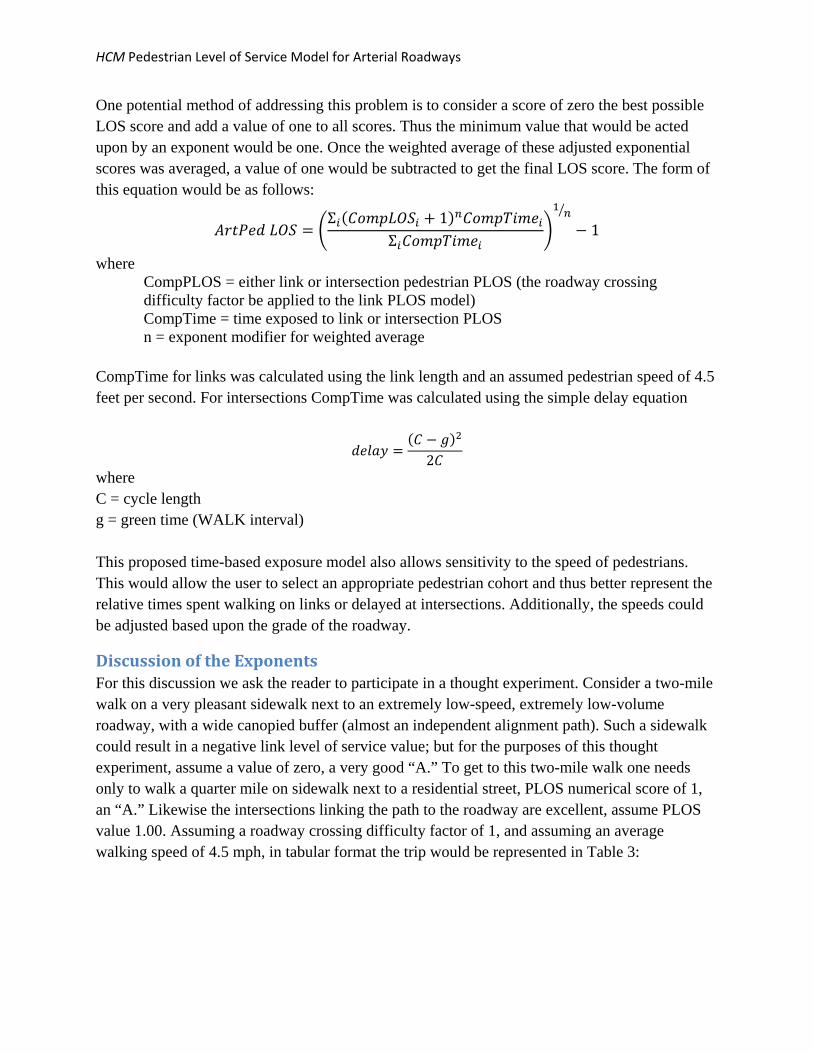
One potential method of addressing this problem is to consider a score of zero the best possible LOS score and add a value of one to all scores. Thus the minimum value that would be acted upon by an exponent would be one. Once the weighted average of these adjusted exponential scores was averaged, a value of one would be subtracted to get the final LOS score. The form of this equation would be as follows:
Σ 1
Σ1
where CompPLOS = either link or intersection pedestrian PLOS (the roadway crossing difficulty factor be applied to the link PLOS model) CompTime = time exposed to link or intersection PLOS n = exponent modifier for weighted average
CompTime for links was calculated using the link length and an assumed pedestrian speed of 4.5 feet per second. For intersections CompTime was calculated using the simple delay equation
2
where C = cycle length g = green time (WALK interval) This proposed time-based exposure model also allows sensitivity to the speed of pedestrians. This would allow the user to select an appropriate pedestrian cohort and thus better represent the relative times spent walking on links or delayed at intersections. Additionally, the speeds could be adjusted based upon the grade of the roadway.
DiscussionoftheExponentsFor this discussion we ask the reader to participate in a thought experiment. Consider a two-mile walk on a very pleasant sidewalk next to an extremely low-speed, extremely low-volume roadway, with a wide canopied buffer (almost an independent alignment path). Such a sidewalk could result in a negative link level of service value; but for the purposes of this thought experiment, assume a value of zero, a very good “A.” To get to this two-mile walk one needs only to walk a quarter mile on sidewalk next to a residential street, PLOS numerical score of 1, an “A.” Likewise the intersections linking the path to the roadway are excellent, assume PLOS value 1.00. Assuming a roadway crossing difficulty factor of 1, and assuming an average walking speed of 4.5 mph, in tabular format the trip would be represented in Table 3:

HCM Pedestrian Level of Service Model for Arterial Roadways
Table 3 – Lane‐Path‐Lane Lane Example
PLOS Score Time of Exposure (Seconds)
Link Intersection Link Intersection
Section 1 1.00 A 1.00 A 293 10
Section 2 0.00 A 1.00 A 2347 10
Section 3 1.00 A N/A N/A 293 N/A
LOSExponentialMethodDiscussionTable 4 provides a tabular summary of the four different potential models results. Figure 2 graphically represents the pedestrian trip described above and five different potential approaches to the exponential LOS-weighted LOS: HCM, linear-, squared-, and cubed-weighted averages.
Figure 2. Lane-Path-Lane LOS Exponents

HCM Pedestrian Level of Service Model for Arterial Roadways
Consider Figure 1.
The solid LOS line indicates the link or intersection LOS experienced at any given point during the trip (trip time has been converted to % of trip time so all charts in this paper will have a similar horizontal scale).
The HCM (long dash‐dot) line represents the ArtPedLOS as calculated using the HCM method.
The Linear Time Weighting (long dash) line represents the time weighted average LOS with no exponent applied (linear).
The Squared Time Weighting (medium dash) line represents the time weighted average LOS with an exponent of 2 applied (squared).
The Cubed Time Weighting (short dash) line represents the time weighted average LOS with an exponent of 3 applied (cubed).
From this example it is clear that the HCM method provides a resultant PLOS that is much worse than one would reasonably expect. The three time-weighted PLOS methods all yield what could be considered reasonable results. This example provides little support for using any method more complicated than a linear time-weighted average of the individual component PLOS scores.
As another thought experiment, consider that to get to this two-mile path-like sidewalk, one must walk on a quarter mile of sidewalk next to an unpleasant very congested, higher speed highway with no buffer to the travel lanes or paved shoulders. Assume a PLOS value of 6.00 for this roadway. Further assume the intersections have a PLOS value of 3.00 and a roadway crossing difficulty factor of 1. The trip is represented in tabular format in Table 5; the summary of the method results are presented in Table 6 and Figure 3.
Table 5– Highway‐Path‐Highway Example
PLOS Score Time of Exposure (Seconds)
Link Intersection Link Intersection
Section 1 6.00 F 3.00 C 293 10
Section 2 0.00 A 3.00 C 2347 10
Section 3 6.00 F N/A N/A 293 N/A
Table 4 Lane‐Path‐Lane Example Pedestrian LOS
Method Numerical Value Letter Grade
HCM 1.89 B
Linear time weighted 0.21 A
Squared time weighted 0.27 A
Cubic time weighted 0.35 A

HCM Pedestrian Level of Service Model for Arterial Roadways
Table 6 Highway‐Path‐Highway Example Pedestrian LOS
Method Numerical Value Letter Grade
HCM 2.60 C
Linear time weighted 1.21 A
Squared time weighted 2.26 B
Cubic time weighted 3.11 C
Figure 3 Highway-Path-Highway LOS Exponents
In this second example, the linear time-weighted average does not seem to adequately represent the impact of the degradation of having to spend nearly 20% of the trip time on a very bad roadway. Either the squared time-weighted method or cubic time-weighted method might be considered to reasonably represent the overall PLOS for the walk. In a similar thought experiment for the BLOS project, of those who reviewed these plots that had strong opinions, the cubic function was seen to be more representative of their perceptions.
Applying the same process to the sample roadway of Table 2, and applying the RCDF to each link, yields the following results:

HCM Pedestrian Level of Service Model for Arterial Roadways
Table 7 Example Using Table 2 Roadway
LOS Scores Time of Exposure
link Intersection Link Intersection
Section 1 4.31 9.00 1173 43
Section 2 2.78 5.68 587 53
Section 3 2.37 3.60 293 83
Section 4 1.89 2.33 156 68
Section 5 2.11 2.14 111 33
Figure 4
Table 8 Initial Sample Roadway
Method Numerical Value Letter Grade
HCM 4.70 D
Linear time weighted 3.51 C
Squared time weighted 3.67 C
Cubic time weighted 3.85 C

HCM Pedestrian Level of Service Model for Arterial Roadways
Charts similar to those shown above were developed for 19 of the roadways evaluated during the NCHRP 3-70 Phase III effort and are provided in Appendix 1. For nine of the evaluate roadways (47%), the HCM model produces LOS scores that are outside the range of those represented by the links on the roadways. This strongly suggests the HCM model needs revision.
With regard to the appropriate exponent to use for the model, in many of the examples the squared and cubic time-weighted averages provide vary similar results. A summary of the changes in LOS resulting from the squared and cubic functions is provided in Table 9. The first two lines represent the thought experiment examples conducted above. Grey shaded cells represent where the different exponent results in a change in overall pedestrian LOS.
Table 9 – Summary Table of Sensitivity to Square and Cubic Functions Roadway Linear
Weighting Squared
WeightingDifference to
Linear Cubic
Weighting Difference to Squared (to
Linear) Lane-Path-Lane 0.21 0.27 0.06 0.35 0.08 (0.14) Hwy-Path-Hwy 1.21 2.26 1.05 3.11 0.85 (1.19) Sample Rd 3.51 3.67 0.16 3.85 0.18 (0.32) 17th ATL 1.84 1.84 0 1.85 0.01 (0.01) Buford ATL 5.81 5.84 0.03 5.87 0.03 (0.06) Bullsboro ATL 6.08 6.14 0.06 6.19 0.05 (0.11) Cobb ATL 6.00 6.03 0.03 6.06 0.03 (0.06) Guadalupe AUS 4.38 4.40 0.02 4.42 0.02 (0.04) Manchaca AUS 4.71 4.73 0.02 4.74 0.01 (0.03) Manor AUS 3.65 3.71 0.06 3.77 0.06 (0.12) Basse SA 5.40 5.47 0.07 5.54 0.07 (0.14) Broadway SA 3.34 3.39 0.05 3.43 0.04 (0.09) San Pedro SA 5.22 5.25 0.03 5.27 0.02 (0.05) Zarzamora SA 4.17 4.22 0.05 4.27 0.05 (0.10) Appleyard TAL 3.18 3.19 0.01 3.20 0.01 (0.02) Capital Cr TAL 2.83 2.85 0.02 2.87 0.02 (0.04) Macomb TAL 2.95 2.96 0.01 2.98 0.02 (0.03) Tennessee TAL 3.35 3.36 0.02 3.36 0.02 (0.02) Himes TAM 4.80 4.82 0.02 4.84 0.02 (0.04) Kennedy TAM 3.36 3.40 0.04 3.44 0.04 (0.08) Nebraska TAM 5.08 5.09 0.01 5.11 0.02 (0.03) US 41 TAM 5.91 5.98 0.07 6.05 0.07 (0.14)
Intuitively it seems that a bad link should be able to shift the LOS of the roadway by at least a letter grade. The cubic function does accomplish this. On five of the sections (26%) the cubic function results in a change in LOS numerical score of greater than 0.10. This seems reasonable given the score spread and time distribution shown in the appendix figures. Consequently, a cube exponent is recommended. This is also consistent with the recommended bicycle LOS model.
HCM Pedestrian Level of Service Model for Arterial Roadways
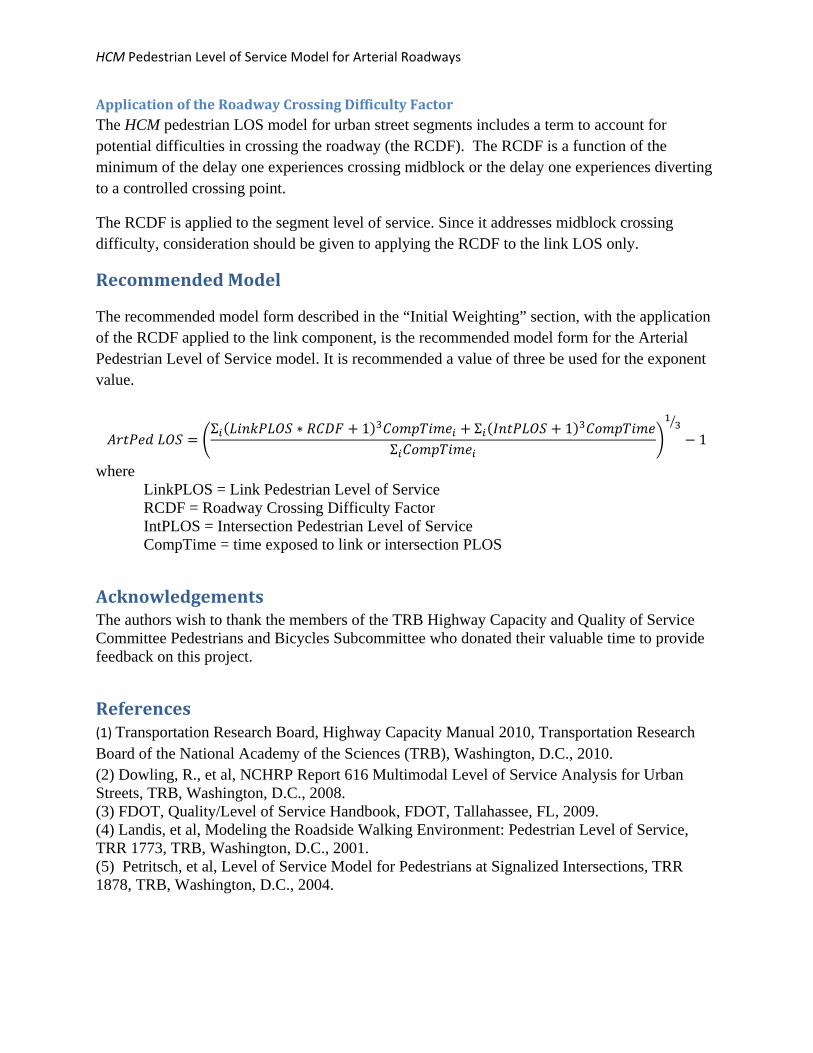
ApplicationoftheRoadwayCrossingDifficultyFactorThe HCM pedestrian LOS model for urban street segments includes a term to account for potential difficulties in crossing the roadway (the RCDF). The RCDF is a function of the minimum of the delay one experiences crossing midblock or the delay one experiences diverting to a controlled crossing point.
The RCDF is applied to the segment level of service. Since it addresses midblock crossing difficulty, consideration should be given to applying the RCDF to the link LOS only.
RecommendedModel
The recommended model form described in the “Initial Weighting” section, with the application of the RCDF applied to the link component, is the recommended model form for the Arterial Pedestrian Level of Service model. It is recommended a value of three be used for the exponent value.
Σ ∗ 1 Σ 1
Σ1
where LinkPLOS = Link Pedestrian Level of Service RCDF = Roadway Crossing Difficulty Factor IntPLOS = Intersection Pedestrian Level of Service CompTime = time exposed to link or intersection PLOS
AcknowledgementsThe authors wish to thank the members of the TRB Highway Capacity and Quality of Service Committee Pedestrians and Bicycles Subcommittee who donated their valuable time to provide feedback on this project.
References(1) Transportation Research Board, Highway Capacity Manual 2010, Transportation Research Board of the National Academy of the Sciences (TRB), Washington, D.C., 2010. (2) Dowling, R., et al, NCHRP Report 616 Multimodal Level of Service Analysis for Urban Streets, TRB, Washington, D.C., 2008. (3) FDOT, Quality/Level of Service Handbook, FDOT, Tallahassee, FL, 2009. (4) Landis, et al, Modeling the Roadside Walking Environment: Pedestrian Level of Service, TRR 1773, TRB, Washington, D.C., 2001. (5) Petritsch, et al, Level of Service Model for Pedestrians at Signalized Intersections, TRR 1878, TRB, Washington, D.C., 2004.

HCM Pedestrian Level of Service Model for Arterial Roadways

HCM Pedestrian Level of Service Model for Arterial Roadways 17 of 36 Appendix 1 Sensitivity Analyses for Time‐Based Exponential Methodology
Appendix1SensitivityAnalysisforLOS‐BasedExponentialMethodology
This appendix presents summaries of the 19 roadways evaluated as part of the NCHRP 3-70 Phase II evaluation. For each section there following are provided:
a tabular summary of the link and intersection conditions The actual link and intersection Ped LOS along the roadways The calculated roadway Ped LOS using five different methods
o HCM o Linear Weighted Average o Ped LOS Squared Weighted Average o Ped LOS Cubed Weighted Average
a graphic representation of the overall roadway characteristics and the five LOS values represented.

HCM Pedestrian Level of Service Model for Arterial Roadways 18 of 36 Appendix 1 Sensitivity Analyses for Time‐Based Exponential Methodology
Atlanta 17th Street
LOS Scores Time of Exposure
link Intersection Link Intersection
Section 1 1.89 1.91 730 162
Section 2 1.82 2.09 1210 269
Section 3 1.58 1.98 680 151
Section 4 1.78 2.30 730 162
Section 5 1.94 3.27 1100 244
Resulting ArtPed LOS
HCM 3.13
Linear 1.84
Squared 1.84
Cubed 1.85

HCM Pedestrian Level of Service Model for Arterial Roadways 19 of 36 Appendix 1 Sensitivity Analyses for Time‐Based Exponential Methodology
Atlanta Buford
LOS Scores Time of Exposure
link Intersection Link Intersection
Section 1 6.10 2.15 518 14
Section 2 4.75 2.04 189 9
Section 3 6.09 2.41 569 12
Section 4 6.17 2.40 396 7
Section 5 5.80 3.86 611 47
Resulting ArtPed LOS
HCM 4.52
Linear 5.81
Squared 5.84
Cubed 5.87

HCM Pedestrian Level of Service Model for Arterial Roadways 20 of 36 Appendix 1 Sensitivity Analyses for Time‐Based Exponential Methodology
Atlanta Bullsboro
LOS Scores Time of Exposure
link Intersection Link Intersection
Section 1 6.04 4.33 518 57
Section 2 6.43 2.61 189 12
Section 3 7.05 2.80 569 33
Section 4 6.19 2.49 396 55
Section 5 5.91 2.76 611 29
Resulting ArtPed LOS
HCM 4.74
Linear 6.08
Squared 6.14
Cubed 6.19

HCM Pedestrian Level of Service Model for Arterial Roadways 21 of 36 Appendix 1 Sensitivity Analyses for Time‐Based Exponential Methodology
Atlanta Cobb
LOS Scores Time of Exposure
link Intersection Link Intersection
Section 1 6.10 2.06 349 10
Section 2 4.70 5.50 251 19
Section 3 6.61 2.63 207 20
Section 4 6.45 6.66 704 29
Section 5 6.00 3.96 847 29
Resulting ArtPed LOS
HCM 5.01
Linear 6.00
Squared 6.03
Cubed 6.06

HCM Pedestrian Level of Service Model for Arterial Roadways 22 of 36 Appendix 1 Sensitivity Analyses for Time‐Based Exponential Methodology
Austin Guadalupe
LOS Scores Time of Exposure
link Intersection Link Intersection
Section 1 4.32 5.12 150 11
Section 2 4.21 2.74 86 4
Section 3 3.49 1.78 58 0
Section 4 4.44 3.23 127 13
Section 5 4.97 3.79 155 13
Resulting ArtPed LOS
HCM 4.26
Linear 4.38
Squared 4.40
Cubed 4.42

HCM Pedestrian Level of Service Model for Arterial Roadways 23 of 36 Appendix 1 Sensitivity Analyses for Time‐Based Exponential Methodology
Austin Manchaca
LOS Scores Time of Exposure
link Intersection Link Intersection
Section 1 4.89 4.17 736 5
Section 2 4.52 1.98 483 7
Section 3 4.02 2.39 230 9
Section 4 4.92 2.43 436 13
Section 5 5.41 5.95 115 7
Resulting ArtPed LOS
HCM 4.22
Linear 4.71
Squared 4.73
Cubed 4.74

HCM Pedestrian Level of Service Model for Arterial Roadways 24 of 36 Appendix 1 Sensitivity Analyses for Time‐Based Exponential Methodology
Austin Manor
LOS Scores Time of Exposure
link Intersection Link Intersection
Section 1 3.24 4.91 820 2
Section 2 3.28 2.64 364 48
Section 3 3.03 2.42 216 4
Section 4 3.24 2.28 127 1
Section 5 4.78 2.39 644 10
Resulting ArtPed LOS
HCM 3.60
Linear 3.65
Squared 3.71
Cubed 3.77

HCM Pedestrian Level of Service Model for Arterial Roadways 25 of 36 Appendix 1 Sensitivity Analyses for Time‐Based Exponential Methodology
San Antonio Basse
LOS Scores Time of Exposure
link Intersection Link Intersection
Section 1 4.82 4.53 602 53
Section 2 6.51 3.96 533 46
Section 3 5.92 2.55 793 32
Section 4 4.30 2.29 136 19
Section 5 4.48 1.95 178 27
Resulting ArtPed LOS
HCM 4.58
Linear 5.40
Squared 5.47
Cubed 5.54

HCM Pedestrian Level of Service Model for Arterial Roadways 26 of 36 Appendix 1 Sensitivity Analyses for Time‐Based Exponential Methodology
San Antonio Broadway
LOS Scores Time of Exposure
link Intersection Link Intersection
Section 1 2.63 1.78 260 0
Section 2 2.98 1.91 373 28
Section 3 3.88 2.75 249 15
Section 4 4.17 2.14 80 13
Section 5 4.12 2.77 251 29
Resulting ArtPed LOS
HCM 3.60
Linear 3.34
Squared 3.39
Cubed 3.43

HCM Pedestrian Level of Service Model for Arterial Roadways 27 of 36 Appendix 1 Sensitivity Analyses for Time‐Based Exponential Methodology
San Antonio San Pedro
LOS Scores Time of Exposure
link Intersection Link Intersection
Section 1 4.98 1.87 84 10
Section 2 4.97 1.78 169 0
Section 3 5.21 2.70 169 18
Section 4 5.48 2.53 302 11
Section 5 5.56 2.30 316 6
Resulting ArtPed LOS
HCM 4.23
Linear 5.22
Squared 5.25
Cubed 5.27

HCM Pedestrian Level of Service Model for Arterial Roadways 28 of 36 Appendix 1 Sensitivity Analyses for Time‐Based Exponential Methodology
San Antonio Zarzamora
LOS Scores Time of Exposure
link Intersection Link Intersection
Section 1 4.59 1.78 211 0
Section 2 4.78 1.78 469 0
Section 3 5.69 2.37 67 32
Section 4 4.22 2.27 520 14
Section 5 3.36 2.36 427 43
Resulting ArtPed LOS
HCM 3.84
Linear 4.17
Squared 4.22
Cubed 4.27

HCM Pedestrian Level of Service Model for Arterial Roadways 29 of 36 Appendix 1 Sensitivity Analyses for Time‐Based Exponential Methodology
Tallahassee Appleyard
LOS Scores Time of Exposure
link Intersection Link Intersection
Section 1 3.31 2.19 501 43
Section 2 3.14 4.29 424 53
Section 3 2.99 3.62 566 83
Section 4
Section 5
Resulting ArtPed LOS
HCM 3.34
Linear 3.18
Squared 3.19
Cubed 3.20
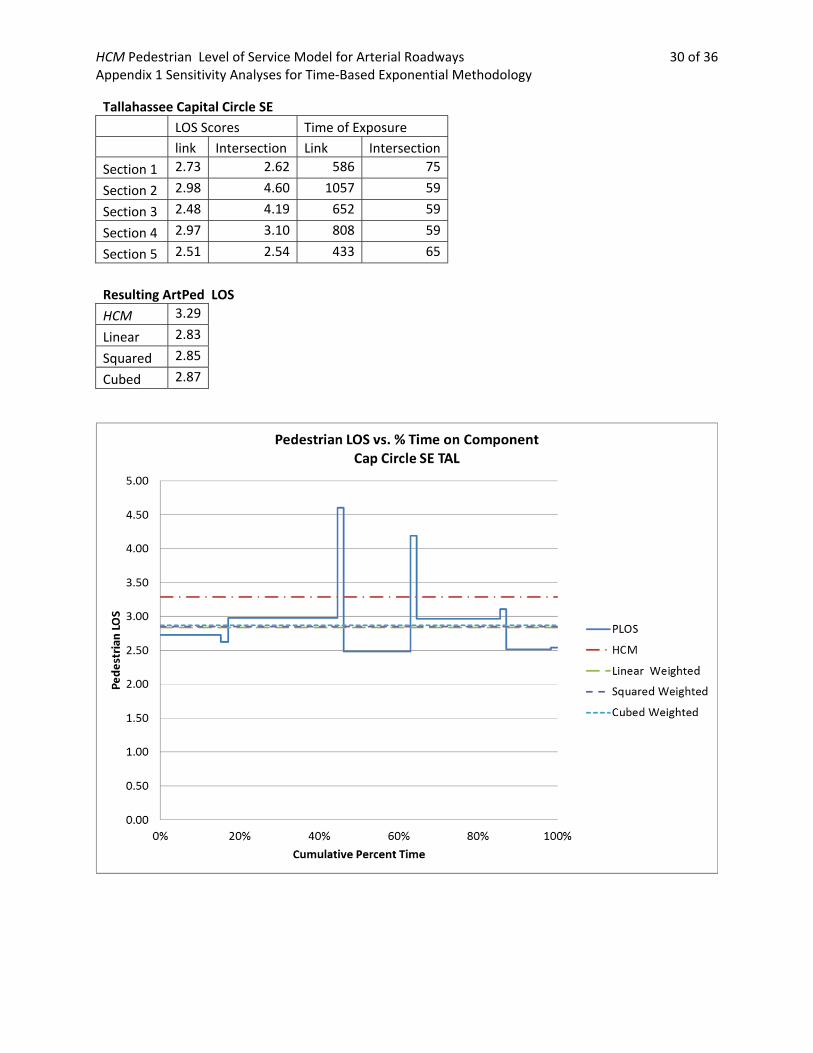
HCM Pedestrian Level of Service Model for Arterial Roadways 30 of 36 Appendix 1 Sensitivity Analyses for Time‐Based Exponential Methodology
Tallahassee Capital Circle SE
LOS Scores Time of Exposure
link Intersection Link Intersection
Section 1 2.73 2.62 586 75
Section 2 2.98 4.60 1057 59
Section 3 2.48 4.19 652 59
Section 4 2.97 3.10 808 59
Section 5 2.51 2.54 433 65
Resulting ArtPed LOS
HCM 3.29
Linear 2.83
Squared 2.85
Cubed 2.87

HCM Pedestrian Level of Service Model for Arterial Roadways 31 of 36 Appendix 1 Sensitivity Analyses for Time‐Based Exponential Methodology
Tallahassee Macomb
LOS Scores Time of Exposure
link Intersection Link Intersection
Section 1 3.19 2.21 83 20
Section 2 3.15 2.07 151 16
Section 3 2.92 2.24 79 17
Section 4 3.19 2.28 89 16
Section 5 2.87 2.69 93 30
Resulting ArtPed LOS
HCM 3.08
Linear 2.95
Squared 2.96
Cubed 2.98

HCM Pedestrian Level of Service Model for Arterial Roadways 32 of 36 Appendix 1 Sensitivity Analyses for Time‐Based Exponential Methodology
Tennessee TAL
LOS Scores Time of Exposure
link Intersection Link Intersection
Section 1 3.47 2.73 316 21
Section 2 3.40 2.52 220 17
Section 3 3.26 3.13 164 35
Section 4 3.42 2.15 198 10
Section 5 3.20 3.82 91 30
Resulting ArtPed LOS
HCM 3.28
Linear 3.35
Squared 3.36
Cubed 3.36

HCM Pedestrian Level of Service Model for Arterial Roadways 33 of 36 Appendix 1 Sensitivity Analyses for Time‐Based Exponential Methodology
Tampa Himes
LOS Scores Time of Exposure
link Intersection Link Intersection
Section 1 4.30 3.41 889 16
Section 2 5.02 5.58 1471 53
Section 3 5.76 2.10 289 12
Section 4 4.45 5.85 582 55
Section 5
Resulting ArtPed LOS
HCM 4.16
Linear 4.80
Squared 4.82
Cubed 4.84

HCM Pedestrian Level of Service Model for Arterial Roadways 34 of 36 Appendix 1 Sensitivity Analyses for Time‐Based Exponential Methodology
Tampa Kennedy
LOS Scores Time of Exposure
link Intersection Link Intersection
Section 1 3.95 2.38 64 20
Section 2 3.69 2.34 64 20
Section 3 3.58 2.04 64 30
Section 4 3.50 3.24 64 30
Section 5 3.74 2.00 64 17
Resulting ArtPed LOS
HCM 3.73
Linear 3.36
Squared 3.40
Cubed 3.44
HCM Pedestrian Level of Service Model for Arterial Roadways 35 of 36 Appendix 1 Sensitivity Analyses for Time‐Based Exponential Methodology
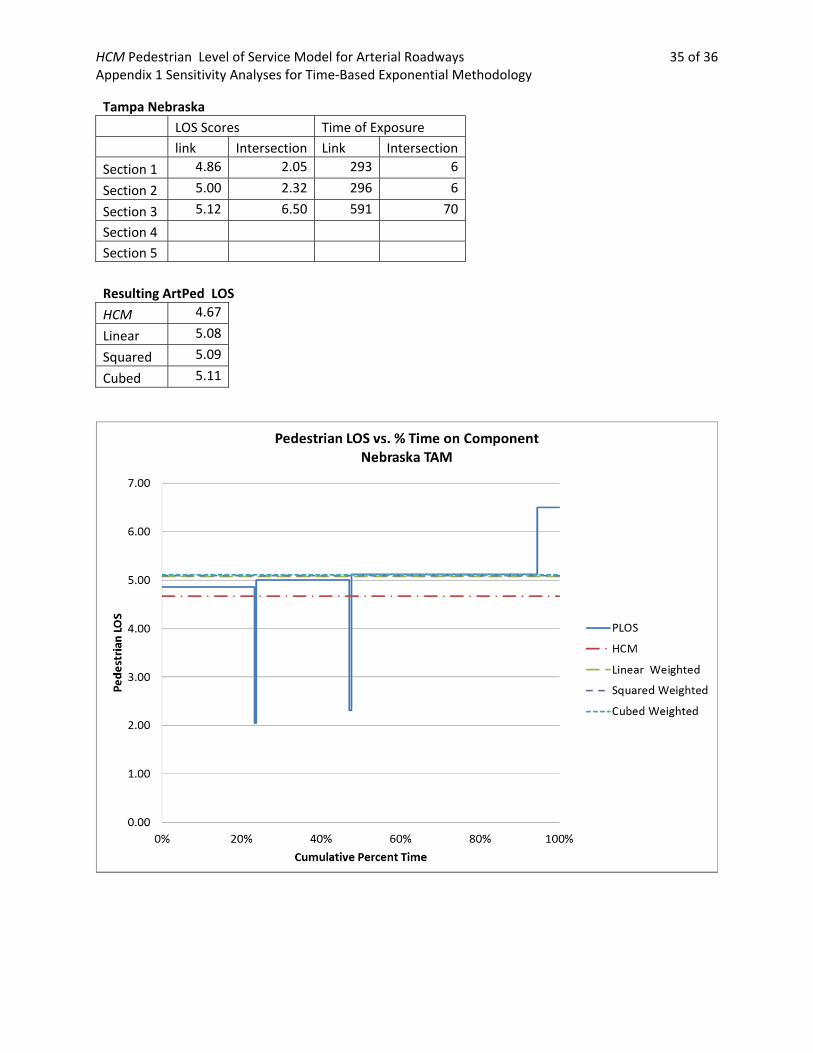
Tampa Nebraska
LOS Scores Time of Exposure
link Intersection Link Intersection
Section 1 4.86 2.05 293 6
Section 2 5.00 2.32 296 6
Section 3 5.12 6.50 591 70
Section 4
Section 5
Resulting ArtPed LOS
HCM 4.67
Linear 5.08
Squared 5.09
Cubed 5.11

HCM Pedestrian Level of Service Model for Arterial Roadways 36 of 36 Appendix 1 Sensitivity Analyses for Time‐Based Exponential Methodology
Tampa US 41
LOS Scores Time of Exposure
link Intersection Link Intersection
Section 1 7.15 1.82 1551 3
Section 2 5.80 2.92 553 0
Section 3 5.34 2.10 429 38
Section 4 5.21 1.93 267 38
Section 5 5.25 3.11 1718 0
Resulting ArtPed LOS
HCM 4.48
Linear 5.91
Squared 5.98
Cubed 6.05